Exhibit 99.1

Popular, Inc. Announces First Quarter 2025 Financial Results
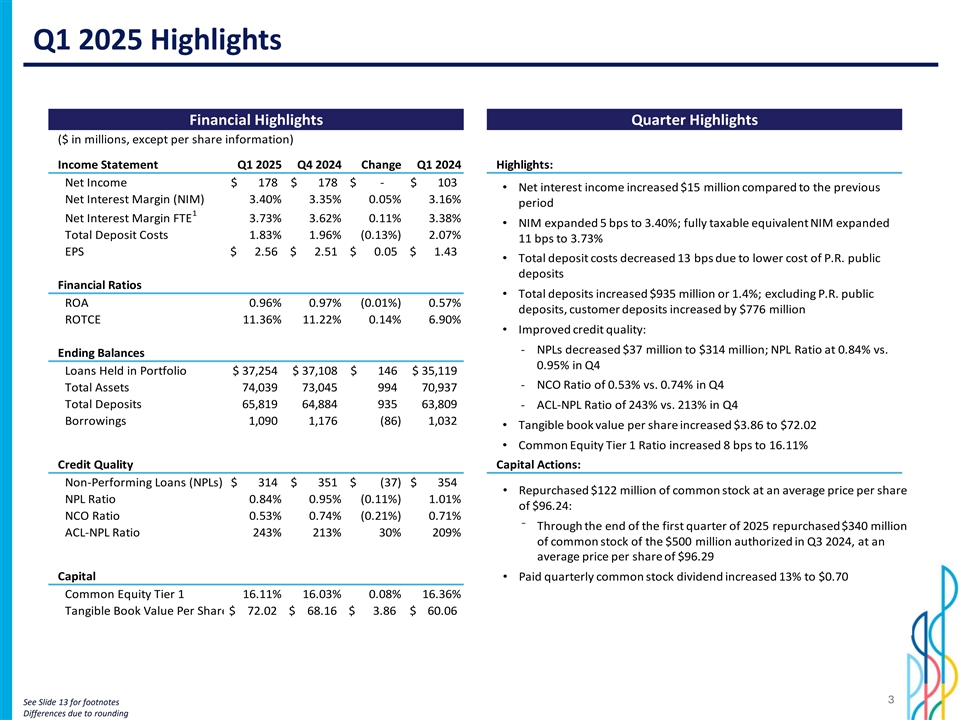
| • | Net income of $177.5 million in Q1 2025, compared to net income of $177.8 million in Q4 2024. |
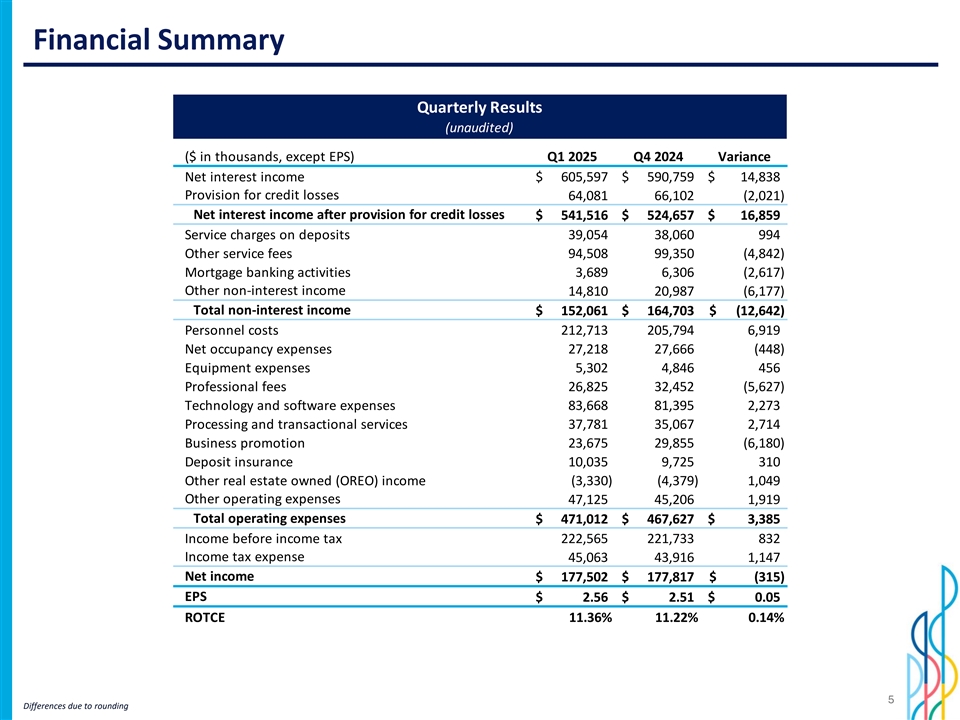
| • | Net interest income of $605.6 million in Q1 2025, an increase of $14.8 million when compared to Q4 2024. |
| • | EPS of $2.56 in Q1 2025 vs. $2.51 in Q4 2024. |
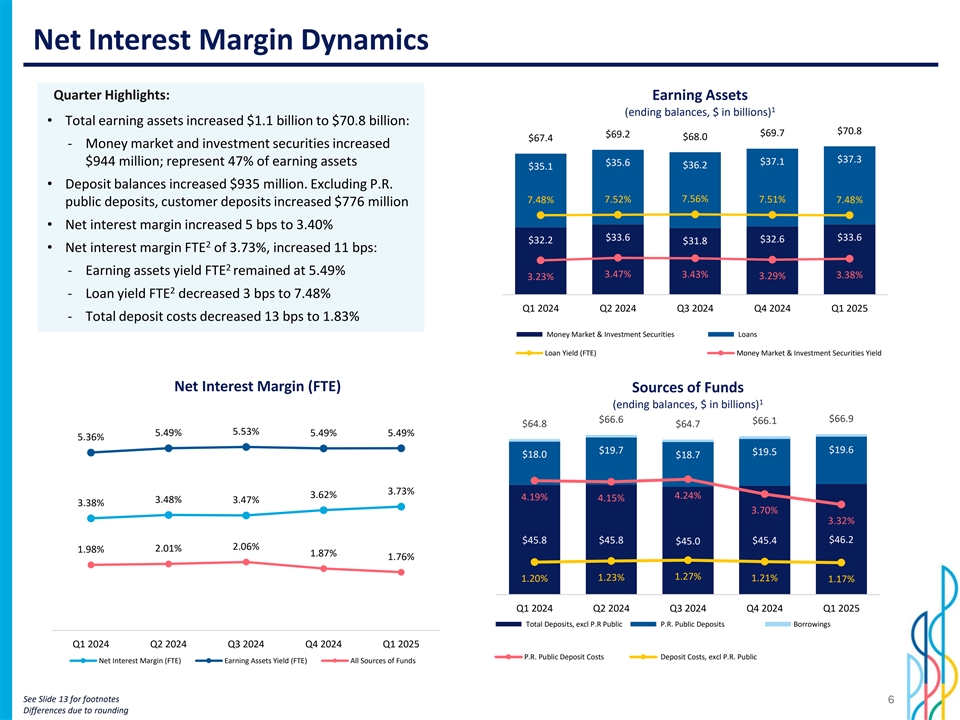
| • | Net interest margin of 3.40% in Q1 2025, compared to 3.35% in Q4 2024; net interest margin on a taxable equivalent basis of 3.73% in Q1 2025, compared to 3.62% in Q4 2024. |
| • | Non-interest income of $152.1 million in Q1 2025, compared to $164.7 million in Q4 2024. |
| • | Operating expenses amounted to $471.0 million, compared to $467.6 million in Q4 2024. |
| • | Credit quality metrics improved: |
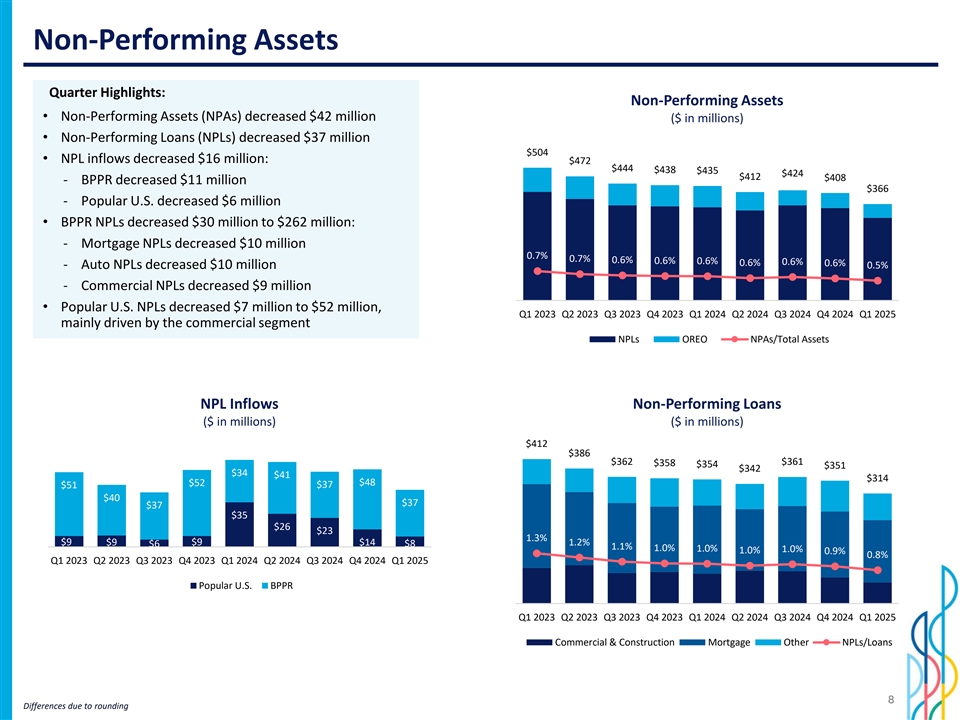
| • | Non-performing loans held-in-portfolio (“NPLs”) decreased by $36.7 million from Q4 2024; NPLs to loans ratio decreased eleven basis points to 0.84%; |
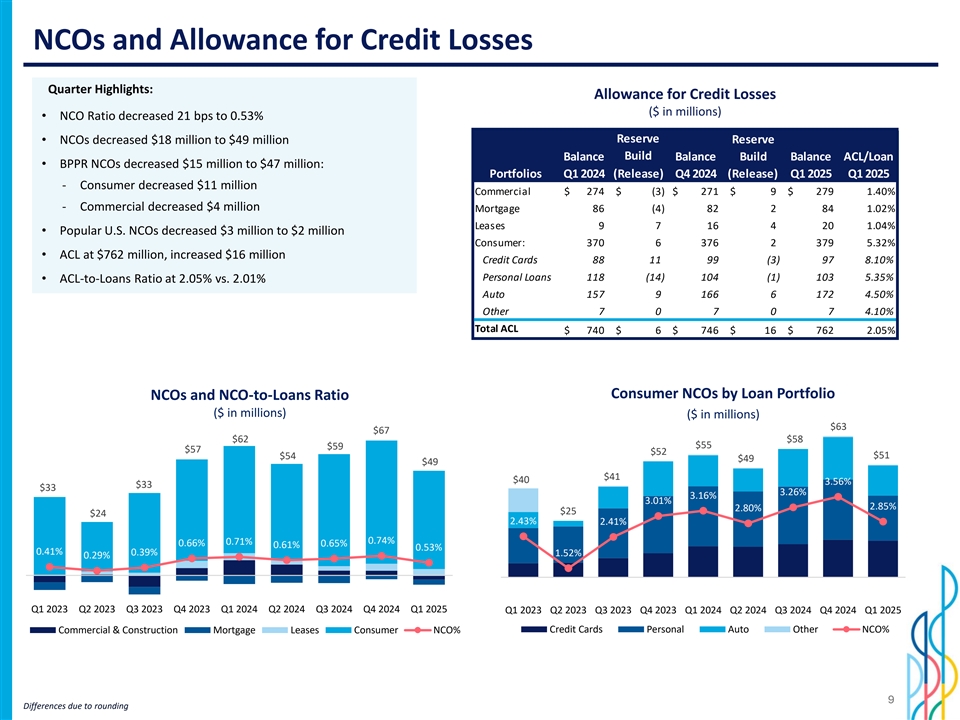
| • | Net charge-offs decreased by $18.3 million from Q4 2024; annualized NCOs to average loans held-in-portfolio at 0.53% vs. 0.74% in Q4 2024. |
| • | Allowance for credit losses (“ACL”) to loans held-in-portfolio at 2.05% vs. 2.01% in Q4 2024; and |
| • | ACL to NPLs at 242.7% vs. 212.7% in Q4 2024. |
| • | Money market and investment securities increased by $944.3 million from Q4 2024; average quarterly balances increased by $1.2 billion. |
| • | Loans held in portfolio, excluding loans held-for-sale, amounted to $37.3 billion, up $146.4 million from Q4 2024; average quarterly loan balances higher by $445.6 million. |
| • | Deposit balances amounted to $65.8 billion, an increase of $934.9 million from Q4 2024; average quarterly deposits higher by $1.6 billion. |
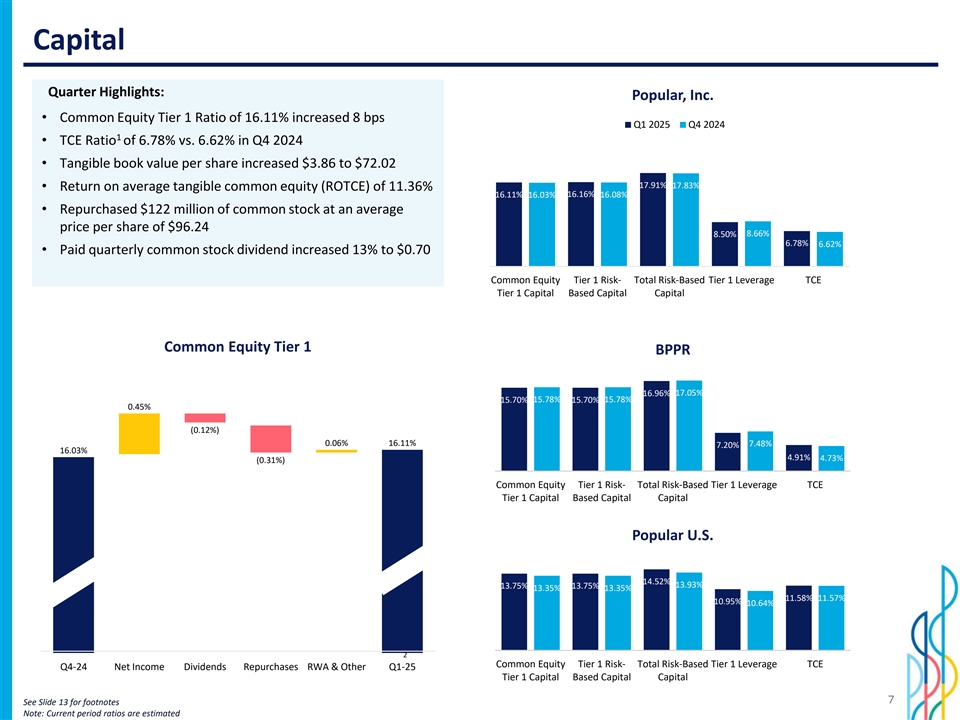
| • | Common Equity Tier 1 ratio of 16.11%, Common Equity per share of $83.75 and Tangible Book Value per share of $72.02 at March 31, 2025, an increase of $3.86 per share from Q4 2024. |
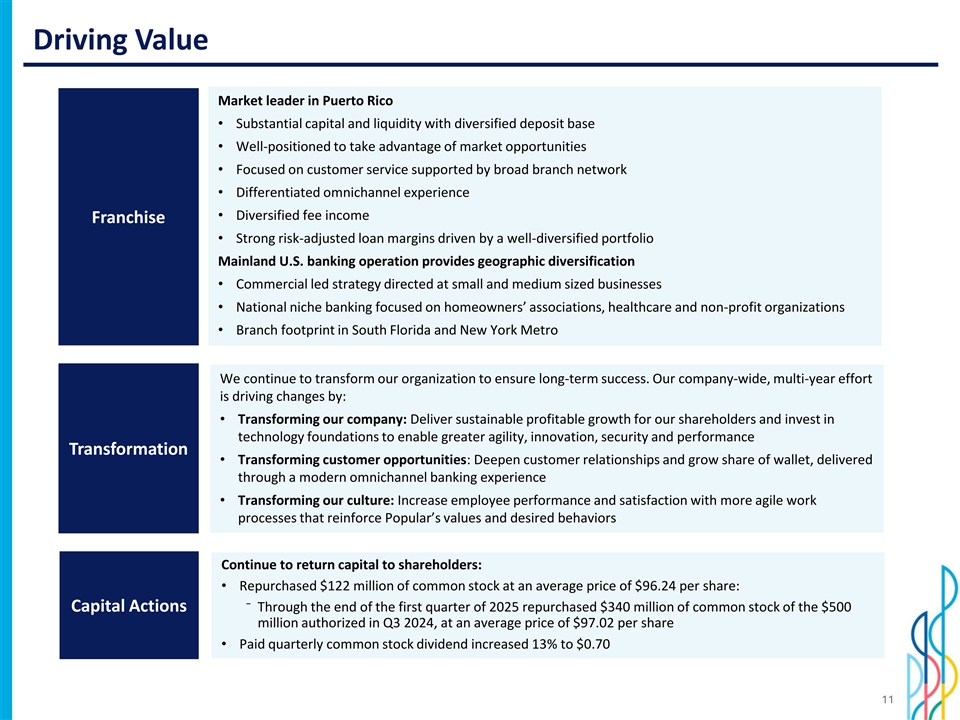
| • | Capital actions during Q1 2025 included the repurchase of 1,270,569 shares of common stock for $122.3 million, at an average price of $96.24 per share. As of March 31, 2025, a total of $339.6 million has been repurchased under a common stock repurchase authorization of up to $500 million announced in Q3 2024. |
SAN JUAN, Puerto Rico – (BUSINESS WIRE) – Popular, Inc. (the “Corporation,” “Popular,” “we,” “us,” “our”) (NASDAQ:BPOP) reported net income of $177.5 million for the quarter ended March 31, 2025, compared to net income of $177.8 million for the quarter ended December 31, 2024.
Ignacio Alvarez, Chief Executive Officer, said: “I am pleased with our strong financial performance in the first quarter. We increased net interest income, grew loans and deposits, maintained strong credit metrics and expanded our customer base. I am particularly pleased with our deposit growth. In Puerto Rico, excluding public deposits, deposits increased by $434 million, demonstrating the strength of our unique retail franchise. We also continued to invest in our people, technology and processes as part of our ongoing Transformation effort. The operating environment has undoubtedly become more uncertain and volatile, but our strong capital and liquidity levels, together with our diversified business model, position us well to perform in a variety of macroeconomic scenarios.
As I step away from the CEO role on June 30, I want to express my sincere gratitude to our employees for all their hard work and support during my tenure. It has been an honor and a privilege to serve as CEO these last eight years. I also wish Javier success in his new role, for which he is more than ready. I am confident that Javier and the team will take Popular to even greater heights.”
1
| Earnings Highlights | ||||||||||||
| (Unaudited) |
Quarters ended | |||||||||||
| (Dollars in thousands, except per share information) |
31-Mar-25 | 31-Dec-24 | 31-Mar-24 | |||||||||
| Net interest income |
$ | 605,597 | $ | 590,759 | $ | 550,744 | ||||||
| Provision for credit losses |
64,081 | 66,102 | 72,598 | |||||||||
|
|
|
|
|
|
|
|||||||
| Net interest income after provision for credit losses |
541,516 | 524,657 | 478,146 | |||||||||
| Other non-interest income |
152,061 | 164,703 | 163,818 | |||||||||
| Operating expenses |
471,012 | 467,627 | 483,113 | |||||||||
|
|
|
|
|
|
|
|||||||
| Income before income tax |
222,565 | 221,733 | 158,851 | |||||||||
| Income tax expense |
45,063 | 43,916 | 55,568 | |||||||||
|
|
|
|
|
|
|
|||||||
| Net income |
$ | 177,502 | $ | 177,817 | $ | 103,283 | ||||||
|
|
|
|
|
|
|
|||||||
| Net income applicable to common stock |
$ | 177,149 | $ | 177,464 | $ | 102,930 | ||||||
|
|
|
|
|
|
|
|||||||
| Net income per common share - basic |
$ | 2.56 | $ | 2.51 | $ | 1.43 | ||||||
|
|
|
|
|
|
|
|||||||
| Net income per common share - diluted |
$ | 2.56 | $ | 2.51 | $ | 1.43 | ||||||
|
|
|
|
|
|
|
|||||||
Non-GAAP Financial Measures
This press release contains financial information prepared under accounting principles generally accepted in the United States (“U.S. GAAP”) and non-GAAP financial measures. Management uses non-GAAP financial measures when it has determined that these measures provide more meaningful information about the underlying performance of the Corporation’s ongoing operations. Non-GAAP financial measures used by the Corporation may not be comparable to similarly named non-GAAP financial measures used by other companies.
Net interest income on a taxable equivalent basis
Net interest income, on a taxable equivalent basis, is presented with its different components in Tables D and E for the quarter ended March 31, 2025. Net interest income on a taxable equivalent basis is a non-GAAP financial measure. Management believes that this presentation provides meaningful information since it facilitates the comparison of revenues arising from taxable and tax-exempt sources.
Tangible Common Equity
Tangible common equity, the tangible common equity ratio, tangible assets and tangible book value per common share are non-GAAP financial measures. The tangible common equity ratio and tangible book value per common share are commonly used by banks and analysts in conjunction with more traditional bank capital ratios to compare the capital adequacy of banking organizations with significant amounts of goodwill or other intangible assets, typically stemming from the use of the purchase accounting method for mergers and acquisitions. Neither tangible common equity nor tangible assets or related measures should be used in isolation or as a substitute for stockholders’ equity, total assets or any other measure calculated in accordance with GAAP.
Refer to Table R for a reconciliation of total stockholders’ equity to tangible common equity and total assets to tangible assets.
2
Net interest income and net interest income on a taxable equivalent basis (non-GAAP)
The Corporation’s net interest income for the first quarter of 2025 was $605.6 million, an increase of $14.8 million compared to $590.8 million in the previous quarter. The net interest margin for the quarter was 3.40%, compared to 3.35% in the fourth quarter of 2024, an increase of five basis points. Net interest income was negatively impacted by two fewer days when compared to the previous quarter resulting in lower net interest income by $9.3 million.
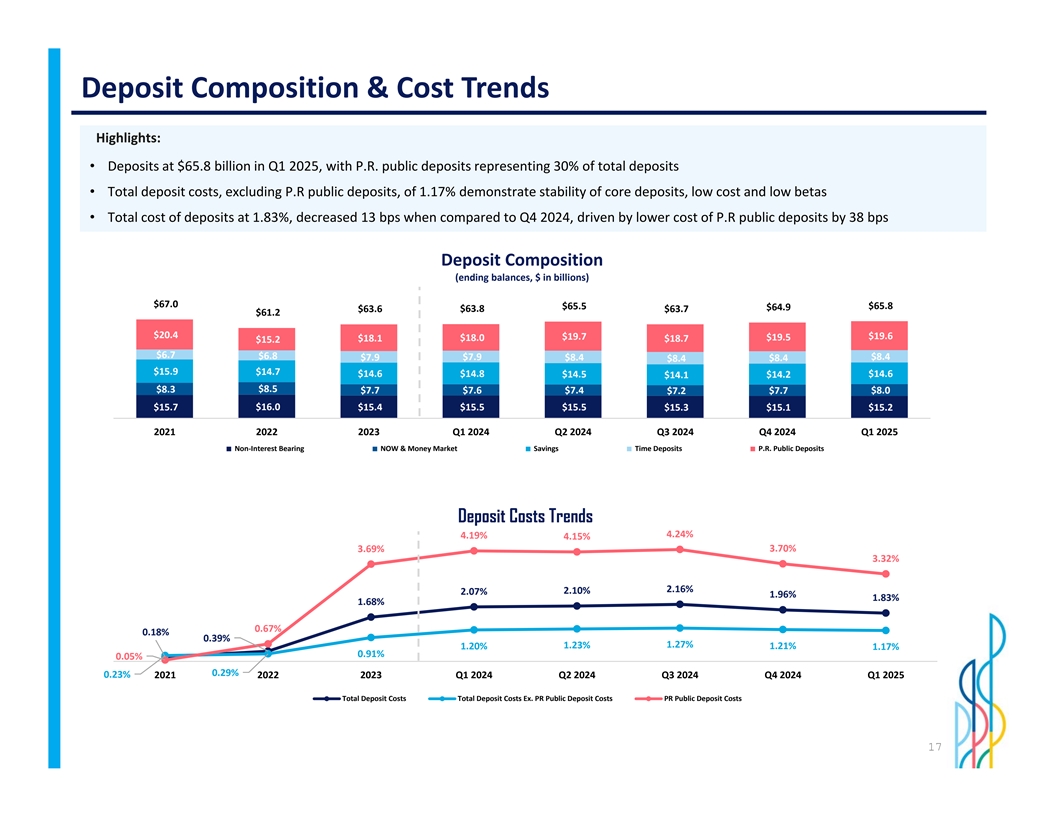
During the period, the Corporation’s re-investment of maturities of U.S Treasuries at higher rates and the re-pricing across most deposits products played a favorable role in the period’s net interest income. The average balance of total deposits increased by $1.6 billion in Q1 2025, driven primarily by a $2.0 billion increase in interest-bearing deposits. Market-linked P.R. public deposits average balance, which continues to be a significant driver of interest expense for the Corporation, increased by $981.5 million from Q4 2024. The quarter’s average deposit balances were also impacted by certain non-interest-bearing accounts that were migrated to an interest-bearing product targeting affluent client in the fourth quarter of 2024.
Net Interest Income and Net Interest Margin Taxable Equivalent (Non-GAAP)
Net interest income on a taxable equivalent basis for the first quarter of 2025 was $663.9 million, compared to $638.5 million in the previous quarter, an increase of $25.4 million. Net interest margin on a taxable equivalent basis for the first quarter of 2025 was 3.73%, an increase of 11 basis points.
The main drivers of net interest income on a taxable equivalent basis were:
| • | higher income from investment securities by $22.3 million or 22 basis points, due to higher reinvestment activity as balances increased by $1.4 billion at higher yields, driven in part by an increase in average deposit balances; and |
| • | lower interest expense on interest-bearing deposits by $17.8 million or 19 basis points, driven primarily by a reduction in the cost of market-linked P.R. public deposits by approximately 38 basis points and in PB by a reduction in the cost of online time deposits by approximately 26 basis points and brokered deposits by six basis points. Total cost of deposits decreased by 13 basis points, as average non-interest bearing demand deposits decreased by $352.1 million in part due to a shift to now accounts related to the launch, in the previous quarter, of a mass affluent-focused interest-bearing deposit product; |
partially offset by:
| • | lower interest income from money market investments by $9.1 million or 34 basis points, mainly due to a lower yield combined with a lower volume driven by higher reinvestment activity in investment securities and loan originations; and |
| • | lower interest income from loans by $5.5 million, or three basis points, mainly driven by lower yields in the commercial portfolio by 13 basis points, partially offset by higher average volume in certain portfolios such as the commercial and mortgage portfolios and higher yields in mortgage, auto and leasing portfolios. |
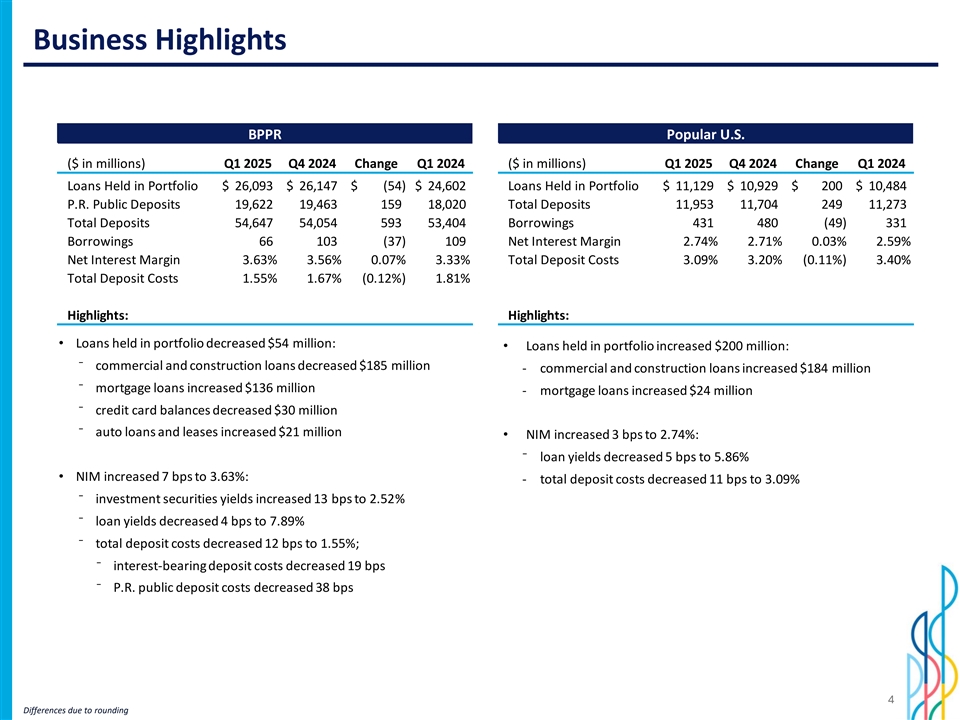
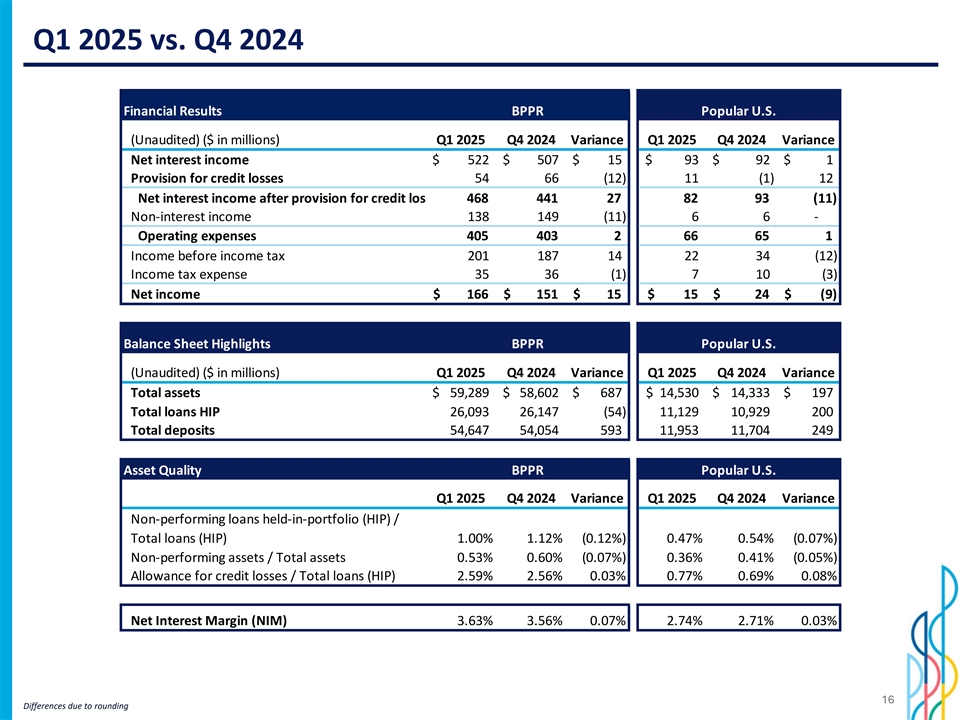
Net Interest Income and Net Interest Margin (Banco Popular de Puerto Rico Segment)
For the Banco Popular de Puerto Rico (“BPPR”) segment, net interest income for the first quarter of 2025 amounted to $521.9 million, an increase of $14.9 million from the previous quarter. Net interest margin increased by seven basis points to 3.63%. Higher income from investment securities, mainly from U.S Treasuries, compared to the previous quarter, along with lower cost of deposits, mainly driven by lower cost of P.R. public interest-bearing deposits, were the main contributors to the BPPR segment’s net interest margin expansion over the period.
Factors impacting net interest income for the BPPR segment include:
| • | higher interest income from investments in securities by $14.5 million or 13 basis points mainly due to higher reinvestment of U.S Treasury securities at higher yields; and |
3
| • | lower interest expense on deposit accounts by $14.4 million, mainly driven by a $13.3 million decrease in the cost of market-linked P.R. public interest-bearing deposits, representing a 38 basis points reduction. Interest-bearing deposit costs decreased 20 basis points to 2.06%, when compared to Q4 2024, while total deposit costs decreased by 12 basis points to 1.55%; |
partially offset by:
| • | lower interest income from the loan portfolios by $8.3 million or four basis points during the quarter resulting from lower yields in the commercial portfolio, offset in part by higher average volume in the mortgage and leasing portfolios; and |
| • | lower interest income from money market investments by $6.0 million or 32 basis points, mainly due to re-pricing of money market investments during the quarter. |
Net Interest Income and Net Interest Margin (Popular Bank Segment)
In the Popular Bank (“PB”, or “Popular U.S.”) segment, net interest income was $92.9 million, $0.8 million higher when compared to the previous quarter. Net interest margin increased by three basis points to 2.74%.
During the period, earning assets at PB increased by $172.9 million, mainly due to higher average balances in the loan portfolios of $367.7 million driven by growth in the commercial, construction and lease portfolios which offset the impact of the lower average balance of money market investments and investment securities by $194.8 million. In addition, total deposits in PB grew by $134.3 million, mainly driven by interest bearing deposits which grew by $184.7 million. The repricing of deposits in PB resulted in lower cost of interest-bearing deposits as further described below, mitigating the impact of the reduction in earning assets yields quarter over quarter.
Main variances in Popular U.S include:
| • | lower interest expense on deposit accounts by $4.2 million, or 15 basis points, driven by a decrease in deposit costs across most deposit products due to repricing at lower cost, partially offset by higher volume of higher-cost interest bearing deposits including online savings and money market deposits. Average deposit balances during the quarter were higher by $134.3 million. During the first quarter, total cost of interest-bearing deposits decreased 15 basis points to 3.48%, while total deposit costs decreased 11 basis points to 3.09%; and |
| • | higher income from loans by $1.1 million, mainly due to higher volumes in the commercial and construction loan portfolios. Notwithstanding higher income on loans, PB loan portfolio’s yield decreased five basis points to 5.86% when compared to the fourth quarter of 2024 driven by variable rate loans in the construction and commercial portfolios; |
partially offset by:
| • | lower interest income from money markets and investment securities by $4.1 million, or 22 basis points, mainly due to lower volume and the re-pricing of money market investments during the quarter. |
Refer to tables D and E for more details on the components of net interest income and net interest margin on a taxable equivalent basis.
4
Non-interest income
Non-interest income amounted to $152.1 million for the quarter ended March 31, 2025, a decrease of $12.6 million when compared to $164.7 million for the previous quarter. The variance in non-interest income was primarily due to:
| • | lower other operating income by $8.0 million, mainly due to lower daily car rental revenue by $3.3 million due to the sale completed by Popular Auto LLC, a wholly-owned subsidiary of Banco Popular de Puerto Rico, of its daily car rental business during the fourth quarter of 2024, lower income from investments accounted under the equity investment method by $2.2 million, and a $1.9 million sundry loss reserve release during the prior quarter; |
| • | lower other service fees by $4.8 million mainly due to lower contingent insurance commission by $1.5 million, which are typically received during the fourth quarter, and to lower investment management and trust fees by $0.9 million; and |
| • | lower income from mortgage banking activities by $2.6 million mainly due to an unfavorable variance in the fair value adjustment of mortgage servicing rights (“MSRs”) driven by portfolio runoff and slightly higher prepayment speed compared to the fourth quarter of 2024; |
partially offset by:
| • | lower losses from equity securities by $2.0 million mainly due to the valuation of securities held for deferred benefit plans, which have an offsetting effect in personnel costs. |
Refer to Table B for further details.
Operating expenses
Operating expenses for the first quarter of 2025 totaled $471.0 million, an increase of $3.4 million when compared to the fourth quarter of 2024. The variance in operating expenses was driven primarily by:
| • | higher personnel costs by $6.9 million mainly due to higher annual incentive awards of performance shares and restricted stock expenses by $8.8 million, higher payroll taxes by $3.9 million and higher other compensation expenses by $3.0 million, which traditionally are higher during the first quarter of the year; partially offset by lower salaries by $4.8 million in part due to two fewer days compared to the previous quarter and lower health insurance costs by $3.4 million; |
| • | higher processing and transactional services expenses by $2.7 million mainly due to higher credit card processing and transaction fees and higher merchant processing expenses; |
| • | higher technology and software expenses by $2.3 million mainly due to higher software amortization expenses; and |
| • | higher other operating expenses by $1.7 million mainly due to higher reserves for insurance claims; |
partially offset by:
| • | lower business promotion expenses by $6.2 million mainly due to lower seasonal donations, advertising and sponsorship expenses, which are typically higher in the fourth quarter of the year; and |
| • | lower professional fees by $5.6 million mainly due to lower consulting fees related to corporate initiatives and information and technology projects. |
Full-time equivalent employees were 9,274 as of March 31, 2025, compared to 9,231 as of December 31, 2024.
For a breakdown of operating expenses by category refer to Table B.
5
Income taxes
For the first quarter of 2025, the Corporation recorded an income tax expense of $45.1 million, compared to an income tax expense of $43.9 million for the previous quarter. Higher income tax expense of $1.2 million is mainly driven by higher income before tax at the BPPR segment, offset in part by higher exempt income.
The effective tax rate (“ETR”) for the first quarter of 2025 was 20.2%, compared to 19.8% for the previous quarter. The ETR of the Corporation is impacted by the composition and source of its taxable income.
Credit Quality
The Corporation’s credit quality metrics showed favorable trends in the first quarter of 2025 compared to the previous quarter, with improvements in NPLs and Net Charge Offs (“NCOs”). The Corporation continues to closely monitor the macroeconomic landscape and borrower performance, given the ongoing economic uncertainty. Management believes that the improvements over recent years in risk management practices and the overall risk profile of the Corporation’s loan portfolio position the Corporation to continue to operate successfully in the current environment.
The following presents credit quality results for the first quarter of 2025:
Non-Performing Loans and Net Charge Offs
Total NPLs decreased by $36.7 million compared to the previous quarter. Excluding consumer loans, inflows of NPLs held-in-the-portfolio decreased by $16.3 million in the first quarter of 2025. The ratio of NPLs to total loans held in the portfolio was 0.84% for the first quarter of 2025, compared to 0.95% for the previous quarter. The drivers of these changes were:
| • | In the BPPR segment, NPLs decreased by $30.1 million, mainly driven by lower auto, mortgage and commercial loans NPLs by $10.0 million, $9.9 million and $8.5 million, respectively. Commercial NPLs decreased, driven by a $9.0 million single loan pay-off during the first quarter of 2025. Excluding consumer loans, inflows to NPLs in the BPPR segment decreased by $10.6 million compared to the previous quarter, mostly related to lower mortgage inflows. |
| • | In the PB segment, NPLs decreased by $6.6 million driven by lower commercial loans NPLs by $6.1 million, mostly driven by a single loan sale of $3.9 million. Inflows to NPLs, excluding consumer loans, decreased by $5.7 million, driven by lower commercial inflows. |
Total NCOs of $49.1 million decreased by $18.3 million when compared to the fourth quarter of 2024. The Corporation’s ratio of annualized NCOs to average loans held-in-portfolio for the first quarter was 0.53%, compared to 0.74% in the fourth quarter of 2024.
The drivers of these changes were related to the following:
| • | In the BPPR segment, NCOs decreased by $15.5 million quarter-over-quarter, mainly driven by lower consumer NCOs by $10.9 million, coupled with lower commercial NCOs by $3.7 million, mainly in the commercial and industrial portfolio, due to a $3.8 million recovery related to the abovementioned commercial NPL. |
| • | In the PB segment, NCOs decreased by $2.8 million quarter-over-quarter, mainly due to lower consumer NCOs. |
Refer to Table N for further information on NCOs and related ratios.
Other Real Estate Owned Properties (“OREO”)
As of March 31, 2025, the Corporation’s OREO portfolio amounted to $52.1 million, a decrease of $5.2 million when compared to the fourth quarter of 2024. The decrease in OREO assets was driven by the sale of residential OREO properties in the BPPR segment.
Refer to Table L for additional information and related ratios.
6
Allowance for Credit Losses and Provision for Credit Losses
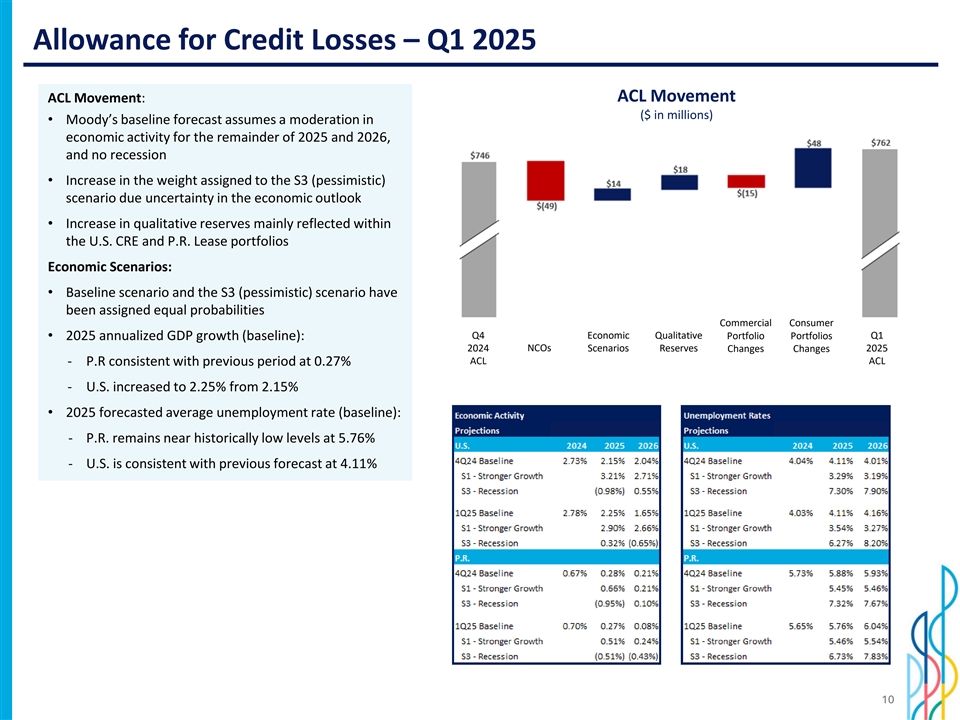
The ACL as of March 31, 2025 amounted to $762.1 million, an increase of $16.1 million when compared to the fourth quarter of 2024. The increase in ACL was driven by changes in the economic scenario probability weights coupled with increases in qualitative reserves, in response to the current economic environment uncertainty, offset by part by improvements in credit quality and lower volume. The Corporation leverages multiple scenarios to estimate its ACL. Prior to the first quarter of 2025, the Corporation assigned the baseline scenario the highest probability among the scenarios used to estimate the ACL, followed by the pessimistic scenario given the uncertainties in the economic outlook and downside risk, and the optimistic scenario had the lowest probability. During Q1 2025, the Corporation modified the weight assigned to the pessimistic scenario to be equal to the baseline scenario in response to the current economic uncertainty, resulting in an increase of $18.2 million in the reserves.
In the BPPR segment, the ACL increased by $5.6 million from the previous quarter. The increase in the probability weight of the pessimistic scenario resulted in a $11.3 million ACL increase. This increase in reserves was partially offset by improved credit quality in the commercial portfolios and reduced overall reserves for both the commercial and consumer portfolios mainly driven by lower volumes. In the PB segment, the ACL increased by $10.5 million from the previous quarter. The increase in probability weights resulted in a $6.9 million increase, mainly within the commercial portfolio, coupled with higher qualitative reserves for the Commercial Real Estate (“CRE”) portfolio in response to current market volatility and economic uncertainty.
The Corporation’s ratio of the ACL to loans held-in-portfolio was 2.05% in the first quarter of 2025, compared to 2.01% in the previous quarter. The ratio of the ACL to NPLs held-in-portfolio was 242.7%, compared to 212.7% in the previous quarter.
The provision for loan losses for the loan and lease portfolios for the first quarter of 2025 was $65.2 million, compared to $69.1 million in the previous quarter. The provision for loan losses for the BPPR segment amounted to $52.7 million, compared to $67.1 million in the previous quarter. This reduction was mainly driven by lower provision expense for consumer loans driven by lower NCOs and lower volumes. The provision for loan losses for the PB segment amounted to $12.5 million, compared to $2.0 million in the prior quarter related to the ACL changes described above.
The provision for loan losses for the loan and lease portfolios, along with the $1.3 million reserve release related to unfunded loan commitments and the $0.2 million provision for the Corporation’s investment portfolio for the first quarter of 2025, are consolidated and shown together under the provision for credit losses in our Consolidated Statement of Operations. For the first quarter, the provision for credit losses amounted to $64.1 million, compared to $66.1 million in the previous quarter.
Refer to Table L for break-out of non-performing assets and related ratios and to Table N for allowance for credit losses, net charge-offs and related ratios.
7
Non-Performing Assets
| (Unaudited) |
||||||||||||
| (In thousands) |
31-Mar-25 | 31-Dec-24 | 31-Mar-24 | |||||||||
| Non-performing loans held-in-portfolio |
$ | 314,069 | $ | 350,780 | $ | 354,127 | ||||||
| Other real estate owned |
52,114 | 57,268 | 80,542 | |||||||||
|
|
|
|
|
|
|
|||||||
| Total non-performing assets |
$ | 366,183 | $ | 408,048 | $ | 434,669 | ||||||
|
|
|
|
|
|
|
|||||||
| Net charge-offs for the quarter |
$ | 49,103 | $ | 67,433 | $ | 62,200 | ||||||
|
|
|
|
|
|
|
|||||||
| Ratios: |
||||||||||||
| Loans held-in-portfolio |
$ | 37,254,032 | $ | 37,107,652 | $ | 35,118,738 | ||||||
| Non-performing loans held-in-portfolio to loans held-in-portfolio |
0.84 | % | 0.95 | % | 1.01 | % | ||||||
| Allowance for credit losses to loans held-in-portfolio |
2.05 | 2.01 | 2.11 | |||||||||
| Allowance for credit losses to non-performing loans, excluding loans held-for-sale |
242.67 | 212.68 | 208.84 | |||||||||
Refer to Table L for additional information.
Provision for Credit Losses - Loan Portfolios
| (Unaudited) |
Quarters ended | |||||||||||
| (In thousands) |
31-Mar-25 | 31-Dec-24 | 31-Mar-24 | |||||||||
| Provision for credit losses - loan portfolios: |
||||||||||||
| BPPR |
$ | 52,690 | $ | 67,088 | $ | 61,008 | ||||||
| Popular U.S. |
12,528 | 2,041 | 11,378 | |||||||||
|
|
|
|
|
|
|
|||||||
| Total provision for credit losses - loan portfolios |
$ | 65,218 | $ | 69,129 | $ | 72,386 | ||||||
|
|
|
|
|
|
|
|||||||
Credit Quality by Segment
| (Unaudited) | ||||||||||||
| (Dollars in thousands) |
Quarters ended | |||||||||||
| BPPR |
31-Mar-25 | 31-Dec-24 | 31-Mar-24 | |||||||||
| Provision for credit losses - loan portfolios |
$ | 52,690 | $ | 67,088 | $ | 61,008 | ||||||
| Net charge-offs |
47,102 | 62,604 | 56,561 | |||||||||
| Total non-performing loans held-in-portfolio |
262,006 | 292,091 | 298,594 | |||||||||
| Annualized net charge-offs to average loans held-in-portfolio |
0.72 | % | 0.97 | % | 0.92 | % | ||||||
| Allowance / loans held-in-portfolio |
2.59 | % | 2.56 | % | 2.62 | % | ||||||
| Allowance / non-performing loans held-in-portfolio |
258.11 | % | 229.61 | % | 215.79 | % | ||||||
| Quarters ended | ||||||||||||
| Popular U.S. |
31-Mar-25 | 31-Dec-24 | 31-Mar-24 | |||||||||
| Provision for credit losses (benefit) - loan portfolios |
$ | 12,528 | $ | 2,041 | $ | 11,378 | ||||||
| Net charge-offs |
2,001 | 4,829 | 5,639 | |||||||||
| Total non-performing loans held-in-portfolio |
52,063 | 58,689 | 55,533 | |||||||||
| Annualized net charge-offs to average loans held-in-portfolio |
0.07 | % | 0.18 | % | 0.21 | % | ||||||
| Allowance / loans held-in-portfolio |
0.77 | % | 0.69 | % | 0.91 | % | ||||||
| Allowance / non-performing loans held-in-portfolio |
164.96 | % | 128.40 | % | 171.47 | % | ||||||
8
Financial Condition Highlights
| (Unaudited) |
||||||||||||
| (In thousands) |
31-Mar-25 | 31-Dec-24 | 31-Mar-24 | |||||||||
| Cash and money market investments |
$ | 6,575,193 | $ | 6,800,586 | $ | 6,249,064 | ||||||
| Investment securities |
27,375,396 | 26,244,977 | 26,324,139 | |||||||||
| Loans |
37,254,032 | 37,107,652 | 35,118,738 | |||||||||
| Total assets |
74,038,606 | 73,045,383 | 70,936,939 | |||||||||
| Deposits |
65,819,255 | 64,884,345 | 63,808,784 | |||||||||
| Borrowings |
1,090,417 | 1,176,126 | 1,032,393 | |||||||||
| Total liabilities |
68,238,911 | 67,432,317 | 65,759,625 | |||||||||
| Stockholders’ equity |
5,799,695 | 5,613,066 | 5,177,314 | |||||||||
Total assets amounted to $74.0 billion at March 31, 2025, an increase of $993.2 million from the fourth quarter of 2024, driven by:
| • | an increase in securities available-for-sale (“AFS”) of $1.2 billion, mainly due to an increase in investments in U.S. Treasury securities and a decrease in the unrealized losses of AFS securities of $169.0 million, partially offset by maturities and principal paydowns; and |
| • | an increase in loans held-in-portfolio by $146.4 million, driven by an increase of $200.8 million in the PB segment across most portfolios, particularly commercial and construction loans, partially offset by a decrease of $54.4 million in the BPPR segment, mainly in the commercial portfolio, driven by certain large relationship prepayments during the first quarter of 2025; |
partially offset by:
| • | a decrease in money market investments of $185.9 million, mainly driven by the deployment of funds to purchase investments in U.S. Treasury securities and support loan origination; and |
| • | a decrease in securities held-to-maturity (“HTM”) of $109.4 million driven by maturities, partially offset by the amortization of $45.3 million of the discount related to U.S. Treasury securities previously reclassified from AFS to HTM. |
Total liabilities increased by $806.6 million from the fourth quarter of 2024, driven by:
| • | an increase of $934.9 million in deposits, driven primarily by an increase of approximately $763.5 million in NOW and money market deposits, on both retail and commercial accounts in BPPR and PB, coupled with an increase in P.R. public deposits of approximately $159.2 million. At quarter end, P.R. public deposits totaled $19.6 billion; |
partially offset by:
| • | a decrease in notes payable of $63.1 million, mainly driven by the maturity of long-term FHLB advances at both BPPR and PB of $37.0 million and $26.5 million, respectively; and |
| • | a decrease in other short-term borrowings of $25.0 million, due to lower FHLB advances in PB. |
Stockholders’ equity increased by $186.6 million from the fourth quarter of 2024 mainly due to the quarter’s net income of $177.5 million, a decrease in net unrealized losses in the portfolio of AFS securities of $140.2 million and the amortization of unrealized losses from securities previously reclassified to HTM of $36.2 million, net of tax, partially offset by an increase in Treasury Stock of $117.6 million mainly due to common stock repurchases during the quarter and common and preferred dividends declared during the quarter of $48.8 million.
9
During the first quarter of 2025, Popular repurchased 1.3 million shares of common stock at an average price of $96.24. As of March 31, 2025, Popular has repurchased a total of 3.5 million shares of common stock for $339.6 million as part of its previously announced common stock repurchase authorization of up to $500 million.
Common Equity Tier 1 ratio (“CET1”), common equity per share and tangible book value per share were 16.11%, $83.75 and $72.02 respectively, at March 31, 2025, compared to 16.03%, $79.71 and $68.16, respectively, at December 31, 2024.
Refer to Table A for capital ratios.
10
Cautionary Note Regarding Forward-Looking Statements
This press release contains “forward-looking statements” within the meaning of the U.S. Private Securities Litigation Reform Act of 1995, including without limitation those regarding Popular’s business, financial condition, results of operations, plans, objectives and future performance. These statements are not guarantees of future performance, are based on management’s current expectations and, by their nature, involve risks, uncertainties, estimates and assumptions. Potential factors, some of which are beyond the Corporation’s control, could cause actual results to differ materially from those expressed in, or implied by, such forward-looking statements. Risks and uncertainties include, without limitation, the effect of competitive and economic factors, and our reaction to those factors, the adequacy of the allowance for loan losses, delinquency trends, market risk and the impact of interest rate changes (including on our cost of deposits), our ability to attract deposits and grow our loan portfolio, capital market conditions, capital adequacy and liquidity, the effect of legal and regulatory proceedings, new regulatory requirements or accounting standards on the Corporation’s financial condition and results of operations, the occurrence of unforeseen or catastrophic events, such as extreme weather events, pandemics, man-made disasters or acts of violence or war, as well as actions taken by governmental authorities in response thereto, and the direct and indirect impact of such events on Popular, our customers, service providers and third parties. Other potential factors include Popular’s ability to successfully execute its transformation initiative, including, but not limited to, achieving projected earnings, efficiencies and return on tangible common equity and accurately anticipating costs and expenses associated therewith, imposition of additional or special FDIC assessments, or increases thereto, changes to regulatory capital, liquidity and resolution-related requirements applicable to financial institutions in response to recent developments affecting the banking sector, the impact of bank failures or adverse developments at other banks and related negative media coverage of the banking industry in general on investor and depositor sentiment regarding the stability and liquidity of banks, and changes in and uncertainty regarding federal funding, tax and trade policies, and rulemaking, supervision, examination and enforcement priorities of the current federal administration. All statements contained herein that are not clearly historical in nature, are forward-looking, and the words “anticipate,” “believe,” “continues,” “expect,” “estimate,” “intend,” “project” and similar expressions, and future or conditional verbs such as “will,” “would,” “should,” “could,” “might,” “can,” “may” or similar expressions, are generally intended to identify forward-looking statements.
More information on the risks and important factors that could affect the Corporation’s future results and financial condition is included in our Form 10-K for the year ended December 31, 2024 and our Form 10-Q for the quarter ended March 31, 2025 to be filed with the Securities and Exchange Commission. Our filings are available on the Corporation’s website (www.popular.com) and on the Securities and Exchange Commission website (www.sec.gov). The Corporation assumes no obligation to update or revise any forward-looking statements or information which speak as of their respective dates.
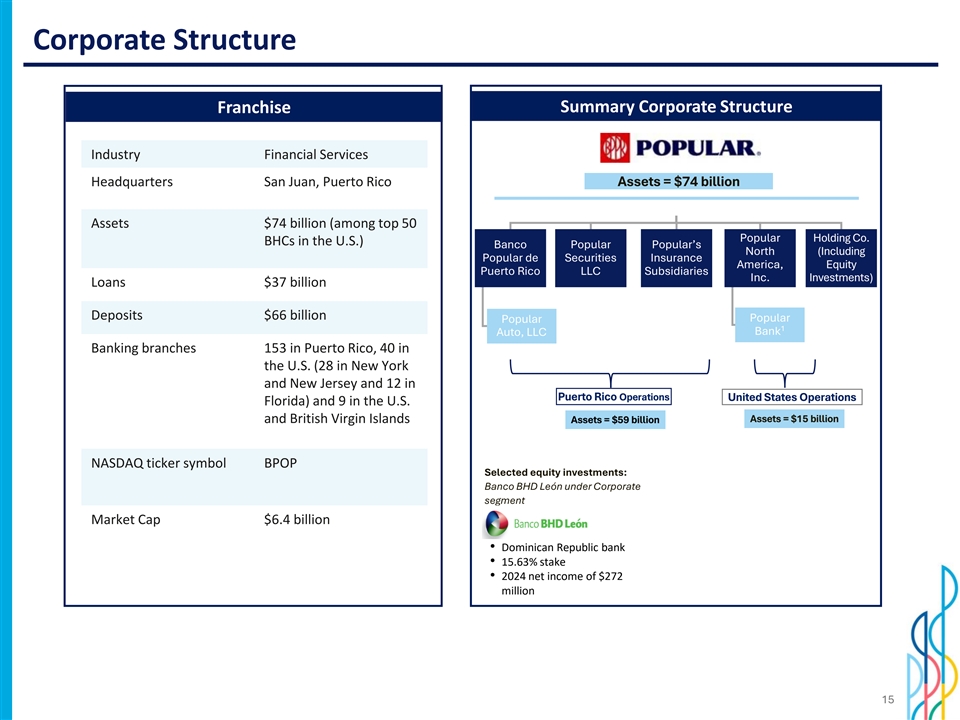
About Popular, Inc.
Popular, Inc. (NASDAQ: BPOP) is the leading financial institution in Puerto Rico, by both assets and deposits, and ranks among the top 50 U.S. bank holding companies by assets. Founded in 1893, Banco Popular de Puerto Rico, Popular’s principal subsidiary, provides retail, mortgage and commercial banking services in Puerto Rico and the U.S. and British Virgin Islands. Popular also offers in Puerto Rico auto and equipment leasing and financing, broker-dealer and insurance services through specialized subsidiaries. In the mainland United States, Popular provides retail, mortgage and commercial banking services through its New York-chartered banking subsidiary, Popular Bank, which has branches located in New York, New Jersey and Florida.
Conference Call
Popular will hold a conference call to discuss its financial results today, Wednesday, April 23, 2025 at 11:00 a.m. Eastern Time. The call will be broadcast live over the Internet and can be accessed through the Investor Relations section of the Corporation’s website: www.popular.com.
Listeners are recommended to go to the website at least 15 minutes prior to the call to download and install any necessary audio software. The call may also be accessed through a dial-in telephone number 1-833-470-1428 (Toll Free) or 1-404-975-4839 (Local). The dial-in access code is 225762.
A replay of the webcast will be archived in Popular’s website. A telephone replay will be available one hour after the end of the conference call through Friday, May 23, 2025. The replay dial in is: 1-866-813-9403 or 1-929-458-6194. The replay passcode is 685101.
An electronic version of this press release can be found at the Corporation’s website: www.popular.com.
11
Popular, Inc.
Financial Supplement to First Quarter 2025 Earnings Release
Table A - Selected Ratios and Other Information
Table B - Consolidated Statement of Operations
Table C - Consolidated Statement of Financial Condition
Table D - Analysis of Levels and Yields on a Taxable Equivalent Basis (Non-GAAP) - For the quarter ended March 31, 2024 and December 31,2023
Table E - Analysis of Levels and Yields on a Taxable Equivalent Basis (Non-GAAP) - For the quarter ended March 31, 2024 and March 31,2023
Table F - Analysis of Levels and Yields on a Taxable Equivalent Basis (Non-GAAP) - YEAR-TO-DATE [Left Blank]
Table G - Mortgage Banking Activities & Other Service Fees
Table H - Loans and Deposits
Table I - Loan Delinquency - PUERTO RICO OPERATIONS
Table J - Loan Delinquency - POPULAR U.S. OPERATIONS
Table K - Loan Delinquency - CONSOLIDATED
Table L - Non-Performing Assets
Table M - Activity in Non-Performing Loans
Table N - Allowance for Credit Losses, Net Charge-offs and Related Ratios
Table O - Allowance for Credit Losses - Loan Portfolios - CONSOLIDATED
Table P - Allowance for Credit Losses - Loan Portfolios - PUERTO RICO OPERATIONS
Table Q - Allowance for Credit Losses - Loan Portfolios - POPULAR U.S. OPERATIONS
Table R - Reconciliation to GAAP Financial Measures
12
POPULAR, INC.
Financial Supplement to First Quarter 2025 Earnings Release
Table A - Selected Ratios and Other Information
(Unaudited)
| Quarters ended | ||||||||||||
| 31-Mar-25 | 31-Dec-24 | 31-Mar-24 | ||||||||||
| Basic EPS |
$ | 2.56 | $ | 2.51 | $ | 1.43 | ||||||
| Diluted EPS |
$ | 2.56 | $ | 2.51 | $ | 1.43 | ||||||
| Average common shares outstanding |
69,280,137 | 70,722,548 | 71,869,735 | |||||||||
| Average common shares outstanding - assuming dilution |
69,307,681 | 70,740,958 | 71,966,803 | |||||||||
| Common shares outstanding at end of period |
68,984,148 | 70,141,291 | 72,284,875 | |||||||||
| Market value per common share |
$ | 92.37 | $ | 94.06 | $ | 88.09 | ||||||
| Market capitalization - (In millions) |
$ | 6,372 | $ | 6,597 | $ | 6,368 | ||||||
| Return on average assets |
0.96 | % | 0.97 | % | 0.57 | % | ||||||
| Return on average common equity |
10.07 | % | 9.94 | % | 6.07 | % | ||||||
| Net interest margin (non-taxable equivalent basis) |
3.40 | % | 3.35 | % | 3.16 | % | ||||||
| Net interest margin (taxable equivalent basis) -non-GAAP |
3.73 | % | 3.62 | % | 3.38 | % | ||||||
| Common equity per share |
$ | 83.75 | $ | 79.71 | $ | 71.32 | ||||||
| Tangible common book value per common share (non-GAAP) [1] |
$ | 72.02 | $ | 68.16 | $ | 60.06 | ||||||
| Tangible common equity to tangible assets (non-GAAP) [1] |
6.78 | % | 6.62 | % | 6.19 | % | ||||||
| Return on average tangible common equity [1] |
11.36 | % | 11.22 | % | 6.90 | % | ||||||
| Tier 1 capital |
16.16 | % | 16.08 | % | 16.42 | % | ||||||
| Total capital |
17.91 | % | 17.83 | % | 18.19 | % | ||||||
| Tier 1 leverage |
8.50 | % | 8.66 | % | 8.45 | % | ||||||
| Common Equity Tier 1 capital |
16.11 | % | 16.03 | % | 16.36 | % | ||||||
| [1] | Refer to Table R for reconciliation to GAAP financial measures. |
13
POPULAR, INC.
Financial Supplement to First Quarter 2025 Earnings Release
Table B - Consolidated Statement of Operations
(Unaudited)
| Quarters ended | Variance | Quarter ended | Variance | |||||||||||||||||
| (In thousands, except per share information) |
31-Mar-25 | 31-Dec-24 | Q1 2025 vs. Q4 2024 |
31-Mar-24 | Q1 2025 vs. Q1 2024 |
|||||||||||||||
| Interest income: |
||||||||||||||||||||
| Loans |
$ | 666,673 | $ | 673,858 | $ | (7,185 | ) | $ | 638,730 | $ | 27,943 | |||||||||
| Money market investments |
70,166 | 79,302 | (9,136 | ) | 88,516 | (18,350 | ) | |||||||||||||
| Investment securities |
180,159 | 166,607 | 13,552 | 166,895 | 13,264 | |||||||||||||||
|
|
|
|
|
|
|
|
|
|
|
|||||||||||
| Total interest income |
916,998 | 919,767 | (2,769 | ) | 894,141 | 22,857 | ||||||||||||||
|
|
|
|
|
|
|
|
|
|
|
|||||||||||
| Interest expense: |
||||||||||||||||||||
| Deposits |
297,863 | 315,701 | (17,838 | ) | 329,496 | (31,633 | ) | |||||||||||||
| Short-term borrowings |
1,426 | 928 | 498 | 1,192 | 234 | |||||||||||||||
| Long-term debt |
12,112 | 12,379 | (267 | ) | 12,709 | (597 | ) | |||||||||||||
|
|
|
|
|
|
|
|
|
|
|
|||||||||||
| Total interest expense |
311,401 | 329,008 | (17,607 | ) | 343,397 | (31,996 | ) | |||||||||||||
|
|
|
|
|
|
|
|
|
|
|
|||||||||||
| Net interest income |
605,597 | 590,759 | 14,838 | 550,744 | 54,853 | |||||||||||||||
| Provision for credit losses |
64,081 | 66,102 | (2,021 | ) | 72,598 | (8,517 | ) | |||||||||||||
|
|
|
|
|
|
|
|
|
|
|
|||||||||||
| Net interest income after provision for credit losses |
541,516 | 524,657 | 16,859 | 478,146 | 63,370 | |||||||||||||||
|
|
|
|
|
|
|
|
|
|
|
|||||||||||
| Service charges on deposit accounts |
39,054 | 38,060 | 994 | 37,442 | 1,612 | |||||||||||||||
| Other service fees |
94,508 | 99,350 | (4,842 | ) | 94,272 | 236 | ||||||||||||||
| Mortgage banking activities |
3,689 | 6,306 | (2,617 | ) | 4,360 | (671 | ) | |||||||||||||
| Net (loss) gain, including impairment, on equity securities |
(414 | ) | (2,459 | ) | 2,045 | 1,103 | (1,517 | ) | ||||||||||||
| Net gain (loss) on trading account debt securities |
520 | (10 | ) | 530 | 361 | 159 | ||||||||||||||
| Net gain on sale of loans, including valuation adjustments on loans held-for-sale |
— | 440 | (440 | ) | — | — | ||||||||||||||
| Adjustments to indemnity reserves on loans sold |
173 | 483 | (310 | ) | (237 | ) | 410 | |||||||||||||
| Other operating income |
14,531 | 22,533 | (8,002 | ) | 26,517 | (11,986 | ) | |||||||||||||
|
|
|
|
|
|
|
|
|
|
|
|||||||||||
| Total non-interest income |
152,061 | 164,703 | (12,642 | ) | 163,818 | (11,757 | ) | |||||||||||||
|
|
|
|
|
|
|
|
|
|
|
|||||||||||
| Operating expenses: |
||||||||||||||||||||
| Personnel costs |
||||||||||||||||||||
| Salaries |
130,950 | 135,793 | (4,843 | ) | 129,384 | 1,566 | ||||||||||||||
| Commissions, incentives and other bonuses |
37,986 | 30,494 | 7,492 | 38,611 | (625 | ) | ||||||||||||||
| Pension, postretirement and medical insurance |
14,566 | 17,794 | (3,228 | ) | 17,385 | (2,819 | ) | |||||||||||||
| Other personnel costs, including payroll taxes |
29,211 | 21,713 | 7,498 | 29,997 | (786 | ) | ||||||||||||||
|
|
|
|
|
|
|
|
|
|
|
|||||||||||
| Total personnel costs |
212,713 | 205,794 | 6,919 | 215,377 | (2,664 | ) | ||||||||||||||
| Net occupancy expenses |
27,218 | 27,666 | (448 | ) | 28,041 | (823 | ) | |||||||||||||
| Equipment expenses |
5,302 | 4,846 | 456 | 9,567 | (4,265 | ) | ||||||||||||||
| Other taxes |
18,725 | 18,581 | 144 | 14,375 | 4,350 | |||||||||||||||
| Professional fees |
26,825 | 32,452 | (5,627 | ) | 28,918 | (2,093 | ) | |||||||||||||
| Technology and software expenses |
83,668 | 81,395 | 2,273 | 79,462 | 4,206 | |||||||||||||||
| Processing and transactional services |
||||||||||||||||||||
| Credit and debit cards |
12,926 | 11,657 | 1,269 | 12,144 | 782 | |||||||||||||||
| Other processing and transactional services |
24,855 | 23,410 | 1,445 | 22,050 | 2,805 | |||||||||||||||
|
|
|
|
|
|
|
|
|
|
|
|||||||||||
| Total processing and transactional services |
37,781 | 35,067 | 2,714 | 34,194 | 3,587 | |||||||||||||||
| Communications |
4,904 | 4,756 | 148 | 4,557 | 347 | |||||||||||||||
| Business promotion |
||||||||||||||||||||
| Rewards and customer loyalty programs |
16,365 | 16,778 | (413 | ) | 14,056 | 2,309 | ||||||||||||||
| Other business promotion |
7,310 | 13,077 | (5,767 | ) | 6,933 | 377 | ||||||||||||||
|
|
|
|
|
|
|
|
|
|
|
|||||||||||
| Total business promotion |
23,675 | 29,855 | (6,180 | ) | 20,989 | 2,686 | ||||||||||||||
| Deposit insurance |
10,035 | 9,725 | 310 | 23,887 | (13,852 | ) | ||||||||||||||
| Other real estate owned (OREO) expense (income) |
(3,330 | ) | (4,379 | ) | 1,049 | (5,321 | ) | 1,991 | ||||||||||||
14
| Other operating expenses |
||||||||||||||||||||
| Operational losses |
6,138 | 6,047 | 91 | 3,561 | 2,577 | |||||||||||||||
| All other |
16,761 | 15,117 | 1,644 | 24,711 | (7,950 | ) | ||||||||||||||
|
|
|
|
|
|
|
|
|
|
|
|||||||||||
| Total other operating expenses |
22,899 | 21,164 | 1,735 | 28,272 | (5,373 | ) | ||||||||||||||
| Amortization of intangibles |
597 | 705 | (108 | ) | 795 | (198 | ) | |||||||||||||
|
|
|
|
|
|
|
|
|
|
|
|||||||||||
| Total operating expenses |
471,012 | 467,627 | 3,385 | 483,113 | (12,101 | ) | ||||||||||||||
|
|
|
|
|
|
|
|
|
|
|
|||||||||||
| Income before income tax |
222,565 | 221,733 | 832 | 158,851 | 63,714 | |||||||||||||||
| Income tax expense |
45,063 | 43,916 | 1,147 | 55,568 | (10,505 | ) | ||||||||||||||
|
|
|
|
|
|
|
|
|
|
|
|||||||||||
| Net income |
$ | 177,502 | $ | 177,817 | $ | (315 | ) | $ | 103,283 | $ | 74,219 | |||||||||
|
|
|
|
|
|
|
|
|
|
|
|||||||||||
| Net income applicable to common stock |
$ | 177,149 | $ | 177,464 | $ | (315 | ) | $ | 102,930 | $ | 74,219 | |||||||||
|
|
|
|
|
|
|
|
|
|
|
|||||||||||
| Net income per common share - basic |
$ | 2.56 | $ | 2.51 | $ | 0.05 | $ | 1.43 | $ | 1.13 | ||||||||||
|
|
|
|
|
|
|
|
|
|
|
|||||||||||
| Net income per common share - diluted |
$ | 2.56 | $ | 2.51 | $ | 0.05 | $ | 1.43 | $ | 1.13 | ||||||||||
|
|
|
|
|
|
|
|
|
|
|
|||||||||||
| Dividends Declared per Common Share |
$ | 0.70 | $ | 0.70 | $ | — | $ | 0.62 | $ | 0.08 | ||||||||||
|
|
|
|
|
|
|
|
|
|
|
15
Popular, Inc.
Financial Supplement to First Quarter 2025 Earnings Release
Table C - Consolidated Statement of Financial Condition
(Unaudited)
| (In thousands) |
31-Mar-25 | 31-Dec-24 | 31-Mar-24 | Variance Q1 2025 vs. Q4 2024 |
||||||||||||
| Assets: |
||||||||||||||||
| Cash and due from banks |
$ | 380,165 | $ | 419,638 | $ | 320,486 | $ | (39,473 | ) | |||||||
| Money market investments |
6,195,028 | 6,380,948 | 5,928,578 | (185,920 | ) | |||||||||||
| Trading account debt securities, at fair value |
28,477 | 32,831 | 27,308 | (4,354 | ) | |||||||||||
| Debt securities available-for-sale, at fair value |
19,493,180 | 18,245,903 | 18,017,924 | 1,247,277 | ||||||||||||
| Less: Allowance for credit losses |
— | — | 500 | — | ||||||||||||
|
|
|
|
|
|
|
|
|
|||||||||
| Debt securities available-for-sale, net |
19,493,180 | 18,245,903 | 18,017,424 | 1,247,277 | ||||||||||||
| Debt securities held-to-maturity, at amortized cost |
7,648,718 | 7,758,077 | 8,083,160 | (109,359 | ) | |||||||||||
| Less: Allowance for credit losses |
5,481 | 5,317 | 5,731 | 164 | ||||||||||||
|
|
|
|
|
|
|
|
|
|||||||||
| Debt securities held-to-maturity, net |
7,643,237 | 7,752,760 | 8,077,429 | (109,523 | ) | |||||||||||
|
|
|
|
|
|
|
|
|
|||||||||
| Equity securities |
205,021 | 208,166 | 195,747 | (3,145 | ) | |||||||||||
| Loans held-for-sale, at lower of cost or fair value |
5,077 | 5,423 | 5,352 | (346 | ) | |||||||||||
| Loans held-in-portfolio |
37,675,070 | 37,522,995 | 35,486,161 | 152,075 | ||||||||||||
| Less: Unearned income |
421,038 | 415,343 | 367,423 | 5,695 | ||||||||||||
| Allowance for credit losses |
762,148 | 746,024 | 739,544 | 16,124 | ||||||||||||
|
|
|
|
|
|
|
|
|
|||||||||
| Total loans held-in-portfolio, net |
36,491,884 | 36,361,628 | 34,379,194 | 130,256 | ||||||||||||
|
|
|
|
|
|
|
|
|
|||||||||
| Premises and equipment, net |
625,237 | 601,787 | 588,708 | 23,450 | ||||||||||||
| Other real estate |
52,114 | 57,268 | 80,542 | (5,154 | ) | |||||||||||
| Accrued income receivable |
262,720 | 263,389 | 266,908 | (669 | ) | |||||||||||
| Mortgage servicing rights, at fair value |
104,743 | 108,103 | 114,964 | (3,360 | ) | |||||||||||
| Other assets |
1,742,540 | 1,797,759 | 2,120,902 | (55,219 | ) | |||||||||||
| Goodwill |
802,954 | 802,954 | 804,428 | — | ||||||||||||
| Other intangible assets |
6,229 | 6,826 | 8,969 | (597 | ) | |||||||||||
|
|
|
|
|
|
|
|
|
|||||||||
| Total assets |
$ | 74,038,606 | $ | 73,045,383 | $ | 70,936,939 | $ | 993,223 | ||||||||
|
|
|
|
|
|
|
|
|
|||||||||
| Liabilities and Stockholders’ Equity: |
||||||||||||||||
| Liabilities: |
||||||||||||||||
| Deposits: |
||||||||||||||||
| Non-interest bearing |
$ | 15,160,801 | $ | 15,139,555 | $ | 15,492,050 | $ | 21,246 | ||||||||
| Interest bearing |
50,658,454 | 49,744,790 | 48,316,734 | 913,664 | ||||||||||||
|
|
|
|
|
|
|
|
|
|||||||||
| Total deposits |
65,819,255 | 64,884,345 | 63,808,784 | 934,910 | ||||||||||||
|
|
|
|
|
|
|
|
|
|||||||||
| Assets sold under agreements to repurchase |
57,268 | 54,833 | 66,090 | 2,435 | ||||||||||||
| Other short-term borrowings |
200,000 | 225,000 | — | (25,000 | ) | |||||||||||
| Notes payable |
833,149 | 896,293 | 966,303 | (63,144 | ) | |||||||||||
| Other liabilities |
1,329,239 | 1,371,846 | 918,448 | (42,607 | ) | |||||||||||
|
|
|
|
|
|
|
|
|
|||||||||
| Total liabilities |
68,238,911 | 67,432,317 | 65,759,625 | 806,594 | ||||||||||||
|
|
|
|
|
|
|
|
|
|||||||||
| Stockholders’ equity: |
||||||||||||||||
| Preferred stock |
22,143 | 22,143 | 22,143 | — | ||||||||||||
| Common stock |
1,049 | 1,048 | 1,048 | 1 | ||||||||||||
| Surplus |
4,912,886 | 4,908,693 | 4,847,466 | 4,193 | ||||||||||||
| Retained earnings |
4,699,697 | 4,570,957 | 4,253,030 | 128,740 | ||||||||||||
| Treasury stock |
(2,346,093 | ) | (2,228,535 | ) | (2,013,187 | ) | (117,558 | ) | ||||||||
| Accumulated other comprehensive loss, net of tax |
(1,489,987 | ) | (1,661,240 | ) | (1,933,186 | ) | 171,253 | |||||||||
|
|
|
|
|
|
|
|
|
|||||||||
| Total stockholders’ equity |
5,799,695 | 5,613,066 | 5,177,314 | 186,629 | ||||||||||||
|
|
|
|
|
|
|
|
|
|||||||||
| Total liabilities and stockholders’ equity |
$ | 74,038,606 | $ | 73,045,383 | $ | 70,936,939 | $ | 993,223 | ||||||||
|
|
|
|
|
|
|
|
|
|||||||||
16
Popular, Inc.
Financial Supplement to First Quarter 2025 Earnings Release
Table D - Analysis of Levels and Yields on a Taxable Equivalent Basis (Non-GAAP)
For the quarters ended March 31, 2025 and December 31, 2024
(Unaudited)
| Average Volume | Average Yields / Costs | Interest | Variance Attributable to |
|||||||||||||||||||||||||||||||||||||||||
| 31-Mar-25 |
31-Dec-24 | Variance | 31-Mar-25 | 31-Dec-24 | Variance | 31-Mar-25 | 31-Dec-24 | Variance | Rate | Volume | ||||||||||||||||||||||||||||||||||
| (In millions) | (In thousands) | |||||||||||||||||||||||||||||||||||||||||||
| $ | 6,379 | $ | 6,571 | $ | (192 | ) | 4.46 | % | 4.80 | % | (0.34 | )% | Money market investments | $ | 70,166 | $ | 79,301 | $ | (9,135 | ) | $ | (6,874 | ) | $ | (2,261 | ) | ||||||||||||||||||
| 28,415 | 27,015 | 1,400 | 3.14 | 2.92 | 0.22 | Investment securities [1] | 220,435 | 198,116 | 22,319 | 10,529 | 11,790 | |||||||||||||||||||||||||||||||||
| 31 | 32 | (1 | ) | 5.82 | 5.82 | — | Trading securities | 440 | 470 | (30 | ) | (9 | ) | (21 | ) | |||||||||||||||||||||||||||||
|
|
|
|
|
|
|
|
|
|
|
|
|
|
|
|
|
|
|
|
|
|
|
|||||||||||||||||||||||
| 34,825 | 33,618 | 1,207 | 3.38 | 3.29 | 0.09 | Total money market, investment and trading securities |
291,041 | 277,887 | 13,154 | 3,646 | 9,508 | |||||||||||||||||||||||||||||||||
|
|
|
|
|
|
|
|
|
|
|
|
|
|
|
|
|
|
|
|
|
|
|
|||||||||||||||||||||||
| Loans: | ||||||||||||||||||||||||||||||||||||||||||||
| 18,489 | 18,297 | 192 | 6.71 | 6.84 | (0.13 | ) | Commercial |
305,968 | 314,615 | (8,647 | ) | (11,933 | ) | 3,286 | ||||||||||||||||||||||||||||||
| 1,309 | 1,204 | 105 | 8.11 | 8.38 | (0.27 | ) | Construction |
26,190 | 25,352 | 838 | (1,319 | ) | 2,157 | |||||||||||||||||||||||||||||||
| 1,930 | 1,898 | 32 | 7.14 | 7.03 | 0.11 | Leasing |
34,444 | 33,361 | 1,083 | 517 | 566 | |||||||||||||||||||||||||||||||||
| 8,168 | 8,039 | 129 | 5.82 | 5.78 | 0.04 | Mortgage |
118,917 | 116,254 | 2,663 | 786 | 1,877 | |||||||||||||||||||||||||||||||||
| 3,203 | 3,218 | (15 | ) | 14.04 | 13.79 | 0.25 | Consumer |
110,859 | 111,538 | (679 | ) | (159 | ) | (520 | ) | |||||||||||||||||||||||||||||
| 3,907 | 3,908 | (1 | ) | 9.12 | 9.02 | 0.10 | Auto |
87,850 | 88,564 | (714 | ) | (695 | ) | (19 | ) | |||||||||||||||||||||||||||||
|
|
|
|
|
|
|
|
|
|
|
|
|
|
|
|
|
|
|
|
|
|
|
|||||||||||||||||||||||
| 37,006 | 36,564 | 442 | 7.48 | 7.51 | (0.03 | ) | Total loans | 684,228 | 689,684 | (5,456 | ) | (12,803 | ) | 7,347 | ||||||||||||||||||||||||||||||
|
|
|
|
|
|
|
|
|
|
|
|
|
|
|
|
|
|
|
|
|
|
|
|||||||||||||||||||||||
| $ | 71,831 | $ | 70,182 | $ | 1,649 | 5.49 | % | 5.49 | % | — | % | Total earning assets | $ | 975,269 | $ | 967,571 | $ | 7,698 | $ | (9,157 | ) | $ | 16,855 | |||||||||||||||||||||
|
|
|
|
|
|
|
|
|
|
|
|
|
|
|
|
|
|
|
|
|
|
|
|||||||||||||||||||||||
| Interest bearing deposits: | ||||||||||||||||||||||||||||||||||||||||||||
| $ | 27,543 | $ | 25,954 | $ | 1,589 | 2.87 | % | 3.21 | % | (0.34 | )% | NOW and money market [2] |
$ | 194,610 | $ | 209,227 | $ | (14,617 | ) | $ | (20,633 | ) | $ | 6,016 | ||||||||||||||||||||
| 14,510 | 14,246 | 264 | 0.87 | 0.88 | (0.01 | ) | Savings |
31,304 | 31,341 | (37 | ) | (1,226 | ) | 1,189 | ||||||||||||||||||||||||||||||
| 9,123 | 8,978 | 145 | 3.20 | 3.33 | (0.13 | ) | Time deposits |
71,949 | 75,133 | (3,184 | ) | (4,409 | ) | 1,225 | ||||||||||||||||||||||||||||||
|
|
|
|
|
|
|
|
|
|
|
|
|
|
|
|
|
|
|
|
|
|
|
|||||||||||||||||||||||
| 51,176 | 49,178 | 1,998 | 2.36 | 2.55 | (0.19 | ) | Total interest bearing deposits | 297,863 | 315,701 | (17,838 | ) | (26,268 | ) | 8,430 | ||||||||||||||||||||||||||||||
|
|
|
|
|
|
|
|
|
|
|
|
|
|
|
|
|
|
|
|
|
|
|
|||||||||||||||||||||||
| 14,682 | 15,034 | (352 | ) | Non-interest bearing demand deposits |
||||||||||||||||||||||||||||||||||||||||
|
|
|
|
|
|
|
|||||||||||||||||||||||||||||||||||||||
| 65,858 | 64,212 | 1,646 | 1.83 | 1.96 | (0.13 | ) | Total deposits | 297,863 | 315,701 | (17,838 | ) | (26,268 | ) | 8,430 | ||||||||||||||||||||||||||||||
|
|
|
|
|
|
|
|
|
|
|
|
|
|
|
|
|
|
|
|
|
|
|
|||||||||||||||||||||||
| 121 | 73 | 48 | 4.77 | 5.09 | (0.32 | ) | Short-term borrowings | 1,426 | 928 | 498 | (89 | ) | 587 | |||||||||||||||||||||||||||||||
| 862 | 923 | (61 | ) | 5.66 | 5.39 | 0.27 | Other medium and long-term debt |
12,112 | 12,379 | (267 | ) | 96 | (363 | ) | ||||||||||||||||||||||||||||||
|
|
|
|
|
|
|
|
|
|
|
|
|
|
|
|
|
|
|
|
|
|
|
|||||||||||||||||||||||
| 52,159 | 50,174 | 1,985 | 2.42 | 2.61 | (0.19 | ) | Total interest bearing liabilities (excluding demand deposits) |
311,401 | 329,008 | (17,607 | ) | (26,261 | ) | 8,654 | ||||||||||||||||||||||||||||||
|
|
|
|
|
|
|
|
|
|
|
|
|
|
|
|
|
|
|
|
|
|
|
|||||||||||||||||||||||
| 4,990 | 4,974 | 16 | Other sources of funds | |||||||||||||||||||||||||||||||||||||||||
|
|
|
|
|
|
|
|||||||||||||||||||||||||||||||||||||||
| $ | 71,831 | $ | 70,182 | $ | 1,649 | 1.76 | % | 1.87 | % | (0.11 | )% | Total source of funds | 311,401 | 329,008 | (17,607 | ) | (26,261 | ) | 8,654 | |||||||||||||||||||||||||
|
|
|
|
|
|
|
|
|
|
|
|
|
|||||||||||||||||||||||||||||||||
| 3.73 | % | 3.62 | % | 0.11 | % | Net interest margin/income on a taxable equivalent basis (Non-GAAP) |
663,868 | 638,563 | 25,305 | $ | 17,104 | $ | 8,201 | |||||||||||||||||||||||||||||||
|
|
|
|
|
|
|
|
|
|
|
|
|
|
|
|
|
|||||||||||||||||||||||||||||
| 3.07 | % | 2.88 | % | 0.19 | % | Net interest spread | ||||||||||||||||||||||||||||||||||||||
|
|
|
|
|
|
|
|||||||||||||||||||||||||||||||||||||||
| Taxable equivalent adjustment | 58,271 | 47,804 | 10,467 | |||||||||||||||||||||||||||||||||||||||||
|
|
|
|
|
|
|
|||||||||||||||||||||||||||||||||||||||
| 3.40 | % | 3.35 | % | 0.05 | % | Net interest margin/income non-taxable equivalent basis (GAAP) |
$ | 605,597 | $ | 590,759 | $ | 14,838 | ||||||||||||||||||||||||||||||||
|
|
|
|
|
|
|
|
|
|
|
|
|
|||||||||||||||||||||||||||||||||
Note: The changes that are not due solely to volume or rate are allocated to volume and rate based on the proportion of the change in each category.
| [1] | Average balances exclude unrealized gains or losses on debt securities available-for-sale and the unrealized loss related to certain securities transferred from available-for-sale to held-to-maturity. |
| [2] | Includes interest bearing demand deposits corresponding to certain government entities in Puerto Rico. |
17
Popular, Inc.
Financial Supplement to First Quarter 2025 Earnings Release
Table E - Analysis of Levels and Yields on a Taxable Equivalent Basis (Non-GAAP)
For the quarters ended March 31, 2025 and March 31, 2024
(Unaudited)
| Average Volume | Average Yields / Costs | Interest | Variance Attributable to |
|||||||||||||||||||||||||||||||||||||||||
| 31-Mar-25 |
31-Mar-24 | Variance | 31-Mar-25 | 31-Mar-24 | Variance | 31-Mar-25 | 31-Mar-24 | Variance | Rate | Volume | ||||||||||||||||||||||||||||||||||
| (In millions) | (In thousands) | |||||||||||||||||||||||||||||||||||||||||||
| $ | 6,379 | $ | 6,484 | $ | (105 | ) | 4.46 | % | 5.49 | % | (1.03 | )% | Money market investments | $ | 70,166 | $ | 88,516 | $ | (18,350 | ) | $ | (16,944 | ) | $ | (1,406 | ) | ||||||||||||||||||
| 28,415 | 28,308 | 107 | 3.14 | 2.71 | 0.43 | Investment securities [1] | 220,435 | 191,103 | 29,332 | 27,299 | 2,033 | |||||||||||||||||||||||||||||||||
| 31 | 33 | (2 | ) | 5.82 | 3.75 | 2.07 | Trading securities | 440 | 311 | 129 | 156 | (27 | ) | |||||||||||||||||||||||||||||||
|
|
|
|
|
|
|
|
|
|
|
|
|
|
|
|
|
|
|
|
|
|
|
|||||||||||||||||||||||
| 34,825 | 34,825 | — | 3.38 | 3.23 | 0.15 | Total money market, investment and trading securities |
291,041 | 279,930 | 11,111 | 10,511 | 600 | |||||||||||||||||||||||||||||||||
|
|
|
|
|
|
|
|
|
|
|
|
|
|
|
|
|
|
|
|
|
|
|
|||||||||||||||||||||||
| Loans: | ||||||||||||||||||||||||||||||||||||||||||||
| 18,489 | 17,613 | 876 | 6.71 | 6.84 | (0.13 | ) | Commercial |
305,968 | 299,504 | 6,464 | (8,172 | ) | 14,636 | |||||||||||||||||||||||||||||||
| 1,309 | 992 | 317 | 8.11 | 8.96 | (0.85 | ) | Construction |
26,190 | 22,100 | 4,090 | (2,429 | ) | 6,519 | |||||||||||||||||||||||||||||||
| 1,930 | 1,742 | 188 | 7.14 | 6.74 | 0.40 | Leasing |
34,444 | 29,353 | 5,091 | 1,813 | 3,278 | |||||||||||||||||||||||||||||||||
| 8,168 | 7,723 | 445 | 5.82 | 5.62 | 0.20 | Mortgage |
118,917 | 108,543 | 10,374 | 3,985 | 6,389 | |||||||||||||||||||||||||||||||||
| 3,203 | 3,227 | (24 | ) | 14.04 | 13.90 | 0.14 | Consumer |
110,859 | 111,490 | (631 | ) | (196 | ) | (435 | ) | |||||||||||||||||||||||||||||
| 3,907 | 3,763 | 144 | 9.12 | 8.77 | 0.35 | Auto |
87,850 | 82,054 | 5,796 | 2,598 | 3,198 | |||||||||||||||||||||||||||||||||
|
|
|
|
|
|
|
|
|
|
|
|
|
|
|
|
|
|
|
|
|
|
|
|||||||||||||||||||||||
| 37,006 | 35,060 | 1,946 | 7.48 | 7.48 | — | Total loans | 684,228 | 653,044 | 31,184 | (2,401 | ) | 33,585 | ||||||||||||||||||||||||||||||||
|
|
|
|
|
|
|
|
|
|
|
|
|
|
|
|
|
|
|
|
|
|
|
|||||||||||||||||||||||
| $ | 71,831 | $ | 69,885 | $ | 1,946 | 5.49 | % | 5.36 | % | 0.13 | % | Total earning assets | $ | 975,269 | $ | 932,974 | $ | 42,295 | $ | 8,110 | $ | 34,185 | ||||||||||||||||||||||
|
|
|
|
|
|
|
|
|
|
|
|
|
|
|
|
|
|
|
|
|
|
|
|||||||||||||||||||||||
| Interest bearing deposits: | ||||||||||||||||||||||||||||||||||||||||||||
| $ | 27,543 | $ | 25,703 | $ | 1,840 | 2.87 | % | 3.63 | % | (0.76 | )% | NOW and money market [2] |
$ | 194,610 | $ | 232,129 | $ | (37,519 | ) | $ | (48,544 | ) | $ | 11,025 | ||||||||||||||||||||
| 14,510 | 14,700 | (190 | ) | 0.87 | 0.93 | (0.06 | ) | Savings |
31,304 | 34,171 | (2,867 | ) | (2,429 | ) | (438 | ) | ||||||||||||||||||||||||||||
| 9,123 | 8,547 | 576 | 3.20 | 2.97 | 0.23 | Time deposits |
71,949 | 63,196 | 8,753 | 3,384 | 5,369 | |||||||||||||||||||||||||||||||||
|
|
|
|
|
|
|
|
|
|
|
|
|
|
|
|
|
|
|
|
|
|
|
|||||||||||||||||||||||
| 51,176 | 48,950 | 2,226 | 2.36 | 2.71 | (0.35 | ) | Total interest bearing deposits |
297,863 | 329,496 | (31,633 | ) | (47,589 | ) | 15,956 | ||||||||||||||||||||||||||||||
|
|
|
|
|
|
|
|
|
|
|
|
|
|
|
|
|
|
|
|
|
|
|
|||||||||||||||||||||||
| 14,682 | 15,083 | (401 | ) | Non-interest bearing demand deposits |
||||||||||||||||||||||||||||||||||||||||
|
|
|
|
|
|
|
|||||||||||||||||||||||||||||||||||||||
| 65,858 | 64,033 | 1,825 | 1.83 | 2.07 | (0.24 | ) | Total deposits | 297,863 | 329,496 | (31,633 | ) | (47,589 | ) | 15,956 | ||||||||||||||||||||||||||||||
|
|
|
|
|
|
|
|
|
|
|
|
|
|
|
|
|
|
|
|
|
|
|
|||||||||||||||||||||||
| 121 | 84 | 37 | 4.77 | 5.70 | (0.93 | ) | Short-term borrowings | 1,426 | 1,192 | 234 | (198 | ) | 432 | |||||||||||||||||||||||||||||||
| 862 | 998 | (136 | ) | 5.66 | 5.13 | 0.53 | Other medium and long-term debt |
12,112 | 12,709 | (597 | ) | 47 | (644 | ) | ||||||||||||||||||||||||||||||
|
|
|
|
|
|
|
|
|
|
|
|
|
|
|
|
|
|
|
|
|
|
|
|||||||||||||||||||||||
| 52,159 | 50,032 | 2,127 | 2.42 | 2.76 | (0.34 | ) | Total interest bearing liabilities (excluding demand deposits) |
311,401 | 343,397 | (31,996 | ) | (47,740 | ) | 15,744 | ||||||||||||||||||||||||||||||
|
|
|
|
|
|
|
|
|
|
|
|
|
|
|
|
|
|
|
|
|
|
|
|||||||||||||||||||||||
| 4,990 | 4,770 | 220 | Other sources of funds | |||||||||||||||||||||||||||||||||||||||||
|
|
|
|
|
|
|
|||||||||||||||||||||||||||||||||||||||
| $ | 71,831 | $ | 69,885 | $ | 1,946 | 1.76 | % | 1.98 | % | (0.22 | )% | Total source of funds | 311,401 | 343,397 | (31,996 | ) | (47,740 | ) | 15,744 | |||||||||||||||||||||||||
|
|
|
|
|
|
|
|
|
|
|
|
|
|||||||||||||||||||||||||||||||||
| 3.73 | % | 3.38 | % | 0.36 | % | Net interest margin/income on a taxable equivalent basis (Non-GAAP) |
663,868 | 589,577 | 74,291 | $ | 55,850 | $ | 18,441 | |||||||||||||||||||||||||||||||
|
|
|
|
|
|
|
|
|
|
|
|
|
|
|
|
|
|||||||||||||||||||||||||||||
| 3.07 | % | 2.60 | % | 0.47 | % | Net interest spread | ||||||||||||||||||||||||||||||||||||||
|
|
|
|
|
|
|
|||||||||||||||||||||||||||||||||||||||
| Taxable equivalent adjustment |
58,271 | 38,833 | 19,438 | |||||||||||||||||||||||||||||||||||||||||
|
|
|
|
|
|
|
|||||||||||||||||||||||||||||||||||||||
| 3.40 | % | 3.16 | % | 0.24 | % | Net interest margin/income non-taxable equivalent basis (GAAP) |
$ | 605,597 | $ | 550,744 | $ | 54,853 | ||||||||||||||||||||||||||||||||
|
|
|
|
|
|
|
|
|
|
|
|
|
|||||||||||||||||||||||||||||||||
Note: The changes that are not due solely to volume or rate are allocated to volume and rate based on the proportion of the change in each category.
| [1] | Average balances exclude unrealized gains or losses on debt securities available-for-sale and the unrealized loss related to certain securities transferred from available-for-sale to held-to-maturity. |
| [2] | Includes interest bearing demand deposits corresponding to certain government entities in Puerto Rico. |
18
Popular, Inc.
Financial Supplement to First Quarter 2025 Earnings Release
Table F – Analysis of Levels and Yields on a Taxable Equivalent Basis (Non-GAAP) - YEAR-TO-DATE
[THIS PAGE INTENTIONALLY LEFT BLANK]
19
Popular, Inc.
Financial Supplement to First Quarter 2025 Earnings Release
Table G - Mortgage Banking Activities and Other Service Fees
(Unaudited)
Mortgage Banking Activities
| Quarters ended | Variance | |||||||||||||||||||
| (In thousands) |
31-Mar-25 | 31-Dec-24 | 31-Mar-24 | Q1 2025 vs.Q4 2024 |
Q1 2025 vs.Q1 2024 |
|||||||||||||||
| Mortgage servicing fees, net of fair value adjustments: |
||||||||||||||||||||
| Mortgage servicing fees |
$ | 7,168 | $ | 7,315 | $ | 7,751 | $ | (147 | ) | $ | (583 | ) | ||||||||
| Mortgage servicing rights fair value adjustments |
(3,570 | ) | (1,090 | ) | (3,439 | ) | (2,480 | ) | (131 | ) | ||||||||||
|
|
|
|
|
|
|
|
|
|
|
|||||||||||
| Total mortgage servicing fees, net of fair value adjustments |
3,598 | 6,225 | 4,312 | (2,627 | ) | (714 | ) | |||||||||||||
|
|
|
|
|
|
|
|
|
|
|
|||||||||||
| Net gain (loss) on sale of loans, including valuation on loans held-for-sale |
193 | (79 | ) | 74 | 272 | 119 | ||||||||||||||
|
|
|
|
|
|
|
|
|
|
|
|||||||||||
| Trading account (loss) profit: |
||||||||||||||||||||
| Unrealized (loss) gains on outstanding derivative positions |
(87 | ) | 72 | 101 | (159 | ) | (188 | ) | ||||||||||||
| Realized gains on closed derivative positions |
1 | 99 | 3 | (98 | ) | (2 | ) | |||||||||||||
|
|
|
|
|
|
|
|
|
|
|
|||||||||||
| Total trading account (loss) profit |
(86 | ) | 171 | 104 | (257 | ) | (190 | ) | ||||||||||||
|
|
|
|
|
|
|
|
|
|
|
|||||||||||
| Losses on repurchased loans, including interest advances |
(16 | ) | (11 | ) | (130 | ) | (5 | ) | 114 | |||||||||||
|
|
|
|
|
|
|
|
|
|
|
|||||||||||
| Total mortgage banking activities |
$ | 3,689 | $ | 6,306 | $ | 4,360 | $ | (2,617 | ) | $ | (671 | ) | ||||||||
|
|
|
|
|
|
|
|
|
|
|
|||||||||||
Other Service Fees
| Quarters ended | Variance | |||||||||||||||||||
| (In thousands) |
31-Mar-25 | 31-Dec-24 | 31-Mar-24 | Q1 2025 vs.Q4 2024 |
Q1 2025 vs.Q1 2024 |
|||||||||||||||
| Other service fees: |
||||||||||||||||||||
| Debit card fees [1] |
$ | 26,432 | $ | 26,903 | $ | 25,534 | $ | (471 | ) | $ | 898 | |||||||||
| Insurance fees |
11,309 | 14,619 | 14,689 | (3,310 | ) | (3,380 | ) | |||||||||||||
| Credit card fees [1] |
30,130 | 30,803 | 29,567 | (673 | ) | 563 | ||||||||||||||
| Sale and administration of investment products |
8,973 | 9,549 | 7,427 | (576 | ) | 1,546 | ||||||||||||||
| Trust fees |
6,300 | 6,635 | 6,707 | (335 | ) | (407 | ) | |||||||||||||
| Other fees |
11,364 | 10,841 | 10,348 | 523 | 1,016 | |||||||||||||||
|
|
|
|
|
|
|
|
|
|
|
|||||||||||
| Total other service fees |
$ | 94,508 | $ | 99,350 | $ | 94,272 | $ | (4,842 | ) | $ | 236 | |||||||||
|
|
|
|
|
|
|
|
|
|
|
|||||||||||
| [1] | Effective in the third quarter of 2024, the Corporation is reclassifying certain interchange fees, which were previously included jointly with credit card fees from common network activity, as debit card fees. Interchange fees amounting to $11.3 million were reclassified for the first quarter of 2024. |
20
Popular, Inc.
Financial Supplement to First Quarter 2025 Earnings Release
Table H - Consolidated Loans and Deposits
(Unaudited)
Loans - Ending Balances
| Variance | ||||||||||||||||||||||||||||
| (Dollars in thousands) |
31-Mar-25 | 31-Dec-24 | 31-Mar-24 | Q1 2025 vs.Q4 2024 |
% of Change | Q1 2025 vs.Q1 2024 |
% of Change | |||||||||||||||||||||
| Loans held-in-portfolio: |
|
|||||||||||||||||||||||||||
| Commercial |
||||||||||||||||||||||||||||
| Commercial multi-family |
$ | 2,374,915 | $ | 2,399,620 | $ | 2,384,635 | $ | (24,705 | ) | (1.03 | %) | $ | (9,720 | ) | (0.41 | %) | ||||||||||||
| Commercial real estate non-owner occupied |
5,540,603 | 5,363,235 | 5,057,059 | 177,368 | 3.31 | % | 483,544 | 9.56 | % | |||||||||||||||||||
| Commercial real estate owner occupied |
2,956,559 | 3,157,746 | 3,117,844 | (201,187 | ) | (6.37 | %) | (161,285 | ) | (5.17 | %) | |||||||||||||||||
| Commercial and industrial |
7,693,523 | 7,741,562 | 7,025,483 | (48,039 | ) | (0.62 | %) | 668,040 | 9.51 | % | ||||||||||||||||||
| Total Commercial |
18,565,600 | 18,662,163 | 17,585,021 | (96,563 | ) | (0.52 | %) | 980,579 | 5.58 | % | ||||||||||||||||||
| Construction |
1,358,979 | 1,263,792 | 1,009,303 | 95,187 | 7.53 | % | 349,676 | 34.65 | % | |||||||||||||||||||
| Leasing |
1,949,705 | 1,925,405 | 1,765,413 | 24,300 | 1.26 | % | 184,292 | 10.44 | % | |||||||||||||||||||
| Mortgage |
8,273,753 | 8,114,183 | 7,783,662 | 159,570 | 1.97 | % | 490,091 | 6.30 | % | |||||||||||||||||||
| Consumer |
||||||||||||||||||||||||||||
| Credit cards |
1,187,777 | 1,218,079 | 1,142,153 | (30,302 | ) | (2.49 | %) | 45,624 | 3.99 | % | ||||||||||||||||||
| Home equity lines of credit |
77,109 | 73,571 | 66,717 | 3,538 | 4.81 | % | 10,392 | 15.58 | % | |||||||||||||||||||
| Personal |
1,850,023 | 1,855,244 | 1,897,010 | (5,221 | ) | (0.28 | %) | (46,987 | ) | (2.48 | %) | |||||||||||||||||
| Auto |
3,820,242 | 3,823,437 | 3,706,854 | (3,195 | ) | (0.08 | %) | 113,388 | 3.06 | % | ||||||||||||||||||
| Other |
170,844 | 171,778 | 162,605 | (934 | ) | (0.54 | %) | 8,239 | 5.07 | % | ||||||||||||||||||
| Total Consumer |
7,105,995 | 7,142,109 | 6,975,339 | (36,114 | ) | (0.51 | %) | 130,656 | 1.87 | % | ||||||||||||||||||
|
|
|
|
|
|
|
|
|
|
|
|
|
|
|
|||||||||||||||
| Total loans held-in-portfolio |
$ | 37,254,032 | $ | 37,107,652 | $ | 35,118,738 | $ | 146,380 | 0.39 | % | $ | 2,135,294 | 6.08 | % | ||||||||||||||
| Loans held-for-sale: |
||||||||||||||||||||||||||||
| Mortgage |
$ | 5,077 | $ | 5,423 | $ | 5,352 | $ | (346 | ) | (6.38 | %) | $ | (275 | ) | (5.14 | %) | ||||||||||||
|
|
|
|
|
|
|
|
|
|
|
|
|
|
|
|||||||||||||||
| Total loans held-for-sale |
$ | 5,077 | $ | 5,423 | $ | 5,352 | $ | (346 | ) | (6.38 | %) | $ | (275 | ) | (5.14 | %) | ||||||||||||
|
|
|
|
|
|
|
|
|
|
|
|
|
|
|
|||||||||||||||
| Total loans |
$ | 37,259,109 | $ | 37,113,075 | $ | 35,124,090 | $ | 146,034 | 0.39 | % | $ | 2,135,019 | 6.08 | % | ||||||||||||||
|
|
|
|
|
|
|
|
|
|
|
|
|
|
|
|||||||||||||||
Deposits - Ending Balances
| Variance | ||||||||||||||||||||||||||||
| (In thousands) |
31-Mar-25 | 31-Dec-24 | 31-Mar-24 | Q1 2025 vs. Q4 2024 |
% of Change | Q1 2025 vs.Q1 2024 |
% of Change | |||||||||||||||||||||
| Deposits excluding P.R. public deposits: |
||||||||||||||||||||||||||||
| Demand deposits |
$ | 15,160,801 | $ | 15,139,555 | $ | 15,492,050 | $ | 21,246 | 0.14 | % | $ | (331,249 | ) | (2.14 | %) | |||||||||||||
| Savings, NOW and money market deposits (non-brokered) |
21,855,151 | 21,177,506 | 21,633,607 | 677,645 | 3.20 | % | 221,544 | 1.02 | % | |||||||||||||||||||
| Savings, NOW and money market deposits (brokered) |
822,065 | 736,225 | 727,794 | 85,840 | 11.66 | % | 94,271 | 12.95 | % | |||||||||||||||||||
| Time deposits (non-brokered) |
7,545,252 | 7,476,924 | 7,030,367 | 68,328 | 0.91 | % | 514,885 | 7.32 | % | |||||||||||||||||||
| Time deposits (brokered CDs) |
813,326 | 890,704 | 904,613 | (77,378 | ) | (8.69 | %) | (91,287 | ) | (10.09 | %) | |||||||||||||||||
|
|
|
|
|
|
|
|
|
|
|
|
|
|
|
|||||||||||||||
| Sub-total deposits excluding P.R. public deposits |
46,196,595 | 45,420,914 | 45,788,431 | 775,681 | 1.71 | % | 408,164 | 0.89 | % | |||||||||||||||||||
|
|
|
|
|
|
|
|
|
|
|
|
|
|
|
|||||||||||||||
| P.R. public deposits: |
||||||||||||||||||||||||||||
| Demand deposits [1] |
11,157,254 | 11,730,273 | 10,981,317 | (573,019 | ) | (4.88 | %) | 175,937 | 1.60 | % | ||||||||||||||||||
| Savings, NOW and money market deposits (non-brokered) |
7,655,847 | 7,087,904 | 6,218,944 | 567,943 | 8.01 | % | 1,436,903 | 23.11 | % | |||||||||||||||||||
| Time deposits (non-brokered) |
809,559 | 645,254 | 820,092 | 164,305 | 25.46 | % | (10,533 | ) | (1.28 | %) | ||||||||||||||||||
|
|
|
|
|
|
|
|
|
|
|
|
|
|
|
|||||||||||||||
| Sub-total P.R. public deposits |
19,622,660 | 19,463,431 | 18,020,353 | 159,229 | 0.82 | % | 1,602,307 | 8.89 | % | |||||||||||||||||||
|
|
|
|
|
|
|
|
|
|
|
|
|
|
|
|||||||||||||||
| Total deposits |
$ | 65,819,255 | $ | 64,884,345 | $ | 63,808,784 | $ | 934,910 | 1.44 | % | $ | 2,010,471 | 3.15 | % | ||||||||||||||
|
|
|
|
|
|
|
|
|
|
|
|
|
|
|
|||||||||||||||
| [1] | Includes interest bearing demand deposits. |
21
Popular, Inc.
Financial Supplement to First Quarter 2025 Earnings Release
Table I - Loan Delinquency -BPPR Operations
(Unaudited)
| 31-Mar-25 |
||||||||||||||||||||||||||||||||
| BPPR |
||||||||||||||||||||||||||||||||
| Past due | Past due 90 days or more | |||||||||||||||||||||||||||||||
| (In thousands) |
30-59 days |
60-89 days |
90 days or more |
Total past due |
Current | Loans HIP | Non-accrual loans |
Accruing loans |
||||||||||||||||||||||||
| Commercial multi-family |
$ | 3,387 | $ | 112 | $ | 73 | $ | 3,572 | $ | 304,739 | $ | 308,311 | $ | 73 | $ | — | ||||||||||||||||
| Commercial real estate: |
||||||||||||||||||||||||||||||||
| Non-owner occupied |
3,045 | 74 | 6,306 | 9,425 | 3,304,377 | 3,313,802 | 6,306 | — | ||||||||||||||||||||||||
| Owner occupied |
7,512 | 141 | 26,891 | 34,544 | 1,168,868 | 1,203,412 | 26,891 | — | ||||||||||||||||||||||||
| Commercial and industrial |
4,637 | 2,871 | 13,089 | 20,597 | 5,227,961 | 5,248,558 | 9,327 | 3,762 | ||||||||||||||||||||||||
| Construction |
6,498 | — | — | 6,498 | 223,705 | 230,203 | — | — | ||||||||||||||||||||||||
| Mortgage |
249,712 | 105,166 | 333,557 | 688,435 | 6,257,507 | 6,945,942 | 148,506 | 185,051 | ||||||||||||||||||||||||
| Leasing |
19,178 | 5,192 | 8,895 | 33,265 | 1,916,440 | 1,949,705 | 8,895 | — | ||||||||||||||||||||||||
| Consumer: |
||||||||||||||||||||||||||||||||
| Credit cards |
13,365 | 10,555 | 30,506 | 54,426 | 1,133,352 | 1,187,778 | — | 30,506 | ||||||||||||||||||||||||
| Home equity lines of credit |
— | — | 18 | 18 | 2,039 | 2,057 | — | 18 | ||||||||||||||||||||||||
| Personal |
19,246 | 11,174 | 18,251 | 48,671 | 1,707,204 | 1,755,875 | 18,251 | — | ||||||||||||||||||||||||
| Auto |
78,743 | 15,893 | 41,784 | 136,420 | 3,683,822 | 3,820,242 | 41,784 | — | ||||||||||||||||||||||||
| Other |
2,686 | 144 | 2,307 | 5,137 | 153,586 | 158,723 | 1,973 | 334 | ||||||||||||||||||||||||
|
|
|
|
|
|
|
|
|
|
|
|
|
|
|
|
|
|||||||||||||||||
| Total |
$ | 408,009 | $ | 151,322 | $ | 481,677 | $ | 1,041,008 | $ | 25,083,600 | $ | 26,124,608 | $ | 262,006 | $ | 219,671 | ||||||||||||||||
|
|
|
|
|
|
|
|
|
|
|
|
|
|
|
|
|
|||||||||||||||||
| 31-Dec-24 |
||||||||||||||||||||||||||||||||
| BPPR |
||||||||||||||||||||||||||||||||
| Past due | Past due 90 days or more | |||||||||||||||||||||||||||||||
| (In thousands) |
30-59 days |
60-89 days |
90 days or more |
Total past due |
Current | Loans HIP | Non-accrual loans |
Accruing loans |
||||||||||||||||||||||||
| Commercial multi-family |
$ | 1,491 | $ | 113 | $ | 79 | $ | 1,683 | $ | 306,318 | $ | 308,001 | $ | 79 | $ | — | ||||||||||||||||
| Commercial real estate: |
||||||||||||||||||||||||||||||||
| Non-owner occupied |
3,103 | 586 | 6,429 | 10,118 | 3,236,385 | 3,246,503 | 6,429 | — | ||||||||||||||||||||||||
| Owner occupied |
11,054 | 808 | 25,258 | 37,120 | 1,338,791 | 1,375,911 | 25,258 | — | ||||||||||||||||||||||||
| Commercial and industrial |
5,738 | 2,712 | 23,895 | 32,345 | 5,314,549 | 5,346,894 | 19,335 | 4,560 | ||||||||||||||||||||||||
| Construction |
1,039 | — | — | 1,039 | 211,251 | 212,290 | — | — | ||||||||||||||||||||||||
| Mortgage |
262,222 | 116,694 | 365,759 | 744,675 | 6,065,206 | 6,809,881 | 158,442 | 207,317 | ||||||||||||||||||||||||
| Leasing |
23,991 | 6,062 | 9,588 | 39,641 | 1,885,764 | 1,925,405 | 9,588 | — | ||||||||||||||||||||||||
| Consumer: |
||||||||||||||||||||||||||||||||
| Credit cards |
17,399 | 11,719 | 29,960 | 59,078 | 1,158,975 | 1,218,053 | — | 29,960 | ||||||||||||||||||||||||
| Home equity lines of credit |
16 | 129 | — | 145 | 1,895 | 2,040 | — | — | ||||||||||||||||||||||||
| Personal |
19,503 | 13,005 | 20,269 | 52,777 | 1,697,600 | 1,750,377 | 20,269 | — | ||||||||||||||||||||||||
| Auto |
111,358 | 27,858 | 51,792 | 191,008 | 3,632,429 | 3,823,437 | 51,792 | — | ||||||||||||||||||||||||
| Other |
1,816 | 277 | 1,312 | 3,405 | 156,824 | 160,229 | 899 | 413 | ||||||||||||||||||||||||
|
|
|
|
|
|
|
|
|
|
|
|
|
|
|
|
|
|||||||||||||||||
| Total |
$ | 458,730 | $ | 179,963 | $ | 534,341 | $ | 1,173,034 | $ | 25,005,987 | $ | 26,179,021 | $ | 292,091 | $ | 242,250 | ||||||||||||||||
|
|
|
|
|
|
|
|
|
|
|
|
|
|
|
|
|
|||||||||||||||||
22
| Variance |
||||||||||||||||||||||||||||||||
| Past due | Past due 90 days or more | |||||||||||||||||||||||||||||||
| (In thousands) |
30-59 days |
60-89 days |
90 days or more |
Total past due |
Current | Loans HIP | Non-accrual loans |
Accruing loans |
||||||||||||||||||||||||
| Commercial multi-family |
$ | 1,896 | $ | (1 | ) | $ | (6 | ) | $ | 1,889 | $ | (1,579 | ) | $ | 310 | $ | (6 | ) | $ | — | ||||||||||||
| Commercial real estate: |
||||||||||||||||||||||||||||||||
| Non-owner occupied |
(58 | ) | (512 | ) | (123 | ) | (693 | ) | 67,992 | 67,299 | (123 | ) | — | |||||||||||||||||||
| Owner occupied |
(3,542 | ) | (667 | ) | 1,633 | (2,576 | ) | (169,923 | ) | (172,499 | ) | 1,633 | — | |||||||||||||||||||
| Commercial and industrial |
(1,101 | ) | 159 | (10,806 | ) | (11,748 | ) | (86,588 | ) | (98,336 | ) | (10,008 | ) | (798 | ) | |||||||||||||||||
| Construction |
5,459 | — | — | 5,459 | 12,454 | 17,913 | — | — | ||||||||||||||||||||||||
| Mortgage |
(12,510 | ) | (11,528 | ) | (32,202 | ) | (56,240 | ) | 192,301 | 136,061 | (9,936 | ) | (22,266 | ) | ||||||||||||||||||
| Leasing |
(4,813 | ) | (870 | ) | (693 | ) | (6,376 | ) | 30,676 | 24,300 | (693 | ) | — | |||||||||||||||||||
| Consumer: |
||||||||||||||||||||||||||||||||
| Credit cards |
(4,034 | ) | (1,164 | ) | 546 | (4,652 | ) | (25,623 | ) | (30,275 | ) | — | 546 | |||||||||||||||||||
| Home equity lines of credit |
(16 | ) | (129 | ) | 18 | (127 | ) | 144 | 17 | — | 18 | |||||||||||||||||||||
| Personal |
(257 | ) | (1,831 | ) | (2,018 | ) | (4,106 | ) | 9,604 | 5,498 | (2,018 | ) | — | |||||||||||||||||||
| Auto |
(32,615 | ) | (11,965 | ) | (10,008 | ) | (54,588 | ) | 51,393 | (3,195 | ) | (10,008 | ) | — | ||||||||||||||||||
| Other |
870 | (133 | ) | 995 | 1,732 | (3,238 | ) | (1,506 | ) | 1,074 | (79 | ) | ||||||||||||||||||||
|
|
|
|
|
|
|
|
|
|
|
|
|
|
|
|
|
|||||||||||||||||
| Total |
$ | (50,721 | ) | $ | (28,641 | ) | $ | (52,664 | ) | $ | (132,026 | ) | $ | 77,613 | $ | (54,413 | ) | $ | (30,085 | ) | $ | (22,579 | ) | |||||||||
|
|
|
|
|
|
|
|
|
|
|
|
|
|
|
|
|
|||||||||||||||||
23
Popular, Inc.
Financial Supplement to First Quarter 2025 Earnings Release
Table J - Loan Delinquency - Popular U.S. Operations
(Unaudited)
| 31-Mar-25 |
||||||||||||||||||||||||||||||||
| Popular U.S. |
||||||||||||||||||||||||||||||||
| Past due | Past due 90 days or more |
|||||||||||||||||||||||||||||||
| (In thousands) |
30-59 days |
60-89 days |
90 days or more |
Total past due |
Current | Loans HIP | Non-accrual loans |
Accruing loans |
||||||||||||||||||||||||
| Commercial multi-family |
$ | 1,858 | $ | — | $ | 8,700 | $ | 10,558 | $ | 2,056,046 | $ | 2,066,604 | $ | 8,700 | $ | — | ||||||||||||||||
| Commercial real estate: |
||||||||||||||||||||||||||||||||
| Non-owner occupied |
768 | — | 7,886 | 8,654 | 2,218,147 | 2,226,801 | 7,886 | — | ||||||||||||||||||||||||
| Owner occupied |
— | — | 231 | 231 | 1,752,916 | 1,753,147 | 231 | — | ||||||||||||||||||||||||
| Commercial and industrial |
7,724 | 733 | 879 | 9,336 | 2,435,629 | 2,444,965 | 690 | 189 | ||||||||||||||||||||||||
| Construction |
— | — | — | — | 1,128,776 | 1,128,776 | — | — | ||||||||||||||||||||||||
| Mortgage |
29,944 | 1,604 | 29,087 | 60,635 | 1,267,176 | 1,327,811 | 29,087 | — | ||||||||||||||||||||||||
| Consumer: |
||||||||||||||||||||||||||||||||
| Credit cards |
— | — | — | — | (1 | ) | (1 | ) | — | — | ||||||||||||||||||||||
| Home equity lines of credit |
1,851 | 973 | 3,430 | 6,254 | 68,798 | 75,052 | 3,430 | — | ||||||||||||||||||||||||
| Personal |
1,381 | 781 | 2,034 | 4,196 | 89,952 | 94,148 | 2,034 | — | ||||||||||||||||||||||||
| Other |
1 | — | 5 | 6 | 12,115 | 12,121 | 5 | — | ||||||||||||||||||||||||
|
|
|
|
|
|
|
|
|
|
|
|
|
|
|
|
|
|||||||||||||||||
| Total |
$ | 43,527 | $ | 4,091 | $ | 52,252 | $ | 99,870 | $ | 11,029,554 | $ | 11,129,424 | $ | 52,063 | $ | 189 | ||||||||||||||||
|
|
|
|
|
|
|
|
|
|
|
|
|
|
|
|
|
|||||||||||||||||
| 31-Dec-24 |
||||||||||||||||||||||||||||||||
| Popular U.S. |
||||||||||||||||||||||||||||||||
| Past due | Past due 90 days or more |
|||||||||||||||||||||||||||||||
| (In thousands) |
30-59 days |
60-89 days |
90 days or more |
Total past due |
Current | Loans HIP | Non-accrual loans |
Accruing loans |
||||||||||||||||||||||||
| Commercial multi-family |
$ | — | $ | 5,443 | $ | 8,700 | $ | 14,143 | $ | 2,077,476 | $ | 2,091,619 | $ | 8,700 | $ | — | ||||||||||||||||
| Commercial real estate: |
||||||||||||||||||||||||||||||||
| Non-owner occupied |
6,792 | — | 8,015 | 14,807 | 2,101,925 | 2,116,732 | 8,015 | — | ||||||||||||||||||||||||
| Owner occupied |
— | — | 5,191 | 5,191 | 1,776,644 | 1,781,835 | 5,191 | — | ||||||||||||||||||||||||
| Commercial and industrial |
10,336 | 5,323 | 1,938 | 17,597 | 2,377,071 | 2,394,668 | 1,748 | 190 | ||||||||||||||||||||||||
| Construction |
— | — | — | — | 1,051,502 | 1,051,502 | — | — | ||||||||||||||||||||||||
| Mortgage |
18,148 | 5,417 | 29,890 | 53,455 | 1,250,847 | 1,304,302 | 29,890 | — | ||||||||||||||||||||||||
| Consumer: |
||||||||||||||||||||||||||||||||
| Credit cards |
— | — | — | — | 26 | 26 | — | — | ||||||||||||||||||||||||
| Home equity lines of credit |
530 | 986 | 3,393 | 4,909 | 66,622 | 71,531 | 3,393 | — | ||||||||||||||||||||||||
| Personal |
1,808 | 1,509 | 1,741 | 5,058 | 99,809 | 104,867 | 1,741 | — | ||||||||||||||||||||||||
| Other |
514 | — | 11 | 525 | 11,024 | 11,549 | 11 | — | ||||||||||||||||||||||||
|
|
|
|
|
|
|
|
|
|
|
|
|
|
|
|
|
|||||||||||||||||
| Total |
$ | 38,128 | $ | 18,678 | $ | 58,879 | $ | 115,685 | $ | 10,812,946 | $ | 10,928,631 | $ | 58,689 | $ | 190 | ||||||||||||||||
|
|
|
|
|
|
|
|
|
|
|
|
|
|
|
|
|
|||||||||||||||||
24
| Variance |
||||||||||||||||||||||||||||||||
| Past due | Past due 90 days or more | |||||||||||||||||||||||||||||||
| (In thousands) |
30-59 days |
60-89 days |
90 days or more |
Total past due |
Current | Loans HIP | Non-accrual loans |
Accruing loans |
||||||||||||||||||||||||
| Commercial multi-family |
$ | 1,858 | $ | (5,443 | ) | $ | — | $ | (3,585 | ) | $ | (21,430 | ) | $ | (25,015 | ) | $ | — | $ | — | ||||||||||||
| Commercial real estate: |
||||||||||||||||||||||||||||||||
| Non-owner occupied |
(6,024 | ) | — | (129 | ) | (6,153 | ) | 116,222 | 110,069 | (129 | ) | — | ||||||||||||||||||||
| Owner occupied |
— | — | (4,960 | ) | (4,960 | ) | (23,728 | ) | (28,688 | ) | (4,960 | ) | — | |||||||||||||||||||
| Commercial and industrial |
(2,612 | ) | (4,590 | ) | (1,059 | ) | (8,261 | ) | 58,558 | 50,297 | (1,058 | ) | (1 | ) | ||||||||||||||||||
| Construction |
— | — | — | — | 77,274 | 77,274 | — | — | ||||||||||||||||||||||||
| Mortgage |
11,796 | (3,813 | ) | (803 | ) | 7,180 | 16,329 | 23,509 | (803 | ) | — | |||||||||||||||||||||
| Consumer: |
||||||||||||||||||||||||||||||||
| Credit cards |
— | — | — | — | (27 | ) | (27 | ) | — | — | ||||||||||||||||||||||
| Home equity lines of credit |
1,321 | (13 | ) | 37 | 1,345 | 2,176 | 3,521 | 37 | — | |||||||||||||||||||||||
| Personal |
(427 | ) | (728 | ) | 293 | (862 | ) | (9,857 | ) | (10,719 | ) | 293 | — | |||||||||||||||||||
| Other |
(513 | ) | — | (6 | ) | (519 | ) | 1,091 | 572 | (6 | ) | — | ||||||||||||||||||||
|
|
|
|
|
|
|
|
|
|
|
|
|
|
|
|
|
|||||||||||||||||
| Total |
$ | 5,399 | $ | (14,587 | ) | $ | (6,627 | ) | $ | (15,815 | ) | $ | 216,608 | $ | 200,793 | $ | (6,626 | ) | $ | (1 | ) | |||||||||||
|
|
|
|
|
|
|
|
|
|
|
|
|
|
|
|
|
|||||||||||||||||
25
Popular, Inc.
Financial Supplement to First Quarter 2025 Earnings Release
Table K - Loan Delinquency - Consolidated
(Unaudited)
| 31-Mar-25 |
||||||||||||||||||||||||||||||||
| Popular, Inc. |
||||||||||||||||||||||||||||||||
| Past due | Past due 90 days or more | |||||||||||||||||||||||||||||||
| (In thousands) |
30-59 days |
60-89 days |
90 days or more |
Total past due |
Current | Loans HIP | Non-accrual loans |
Accruing loans |
||||||||||||||||||||||||
| Commercial multi-family |
$ | 5,245 | $ | 112 | $ | 8,773 | $ | 14,130 | $ | 2,360,785 | $ | 2,374,915 | $ | 8,773 | $ | — | ||||||||||||||||
| Commercial real estate: |
||||||||||||||||||||||||||||||||
| Non-owner occupied |
3,813 | 74 | 14,192 | 18,079 | 5,522,524 | 5,540,603 | 14,192 | — | ||||||||||||||||||||||||
| Owner occupied |
7,512 | 141 | 27,122 | 34,775 | 2,921,784 | 2,956,559 | 27,122 | — | ||||||||||||||||||||||||
| Commercial and industrial |
12,361 | 3,604 | 13,968 | 29,933 | 7,663,590 | 7,693,523 | 10,017 | 3,951 | ||||||||||||||||||||||||
| Construction |
6,498 | — | — | 6,498 | 1,352,481 | 1,358,979 | — | — | ||||||||||||||||||||||||
| Mortgage |
279,656 | 106,770 | 362,644 | 749,070 | 7,524,683 | 8,273,753 | 177,593 | 185,051 | ||||||||||||||||||||||||
| Leasing |
19,178 | 5,192 | 8,895 | 33,265 | 1,916,440 | 1,949,705 | 8,895 | — | ||||||||||||||||||||||||
| Consumer: |
||||||||||||||||||||||||||||||||
| Credit cards |
13,365 | 10,555 | 30,506 | 54,426 | 1,133,351 | 1,187,777 | — | 30,506 | ||||||||||||||||||||||||
| Home equity lines of credit |
1,851 | 973 | 3,448 | 6,272 | 70,837 | 77,109 | 3,430 | 18 | ||||||||||||||||||||||||
| Personal |
20,627 | 11,955 | 20,285 | 52,867 | 1,797,156 | 1,850,023 | 20,285 | — | ||||||||||||||||||||||||
| Auto |
78,743 | 15,893 | 41,784 | 136,420 | 3,683,822 | 3,820,242 | 41,784 | — | ||||||||||||||||||||||||
| Other |
2,687 | 144 | 2,312 | 5,143 | 165,701 | 170,844 | 1,978 | 334 | ||||||||||||||||||||||||
|
|
|
|
|
|
|
|
|
|
|
|
|
|
|
|
|
|||||||||||||||||
| Total |
$ | 451,536 | $ | 155,413 | $ | 533,929 | $ | 1,140,878 | $ | 36,113,154 | $ | 37,254,032 | $ | 314,069 | $ | 219,860 | ||||||||||||||||
|
|
|
|
|
|
|
|
|
|
|
|
|
|
|
|
|
|||||||||||||||||
| 31-Dec-24 |
||||||||||||||||||||||||||||||||
| Popular, Inc. |
||||||||||||||||||||||||||||||||
| Past due | Past due 90 days or more | |||||||||||||||||||||||||||||||
| (In thousands) |
30-59 days |
60-89 days |
90 days or more |
Total past due |
Current | Loans HIP | Non-accrual loans |
Accruing loans |
||||||||||||||||||||||||
| Commercial multi-family |
$ | 1,491 | $ | 5,556 | $ | 8,779 | $ | 15,826 | $ | 2,383,794 | $ | 2,399,620 | $ | 8,779 | $ | — | ||||||||||||||||
| Commercial real estate: |
||||||||||||||||||||||||||||||||
| Non-owner occupied |
9,895 | 586 | 14,444 | 24,925 | 5,338,310 | 5,363,235 | 14,444 | — | ||||||||||||||||||||||||
| Owner occupied |
11,054 | 808 | 30,449 | 42,311 | 3,115,435 | 3,157,746 | 30,449 | — | ||||||||||||||||||||||||
| Commercial and industrial |
16,074 | 8,035 | 25,833 | 49,942 | 7,691,620 | 7,741,562 | 21,083 | 4,750 | ||||||||||||||||||||||||
| Construction |
1,039 | — | — | 1,039 | 1,262,753 | 1,263,792 | — | — | ||||||||||||||||||||||||
| Mortgage |
280,370 | 122,111 | 395,649 | 798,130 | 7,316,053 | 8,114,183 | 188,332 | 207,317 | ||||||||||||||||||||||||
| Leasing |
23,991 | 6,062 | 9,588 | 39,641 | 1,885,764 | 1,925,405 | 9,588 | — | ||||||||||||||||||||||||
| Consumer: |
||||||||||||||||||||||||||||||||
| Credit cards |
17,399 | 11,719 | 29,960 | 59,078 | 1,159,001 | 1,218,079 | — | 29,960 | ||||||||||||||||||||||||
| Home equity lines of credit |
546 | 1,115 | 3,393 | 5,054 | 68,517 | 73,571 | 3,393 | — | ||||||||||||||||||||||||
| Personal |
21,311 | 14,514 | 22,010 | 57,835 | 1,797,409 | 1,855,244 | 22,010 | — | ||||||||||||||||||||||||
| Auto |
111,358 | 27,858 | 51,792 | 191,008 | 3,632,429 | 3,823,437 | 51,792 | — | ||||||||||||||||||||||||
| Other |
2,330 | 277 | 1,323 | 3,930 | 167,848 | 171,778 | 910 | 413 | ||||||||||||||||||||||||
|
|
|
|
|
|
|
|
|
|
|
|
|
|
|
|
|
|||||||||||||||||
| Total |
$ | 496,858 | $ | 198,641 | $ | 593,220 | $ | 1,288,719 | $ | 35,818,933 | $ | 37,107,652 | $ | 350,780 | $ | 242,440 | ||||||||||||||||
|
|
|
|
|
|
|
|
|
|
|
|
|
|
|
|
|
|||||||||||||||||
26
| Variance |
||||||||||||||||||||||||||||||||
| Past due | Past due 90 days or more | |||||||||||||||||||||||||||||||
| (In thousands) |
30-59 days |
60-89 days |
90 days or more |
Total past due |
Current | Loans HIP | Non-accrual loans |
Accruing loans |
||||||||||||||||||||||||
| Commercial multi-family |
$ | 3,754 | $ | (5,444 | ) | $ | (6 | ) | $ | (1,696 | ) | $ | (23,009 | ) | $ | (24,705 | ) | $ | (6 | ) | $ | — | ||||||||||
| Commercial real estate: |
||||||||||||||||||||||||||||||||
| Non-owner occupied |
(6,082 | ) | (512 | ) | (252 | ) | (6,846 | ) | 184,214 | 177,368 | (252 | ) | — | |||||||||||||||||||
| Owner occupied |
(3,542 | ) | (667 | ) | (3,327 | ) | (7,536 | ) | (193,651 | ) | (201,187 | ) | (3,327 | ) | — | |||||||||||||||||
| Commercial and industrial |
(3,713 | ) | (4,431 | ) | (11,865 | ) | (20,009 | ) | (28,030 | ) | (48,039 | ) | (11,066 | ) | (799 | ) | ||||||||||||||||
| Construction |
5,459 | — | — | 5,459 | 89,728 | 95,187 | — | — | ||||||||||||||||||||||||
| Mortgage |
(714 | ) | (15,341 | ) | (33,005 | ) | (49,060 | ) | 208,630 | 159,570 | (10,739 | ) | (22,266 | ) | ||||||||||||||||||
| Leasing |
(4,813 | ) | (870 | ) | (693 | ) | (6,376 | ) | 30,676 | 24,300 | (693 | ) | — | |||||||||||||||||||
| Consumer: |
||||||||||||||||||||||||||||||||
| Credit cards |
(4,034 | ) | (1,164 | ) | 546 | (4,652 | ) | (25,650 | ) | (30,302 | ) | — | 546 | |||||||||||||||||||
| Home equity lines of credit |
1,305 | (142 | ) | 55 | 1,218 | 2,320 | 3,538 | 37 | 18 | |||||||||||||||||||||||
| Personal |
(684 | ) | (2,559 | ) | (1,725 | ) | (4,968 | ) | (253 | ) | (5,221 | ) | (1,725 | ) | — | |||||||||||||||||
| Auto |
(32,615 | ) | (11,965 | ) | (10,008 | ) | (54,588 | ) | 51,393 | (3,195 | ) | (10,008 | ) | — | ||||||||||||||||||
| Other |
357 | (133 | ) | 989 | 1,213 | (2,147 | ) | (934 | ) | 1,068 | (79 | ) | ||||||||||||||||||||
|
|
|
|
|
|
|
|
|
|
|
|
|
|
|
|
|
|||||||||||||||||
| Total |
$ | (45,322 | ) | $ | (43,228 | ) | $ | (59,291 | ) | $ | (147,841 | ) | $ | 294,221 | $ | 146,380 | $ | (36,711 | ) | $ | (22,580 | ) | ||||||||||
|
|
|
|
|
|
|
|
|
|
|
|
|
|
|
|
|
|||||||||||||||||
27
Popular, Inc.
Financial Supplement to First Quarter 2025 Earnings Release
Table L - Non-Performing Assets
(Unaudited)
| Variance | ||||||||||||||||||||||||||||||||
| (In thousands) |
31-Mar-25 | As a % of loans HIP by category |
31-Dec-24 | As a % of loans HIP by category |
31-Mar-24 | As a % of loans HIP by category |
Q1 2025 vs. Q4 2024 |
Q1 2025 vs. Q1 2024 |
||||||||||||||||||||||||
| Non-accrual loans: |
||||||||||||||||||||||||||||||||
| Commercial |
||||||||||||||||||||||||||||||||
| Commercial multi-family |
$ | 8,773 | 0.4 | % | $ | 8,779 | 0.4 | % | $ | 8,806 | 0.4 | % | $ | (6 | ) | $ | (33 | ) | ||||||||||||||
| Commercial real estate non-owner occupied |
14,192 | 0.3 | 14,444 | 0.3 | 10,329 | 0.2 | (252 | ) | 3,863 | |||||||||||||||||||||||
| Commercial real estate owner occupied |
27,122 | 0.9 | 30,449 | 1.0 | 30,001 | 1.0 | (3,327 | ) | (2,879 | ) | ||||||||||||||||||||||
| Commercial and industrial |
10,017 | 0.1 | 21,083 | 0.3 | 35,594 | 0.5 | (11,066 | ) | (25,577 | ) | ||||||||||||||||||||||
| Total Commercial |
60,104 | 0.3 | 74,755 | 0.4 | 84,730 | 0.5 | (14,651 | ) | (24,626 | ) | ||||||||||||||||||||||
| Leasing |
8,895 | 0.5 | 9,588 | 0.5 | 7,267 | 0.4 | (693 | ) | 1,628 | |||||||||||||||||||||||
| Mortgage |
177,593 | 2.1 | 188,332 | 2.3 | 194,544 | 2.5 | (10,739 | ) | (16,951 | ) | ||||||||||||||||||||||
| Consumer |
||||||||||||||||||||||||||||||||
| Home equity lines of credit |
3,430 | 4.4 | 3,393 | 4.6 | 3,986 | 6.0 | 37 | (556 | ) | |||||||||||||||||||||||
| Personal |
20,285 | 1.1 | 22,010 | 1.2 | 21,160 | 1.1 | (1,725 | ) | (875 | ) | ||||||||||||||||||||||
| Auto |
41,784 | 1.1 | 51,792 | 1.4 | 41,807 | 1.1 | (10,008 | ) | (23 | ) | ||||||||||||||||||||||
| Other |
1,978 | 1.2 | 910 | 0.5 | 633 | 0.4 | 1,068 | 1,345 | ||||||||||||||||||||||||
| Total Consumer |
67,477 | 0.9 | 78,105 | 1.1 | 67,586 | 1.0 | (10,628 | ) | (109 | ) | ||||||||||||||||||||||
|
|
|
|
|
|
|
|
|
|
|
|
|
|
|
|
|
|||||||||||||||||
| Total non-performing loans held-in-portfolio |
314,069 | 0.8 | % | 350,780 | 0.9 | % | 354,127 | 1.0 | % | (36,711 | ) | (40,058 | ) | |||||||||||||||||||
| Other real estate owned (“OREO”) |
52,114 | 57,268 | 80,542 | (5,154 | ) | (28,428 | ) | |||||||||||||||||||||||||
|
|
|
|
|
|
|
|
|
|
|
|||||||||||||||||||||||
| Total non-performing assets [1] |
$ | 366,183 | $ | 408,048 | $ | 434,669 | $ | (41,865 | ) | $ | (68,486 | ) | ||||||||||||||||||||
|
|
|
|
|
|
|
|
|
|
|
|||||||||||||||||||||||
| Accruing loans past due 90 days or more [2] |
$ | 219,860 | $ | 242,440 | $ | 247,542 | $ | (22,580 | ) | $ | (27,682 | ) | ||||||||||||||||||||
|
|
|
|
|
|
|
|
|
|
|
|||||||||||||||||||||||
| Ratios: |
||||||||||||||||||||||||||||||||
| Non-performing assets to total assets |
0.49 | % | 0.56 | % | 0.61 | % | ||||||||||||||||||||||||||
| Non-performing loans held-in-portfolio to loans held-in-portfolio |
0.84 | 0.95 | 1.01 | |||||||||||||||||||||||||||||
| Allowance for credit losses to loans held-in-portfolio |
2.05 | 2.01 | 2.11 | |||||||||||||||||||||||||||||
| Allowance for credit losses to non-performing loans, excluding loans held-for-sale |
242.67 | 212.68 | 208.84 | |||||||||||||||||||||||||||||
| [1] | There were no non-performing loans held-for-sale as of March 31, 2025, December 31, 2024 and March 31, 2024. |
| [2] | It is the Corporation’s policy to report delinquent residential mortgage loans insured by FHA or guaranteed by the VA as accruing loans past due 90 days or more as opposed to non-performing since the principal repayment is insured. The balance of these loans includes $7 million at March 31, 2025, related to the rebooking of loans previously pooled into GNMA securities, in which the Corporation had a buy-back option as further described below (December 31, 2024 - $9 million; March 31, 2024 - $10 million). Under the GNMA program, issuers such as BPPR have the option but not the obligation to repurchase loans that are 90 days or more past due. For accounting purposes, these loans subject to the repurchase option are required to be reflected (rebooked) on the financial statements of BPPR with an offsetting liability. These balances include $57 million of residential mortgage loans insured by FHA or guaranteed by the VA that are no longer accruing interest as of March 31, 2025 (December 31, 2024 - $65 million; March 31, 2024 - $93 million). Furthermore, the Corporation has approximately $30 million reverse mortgage loans which are guaranteed by FHA, but which are currently not accruing interest in this period. Due to the guaranteed nature of the loans, it is the Corporation’s policy to exclude these balances from non-performing assets (December 31, 2024- $31 million; March 31, 2024 - $37 million). |
28
Popular, Inc.
Financial Supplement to First Quarter 2025 Earnings Release
Table M - Activity in Non-Performing Loans
(Unaudited)
Commercial loans held-in-portfolio:
| Quarter ended 31-Mar-25 |
Quarter ended 31-Dec-24 |
|||||||||||||||||||||||
| (In thousands) |
BPPR | Popular U.S. | Popular, Inc. | BPPR | Popular U.S. | Popular, Inc. | ||||||||||||||||||
| Beginning balance NPLs |
$ | 51,101 | $ | 23,654 | $ | 74,755 | $ | 53,819 | $ | 38,476 | $ | 92,295 | ||||||||||||
| Plus: |
||||||||||||||||||||||||
| New non-performing loans |
5,781 | 5,413 | 11,194 | 2,915 | 9,203 | 12,118 | ||||||||||||||||||
| Advances on existing non-performing loans |
— | 17 | 17 | — | 9 | 9 | ||||||||||||||||||
| Less: |
||||||||||||||||||||||||
| Non-performing loans transferred to OREO |
(120 | ) | — | (120 | ) | (78 | ) | — | (78 | ) | ||||||||||||||
| Non-performing loans charged-off |
(739 | ) | (1,130 | ) | (1,869 | ) | (701 | ) | (835 | ) | (1,536 | ) | ||||||||||||
| Loans returned to accrual status / loan collections |
(13,426 | ) | (10,447 | ) | (23,873 | ) | (4,854 | ) | (23,199 | ) | (28,053 | ) | ||||||||||||
|
|
|
|
|
|
|
|
|
|
|
|
|
|||||||||||||
| Ending balance NPLs |
$ | 42,597 | $ | 17,507 | $ | 60,104 | $ | 51,101 | $ | 23,654 | $ | 74,755 | ||||||||||||
|
|
|
|
|
|
|
|
|
|
|
|
|
|||||||||||||
Mortgage loans held-in-portfolio:
| Quarter ended 31-Mar-25 |
Quarter ended 31-Dec-24 |
|||||||||||||||||||||||
| (In thousands) |
BPPR | Popular U.S. | Popular, Inc. | BPPR | Popular U.S. | Popular, Inc. | ||||||||||||||||||
| Beginning balance NPLs |
$ | 158,442 | $ | 29,890 | $ | 188,332 | $ | 157,920 | $ | 28,434 | $ | 186,354 | ||||||||||||
| Plus: |
||||||||||||||||||||||||
| New non-performing loans |
31,242 | 2,745 | 33,987 | 44,670 | 4,637 | 49,307 | ||||||||||||||||||
| Advances on existing non-performing loans |
— | 1 | 1 | — | 21 | 21 | ||||||||||||||||||
| Less: |
||||||||||||||||||||||||
| Non-performing loans transferred to OREO |
(2,435 | ) | — | (2,435 | ) | (3,829 | ) | — | (3,829 | ) | ||||||||||||||
| Non-performing loans charged-off |
(188 | ) | — | (188 | ) | (12 | ) | — | (12 | ) | ||||||||||||||
| Loans returned to accrual status / loan collections |
(38,555 | ) | (3,549 | ) | (42,104 | ) | (40,307 | ) | (3,202 | ) | (43,509 | ) | ||||||||||||
|
|
|
|
|
|
|
|
|
|
|
|
|
|||||||||||||
| Ending balance NPLs |
$ | 148,506 | $ | 29,087 | $ | 177,593 | $ | 158,442 | $ | 29,890 | $ | 188,332 | ||||||||||||
|
|
|
|
|
|
|
|
|
|
|
|
|
|||||||||||||
Total non-performing loans held-in-portfolio (excluding consumer):
| Quarter ended 31-Mar-25 |
Quarter ended 31-Dec-24 |
|||||||||||||||||||||||
| (In thousands) |
BPPR | Popular U.S. | Popular, Inc. | BPPR | Popular U.S. | Popular, Inc. | ||||||||||||||||||
| Beginning balance NPLs |
$ | 209,543 | $ | 53,544 | $ | 263,087 | $ | 211,739 | $ | 66,910 | $ | 278,649 | ||||||||||||
| Plus: |
||||||||||||||||||||||||
| New non-performing loans |
37,023 | 8,158 | 45,181 | 47,585 | 13,840 | 61,425 | ||||||||||||||||||
| Advances on existing non-performing loans |
— | 18 | 18 | — | 30 | 30 | ||||||||||||||||||
| Less: |
||||||||||||||||||||||||
| Non-performing loans transferred to OREO |
(2,555 | ) | — | (2,555 | ) | (3,907 | ) | — | (3,907 | ) | ||||||||||||||
| Non-performing loans charged-off |
(927 | ) | (1,130 | ) | (2,057 | ) | (713 | ) | (835 | ) | (1,548 | ) | ||||||||||||
| Loans returned to accrual status / loan collections |
(51,981 | ) | (13,996 | ) | (65,977 | ) | (45,161 | ) | (26,401 | ) | (71,562 | ) | ||||||||||||
|
|
|
|
|
|
|
|
|
|
|
|
|
|||||||||||||
| Ending balance NPLs |
$ | 191,103 | $ | 46,594 | $ | 237,697 | $ | 209,543 | $ | 53,544 | $ | 263,087 | ||||||||||||
|
|
|
|
|
|
|
|
|
|
|
|
|
|||||||||||||
29
Popular, Inc.
Financial Supplement to First Quarter 2025 Earnings Release
Table N - Allowance for Credit Losses, Net Charge-offs and Related Ratios
(Unaudited)
| Quarters ended | ||||||||||||
| (In thousands) |
31-Mar-25 | 31-Dec-24 | 31-Mar-24 | |||||||||
| Balance at beginning of period - loans held-in-portfolio |
$ | 746,024 | $ | 744,320 | $ | 729,341 | ||||||
| Provision for credit losses |
65,218 | 69,129 | 72,386 | |||||||||
| Initial allowance for credit losses - PCD Loans |
9 | 8 | 17 | |||||||||
|
|
|
|
|
|
|
|||||||
| 811,251 | 813,457 | 801,744 | ||||||||||
|
|
|
|
|
|
|
|||||||
| Net loans charge-off (recovered)- BPPR |
||||||||||||
| Commercial: |
||||||||||||
| Commercial multi-family |
(2 | ) | (2 | ) | (1 | ) | ||||||
| Commercial real estate non-owner occupied |
(595 | ) | (369 | ) | (325 | ) | ||||||
| Commercial real estate owner occupied |
(406 | ) | (473 | ) | 2,247 | |||||||
| Commercial and industrial |
(1,528 | ) | 2,000 | 5,109 | ||||||||
| Total Commercial |
(2,531 | ) | 1,156 | 7,030 | ||||||||
| Leasing |
3,272 | 3,615 | 3,685 | |||||||||
| Mortgage |
(2,497 | ) | (1,938 | ) | (4,426 | ) | ||||||
| Consumer: |
||||||||||||
| Credit cards |
16,429 | 16,854 | 13,958 | |||||||||
| Home equity lines of credit |
(114 | ) | (65 | ) | 104 | |||||||
| Personal |
18,338 | 23,358 | 21,940 | |||||||||
| Auto |
13,487 | 19,028 | 13,846 | |||||||||
| Other Consumer |
718 | 596 | 424 | |||||||||
| Total Consumer |
48,858 | 59,771 | 50,272 | |||||||||
|
|
|
|
|
|
|
|||||||
| Total net charged-off BPPR |
$ | 47,102 | $ | 62,604 | $ | 56,561 | ||||||
|
|
|
|
|
|
|
|||||||
| Net loans charge-off (recovered) - Popular U.S. |
||||||||||||
| Commercial: |
||||||||||||
| Commercial multi-family |
(1 | ) | (1 | ) | 440 | |||||||
| Commercial real estate non-owner occupied |
— | (362 | ) | (64 | ) | |||||||
| Commercial real estate owner occupied |
(511 | ) | 135 | (24 | ) | |||||||
| Commercial and industrial |
925 | 1,445 | 408 | |||||||||
| Total Commercial |
413 | 1,217 | 760 | |||||||||
| Mortgage |
(185 | ) | (27 | ) | (25 | ) | ||||||
| Consumer: |
||||||||||||
| Home equity lines of credit |
(237 | ) | (104 | ) | (148 | ) | ||||||
| Personal |
1,989 | 3,728 | 5,027 | |||||||||
| Other Consumer |
21 | 15 | 25 | |||||||||
| Total Consumer |
1,773 | 3,639 | 4,904 | |||||||||
|
|
|
|
|
|
|
|||||||
| Total net charged-off Popular U.S. |
$ | 2,001 | $ | 4,829 | $ | 5,639 | ||||||
|
|
|
|
|
|
|
|||||||
| Total loans net charged-off - Popular, Inc. |
$ | 49,103 | $ | 67,433 | $ | 62,200 | ||||||
|
|
|
|
|
|
|
|||||||
| Balance at end of period - loans held-in-portfolio |
$ | 762,148 | $ | 746,024 | $ | 739,544 | ||||||
|
|
|
|
|
|
|
|||||||
| Balance at beginning of period - unfunded commitments |
$ | 15,470 | $ | 18,384 | $ | 17,006 | ||||||
| Provision for credit losses (benefit) |
(1,301 | ) | (2,914 | ) | (239 | ) | ||||||
|
|
|
|
|
|
|
|||||||
| Balance at end of period - unfunded commitments [1] |
$ | 14,169 | $ | 15,470 | $ | 16,767 | ||||||
|
|
|
|
|
|
|
|||||||
30
| POPULAR, INC. |
||||||||||||
| Annualized net charge-offs (recoveries) to average loans held-in-portfolio |
0.53 | % | 0.74 | % | 0.71 | % | ||||||
| Provision for credit losses (benefit) - loan portfolios to net charge-offs |
132.82 | % | 102.52 | % | 116.38 | % | ||||||
| BPPR |
||||||||||||
| Annualized net charge-offs (recoveries) to average loans held-in-portfolio |
0.72 | % | 0.97 | % | 0.92 | % | ||||||
| Provision for credit losses (benefit) - loan portfolios to net charge-offs |
111.86 | % | 107.16 | % | 107.86 | % | ||||||
| Popular U.S. |
||||||||||||
| Annualized net charge-offs (recoveries) to average loans held-in-portfolio |
0.07 | % | 0.18 | % | 0.21 | % | ||||||
| Provision for credit losses (benefit) - loan portfolios to net charge-offs |
626.09 | % | 42.27 | % | 201.77 | % |
| [1] | Allowance for credit losses of unfunded commitments is presented as part of Other Liabilities in the Consolidated Statements of Financial Condition. |
31
Popular, Inc.
Financial Supplement to First Quarter 2025 Earnings Release
Table O - Allowance for Credit Losses “ACL”- Loan Portfolios - BPPR Operations
(Unaudited)
| 31-Mar-25 |
||||||||||||
| BPPR |
||||||||||||
| (In thousands) |
Total ACL | Total loans held-in-portfolio | ACL to loans held-in-portfolio | |||||||||
| Commercial: |
||||||||||||
| Commercial multi-family |
$ | 3,420 | $ | 308,311 | 1.11 | % | ||||||
| Commercial real estate - non-owner occupied |
42,848 | 3,313,802 | 1.29 | % | ||||||||
| Commercial real estate - owner occupied |
36,019 | 1,203,412 | 2.99 | % | ||||||||
| Commercial and industrial |
131,407 | 5,248,558 | 2.50 | % | ||||||||
|
|
|
|
|
|
|
|||||||
| Total commercial |
$ | 213,694 | $ | 10,074,083 | 2.12 | % | ||||||
|
|
|
|
|
|
|
|||||||
| Construction |
2,719 | 230,203 | 1.18 | % | ||||||||
| Mortgage |
74,289 | 6,945,942 | 1.07 | % | ||||||||
| Leasing |
20,206 | 1,949,705 | 1.04 | % | ||||||||
| Consumer: |
||||||||||||
| Credit cards |
96,523 | 1,187,778 | 8.13 | % | ||||||||
| Home equity lines of credit |
60 | 2,057 | 2.92 | % | ||||||||
| Personal |
89,786 | 1,755,875 | 5.11 | % | ||||||||
| Auto |
171,979 | 3,820,242 | 4.50 | % | ||||||||
| Other |
7,007 | 158,723 | 4.41 | % | ||||||||
|
|
|
|
|
|
|
|||||||
| Total consumer |
$ | 365,355 | $ | 6,924,675 | 5.28 | % | ||||||
|
|
|
|
|
|
|
|||||||
| Total |
$ | 676,263 | $ | 26,124,608 | 2.59 | % | ||||||
|
|
|
|
|
|
|
|||||||
| 31-Dec-24 |
||||||||||||
| BPPR |
||||||||||||
| (In thousands) |
Total ACL | Total loans held-in-portfolio | ACL to loans held-in-portfolio | |||||||||
| Commercial: |
||||||||||||
| Commercial multi-family |
$ | 2,783 | $ | 308,001 | 0.90 | % | ||||||
| Commercial real estate - non-owner occupied |
44,852 | 3,246,503 | 1.38 | % | ||||||||
| Commercial real estate - owner occupied |
37,355 | 1,375,911 | 2.71 | % | ||||||||
| Commercial and industrial |
130,136 | 5,346,894 | 2.43 | % | ||||||||
|
|
|
|
|
|
|
|||||||
| Total commercial |
$ | 215,126 | $ | 10,277,309 | 2.09 | % | ||||||
|
|
|
|
|
|
|
|||||||
| Construction |
2,743 | 212,290 | 1.29 | % | ||||||||
| Mortgage |
72,901 | 6,809,881 | 1.07 | % | ||||||||
| Leasing |
16,419 | 1,925,405 | 0.85 | % | ||||||||
| Consumer: |
||||||||||||
| Credit cards |
99,130 | 1,218,053 | 8.14 | % | ||||||||
| Home equity lines of credit |
54 | 2,040 | 2.65 | % | ||||||||
| Personal |
91,296 | 1,750,377 | 5.22 | % | ||||||||
| Auto |
165,995 | 3,823,437 | 4.34 | % | ||||||||
| Other |
7,002 | 160,229 | 4.37 | % | ||||||||
|
|
|
|
|
|
|
|||||||
| Total consumer |
$ | 363,477 | $ | 6,954,136 | 5.23 | % | ||||||
|
|
|
|
|
|
|
|||||||
| Total |
$ | 670,666 | $ | 26,179,021 | 2.56 | % | ||||||
|
|
|
|
|
|
|
|||||||
32
| Variance |
||||||||||||
| (In thousands) |
Total ACL | Total loans held-in-portfolio | ACL to loans held-in-portfolio | |||||||||
| Commercial: |
||||||||||||
| Commercial multi-family |
$ | 637 | $ | 310 | 0.21 | % | ||||||
| Commercial real estate - non-owner occupied |
(2,004 | ) | 67,299 | (0.09 | )% | |||||||
| Commercial real estate - owner occupied |
(1,336 | ) | (172,499 | ) | 0.28 | % | ||||||
| Commercial and industrial |
1,271 | (98,336 | ) | 0.07 | % | |||||||
|
|
|
|
|
|
|
|||||||
| Total commercial |
$ | (1,432 | ) | $ | (203,226 | ) | 0.03 | % | ||||
|
|
|
|
|
|
|
|||||||
| Construction |
(24 | ) | 17,913 | (0.11 | )% | |||||||
| Mortgage |
1,388 | 136,061 | — | % | ||||||||
| Leasing |
3,787 | 24,300 | 0.19 | % | ||||||||
| Consumer: |
||||||||||||
| Credit cards |
(2,607 | ) | (30,275 | ) | (0.01 | )% | ||||||
| Home equity lines of credit |
6 | 17 | 0.27 | % | ||||||||
| Personal |
(1,510 | ) | 5,498 | (0.11 | )% | |||||||
| Auto |
5,984 | (3,195 | ) | 0.16 | % | |||||||
| Other |
5 | (1,506 | ) | 0.04 | % | |||||||
|
|
|
|
|
|
|
|||||||
| Total consumer |
$ | 1,878 | $ | (29,461 | ) | 0.05 | % | |||||
|
|
|
|
|
|
|
|||||||
| Total |
$ | 5,597 | $ | (54,413 | ) | 0.03 | % | |||||
|
|
|
|
|
|
|
|||||||
33
Popular, Inc.
Financial Supplement to First Quarter 2025 Earnings Release
Table P - Allowance for Credit Losses “ACL”- Loan Portfolios - POPULAR U.S. Operations
(Unaudited)
| 31-Mar-25 |
||||||||||||
| Popular U.S. |
||||||||||||
| (In thousands) |
Total ACL | Total loans held-in-portfolio | ACL to loans held-in-portfolio | |||||||||
| Commercial: |
||||||||||||
| Commercial multi-family |
$ | 10,081 | $ | 2,066,604 | 0.49 | % | ||||||
| Commercial real estate - non-owner occupied |
15,453 | 2,226,801 | 0.69 | % | ||||||||
| Commercial real estate - owner occupied |
14,193 | 1,753,147 | 0.81 | % | ||||||||
| Commercial and industrial |
16,422 | 2,444,965 | 0.67 | % | ||||||||
|
|
|
|
|
|
|
|||||||
| Total commercial |
$ | 56,149 | $ | 8,491,517 | 0.66 | % | ||||||
|
|
|
|
|
|
|
|||||||
| Construction |
6,793 | 1,128,776 | 0.60 | % | ||||||||
| Mortgage |
9,740 | 1,327,811 | 0.73 | % | ||||||||
| Consumer: |
||||||||||||
| Credit cards |
— | (1 | ) | — | % | |||||||
| Home equity lines of credit |
1,550 | 75,052 | 2.07 | % | ||||||||
| Personal |
11,651 | 94,148 | 12.38 | % | ||||||||
| Other |
2 | 12,121 | 0.02 | % | ||||||||
|
|
|
|
|
|
|
|||||||
| Total consumer |
$ | 13,203 | $ | 181,320 | 7.28 | % | ||||||
|
|
|
|
|
|
|
|||||||
| Total |
$ | 85,885 | $ | 11,129,424 | 0.77 | % | ||||||
|
|
|
|
|
|
|
|||||||
| 31-Dec-24 |
||||||||||||
| Popular U.S. |
||||||||||||
| (In thousands) |
Total ACL | Total loans held-in-portfolio | ACL to loans held-in-portfolio | |||||||||
| Commercial: |
||||||||||||
| Commercial multi-family |
$ | 6,453 | $ | 2,091,619 | 0.31 | % | ||||||
| Commercial real estate - non-owner occupied |
9,642 | 2,116,732 | 0.46 | % | ||||||||
| Commercial real estate - owner occupied |
12,473 | 1,781,835 | 0.70 | % | ||||||||
| Commercial and industrial |
15,870 | 2,394,668 | 0.66 | % | ||||||||
|
|
|
|
|
|
|
|||||||
| Total commercial |
$ | 44,438 | $ | 8,384,854 | 0.53 | % | ||||||
|
|
|
|
|
|
|
|||||||
| Construction |
8,521 | 1,051,502 | 0.81 | % | ||||||||
| Mortgage |
9,508 | 1,304,302 | 0.73 | % | ||||||||
| Consumer: |
||||||||||||
| Credit cards |
— | 26 | — | % | ||||||||
| Home equity lines of credit |
1,449 | 71,531 | 2.03 | % | ||||||||
| Personal |
11,440 | 104,867 | 10.91 | % | ||||||||
| Other |
2 | 11,549 | 0.02 | % | ||||||||
|
|
|
|
|
|
|
|||||||
| Total consumer |
$ | 12,891 | $ | 187,973 | 6.86 | % | ||||||
|
|
|
|
|
|
|
|||||||
| Total |
$ | 75,358 | $ | 10,928,631 | 0.69 | % | ||||||
|
|
|
|
|
|
|
|||||||
34
| Variance |
||||||||||||
| (In thousands) |
Total ACL | Total loans held-in-portfolio | ACL to loans held-in-portfolio | |||||||||
| Commercial: |
||||||||||||
| Commercial multi-family |
$ | 3,628 | $ | (25,015 | ) | 0.18 | % | |||||
| Commercial real estate - non-owner occupied |
5,811 | 110,069 | 0.23 | % | ||||||||
| Commercial real estate - owner occupied |
1,720 | (28,688 | ) | 0.11 | % | |||||||
| Commercial and industrial |
552 | 50,297 | 0.01 | % | ||||||||
|
|
|
|
|
|
|
|||||||
| Total commercial |
$ | 11,711 | $ | 106,663 | 0.13 | % | ||||||
|
|
|
|
|
|
|
|||||||
| Construction |
(1,728 | ) | 77,274 | (0.21 | )% | |||||||
| Mortgage |
232 | 23,509 | — | % | ||||||||
| Consumer: |
||||||||||||
| Credit cards |
— | (27 | ) | — | % | |||||||
| Home equity lines of credit |
101 | 3,521 | 0.04 | % | ||||||||
| Personal |
211 | (10,719 | ) | 1.47 | % | |||||||
| Other |
— | 572 | — | % | ||||||||
|
|
|
|
|
|
|
|||||||
| Total consumer |
$ | 312 | $ | (6,653 | ) | 0.42 | % | |||||
|
|
|
|
|
|
|
|||||||
| Total |
$ | 10,527 | $ | 200,793 | 0.08 | % | ||||||
|
|
|
|
|
|
|
|||||||
35
Popular, Inc.
Financial Supplement to First Quarter 2025 Earnings Release
Table Q - Allowance for Credit Losses “ACL”- Loan Portfolios - Consolidated
(Unaudited)
| 31-Mar-25 |
||||||||||||
| (In thousands) |
Total ACL | Total loans held-in-portfolio | ACL to loans held-in-portfolio | |||||||||
| Commercial: |
||||||||||||
| Commercial multi-family |
$ | 13,501 | $ | 2,374,915 | 0.57 | % | ||||||
| Commercial real estate - non-owner occupied |
58,301 | 5,540,603 | 1.05 | % | ||||||||
| Commercial real estate - owner occupied |
50,212 | 2,956,559 | 1.70 | % | ||||||||
| Commercial and industrial |
147,829 | 7,693,523 | 1.92 | % | ||||||||
|
|
|
|
|
|
|
|||||||
| Total commercial |
$ | 269,843 | $ | 18,565,600 | 1.45 | % | ||||||
|
|
|
|
|
|
|
|||||||
| Construction |
9,512 | 1,358,979 | 0.70 | % | ||||||||
| Mortgage |
84,029 | 8,273,753 | 1.02 | % | ||||||||
| Leasing |
20,206 | 1,949,705 | 1.04 | % | ||||||||
| Consumer: |
||||||||||||
| Credit cards |
96,523 | 1,187,777 | 8.13 | % | ||||||||
| Home equity lines of credit |
1,610 | 77,109 | 2.09 | % | ||||||||
| Personal |
101,437 | 1,850,023 | 5.48 | % | ||||||||
| Auto |
171,979 | 3,820,242 | 4.50 | % | ||||||||
| Other |
7,009 | 170,844 | 4.10 | % | ||||||||
|
|
|
|
|
|
|
|||||||
| Total consumer |
$ | 378,558 | $ | 7,105,995 | 5.33 | % | ||||||
|
|
|
|
|
|
|
|||||||
| Total |
$ | 762,148 | $ | 37,254,032 | 2.05 | % | ||||||
|
|
|
|
|
|
|
|||||||
| 31-Dec-24 |
||||||||||||
| (In thousands) |
Total ACL | Total loans held-in-portfolio | ACL to loans held-in-portfolio | |||||||||
| Commercial: |
||||||||||||
| Commercial multi-family |
$ | 9,236 | $ | 2,399,620 | 0.38 | % | ||||||
| Commercial real estate - non-owner occupied |
54,494 | 5,363,235 | 1.02 | % | ||||||||
| Commercial real estate - owner occupied |
49,828 | 3,157,746 | 1.58 | % | ||||||||
| Commercial and industrial |
146,006 | 7,741,562 | 1.89 | % | ||||||||
|
|
|
|
|
|
|
|||||||
| Total commercial |
$ | 259,564 | $ | 18,662,163 | 1.39 | % | ||||||
|
|
|
|
|
|
|
|||||||
| Construction |
11,264 | 1,263,792 | 0.89 | % | ||||||||
| Mortgage |
82,409 | 8,114,183 | 1.02 | % | ||||||||
| Leasing |
16,419 | 1,925,405 | 0.85 | % | ||||||||
| Consumer: |
||||||||||||
| Credit cards |
99,130 | 1,218,079 | 8.14 | % | ||||||||
| Home equity lines of credit |
1,503 | 73,571 | 2.04 | % | ||||||||
| Personal |
102,736 | 1,855,244 | 5.54 | % | ||||||||
| Auto |
165,995 | 3,823,437 | 4.34 | % | ||||||||
| Other |
7,004 | 171,778 | 4.08 | % | ||||||||
|
|
|
|
|
|
|
|||||||
| Total consumer |
$ | 376,368 | $ | 7,142,109 | 5.27 | % | ||||||
|
|
|
|
|
|
|
|||||||
| Total |
$ | 746,024 | $ | 37,107,652 | 2.01 | % | ||||||
|
|
|
|
|
|
|
|||||||
36
| Variance |
||||||||||||
| (In thousands) |
Total ACL | Total loans held-in-portfolio | ACL to loans held-in-portfolio | |||||||||
| Commercial: |
||||||||||||
| Commercial multi-family |
$ | 4,265 | $ | (24,705 | ) | 0.19 | % | |||||
| Commercial real estate - non-owner occupied |
3,807 | 177,368 | 0.03 | % | ||||||||
| Commercial real estate - owner occupied |
384 | (201,187 | ) | 0.12 | % | |||||||
| Commercial and industrial |
1,823 | (48,039 | ) | 0.03 | % | |||||||
|
|
|
|
|
|
|
|||||||
| Total commercial |
$ | 10,279 | $ | (96,563 | ) | 0.06 | % | |||||
|
|
|
|
|
|
|
|||||||
| Construction |
(1,752 | ) | 95,187 | (0.19 | )% | |||||||
| Mortgage |
1,620 | 159,570 | — | % | ||||||||
| Leasing |
3,787 | 24,300 | 0.19 | % | ||||||||
| Consumer: |
||||||||||||
| Credit cards |
(2,607 | ) | (30,302 | ) | (0.01 | )% | ||||||
| Home equity lines of credit |
107 | 3,538 | 0.05 | % | ||||||||
| Personal |
(1,299 | ) | (5,221 | ) | (0.06 | )% | ||||||
| Auto |
5,984 | (3,195 | ) | 0.16 | % | |||||||
| Other |
5 | (934 | ) | 0.02 | % | |||||||
|
|
|
|
|
|
|
|||||||
| Total consumer |
$ | 2,190 | $ | (36,114 | ) | 0.06 | % | |||||
|
|
|
|
|
|
|
|||||||
| Total |
$ | 16,124 | $ | 146,380 | 0.04 | % | ||||||
|
|
|
|
|
|
|
|||||||
37
Popular, Inc.
Financial Supplement to First Quarter 2025 Earnings Release
Table R - Reconciliation to GAAP Financial Measures
(Unaudited)
| (In thousands, except share or per share information) |
31-Mar-25 | 31-Dec-24 | 31-Mar-24 | |||||||||
| Total stockholders’ equity |
$ | 5,799,695 | $ | 5,613,066 | $ | 5,177,314 | ||||||
| Less: Preferred stock |
(22,143 | ) | (22,143 | ) | (22,143 | ) | ||||||
| Less: Goodwill |
(802,954 | ) | (802,954 | ) | (804,428 | ) | ||||||
| Less: Other intangibles |
(6,229 | ) | (6,826 | ) | (8,969 | ) | ||||||
|
|
|
|
|
|
|
|||||||
| Total tangible common equity |
$ | 4,968,369 | $ | 4,781,143 | $ | 4,341,774 | ||||||
|
|
|
|
|
|
|
|||||||
| Total assets |
$ | 74,038,606 | $ | 73,045,383 | $ | 70,936,939 | ||||||
| Less: Goodwill |
(802,954 | ) | (802,954 | ) | (804,428 | ) | ||||||
| Less: Other intangibles |
(6,229 | ) | (6,826 | ) | (8,969 | ) | ||||||
|
|
|
|
|
|
|
|||||||
| Total tangible assets |
$ | 73,229,423 | $ | 72,235,603 | $ | 70,123,542 | ||||||
|
|
|
|
|
|
|
|||||||
| Tangible common equity to tangible assets |
6.78 | % | 6.62 | % | 6.19 | % | ||||||
| Common shares outstanding at end of period |
68,984,148 | 70,141,291 | 72,284,875 | |||||||||
| Tangible book value per common share |
$ | 72.02 | $ | 68.16 | $ | 60.06 | ||||||
| Quarterly average | ||||||||||||
| Total stockholders’ equity [1] |
$ | 6,785,208 | $ | 6,620,766 | $ | 6,198,740 | ||||||
| Average unrealized (gains) losses on AFS securities transferred to HTM |
370,695 | 505,791 | 639,226 | |||||||||
|
|
|
|
|
|
|
|||||||
| Adjusted total stockholder’s equity |
7,155,903 | 7,126,557 | 6,837,966 | |||||||||
|
|
|
|
|
|
|
|||||||
| Less: Preferred Stock |
(22,143 | ) | (22,143 | ) | (22,143 | ) | ||||||
| Less: Goodwill |
(802,953 | ) | (804,411 | ) | (804,427 | ) | ||||||
| Less: Other intangibles |
(6,585 | ) | (7,288 | ) | (9,490 | ) | ||||||
|
|
|
|
|
|
|
|||||||
| Total tangible equity |
$ | 6,324,222 | $ | 6,292,715 | $ | 6,001,906 | ||||||
| Return on average tangible common equity |
11.36 | % | 11.22 | % | 6.90 | % | ||||||
| [1] | Average balances exclude unrealized gains or losses on debt securities available-for-sale. |
CONTACTS:
Popular, Inc.
Investor Relations:
Paul J. Cardillo, 212-417-6721
Senior Vice President and Investor Relations Officer
or
Media Relations:
MC González Noguera, 917-804-5253
Executive Vice President and Chief Communications & Public Affairs Officer
38