EXHIBIT 99.1

Broadridge Reports Second Quarter Fiscal Year 2021 Results
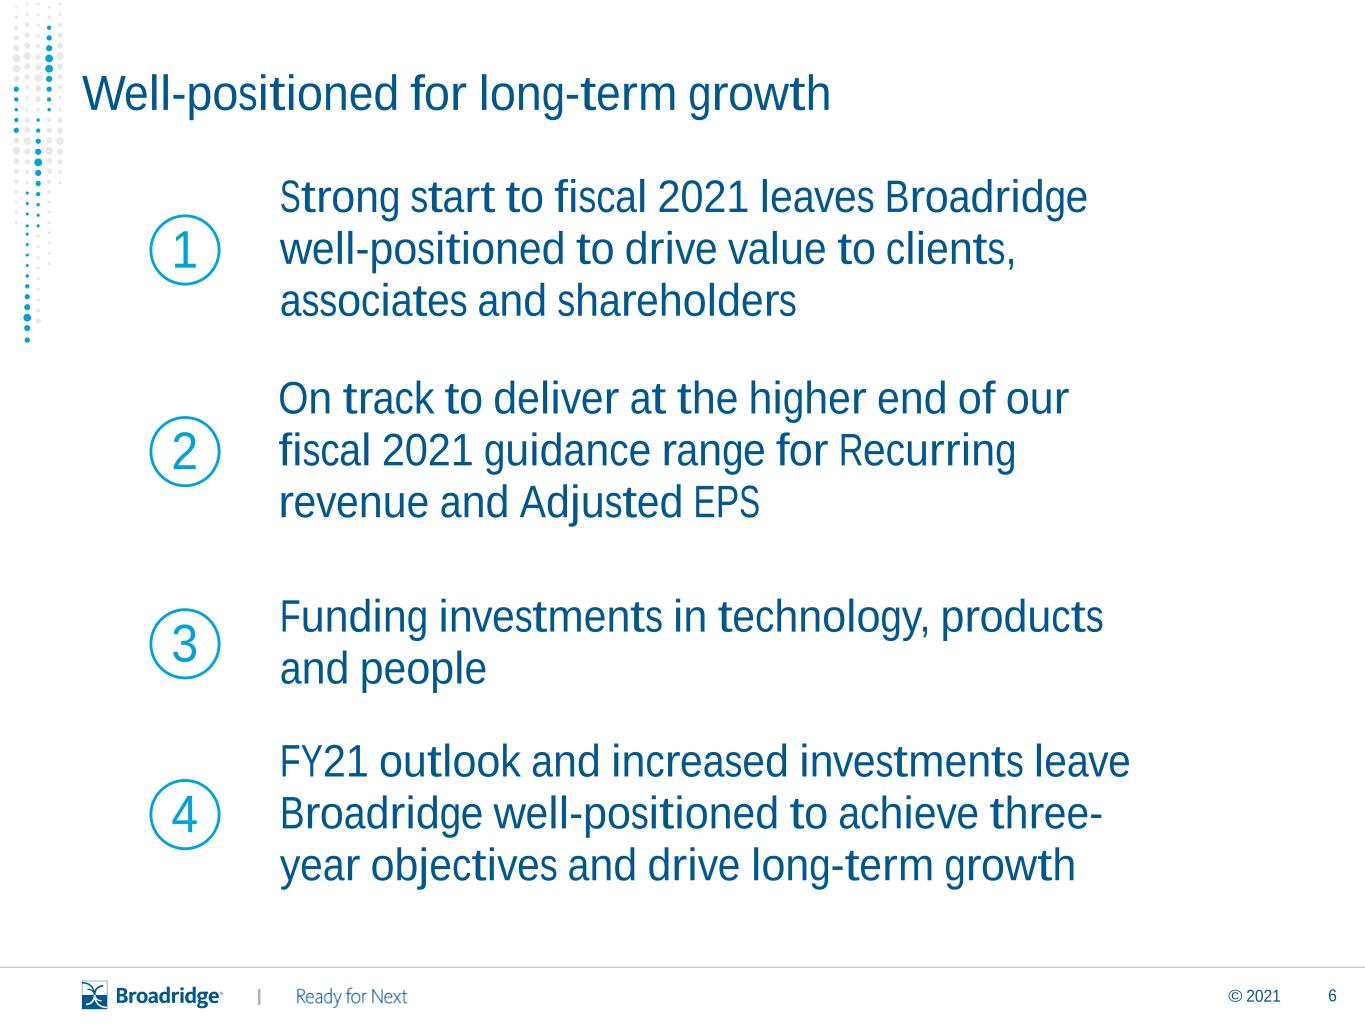
Expecting FY 2021 Recurring Revenue and Adjusted EPS growth at higher end of guidance range
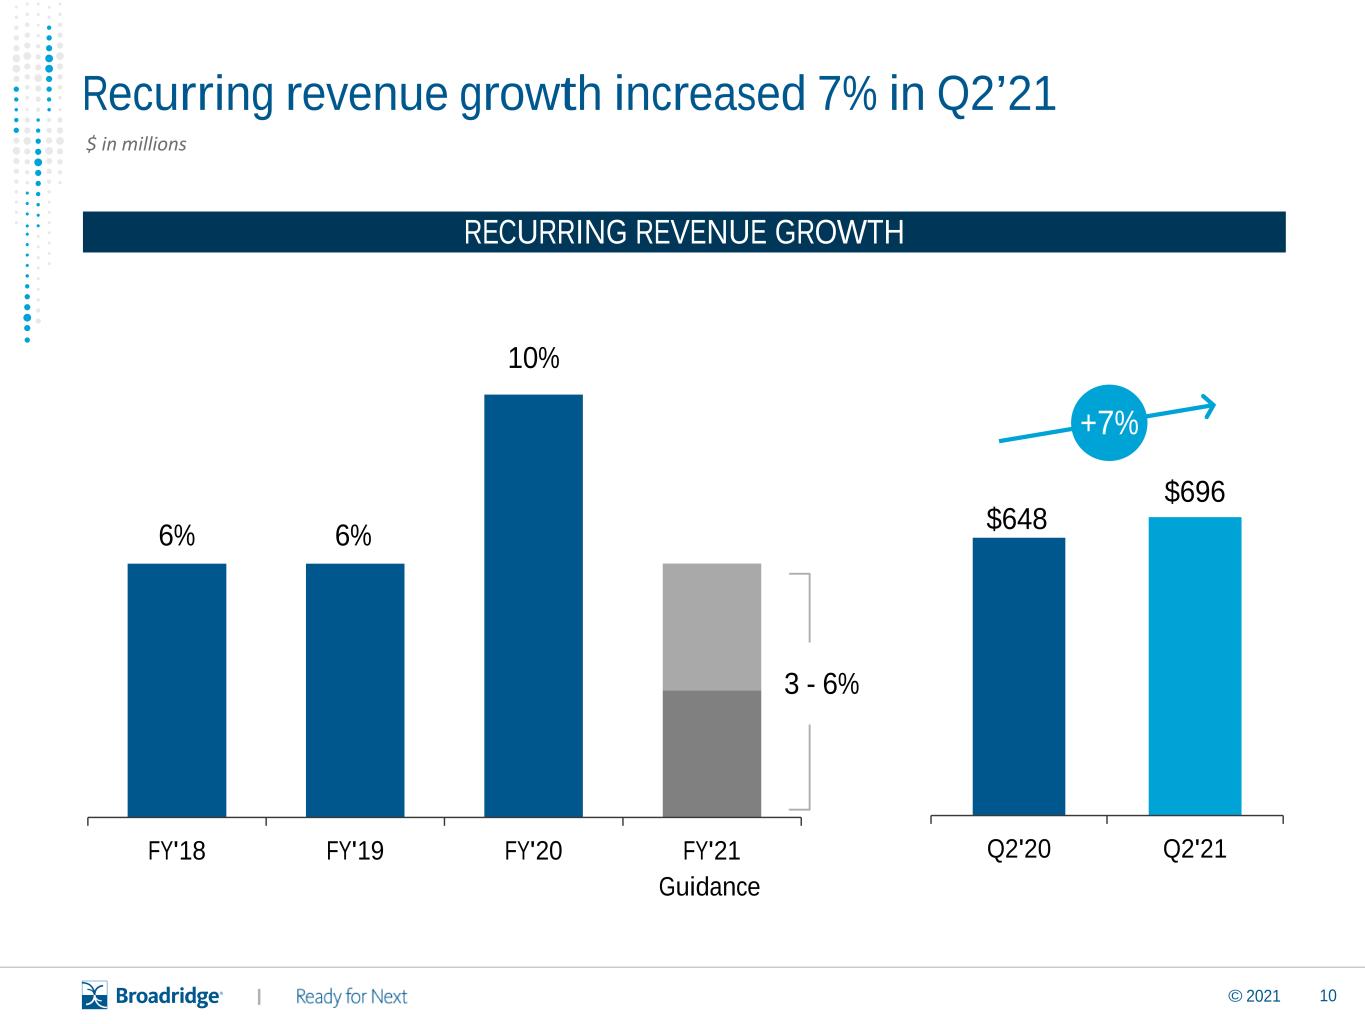
Recurring Revenue Grew 7%
Diluted EPS Increased to $0.48
Adjusted EPS Increased 38% to $0.73
NEW YORK, N.Y., February 2, 2021 - Broadridge Financial Solutions, Inc. (NYSE:BR) today reported financial results for the second quarter and six months ended December 31, 2020 of its fiscal year 2021. Results compared with the same period last year were as follows:
| Summary Financial Results | Second Quarter | Six Months | ||||||||||||||||||||||||
Dollars in millions, except per share data | 2021 | 2020 | Change | 2021 | 2020 | Change | ||||||||||||||||||||
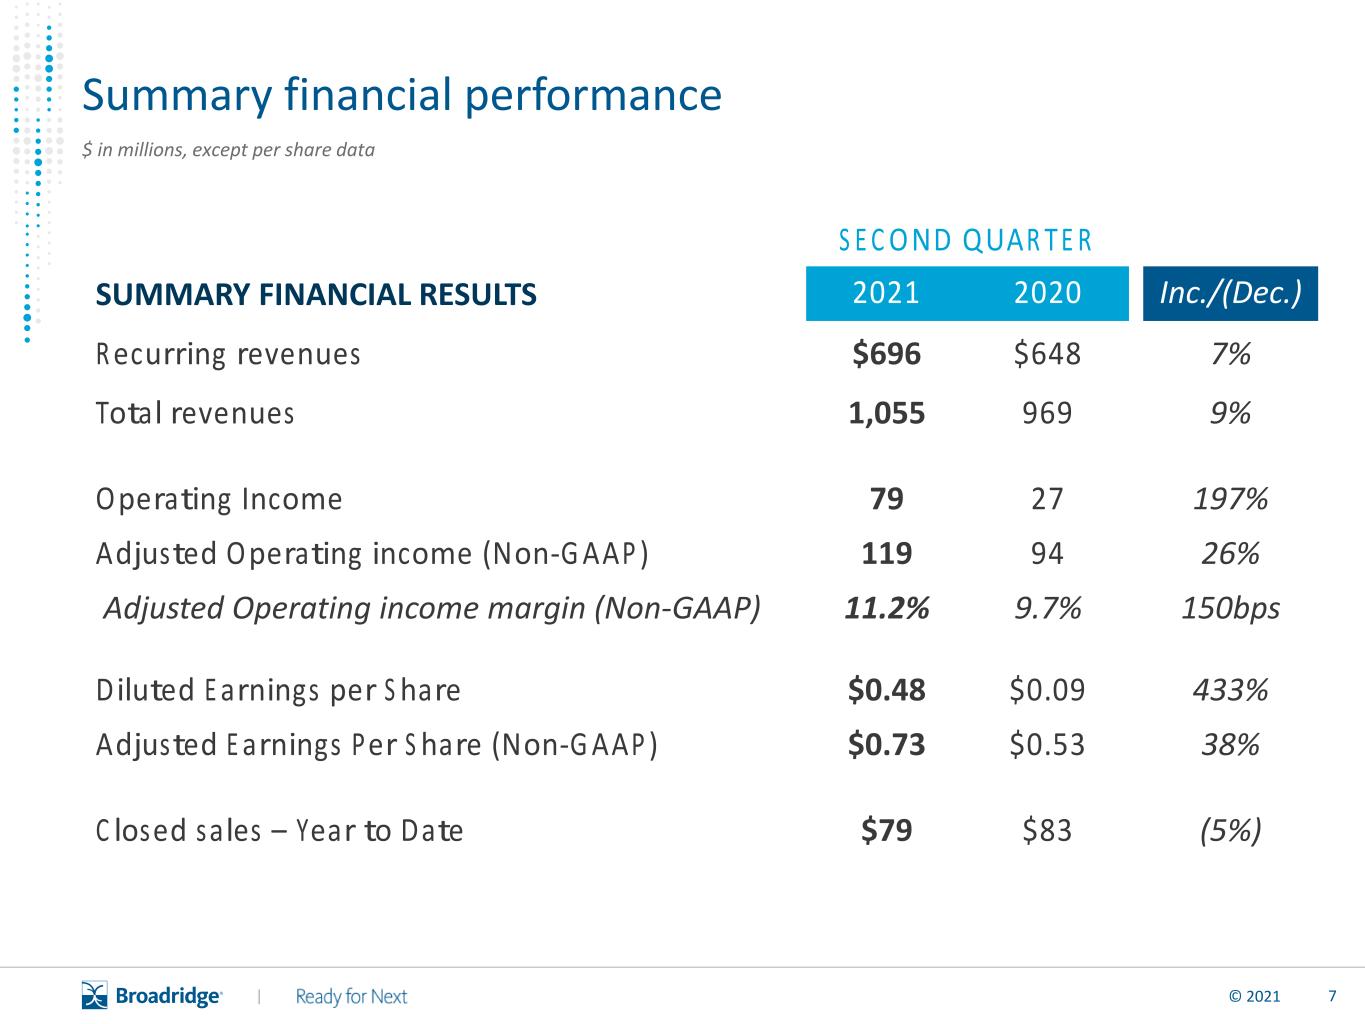
| Recurring fee revenues | $696 | $648 | 7 | % | $1,367 | $1,272 | 8 | % | ||||||||||||||||||
| Total revenues | $1,055 | $969 | 9 | % | $2,072 | $1,917 | 8 | % | ||||||||||||||||||
| Operating income | 79 | 27 | 197 | % | 158 | 100 | 58 | % | ||||||||||||||||||
| Operating income margin | 7.5 | % | 2.8 | % | 7.6 | % | 5.2 | % | ||||||||||||||||||
| Adjusted Operating income - Non-GAAP | 119 | 94 | 26 | % | 269 | 198 | 36 | % | ||||||||||||||||||
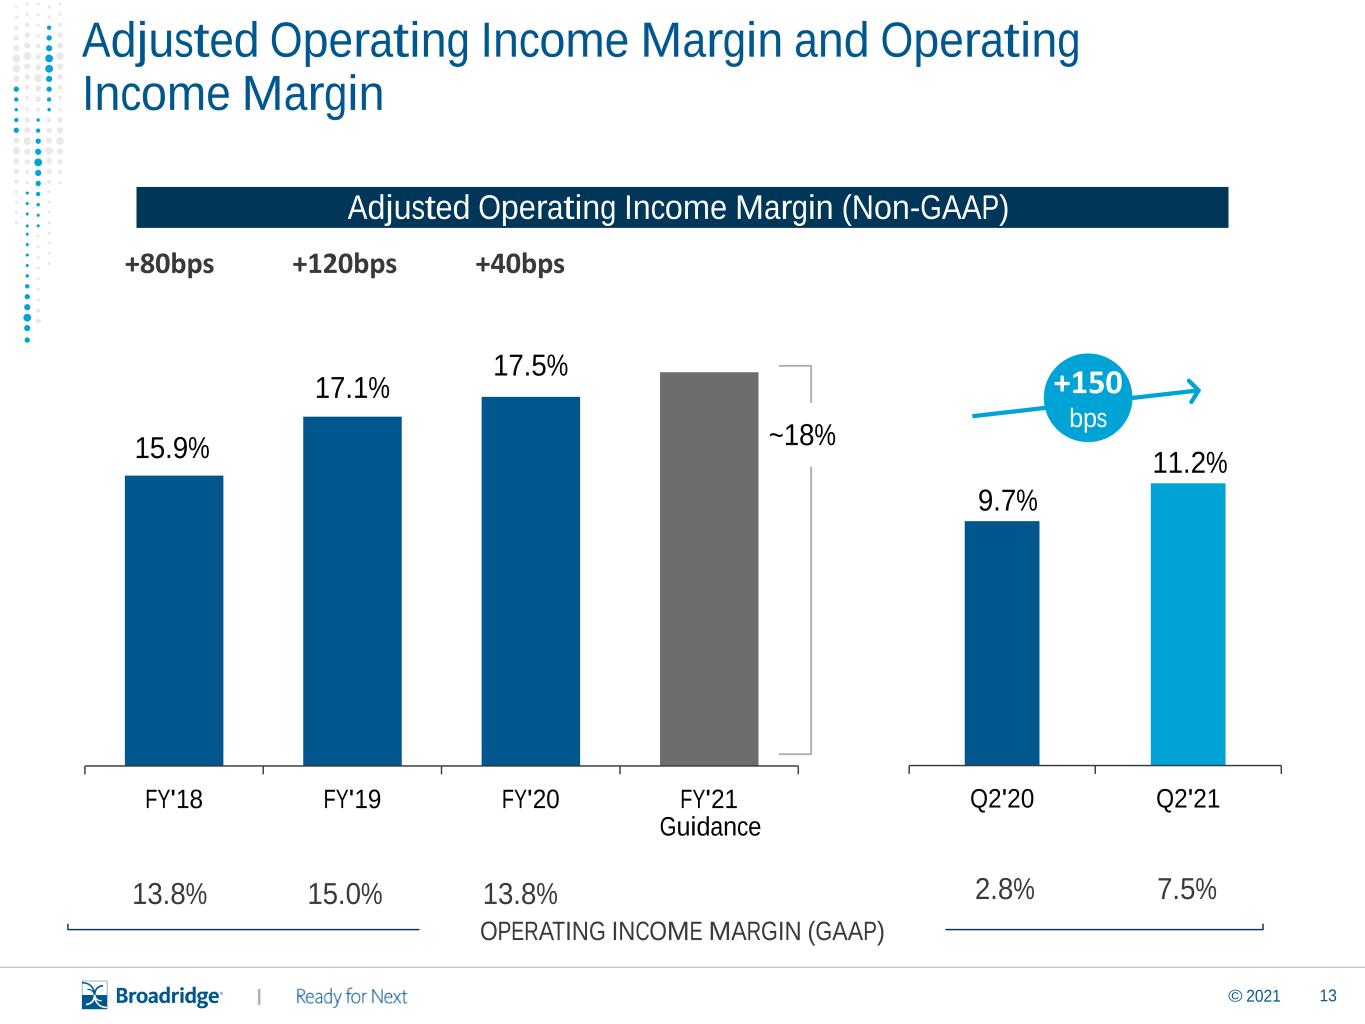
| Adjusted Operating income margin - Non-GAAP | 11.2 | % | 9.7 | % | 13.0 | % | 10.3 | % | ||||||||||||||||||
| Diluted EPS | $0.48 | $0.09 | 433 | % | $1.04 | $0.56 | 86 | % | ||||||||||||||||||
| Adjusted EPS - Non-GAAP | $0.73 | $0.53 | 38 | % | $1.70 | $1.22 | 39 | % | ||||||||||||||||||
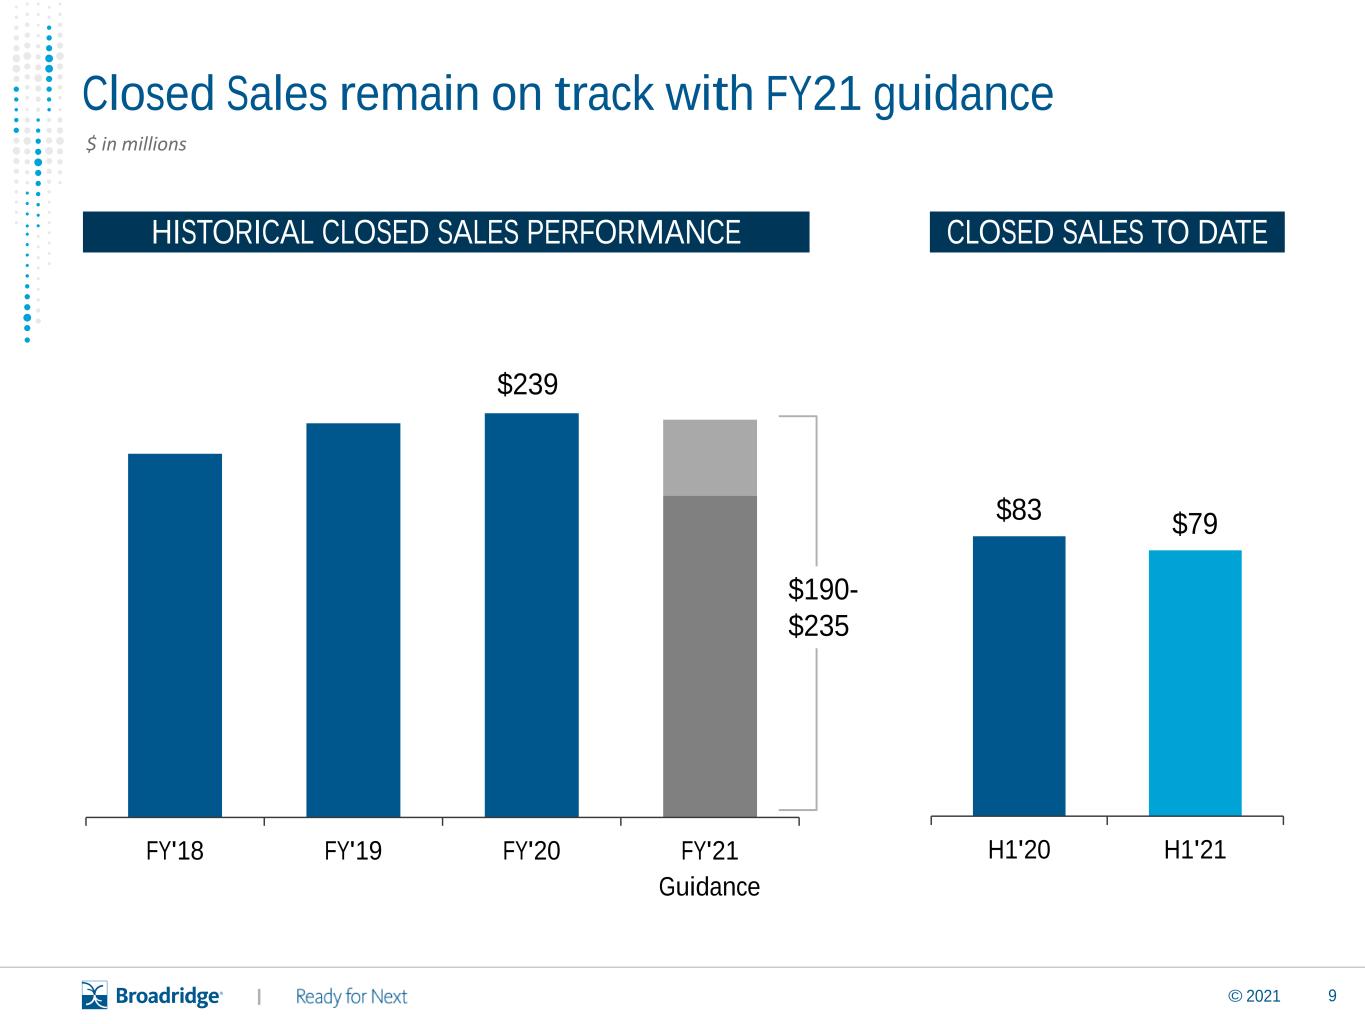
| Closed sales | $46 | $45 | 2 | % | $79 | $83 | (5 | %) | ||||||||||||||||||
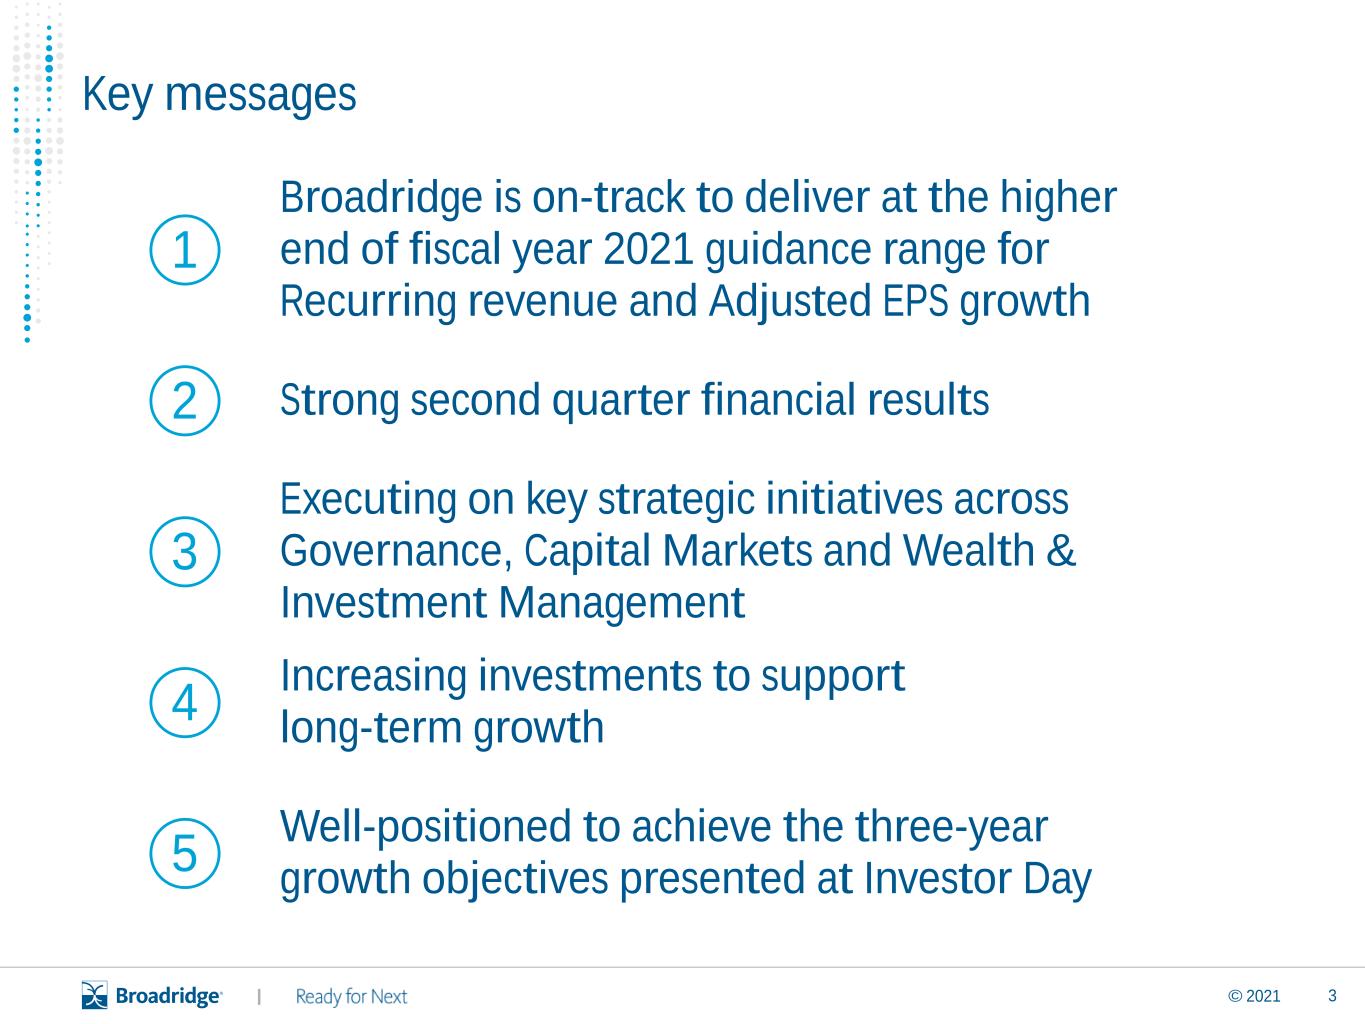
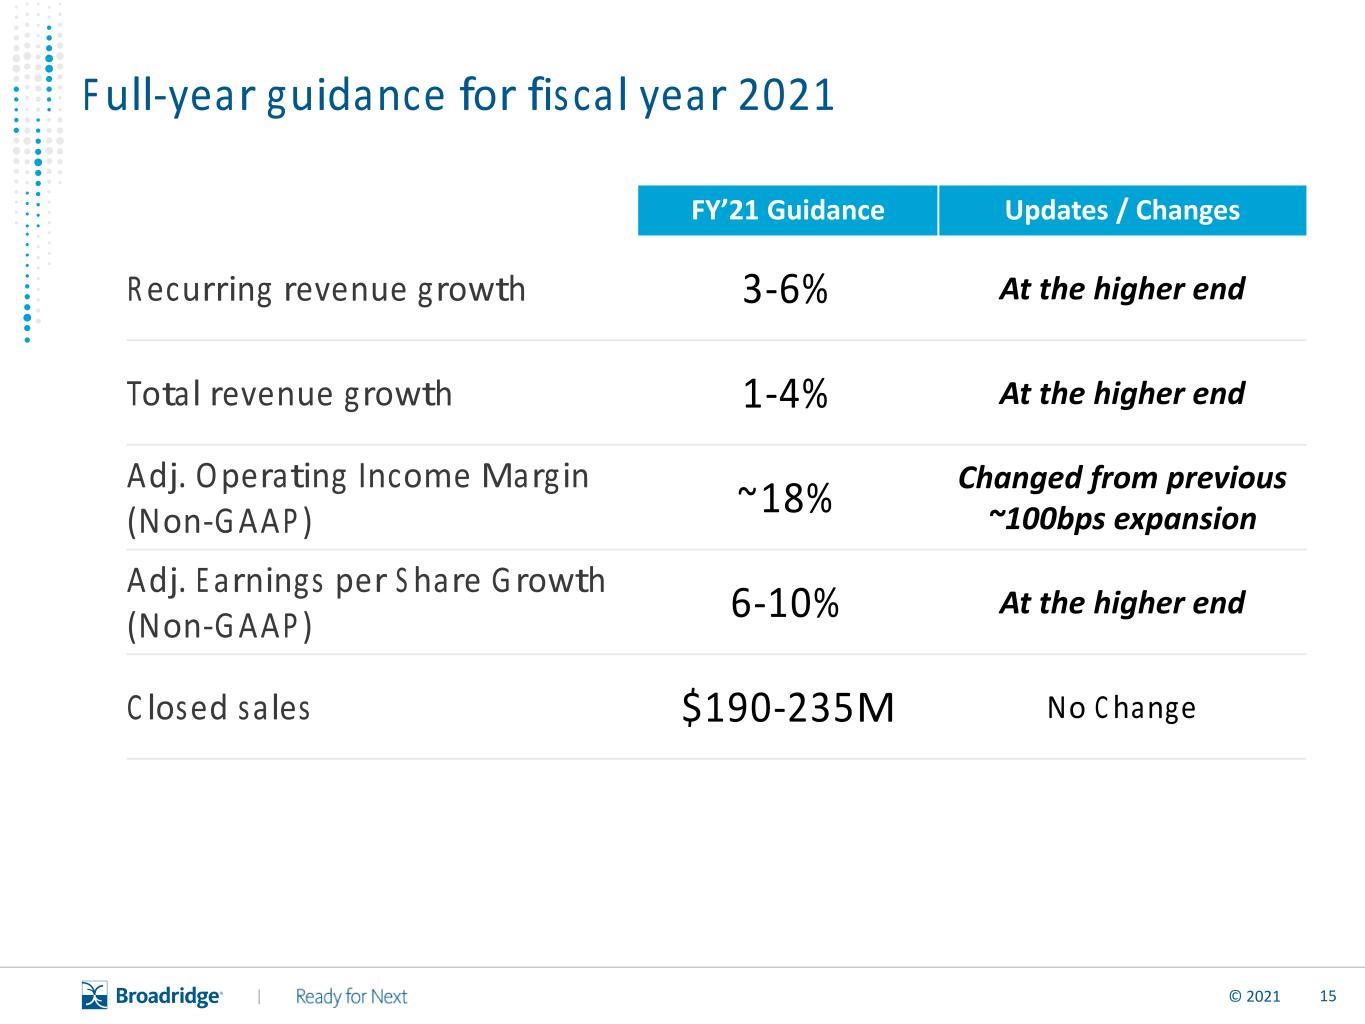
“After a strong second quarter, we expect to be at the higher end of our full-year 2021 guidance range for 3-6% Recurring revenue and 6-10% Adjusted EPS growth,” said Tim Gokey, Broadridge’s Chief Executive Officer. “Broadridge delivered 7% Recurring revenue growth and 38% Adjusted EPS growth in the second quarter.
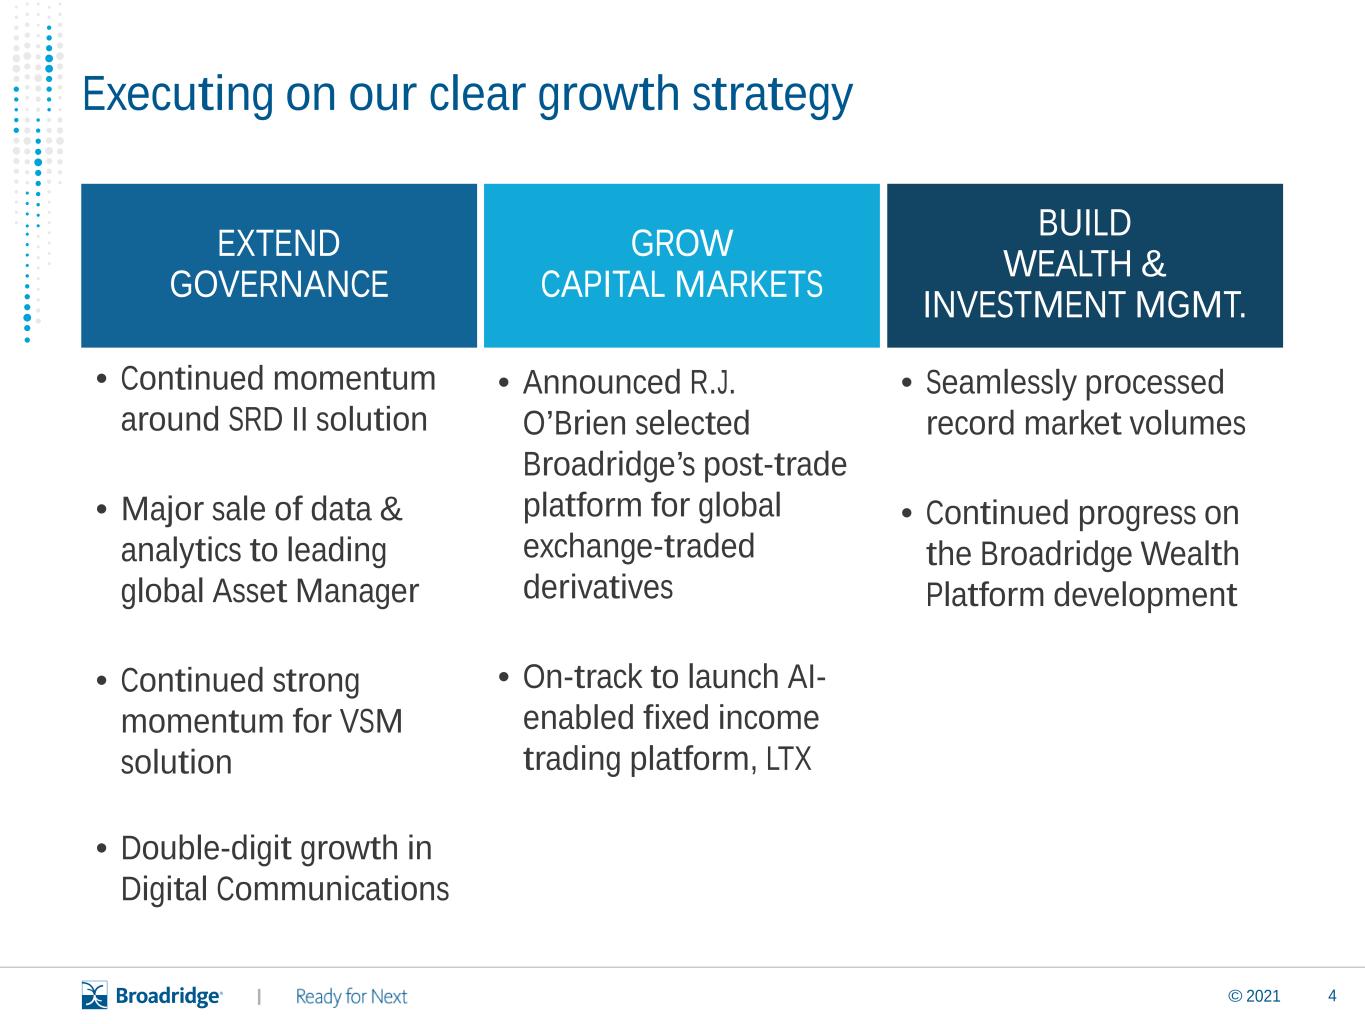
“We are executing well on our targeted growth plans across Governance, Capital Markets, and Wealth & Investment Management. As we enter our seasonally more significant second half of the year, we will continue to invest to support our long-term growth strategies,” Mr. Gokey added.
“Our Fiscal 2021 outlook puts us squarely on track to achieve the three-year growth objectives we presented at our investor day two months ago, including 7-9% Recurring revenue and 8-12% Adjusted EPS growth,” Mr. Gokey concluded.
1
Fiscal Year 2021 Financial Guidance
| FY’21 Guidance | Updates / Changes | |||||||||||||
| Recurring revenue growth | 3 - 6% | At the higher end | ||||||||||||
| Total revenue growth | 1 - 4% | At the higher end | ||||||||||||
| Adjusted Operating income margin - Non-GAAP | ~18% | Changed from previous ~100bps expansion | ||||||||||||
| Adjusted earnings per share growth - Non-GAAP | 6 - 10% | At the higher end | ||||||||||||
| Closed sales | $190 - 235M | No Change | ||||||||||||
Financial Results for the Second Quarter Fiscal Year 2021 compared to Second Quarter Fiscal Year 2020
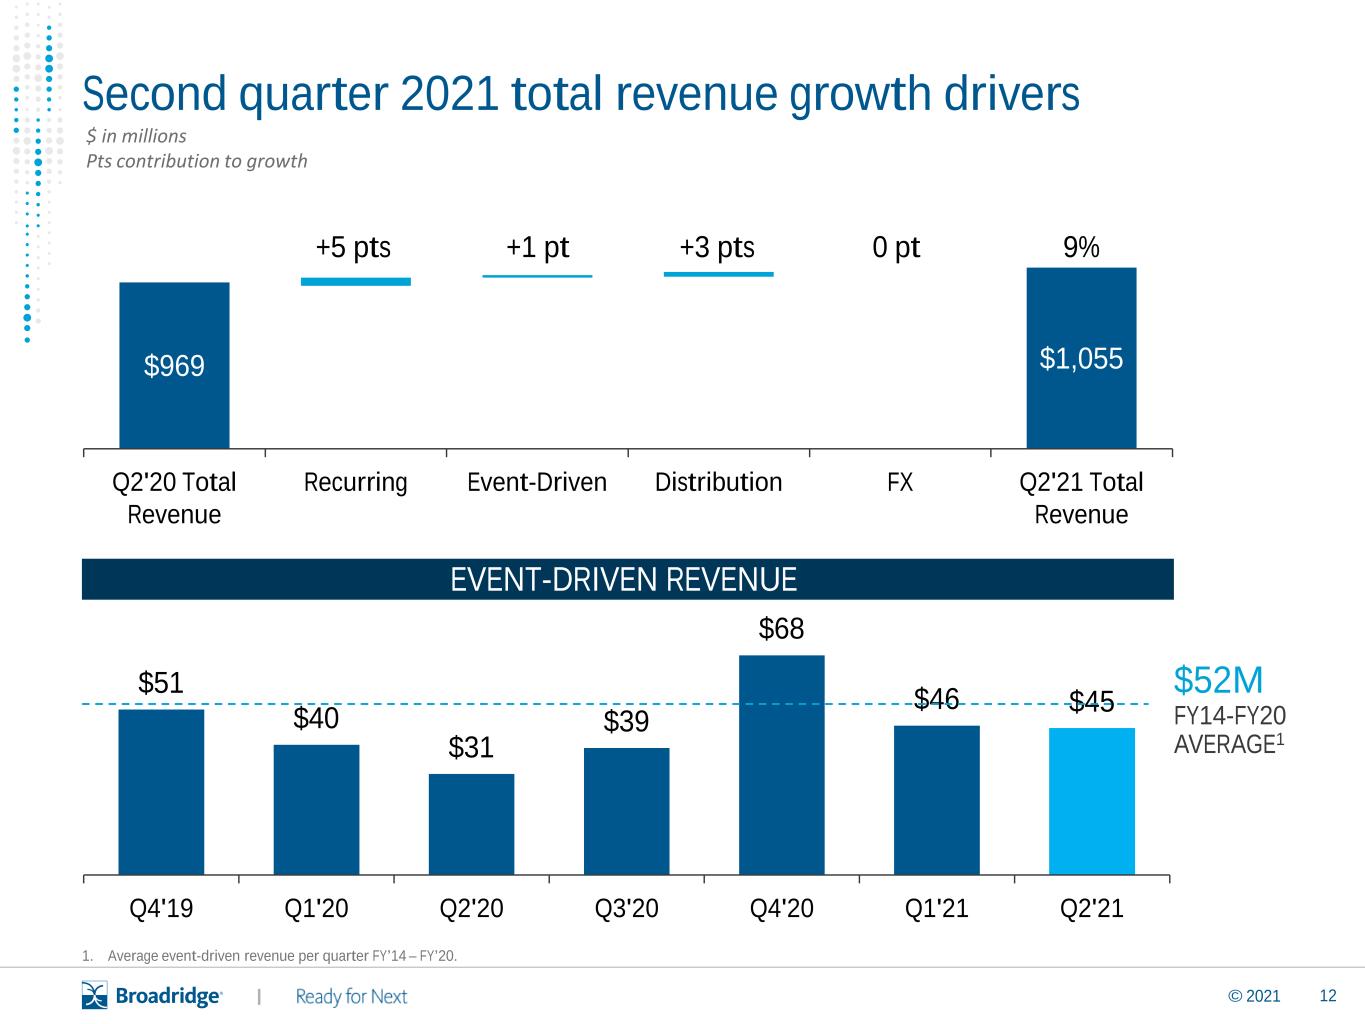
•Total revenues increased 9% to $1,055 million from $969 million in the prior year period.
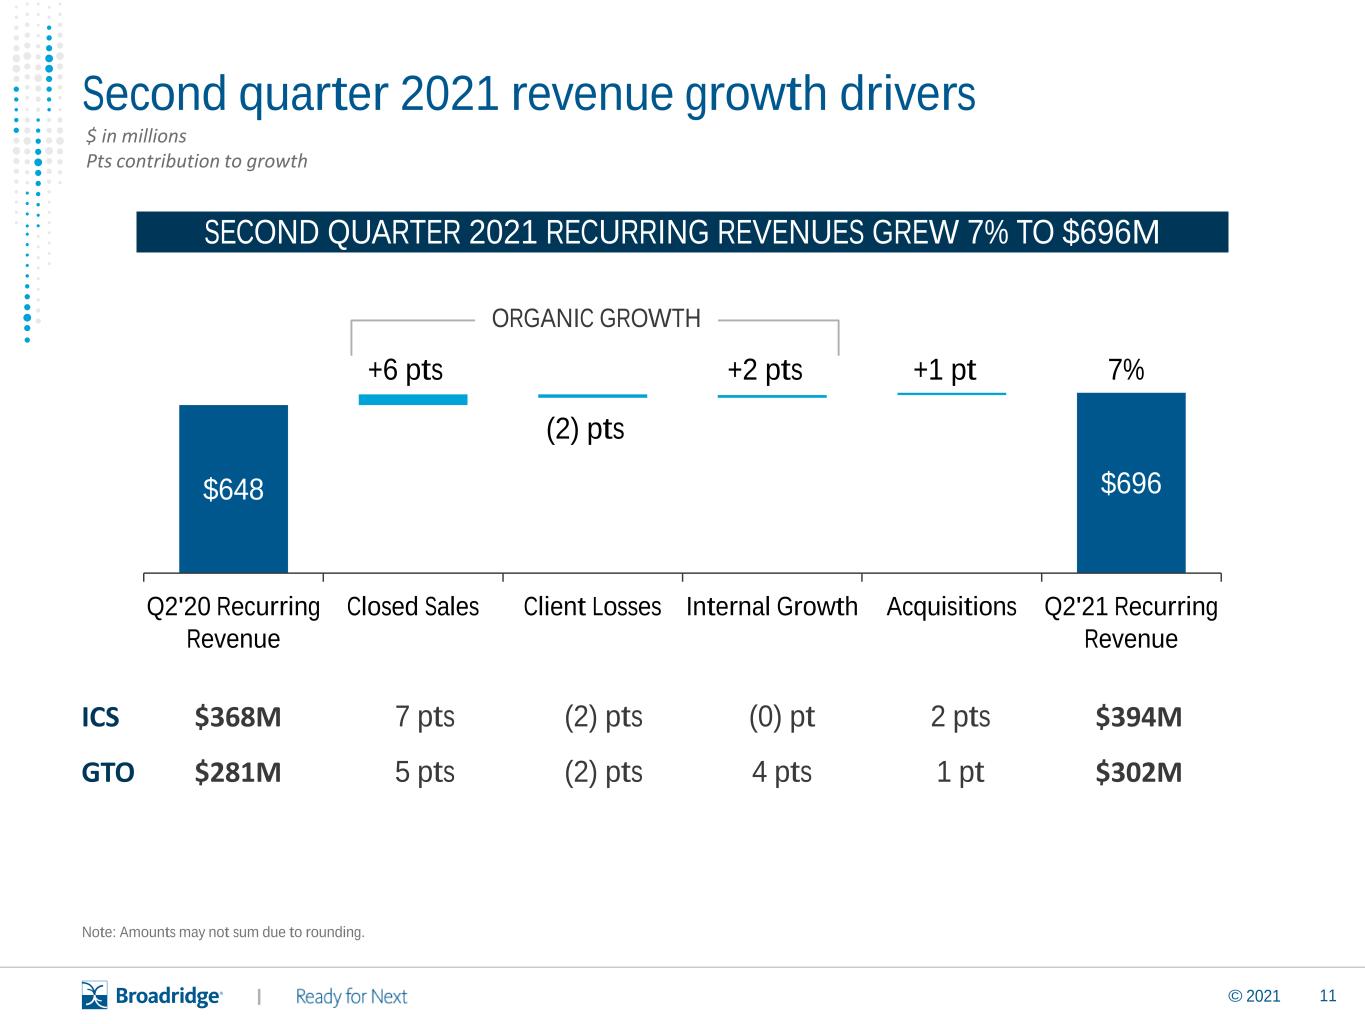
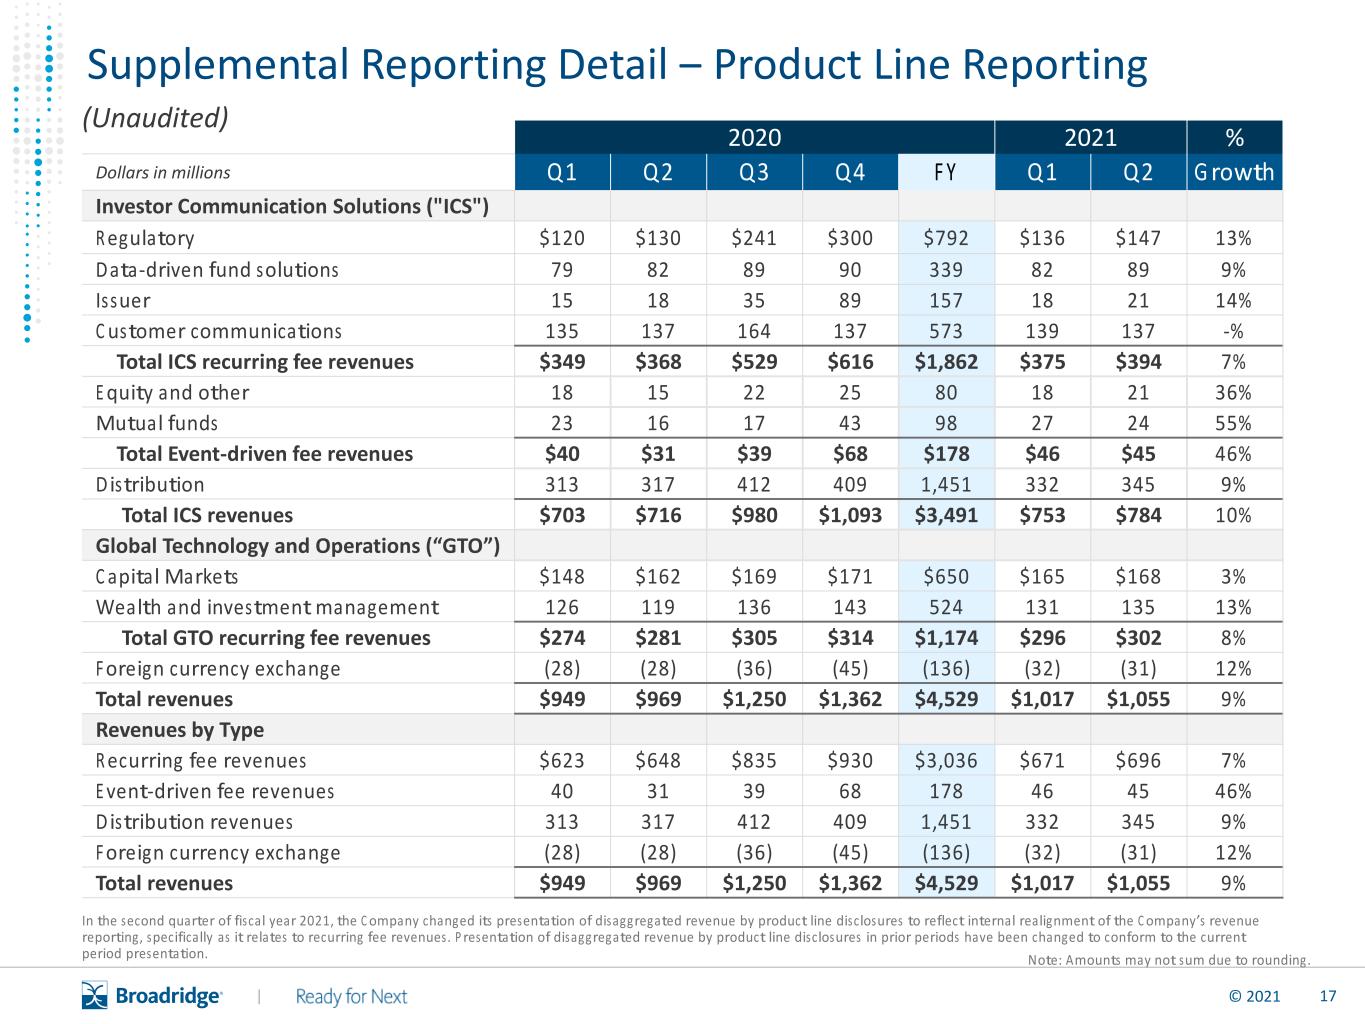
◦Recurring fee revenues increased 7% to $696 million from $648 million. The increase was primarily driven by growth from onboarding of net new business, internal growth, and the impact of acquisitions. Internal growth of 2 pts was driven by GTO, primarily due to higher equity trade volumes as compared to the prior year period.
◦Event-driven fee revenues increased $14 million, or 46%, to $45 million, due to increased mutual fund proxy and other communications.
◦Distribution revenues increased $28 million, or 9%, to $345 million, driven by an increase in the volume of regulatory and event-driven communications.
◦Currencies negatively impacted revenues by $3 million due to a combination of foreign acquisitions and continued international revenue growth.
•Operating income was $79 million, an increase of $53 million, or 197%. Operating income margin increased to 7.5% compared to 2.8% for the prior year period.
◦Adjusted Operating income was $119 million, an increase of $25 million, or 26%. Adjusted Operating income margin increased to 11.2%, compared to 9.7% for the prior year period.
◦The increase in Operating income and Adjusted Operating income was due to the impact of higher Recurring fee revenues and higher event-driven fee revenues as well as the impact of cost initiatives which limited expense growth, partially offset by higher spending related to growth initiatives.
•Interest expense, net was $11 million, a decrease of $3 million, driven by lower average interest rates on borrowings.
•The effective tax rate was 18.9% compared to 3.8% in the prior year period. The increase in the effective tax rate was driven by higher pre-tax earnings, which reduced the impact of discrete tax items. Excess tax benefits attributable to stock-based compensation were $4 million in the current year period, compared to $2 million in the comparable prior year period.
•Net earnings increased 457% to $56 million and Adjusted Net earnings increased 38% to $86 million.
◦Diluted earnings per share increased 433% to $0.48, compared to $0.09 in the prior year period and Adjusted earnings per share increased 38% to $0.73, compared to $0.53 in the prior year period.
◦The increases in Diluted earnings per share and Adjusted earnings per share were primarily due to the increase in Recurring fee revenues and higher event-driven fee revenues.
2
Segment and Other Results for the Second Quarter Fiscal Year 2021 compared to Second Quarter Fiscal Year 2020
Investor Communication Solutions (“ICS”)
•ICS total revenues were $784 million, an increase of $68 million, or 10%.
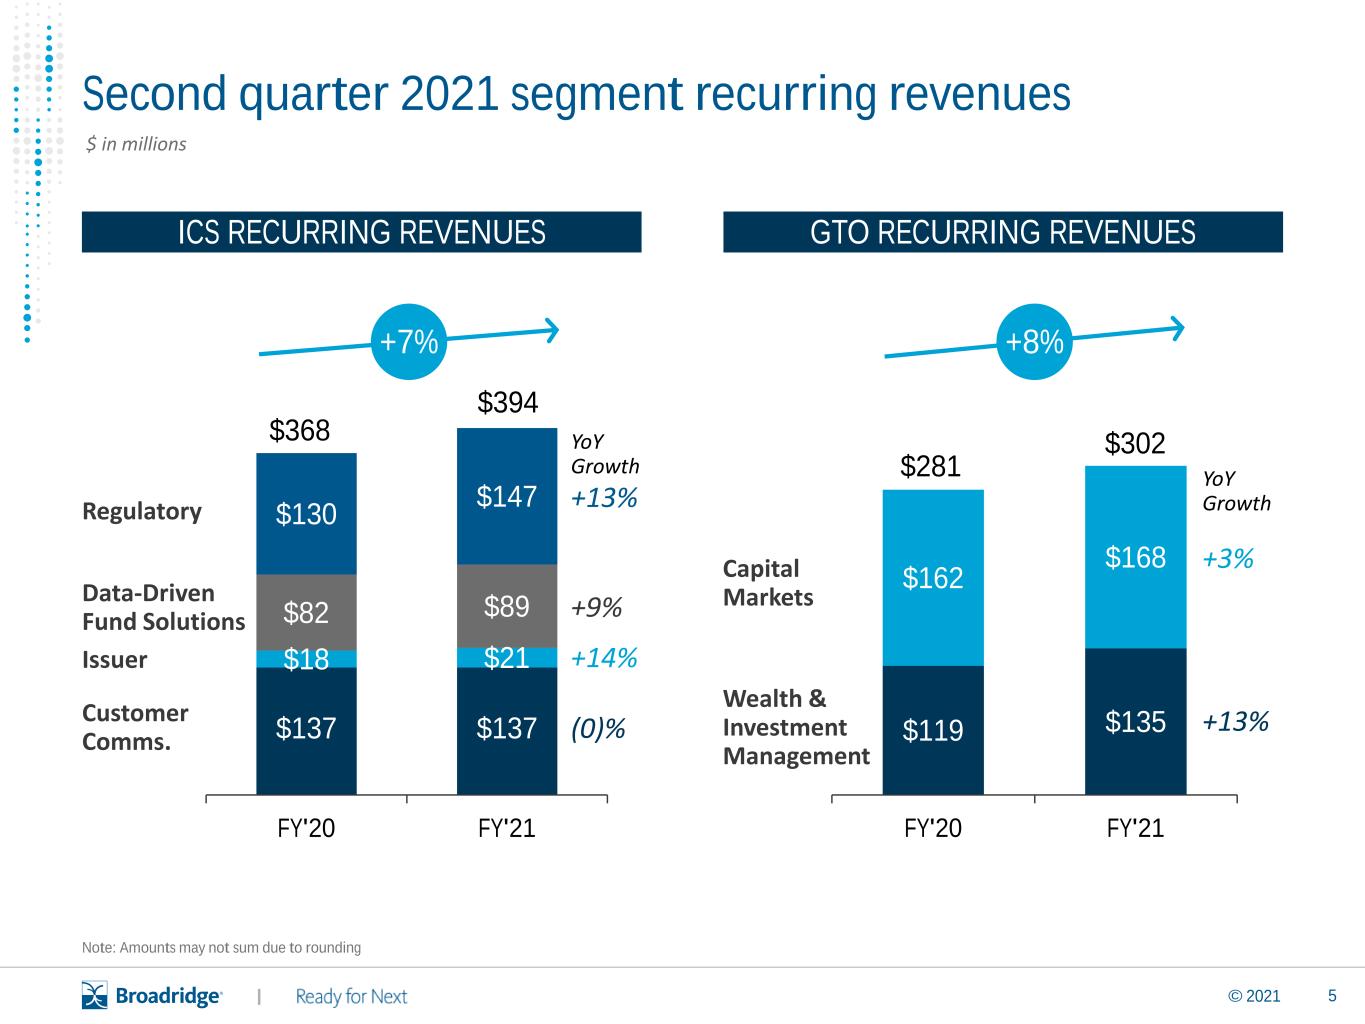
◦Recurring fee revenues increased $26 million, or 7%, to $394 million. The increase was attributable to revenues from net new business (5pts) and the impact of acquisitions (2pts). Internal growth had a neutral impact as the benefit of higher volume of equity proxy, mutual fund, and exchange traded fund communications was offset by lower customer communication volumes and lower interest rates on cash balances we hold for retirement accounts.
◦Event-driven fee revenues increased $14 million, or 46%, to $45 million, mainly from higher mutual fund proxy and other communications.
◦Distribution revenues increased $28 million, or 9%, to $345 million driven by an increase in the volume of regulatory and event-driven communications.
•ICS earnings before income taxes were $42 million, an increase of $20 million, or 91%, primarily due to the increase in Recurring fee revenues and event-driven fee revenues and prudent expense management. Pre-tax margins increased to 5.4% from 3.1%.
Global Technology and Operations (“GTO”)
•GTO Recurring fee revenues were $302 million, an increase of $21 million, or 8%. The increase was attributable to the combination of organic growth (7pts) and revenues from acquisitions (1pt). Internal growth contributed 4 pts from higher equity trading volumes.
•GTO earnings before income taxes were $55 million, an increase of $6 million, or 12%, compared to $49 million in the prior year period. The earnings increase was driven by higher organic revenues. Expense growth during the quarter was driven by onboarding of new business, accelerated spend on growth initiatives as well as the impact of recent acquisitions. Pre-tax margins increased to 18.2% from 17.4%.
Other
•Other Loss before income tax decreased 53% to $32 million from $68 million in the prior year period. The decreased loss was primarily due to charges associated with the IBM Private Cloud agreement in the prior year period of $33 million.
Financial Results for the Six Months Fiscal Year 2021 compared to the Six Months Fiscal Year 2020
•Total revenues increased 8% to $2,072 million from $1,917 million in the prior year period.
◦Recurring fee revenues increased 8% to $1,367 million from $1,272 million. The increase in Recurring fee revenues was driven primarily by growth from onboarding of net new business and the impact of acquisitions. Internal growth was 1 pt driven by (i) GTO, primarily due to higher equity trade volumes, and (ii) higher ICS volume of equity proxy, mutual fund, and exchange traded fund communications, partially offset by (iii) lower interest rates on cash balances we hold for retirement accounts and lower customer communication volumes.
◦Event-driven fee revenues increased $20 million, or 28%, to $91 million, due to increased mutual fund proxy and other communications.
◦Distribution revenues increased $47 million, or 7%, to $677 million, driven by an increase in the volume of regulatory and event-driven communications.
◦Currencies negatively impacted revenues by $7 million due to a combination of foreign acquisitions and continued international revenue growth.
•Operating income was $158 million, an increase of $58 million, or 58%. Operating income margin increased to 7.6% from 5.2% in the prior year period. Operating income includes the combined impact of $44 million of charges related to the Company’s cost reduction efforts as well as other Covid-19 related charges.
◦Adjusted Operating income was $269 million, an increase of $72 million, or 36%. Adjusted Operating income margin increased to 13.0%, compared to 10.3% for the prior year period.
3
◦The increase in Operating income and Adjusted Operating income was due to the impact of higher Recurring fee revenues and higher event-driven fee revenues as well as the impact of cost initiatives which limited expense growth.
•Interest expense, net was $26 million, a decrease of $1 million, from lower average interest rates on borrowings.
•The effective tax rate was 14.6% compared to 11.2% in the prior year period. The increase in the effective tax rate was driven by higher pre-tax earnings, which reduced the impact of discrete tax items. Excess tax benefits attributable to stock-based compensation were $13 million in the current year period, compared to $8 million in the comparable prior year period.
•Net earnings increased 85% to $122 million and Adjusted Net earnings increased 41% to $200 million.
◦Diluted earnings per share increased 86% to $1.04, compared to $0.56 in the prior year period and Adjusted earnings per share increased 39% to $1.70, compared to $1.22 in the prior year period.
◦The increases in Diluted earnings per share and Adjusted earnings per share were primarily due to the increase in Recurring fee revenues and higher event-driven fee revenues.
Segment and Other Results for the Six Months Fiscal Year 2021 compared to the Six Months Fiscal Year 2020
ICS
•ICS total revenues were $1,537 million, an increase of $119 million, or 8%.
◦Recurring fee revenues increased $52 million, or 7%, to $769 million. The increase was attributable to revenues from net new business (5pts) and acquisitions (3pts), partially offset by negative internal growth (1pt). Internal growth was negatively impacted by lower interest rates on cash balances we hold for retirement accounts and lower customer communication volumes, which more than offset the benefit of higher volume of equity proxy, mutual fund, and exchange traded fund communications.
◦Event-driven fee revenues increased $20 million, or 28%, to $91 million, primarily from increased mutual fund proxy and other communications.
◦Distribution revenues increased $47 million, or 7%, to $677 million driven by an increase in the volume of regulatory and event-driven communications volumes.
•ICS earnings before income taxes were $95 million, an increase of $50 million, or 111%, primarily due to the increase in Recurring fee revenues and event-driven fee revenues and prudent expense management. Pre-tax margins increased to 6.2% from 3.2%.
GTO
•GTO Recurring fee revenues were $598 million, an increase of $44 million, or 8%. The increase was attributable to the combination of organic growth (6pts) and revenues from acquisitions (1pt). Organic growth benefited from onboarding of new clients. Internal growth contributed 2 pts from higher equity trading volumes.
•GTO earnings before income taxes were $130 million, an increase of $25 million, or 24%, compared to $105 million in the prior year period. The earnings increase was driven by higher organic revenues and expense reduction initiatives. Expense growth was driven by onboarding of new business, accelerated spend on growth initiatives as well as the impact of recent acquisitions. Pre-tax margins increased to 21.8% from 19.0%.
Other
•Other Loss before income tax increased 3% to $92 million from $89 million in the prior year period. The increased loss was primarily due to costs associated with the Company’s real estate realignment initiative, including lease exit and impairment charges and other facility exit costs of $31.7 million, as well as certain expenses associated with the Covid-19 pandemic, partially offset by charges associated with the IBM Private Cloud Agreement of $33.4 million that occurred in the prior year period.
4
Earnings Conference Call
An analyst conference call will be held today, February 2, 2021 at 8:30 a.m. ET. A live webcast of the call will be available to the public on a listen-only basis. To listen to the live event and access the slide presentation, visit Broadridge’s Investor Relations website at www.broadridge-ir.com prior to the start of the webcast. To listen to the call, investors may also dial 1-877-328-2502 within the United States and international callers may dial 1-412-317-5419.
A replay of the webcast will be available and can be accessed in the same manner as the live webcast at the Broadridge Investor Relations site. Through February 16, 2021, the recording will also be available by dialing 1-877-344-7529 passcode: 10150640 within the United States or 1-412-317-0088 passcode: 10150640 for international callers.
Explanation and Reconciliation of the Company’s Use of Non-GAAP Financial Measures
The Company’s results in this press release are presented in accordance with U.S. GAAP except where otherwise noted. In certain circumstances, results have been presented that are not generally accepted accounting principles measures (“Non-GAAP”). These Non-GAAP measures are Adjusted Operating income, Adjusted Operating income margin, Adjusted Net earnings, Adjusted earnings per share, and Free cash flow. These Non-GAAP financial measures should be viewed in addition to, and not as a substitute for, the Company’s reported results.
The Company believes our Non-GAAP financial measures help investors understand how management plans, measures and evaluates the Company’s business performance. Management believes that Non-GAAP measures provide consistency in its financial reporting and facilitates investors’ understanding of the Company’s operating results and trends by providing an additional basis for comparison. Management uses these Non-GAAP financial measures to, among other things, evaluate our ongoing operations, and for internal planning and forecasting purposes. In addition, and as a consequence of the importance of these Non-GAAP financial measures in managing our business, the Company’s Compensation Committee of the Board of Directors incorporates Non-GAAP financial measures in the evaluation process for determining management compensation.
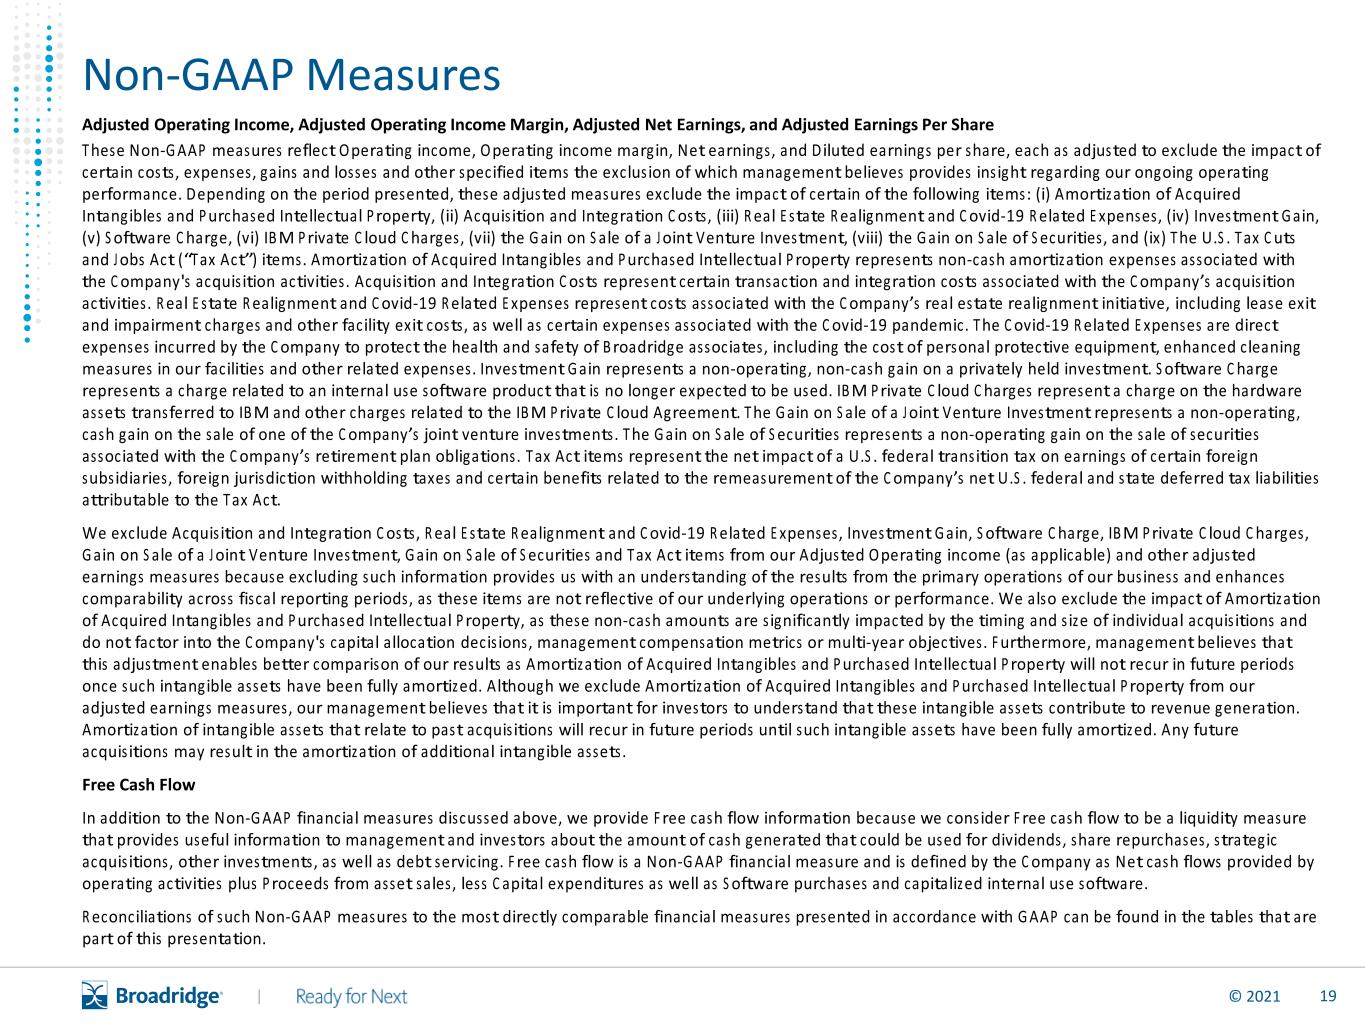
Adjusted Operating Income, Adjusted Operating Income Margin, Adjusted Net Earnings and Adjusted Earnings Per Share
These Non-GAAP measures reflect Operating income, Operating income margin, Net earnings, and Diluted earnings per share, each as adjusted to exclude the impact of certain costs, expenses, gains and losses and other specified items the exclusion of which management believes provides insight regarding our ongoing operating performance. Depending on the period presented, these adjusted measures exclude the impact of certain of the following items: (i) Amortization of Acquired Intangibles and Purchased Intellectual Property, (ii) Acquisition and Integration Costs, (iii) IBM Private Cloud Charges, (iv) Real Estate Realignment and Covid-19 Related Expenses, (v) Investment Gain, and (vi) Software Charge. Amortization of Acquired Intangibles and Purchased Intellectual Property represents non-cash amortization expenses associated with the Company's acquisition activities. Acquisition and Integration Costs represent certain transaction and integration costs associated with the Company’s acquisition activities. IBM Private Cloud Charges represent a charge on the hardware assets transferred to IBM and other charges related to the IBM Private Cloud Agreement. Real Estate Realignment and Covid-19 Related Expenses represent costs associated with the Company’s real estate realignment initiative, including lease exit and impairment charges and other facility exit costs, as well as certain expenses associated with the Covid-19 pandemic. The Covid-19 Related Expenses are direct expenses incurred by the Company to protect the health and safety of Broadridge associates, including the cost of personal protective equipment, enhanced cleaning measures in our facilities and other related expenses. Investment Gain represents a non-operating, non-cash gain on a privately held investment. Software Charge represents a charge related to an internal use software product that is no longer expected to be used.
We exclude Acquisition and Integration Costs, IBM Private Cloud Charges, Real Estate Realignment and Covid-19 Related Expenses, the Investment Gain, and the Software Charge from our Adjusted Operating income (as applicable) and other adjusted earnings measures because excluding such information provides us with an understanding of the results from the primary operations of our business and enhances comparability across fiscal
5
reporting periods, as these items are not reflective of our underlying operations or performance. We also exclude the impact of Amortization of Acquired Intangibles and Purchased Intellectual Property, as these non-cash amounts are significantly impacted by the timing and size of individual acquisitions and do not factor into the Company's capital allocation decisions, management compensation metrics or multi-year objectives. Furthermore, management believes that this adjustment enables better comparison of our results as Amortization of Acquired Intangibles and Purchased Intellectual Property will not recur in future periods once such intangible assets have been fully amortized. Although we exclude Amortization of Acquired Intangibles and Purchased Intellectual Property from our adjusted earnings measures, our management believes that it is important for investors to understand that these intangible assets contribute to revenue generation. Amortization of intangible assets that relate to past acquisitions will recur in future periods until such intangible assets have been fully amortized. Any future acquisitions may result in the amortization of additional intangible assets.
Free Cash Flow
In addition to the Non-GAAP financial measures discussed above, we provide Free cash flow information because we consider Free cash flow to be a liquidity measure that provides useful information to management and investors about the amount of cash generated that could be used for dividends, share repurchases, strategic acquisitions, other investments, as well as debt servicing. Free cash flow is a Non-GAAP financial measure and is defined by the Company as Net cash flows provided by operating activities plus Proceeds from asset sales, less Capital expenditures as well as Software purchases and capitalized internal use software.
Reconciliations of such Non-GAAP measures to the most directly comparable financial measures presented in accordance with GAAP can be found in the tables that are part of this press release.
Forward-Looking Statements
This press release and other written or oral statements made from time to time by representatives of Broadridge may contain “forward-looking statements” within the meaning of the Private Securities Litigation Reform Act of 1995. Statements that are not historical in nature, and which may be identified by the use of words such as “expects,” “assumes,” “projects,” “anticipates,” “estimates,” “we believe,” “could be” and other words of similar meaning, are forward-looking statements. In particular, information appearing in the “Fiscal Year 2021 Financial Guidance” section and statements about our three-year objectives are forward-looking statements. These statements are based on management’s expectations and assumptions and are subject to risks and uncertainties that may cause actual results to differ materially from those expressed. These risks and uncertainties include those risk factors described and discussed in Part I, “Item 1A. Risk Factors” of our Annual Report on Form 10-K for the year ended June 30, 2020 (the “2020 Annual Report”), as they may be updated in any future reports filed with the Securities and Exchange Commission. All forward-looking statements speak only as of the date of this press release and are expressly qualified in their entirety by reference to the factors discussed in the 2020 Annual Report.
These risks include:
•the potential impact and effects of the Covid-19 pandemic (“Covid-19”) on the business of Broadridge, Broadridge’s results of operations and financial performance, any measures Broadridge has and may take in response to Covid-19 and any expectations Broadridge may have with respect thereto;
•the success of Broadridge in retaining and selling additional services to its existing clients and in obtaining new clients;
•Broadridge’s reliance on a relatively small number of clients, the continued financial health of those clients, and the continued use by such clients of Broadridge’s services with favorable pricing terms;
•a material security breach or cybersecurity attack affecting the information of Broadridge’s clients;
•changes in laws and regulations affecting Broadridge’s clients or the services provided by Broadridge;
•declines in participation and activity in the securities markets;
•the failure of Broadridge’s key service providers to provide the anticipated levels of service;
•a disaster or other significant slowdown or failure of Broadridge’s systems or error in the performance of Broadridge’s services;
6
•overall market and economic conditions and their impact on the securities markets;
•Broadridge’s failure to keep pace with changes in technology and the demands of its clients;
•Broadridge’s ability to attract and retain key personnel;
•the impact of new acquisitions and divestitures; and
•competitive conditions.
Broadridge disclaims any obligation to update or revise forward-looking statements that may be made to reflect events or circumstances that arise after the date made or to reflect the occurrence of unanticipated events, other than as required by law.
About Broadridge
Broadridge Financial Solutions, Inc. (NYSE: BR), a $4.5 billion global Fintech leader, is a leading provider of investor communications and technology-driven solutions to banks, broker-dealers, asset and wealth managers and corporate issuers. Broadridge's infrastructure underpins proxy voting services for over 50 percent of public
companies and mutual funds globally, and processes on average U.S. $10 trillion in fixed income and equity securities trades per day. Broadridge is part of the S&P 500® Index and employs over 12,000 associates in 17
countries.
For more information about Broadridge, please visit www.broadridge.com.
Contact Information
Investors:
W. Edings Thibault
(516) 472-5129
Elsa Ballard
Media:
Gregg Rosenberg
(212) 918-6966
(212) 973-6197
7
Condensed Consolidated Statements of Earnings
(Unaudited)
| In millions, except per share amounts | Three Months Ended December 31, | Six Months Ended December 31, | |||||||||||||||||||||||||||
| 2020 | 2019 | 2020 | 2019 | ||||||||||||||||||||||||||
| Revenues | $ | 1,054.9 | $ | 968.7 | $ | 2,072.3 | $ | 1,917.2 | |||||||||||||||||||||
| Operating expenses: | |||||||||||||||||||||||||||||
| Cost of revenues | 806.5 | 780.9 | 1,593.5 | 1,508.4 | |||||||||||||||||||||||||
| Selling, general and administrative expenses | 169.0 | 161.0 | 320.7 | 309.0 | |||||||||||||||||||||||||
| Total operating expenses | 975.5 | 941.9 | 1,914.3 | 1,817.3 | |||||||||||||||||||||||||
| Operating income | 79.5 | 26.8 | 158.1 | 99.9 | |||||||||||||||||||||||||
| Interest expense, net | (11.1) | (13.9) | (25.6) | (27.0) | |||||||||||||||||||||||||
| Other non-operating income (expenses), net | 1.0 | (2.4) | 10.5 | 1.4 | |||||||||||||||||||||||||
| Earnings before income taxes | 69.4 | 10.5 | 143.0 | 74.3 | |||||||||||||||||||||||||
| Provision for income taxes | 13.1 | 0.4 | 20.9 | 8.3 | |||||||||||||||||||||||||
| Net earnings | $ | 56.3 | $ | 10.1 | $ | 122.1 | $ | 66.0 | |||||||||||||||||||||
| Basic earnings per share | $ | 0.49 | $ | 0.09 | $ | 1.06 | $ | 0.58 | |||||||||||||||||||||
| Diluted earnings per share | $ | 0.48 | $ | 0.09 | $ | 1.04 | $ | 0.56 | |||||||||||||||||||||
| Weighted-average shares outstanding: | |||||||||||||||||||||||||||||
| Basic | 115.7 | 114.7 | 115.5 | 114.5 | |||||||||||||||||||||||||
| Diluted | 117.8 | 117.2 | 117.6 | 117.1 | |||||||||||||||||||||||||
Amounts may not sum due to rounding.
8
Condensed Consolidated Balance Sheets
(Unaudited)
| In millions, except per share amounts | December 31, 2020 | June 30, 2020 | |||||||||||||||
| Assets | |||||||||||||||||
| Current assets: | |||||||||||||||||
| Cash and cash equivalents | $ | 365.6 | $ | 476.6 | |||||||||||||
| Accounts receivable, net of allowance for doubtful accounts of $7.1 and $9.8, respectively | 625.0 | 711.3 | |||||||||||||||
| Other current assets | 157.9 | 140.1 | |||||||||||||||
| Total current assets | 1,148.5 | 1,328.0 | |||||||||||||||
| Property, plant and equipment, net | 167.1 | 161.6 | |||||||||||||||
| Goodwill | 1,705.6 | 1,674.5 | |||||||||||||||
| Intangible assets, net | 543.0 | 583.8 | |||||||||||||||
| Other non-current assets | 1,294.1 | 1,141.9 | |||||||||||||||
| Total assets | $ | 4,858.3 | $ | 4,889.8 | |||||||||||||
| Liabilities and Stockholders’ Equity | |||||||||||||||||
| Current liabilities: | |||||||||||||||||
| Current portion of long-term debt | $ | — | $ | 399.9 | |||||||||||||
| Payables and accrued expenses | 719.0 | 829.9 | |||||||||||||||
| Contract liabilities | 118.9 | 111.2 | |||||||||||||||
| Total current liabilities | 837.9 | 1,341.0 | |||||||||||||||
| Long-term debt | 1,770.6 | 1,387.6 | |||||||||||||||
| Deferred taxes | 140.7 | 126.8 | |||||||||||||||
| Contract liabilities | 176.0 | 175.4 | |||||||||||||||
| Other non-current liabilities | 499.1 | 512.4 | |||||||||||||||
| Total liabilities | 3,424.3 | 3,543.2 | |||||||||||||||
| Commitments and contingencies | |||||||||||||||||
| Stockholders’ equity: | |||||||||||||||||
| Preferred stock: Authorized, 25.0 shares; issued and outstanding, none | — | — | |||||||||||||||
| Common stock, $0.01 par value: Authorized, 650.0 shares; issued, 154.5 and 154.5 shares, respectively; outstanding, 115.8 and 115.1 shares, respectively | 1.6 | 1.6 | |||||||||||||||
| Additional paid-in capital | 1,219.6 | 1,178.5 | |||||||||||||||
| Retained earnings | 2,291.8 | 2,302.6 | |||||||||||||||
| Treasury stock, at cost: 38.7 and 39.3 shares, respectively | (2,021.8) | (2,035.7) | |||||||||||||||
| Accumulated other comprehensive loss | (57.1) | (100.4) | |||||||||||||||
| Total stockholders’ equity | 1,434.0 | 1,346.5 | |||||||||||||||
| Total liabilities and stockholders’ equity | $ | 4,858.3 | $ | 4,889.8 | |||||||||||||
Amounts may not sum due to rounding.
9
Condensed Consolidated Statements of Cash Flows
(Unaudited)
Dollars in millions | Six Months Ended December 31, | ||||||||||
| 2020 | 2019 | ||||||||||
| Cash Flows From Operating Activities | |||||||||||
| Net earnings | $ | 122.1 | $ | 66.0 | |||||||
| Adjustments to reconcile net earnings to net cash flows provided by operating activities: | |||||||||||
| Depreciation and amortization | 31.3 | 41.4 | |||||||||
| Amortization of acquired intangibles and purchased intellectual property | 64.9 | 58.4 | |||||||||
| Amortization of other assets | 52.9 | 49.7 | |||||||||
| Write-down of long-lived assets and related charges | 33.6 | 31.8 | |||||||||
| Stock-based compensation expense | 28.7 | 30.3 | |||||||||
| Deferred income taxes | 10.9 | (0.8) | |||||||||
| Other | (29.0) | (12.9) | |||||||||
| Changes in operating assets and liabilities, net of assets and liabilities acquired: | |||||||||||
| Current assets and liabilities: | |||||||||||
| Decrease in Accounts receivable, net | 100.3 | 53.2 | |||||||||
| Increase in Other current assets | (35.7) | (38.5) | |||||||||
| Decrease in Payables and accrued expenses | (140.2) | (155.0) | |||||||||
| Increase in Contract liabilities | 5.9 | 11.5 | |||||||||
| Non-current assets and liabilities: | |||||||||||
| Increase in Other non-current assets | (211.2) | (167.7) | |||||||||
| Increase in Other non-current liabilities | 48.8 | 44.0 | |||||||||
| Net cash flows provided by operating activities | 83.3 | 11.5 | |||||||||
| Cash Flows From Investing Activities | |||||||||||
| Capital expenditures | (30.1) | (31.6) | |||||||||
| Software purchases and capitalized internal use software | (20.7) | (11.4) | |||||||||
| Proceeds from asset sales | 18.0 | — | |||||||||
| Acquisitions, net of cash acquired | — | (269.6) | |||||||||
| Other investing activities | (11.0) | (18.7) | |||||||||
| Net cash flows used in investing activities | (43.9) | (331.2) | |||||||||
| Cash Flows From Financing Activities | |||||||||||
| Debt proceeds | 660.0 | 1,226.1 | |||||||||
| Debt repayments | (687.8) | (841.8) | |||||||||
| Dividends paid | (128.5) | (117.2) | |||||||||
| Purchases of Treasury stock | (0.8) | — | |||||||||
| Proceeds from exercise of stock options | 27.6 | 21.6 | |||||||||
| Other financing activities | (27.2) | (8.3) | |||||||||
| Net cash flows provided by (used in) financing activities | (156.6) | 280.5 | |||||||||
| Effect of exchange rate changes on Cash and cash equivalents | 6.2 | — | |||||||||
| Net change in Cash and cash equivalents | (111.0) | (39.2) | |||||||||
| Cash and cash equivalents, beginning of period | 476.6 | 273.2 | |||||||||
| Cash and cash equivalents, end of period | $ | 365.6 | $ | 234.0 | |||||||
Amounts may not sum due to rounding.
10
Segment Results
(Unaudited)
| In millions | Three Months Ended December 31, | Six Months Ended December 31, | |||||||||||||||||||||
| 2020 | 2019 | 2020 | 2019 | ||||||||||||||||||||
| Revenues | |||||||||||||||||||||||
| Investor Communication Solutions | $ | 783.9 | $ | 715.6 | $ | 1,536.7 | $ | 1,418.2 | |||||||||||||||
| Global Technology and Operations | 302.3 | 280.9 | 598.4 | 554.8 | |||||||||||||||||||
| Foreign currency exchange | (31.2) | (27.8) | (62.7) | (55.8) | |||||||||||||||||||
| Total | $ | 1,054.9 | $ | 968.7 | $ | 2,072.3 | $ | 1,917.2 | |||||||||||||||
| Earnings (Loss) before Income Taxes | |||||||||||||||||||||||
| Investor Communication Solutions | $ | 42.2 | $ | 22.1 | $ | 95.0 | $ | 45.1 | |||||||||||||||
| Global Technology and Operations | 55.0 | 49.0 | 130.3 | 105.5 | |||||||||||||||||||
| Other | (31.9) | (68.1) | (92.4) | (89.3) | |||||||||||||||||||
| Foreign currency exchange | 4.1 | 7.5 | 10.0 | 13.0 | |||||||||||||||||||
| Total | $ | 69.4 | $ | 10.5 | $ | 143.0 | $ | 74.3 | |||||||||||||||
| Pre-tax margins: | |||||||||||||||||||||||
| Investor Communication Solutions | 5.4 | % | 3.1 | % | 6.2 | % | 3.2 | % | |||||||||||||||
| Global Technology and Operations | 18.2 | % | 17.4 | % | 21.8 | % | 19.0 | % | |||||||||||||||
Amounts may not sum due to rounding.
11
Supplemental Reporting Detail - Additional Product Line Reporting
(Unaudited)
| In millions | Three Months Ended December 31, | Six Months Ended December 31, | |||||||||||||||||||||||||||||||||
| Investor Communication Solutions | 2020 | 2019 | Change | 2020 | 2019 | Change | |||||||||||||||||||||||||||||
Regulatory1 | $ | 146.9 | $ | 130.4 | 13 | % | $ | 283.3 | $ | 250.7 | 13 | % | |||||||||||||||||||||||
Data-driven fund solutions1 | 89.4 | 81.8 | 9 | % | 171.6 | 160.4 | 7 | % | |||||||||||||||||||||||||||
Issuer1 | 20.8 | 18.3 | 14 | % | 38.6 | 33.5 | 15 | % | |||||||||||||||||||||||||||
Customer communications1 | 136.9 | 137.1 | — | % | 275.7 | 272.1 | 1 | % | |||||||||||||||||||||||||||
| Total ICS Recurring fee revenues | 393.9 | 367.5 | 7 | % | 769.1 | 716.7 | 7 | % | |||||||||||||||||||||||||||
| Equity and other | 20.8 | 15.3 | 36 | % | 39.1 | 32.8 | 19 | % | |||||||||||||||||||||||||||
| Mutual funds | 24.4 | 15.7 | 55 | % | 51.6 | 38.3 | 35 | % | |||||||||||||||||||||||||||
| Total ICS Event-driven fee revenues | 45.2 | 31.0 | 46 | % | 90.7 | 71.1 | 28 | % | |||||||||||||||||||||||||||
| Distribution revenues | 344.8 | 317.0 | 9 | % | 676.9 | 630.3 | 7 | % | |||||||||||||||||||||||||||
| Total ICS Revenues | $ | 783.9 | $ | 715.6 | 10 | % | $ | 1,536.7 | $ | 1,418.2 | 8 | % | |||||||||||||||||||||||
| Global Technology and Operations | |||||||||||||||||||||||||||||||||||
Capital markets1 | $ | 167.5 | $ | 162.1 | 3 | % | $ | 332.1 | $ | 310.3 | 7 | % | |||||||||||||||||||||||
Wealth and investment management1 | 134.8 | 118.8 | 13 | % | 266.3 | 244.6 | 9 | % | |||||||||||||||||||||||||||
| Total GTO Recurring fee revenues | 302.3 | 280.9 | 8 | % | 598.4 | 554.8 | 8 | % | |||||||||||||||||||||||||||
| Foreign currency exchange | (31.2) | (27.8) | 12 | % | (62.7) | (55.8) | 12 | % | |||||||||||||||||||||||||||
| Total Revenues | $ | 1,054.9 | $ | 968.7 | 9 | % | $ | 2,072.3 | $ | 1,917.2 | 8 | % | |||||||||||||||||||||||
| Revenues by Type | |||||||||||||||||||||||||||||||||||
| Recurring fee revenues | $ | 696.2 | $ | 648.4 | 7 | % | $ | 1,367.5 | $ | 1,271.6 | 8 | % | |||||||||||||||||||||||
| Event-driven fee revenues | 45.2 | 31.0 | 46 | % | 90.7 | 71.1 | 28 | % | |||||||||||||||||||||||||||
| Distribution revenues | 344.8 | 317.0 | 9 | % | 676.9 | 630.3 | 7 | % | |||||||||||||||||||||||||||
| Foreign currency exchange | (31.2) | (27.8) | 12 | % | (62.7) | (55.8) | 12 | % | |||||||||||||||||||||||||||
| Total Revenues | $ | 1,054.9 | $ | 968.7 | 9 | % | $ | 2,072.3 | $ | 1,917.2 | 8 | % | |||||||||||||||||||||||
Amounts may not sum due to rounding.
1 In the second quarter of fiscal year 2021, the Company changed its presentation of disaggregated revenue by product line disclosures to reflect internal realignment of the Company’s revenue reporting, specifically as it relates to Recurring fee revenues. Presentation of disaggregated revenue by product line disclosures in prior periods have been changed to conform to the current period presentation.
12
Select Operating Metrics
(Unaudited)
| Three Months Ended December 31, | Six Months Ended December 31, | ||||||||||||||||||||||||||||||||||
| In millions | 2020 | 2019 | % Change | 2020 | 2019 | % Change | |||||||||||||||||||||||||||||
Closed sales1 | $46.0 | $45.1 | 2% | $78.8 | $82.7 | (5)% | |||||||||||||||||||||||||||||
Record Growth2 | |||||||||||||||||||||||||||||||||||
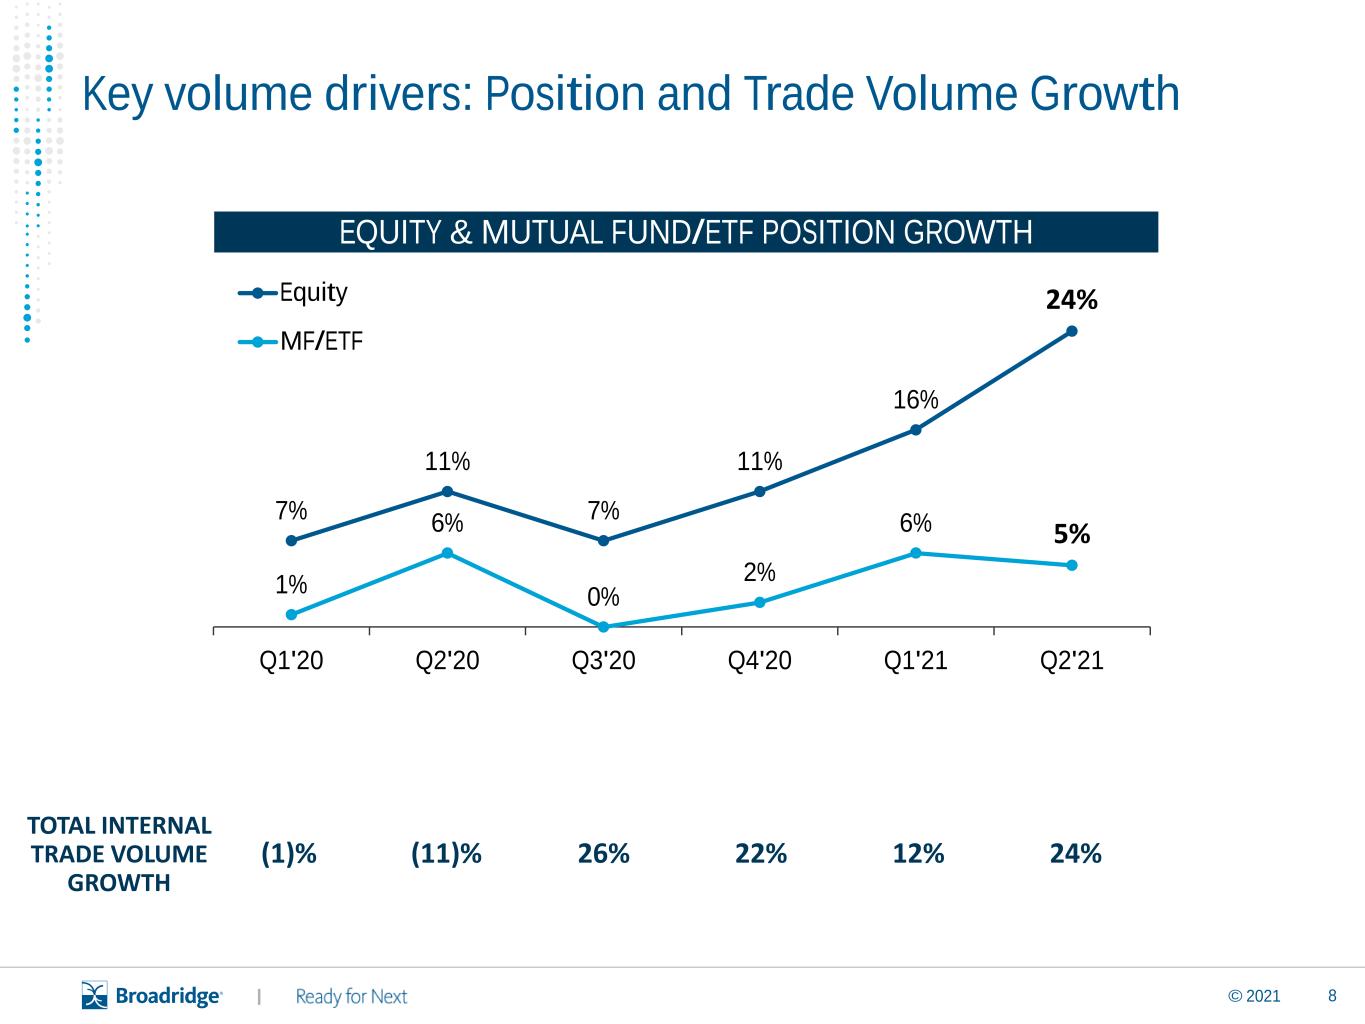
| Equity proxy | 24% | 11% | 20% | 10% | |||||||||||||||||||||||||||||||
| Mutual fund interims | 5% | 6% | 8% | 4% | |||||||||||||||||||||||||||||||
Internal Trade Growth3 | 24% | (11)% | 17% | (6)% | |||||||||||||||||||||||||||||||
| Amounts may not sum due to rounding. | |||||||||||||||||||||||||||||||||||
1Refer to the “Results of Operations” section of Broadridge’s Form 10-Q for a description of Closed sales and its calculation. | |||||||||||||||||||||||||||||||||||
2Stock record growth and interim record growth measure the estimated annual change in total positions eligible for equity proxy materials and mutual fund & ETF interim communications, respectively, for equities and mutual fund position data reported to Broadridge in both the current and prior year periods. | |||||||||||||||||||||||||||||||||||
3Internal trade growth represents the estimate change in trade volumes for clients whose contracts are linked to trade volumes and who were on Broadridge’s trading platforms in both the current and prior year periods. | |||||||||||||||||||||||||||||||||||
13
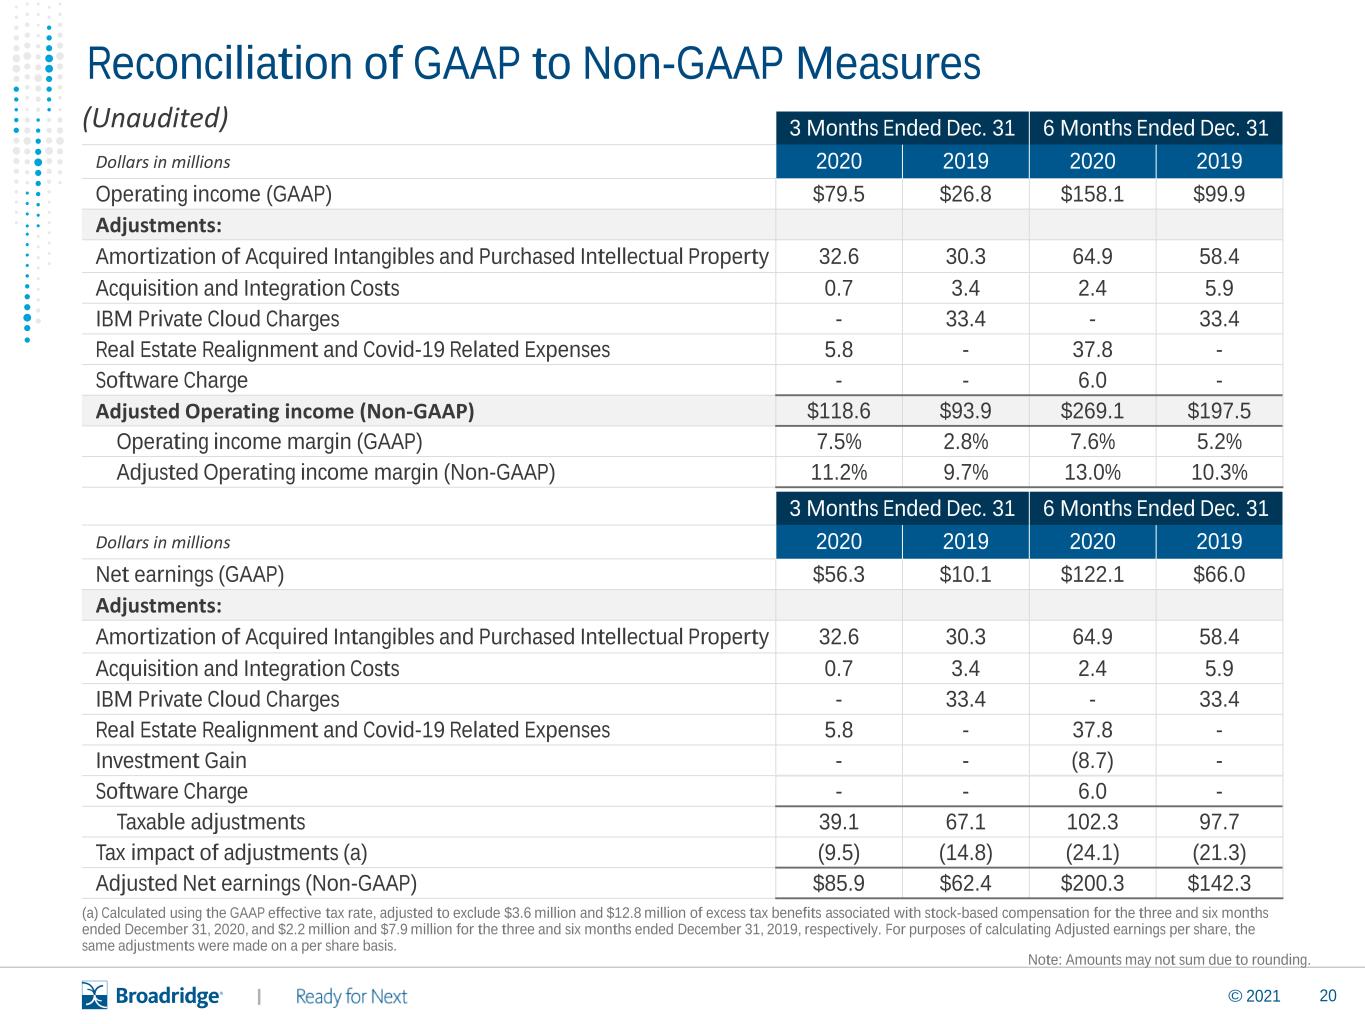
Reconciliation of Non-GAAP to GAAP Measures
(Unaudited)
| In millions, except per share amounts | Three Months Ended December 31, | Six Months Ended December 31, | |||||||||||||||||||||
| 2020 | 2019 | 2020 | 2019 | ||||||||||||||||||||
| Reconciliation of Adjusted Operating Income | |||||||||||||||||||||||
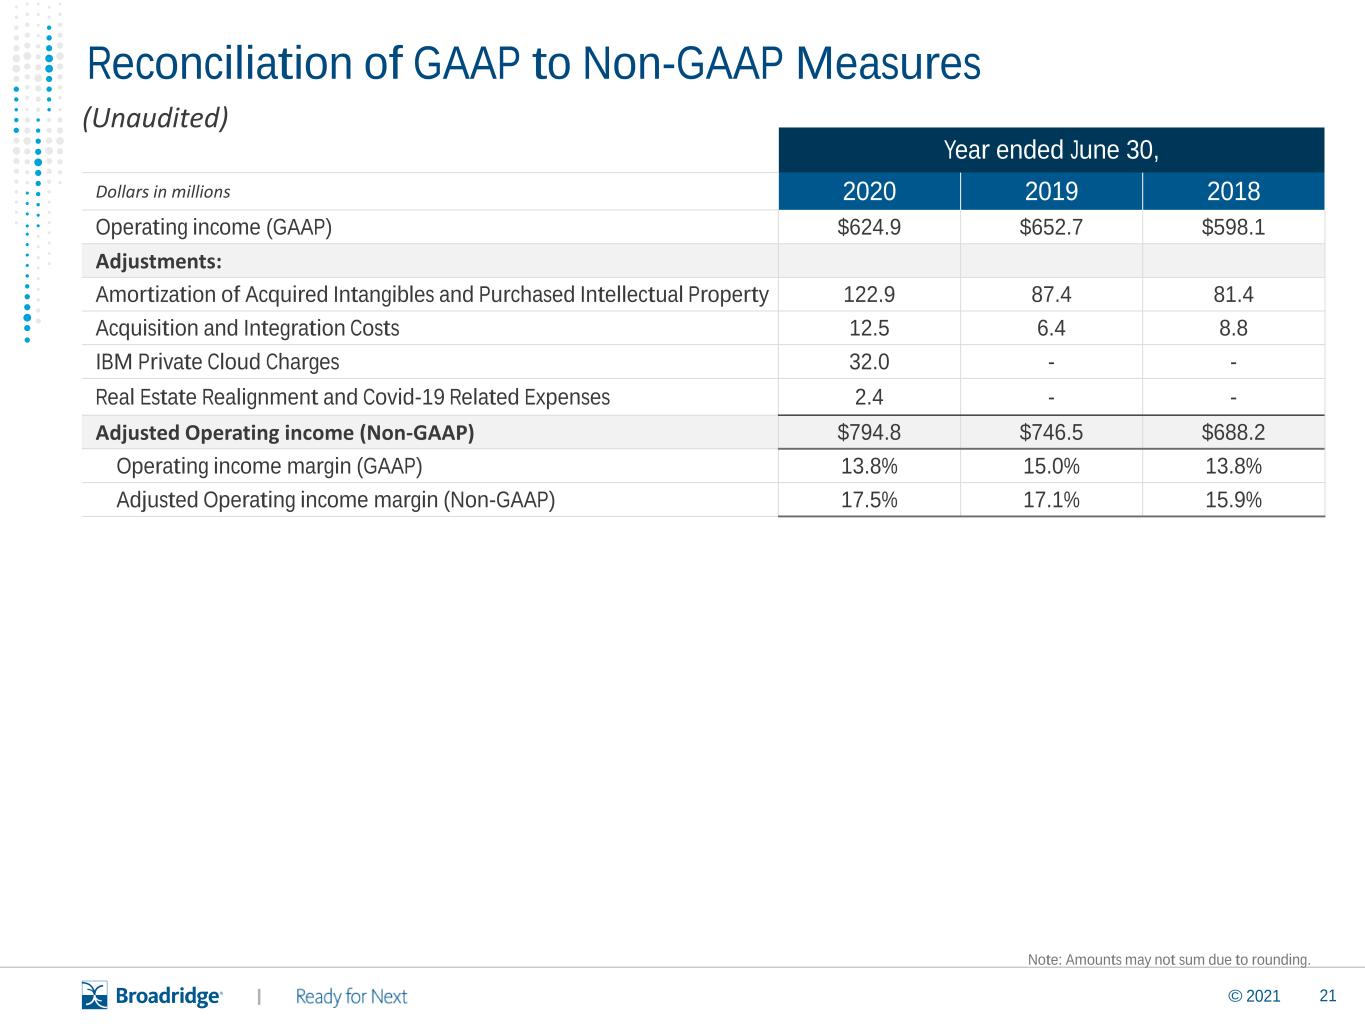
| Operating income (GAAP) | $ | 79.5 | $ | 26.8 | $ | 158.1 | $ | 99.9 | |||||||||||||||
| Adjustments: | |||||||||||||||||||||||
| Amortization of Acquired Intangibles and Purchased Intellectual Property | 32.6 | 30.3 | 64.9 | 58.4 | |||||||||||||||||||
| Acquisition and Integration Costs | 0.7 | 3.4 | 2.4 | 5.9 | |||||||||||||||||||
| IBM Private Cloud Charges | — | 33.4 | — | 33.4 | |||||||||||||||||||
Real Estate Realignment and Covid-19 Related Expenses | 5.8 | — | 37.8 | — | |||||||||||||||||||
| Software Charge | — | — | 6.0 | — | |||||||||||||||||||
| Adjusted Operating income (Non-GAAP) | $ | 118.6 | $ | 93.9 | $ | 269.1 | $ | 197.5 | |||||||||||||||
| Operating income margin (GAAP) | 7.5% | 2.8% | 7.6% | 5.2% | |||||||||||||||||||
| Adjusted Operating income margin (Non-GAAP) | 11.2% | 9.7% | 13.0% | 10.3% | |||||||||||||||||||
| Reconciliation of Adjusted Net earnings | |||||||||||||||||||||||
| Net earnings (GAAP) | $ | 56.3 | $ | 10.1 | $ | 122.1 | $ | 66.0 | |||||||||||||||
| Adjustments: | |||||||||||||||||||||||
| Amortization of Acquired Intangibles and Purchased Intellectual Property | 32.6 | 30.3 | 64.9 | 58.4 | |||||||||||||||||||
| Acquisition and Integration Costs | 0.7 | 3.4 | 2.4 | 5.9 | |||||||||||||||||||
| IBM Private Cloud Charges | — | 33.4 | — | 33.4 | |||||||||||||||||||
Real Estate Realignment and Covid-19 Related Expenses | 5.8 | — | 37.8 | — | |||||||||||||||||||
| Investment Gain | — | — | (8.7) | — | |||||||||||||||||||
| Software Charge | — | — | 6.0 | — | |||||||||||||||||||
| Taxable adjustments | 39.1 | 67.1 | 102.3 | 97.7 | |||||||||||||||||||
| Tax impact of adjustments (a) | (9.5) | (14.8) | (24.1) | (21.3) | |||||||||||||||||||
| Adjusted Net earnings (Non-GAAP) | $ | 85.9 | $ | 62.4 | $ | 200.3 | $ | 142.3 | |||||||||||||||
| Reconciliation of Adjusted EPS | |||||||||||||||||||||||
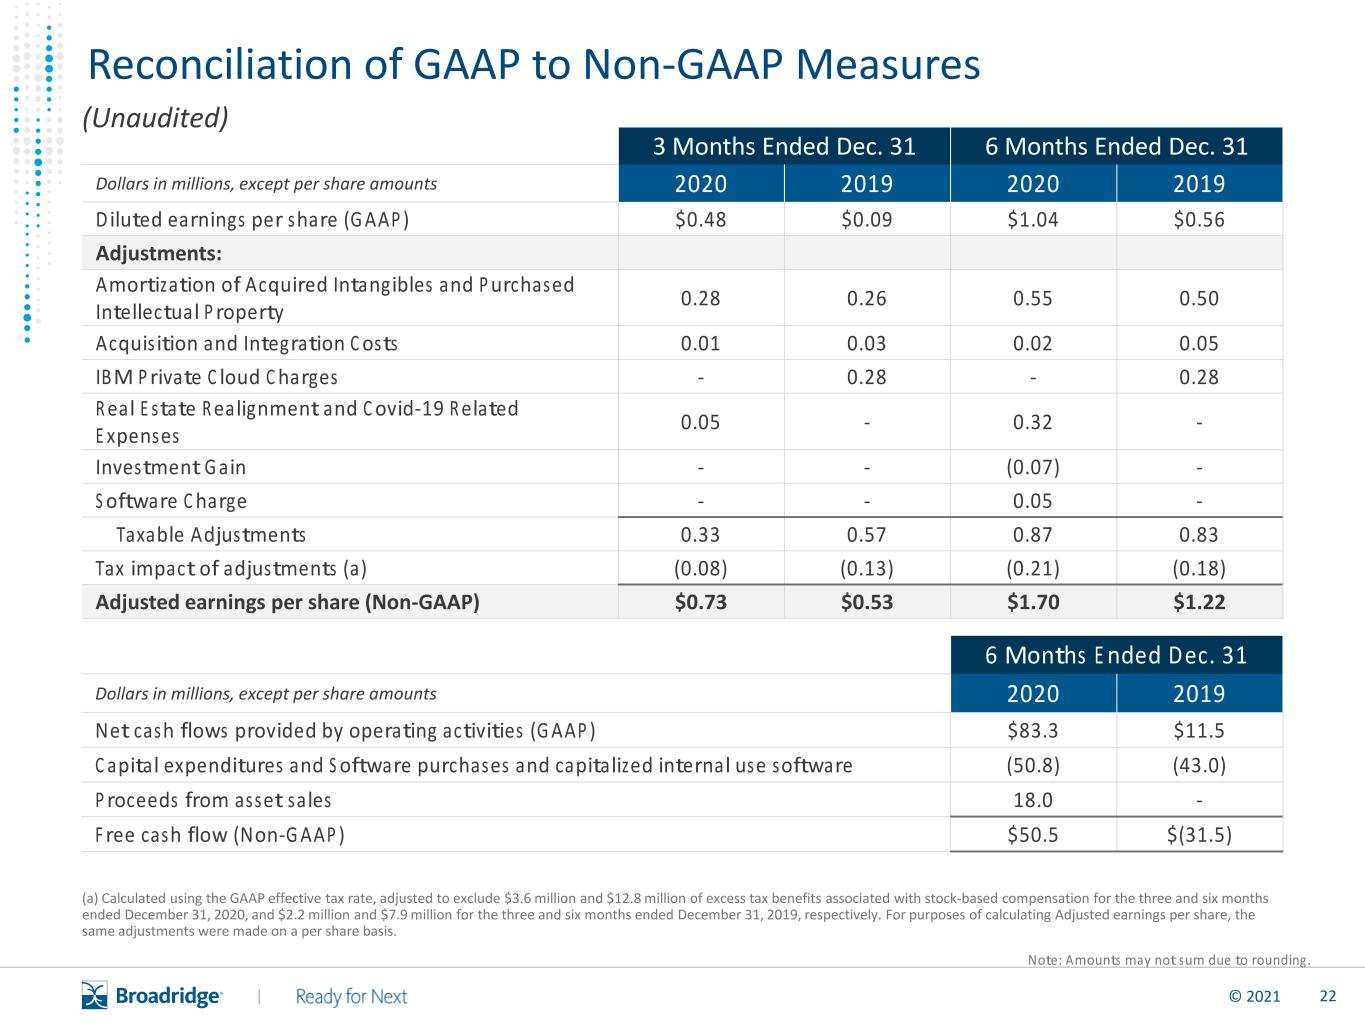
| Diluted earnings per share (GAAP) | $ | 0.48 | $ | 0.09 | $ | 1.04 | $ | 0.56 | |||||||||||||||
| Adjustments: | |||||||||||||||||||||||
| Amortization of Acquired Intangibles and Purchased Intellectual Property | 0.28 | 0.26 | 0.55 | 0.50 | |||||||||||||||||||
| Acquisition and Integration Costs | 0.01 | 0.03 | 0.02 | 0.05 | |||||||||||||||||||
| IBM Private Cloud Charges | — | 0.28 | — | 0.28 | |||||||||||||||||||
Real Estate Realignment and Covid-19 Related Expenses | 0.05 | — | 0.32 | — | |||||||||||||||||||
| Investment Gain | — | — | (0.07) | — | |||||||||||||||||||
| Software Charge | — | — | 0.05 | — | |||||||||||||||||||
| Taxable adjustments | 0.33 | 0.57 | 0.87 | 0.83 | |||||||||||||||||||
| Tax impact of adjustments (a) | (0.08) | (0.13) | (0.21) | (0.18) | |||||||||||||||||||
| Adjusted earnings per share (Non-GAAP) | $ | 0.73 | $ | 0.53 | $ | 1.70 | $ | 1.22 | |||||||||||||||
(a) Calculated using the GAAP effective tax rate, adjusted to exclude excess tax benefits associated with stock-based compensation of $3.6 million and $12.8 million for the three and six months ended December 31, 2020, and $2.2 million and $7.9 million for the three and six months ended December 31, 2019, respectively. For purposes of calculating the Adjusted earnings per share, the same adjustments were made on a per share basis.
14
| Six Months Ended December 31, | |||||||||||
| 2020 | 2019 | ||||||||||
| Reconciliation of Free Cash Flow | |||||||||||
| Net cash flows provided by operating activities (GAAP) | $ | 83.3 | $ | 11.5 | |||||||
| Capital expenditures and Software purchases and capitalized internal use software | (50.8) | (43.0) | |||||||||
| Proceeds from asset sales | 18.0 | — | |||||||||
| Free cash flow (Non-GAAP) | $ | 50.5 | $ | (31.5) | |||||||
Amounts may not sum due to rounding.
Fiscal Year 2021 Guidance
Reconciliation of Non-GAAP to GAAP Measures
Adjusted Earnings Per Share Growth and Adjusted Operating Income Margin
(Unaudited)
| FY21 Adjusted Earnings Per Share Growth Rate (a) | ||||||||
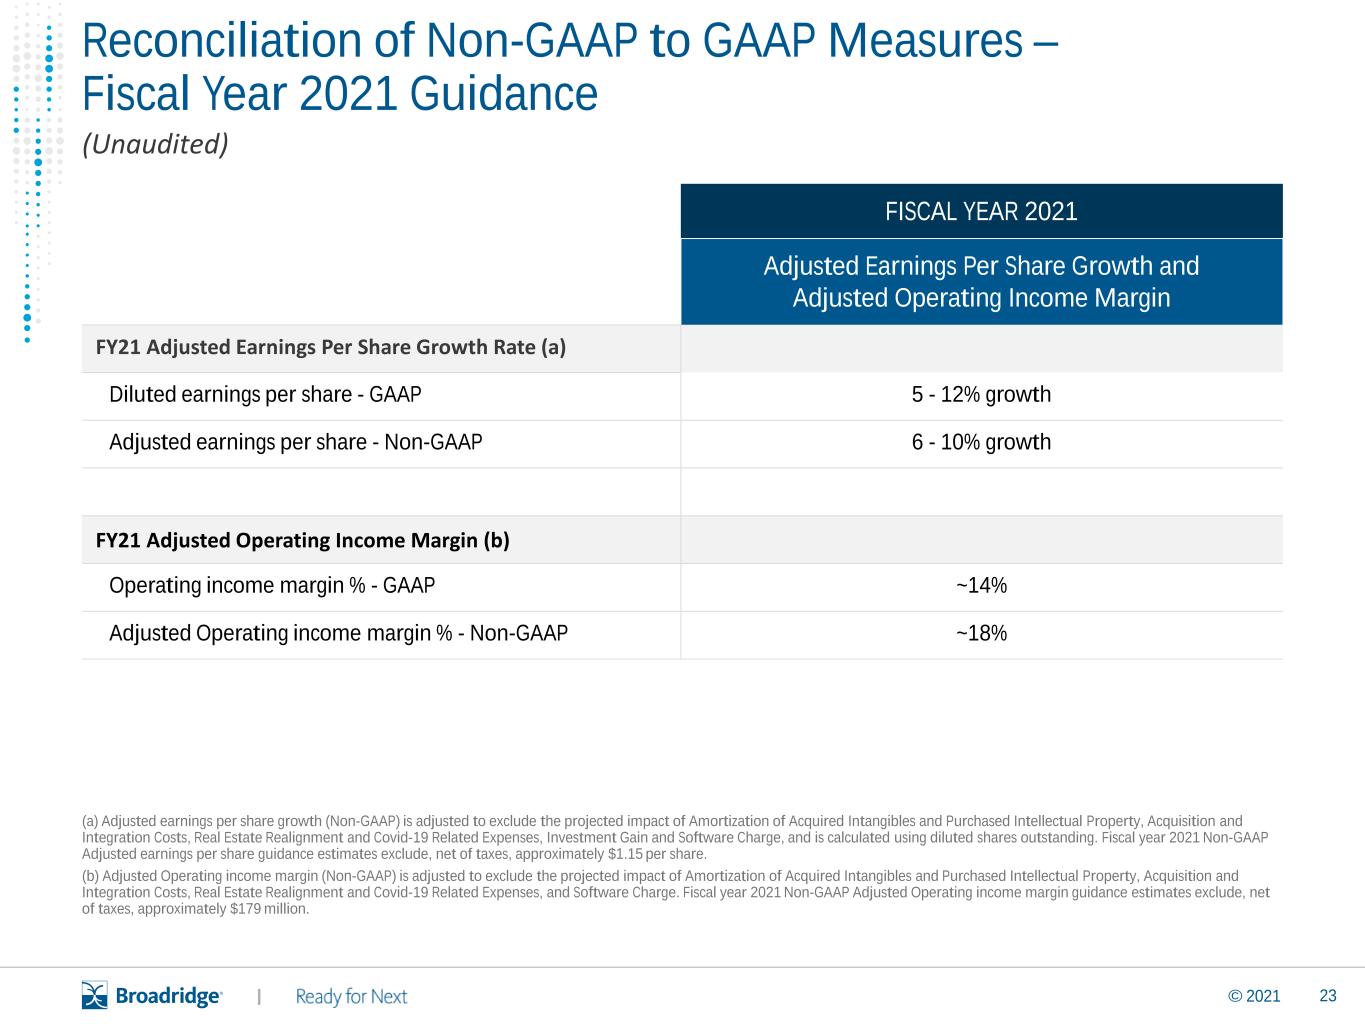
| Diluted earnings per share - GAAP | 5 - 12% growth | |||||||
| Adjusted earnings per share - Non-GAAP | 6 - 10% growth | |||||||
| FY21 Adjusted Operating Income Margin (b) | ||||||||
| Operating income margin % - GAAP | ~14% | |||||||
| Adjusted Operating income margin % - Non-GAAP | ~18% | |||||||
(a) Adjusted earnings per share growth (Non-GAAP) is adjusted to exclude the projected impact of Amortization of Acquired Intangibles and Purchased Intellectual Property, Acquisition and Integration Costs, Real Estate Realignment and Covid-19 Related Expenses, Investment Gain and Software Charge, and is calculated using diluted shares outstanding. Fiscal year 2021 Non-GAAP Adjusted earnings per share guidance estimates exclude, net of taxes, approximately $1.15 per share.
(b) Adjusted Operating income margin (Non-GAAP) is adjusted to exclude the projected impact of Amortization of Acquired Intangibles and Purchased Intellectual Property, Acquisition and Integration Costs, Real Estate Realignment and Covid-19 Related Expenses, and Software Charge. Fiscal year 2021 Non-GAAP Adjusted Operating income margin guidance estimates exclude, net of taxes, approximately $179 million.
15