brc-20250516
00007465982025Q3false00007465982025-05-162025-05-16

UNITED STATES
SECURITIES AND EXCHANGE COMMISSION
Washington, D.C. 20549
FORM 8-K
CURRENT REPORT
Pursuant to Section 13 or 15(d) of The Securities Exchange Act of 1934
Date of Report (Date of earliest event reported): May 16, 2025
BRADY CORPORATION
(Exact name of registrant as specified in its charter)
Commission File Number 1-14959
Wisconsin 39-0178960
(State or other jurisdiction of incorporation or organization) (IRS Employer Identification No.)
6555 West Good Hope Road
Milwaukee, Wisconsin 53223
(Address of principal executive offices and Zip Code)
(414) 358-6600
(Registrant’s Telephone Number)
Check the appropriate box below if the Form 8-K filing is intended to simultaneously satisfy the filing obligation of the registrant under any of the following provisions:
Written communications pursuant to Rule 425 under the Securities Act (17 CFR 230.425)
Soliciting material pursuant to Rule 14a-12 under the Exchange Act (17 CFR 240.14a-12)
Pre-commencement communications pursuant to Rule 14d-2(b) under the Exchange Act (17 CFR 240.14d-2(b))
Pre-commencement communications pursuant to Rule 13e-4(c) under the Exchange Act (17 CFR 240.13e-4(c))
Securities registered pursuant to Section 12(b) of the Act:
Title of each classTrading SymbolName of each exchange on which registered
Class A Nonvoting Common Stock, par value $0.01 per shareBRCNew York Stock Exchange
Indicate by check mark whether the registrant is an emerging growth company as defined in Rule 405 of the Securities Act of 1933 (§230.405 of this chapter) or Rule 12b-2 of the Securities Exchange Act of 1934 (§240.12b-2 of this chapter).
Emerging growth company 
If an emerging growth company, indicate by check mark if the registrant has elected not to use extended transition period for complying with any new or revised financial accounting standards provided pursuant to Section 13(a) of the Exchange Act.  ☐


Item 2.02RESULTS OF OPERATIONS AND FINANCIAL CONDITION

On May 16, 2025, Brady Corporation (the “Company”) issued a press release announcing its fiscal 2025 third quarter financial results. A copy of the press release is being furnished to the Securities and Exchange Commission as Exhibit 99.1 attached hereto and is incorporated herein by reference.

Item 7.01REGULATION FD DISCLOSURE

On May 16, 2025, the Company hosted a conference call related to its fiscal 2025 third quarter financial results. A copy of the slides referenced in the conference call, which is also posted on the Company’s website, is being furnished to the Securities and Exchange Commission as Exhibit 99.2 attached hereto and is incorporated herein by reference.

Item 9.01FINANCIAL STATEMENTS AND EXHIBITS

(d) Exhibits
EXHIBIT NUMBERDESCRIPTION
99.1
99.2
104Cover Page Interactive Data File (embedded within Inline XBRL document).

SIGNATURE
Pursuant to the requirements of the Securities Exchange Act of 1934, the Registrant has duly caused this report to be signed on its behalf by the undersigned hereunto duly authorized.
 
  BRADY CORPORATION
Date: May 16, 2025
 
 /s/ ANN E. THORNTON
 Ann E. Thornton
 Chief Financial Officer, Chief Accounting Officer and Treasurer


EXHIBIT 99.1


For More Information:
Investor contact: Ann Thornton 414-438-6887
Media contact: Kate Venne 414-358-5176


Brady Corporation Reports Record Adjusted EPS in its Fiscal 2025 Third Quarter and Tightens its Fiscal 2025 EPS Guidance

Sales for the quarter increased 11.4 percent. Organic sales increased 1.6 percent, acquisitions increased sales 10.5 percent and foreign currency translation decreased sales 0.7 percent.
Diluted EPS increased 3.8 percent to $1.09 in the third quarter of fiscal 2025 compared to $1.05 in the same quarter of the prior year. Adjusted Diluted EPS* increased 11.9 percent to a record high of $1.22 in the third quarter of fiscal 2025 compared to $1.09 in the same quarter of the prior year.
Returned $44.5 million in the quarter to shareholders in the form of dividends and share repurchases.
The Company’s Adjusted Diluted EPS* Guidance range for the full year ending July 31, 2025 was tightened from a range of $4.45 to $4.70 per share to $4.48 to $4.63 per share, and the previous range of GAAP earnings per diluted Class A Nonvoting Common share guidance was updated to $3.95 to $4.10 per share.

MILWAUKEE (May 16, 2025) -- Brady Corporation (NYSE: BRC) (“Brady” or “Company”), a world leader in identification solutions, today reported its financial results for its fiscal 2025 third quarter ended April 30, 2025.

Quarter Ended April 30, 2025 Financial Results:
Sales for the quarter ended April 30, 2025 increased 11.4 percent, which consisted of organic sales growth of 1.6 percent, growth of 10.5 percent from acquisitions and a decline of 0.7 percent from foreign currency translation. Sales for the quarter ended April 30, 2025 were $382.6 million compared to $343.4 million in the same quarter last year. By region, sales increased 12.9 percent in the Americas & Asia and sales increased 8.7 percent in Europe & Australia, which consisted of organic sales growth of 5.4 percent in the Americas & Asia and an organic sales decline of 5.4 percent in Europe & Australia.
Income before income taxes increased 2.1 percent to $65.7 million in the quarter ended April 30, 2025, compared to $64.4 million in the same quarter last year. Adjusted Income Before Income Taxes* in the quarter ended April 30, 2025, which was adjusted for amortization expense and facility closure and other reorganization costs of $8.7 million, was $74.4 million, an increase of 11.5 percent compared to the same quarter last year.
Net income for the quarter ended April 30, 2025 was $52.3 million compared to $50.9 million in the same quarter last year. Adjusted Net Income* in the quarter ended April 30, 2025 was $58.8 million compared to $52.7 million in the same quarter last year. Earnings per diluted Class A Nonvoting Common Share was $1.09 compared to $1.05 in the same quarter last year. Adjusted Diluted EPS* in the quarter ended April 30, 2025 was $1.22 compared to $1.09 in the same quarter last year.


Nine-Month Period Ended April 30, 2025 Financial Results:
Sales for the nine-month period ended April 30, 2025 increased 11.9 percent, which consisted of organic sales growth of 2.6 percent, growth of 10.2 percent from acquisitions, a decline of 0.5 percent from foreign currency translation and a decline of 0.4 percent from divestitures. Sales for the nine months ended April 30, 2025 were $1.12 billion compared to $998.0 million in the same period last year. By region, sales increased 11.4 percent in the Americas & Asia and sales increased 12.8 percent in Europe & Australia, which consisted of organic growth of 5.0 percent in the Americas & Asia and an organic sales decline of 1.9 percent in Europe & Australia.
Income before income taxes decreased 1.7 percent to $176.6 million in the nine-month period ended April 30, 2025, compared to $179.6 million in the same period last year. Adjusted Income Before Income Taxes* in the nine-month period ended April 30, 2025, which was adjusted for amortization expense, facility closure and other reorganization costs and acquisition-related charges of $28.8 million, was $205.4 million, an increase of 10.0 percent compared to the same period last year.
Net income in the nine-month period ended April 30, 2025 was $139.4 million compared to $141.8 million in the same period last year. Adjusted Net Income* in the nine-month period ended April 30, 2025 was $161.1 million compared to $147.2 million in the same period last year. Earnings per diluted Class A Nonvoting Common Share was $2.89 compared to $2.91 in the same period last year. Adjusted Diluted EPS* in the nine-month period ended April 30, 2025 was $3.34 compared to $3.03 in the same period last year.

Commentary:
“Our organic sales growth in the Americas & Asia region was strong this quarter, which was driven by our increased investments in research and development and new product launches over the last several years. The result was a new all-time company record quarter of adjusted earnings per share,” said Brady’s President and Chief Executive Officer, Russell R. Shaller. “While the tariff situation is currently uncertain, we will continue to focus on the execution of our strategic initiatives and we expect to utilize our global manufacturing presence to navigate trade developments throughout our businesses.”
“In addition to our record adjusted EPS this quarter, we also used our strong balance sheet and cash generation to return funds to our shareholders through share buybacks and increased dividends. This quarter, we repurchased 476,000 shares for $33.2 million, and we returned another $11.3 million to our shareholders in the form of dividends,” said Brady’s Chief Financial Officer, Ann Thornton. “Our balance sheet provides us with the ability to continue to invest in both organic growth and strategic acquisitions to increase shareholder value, along with stability during this period of uncertainty surrounding the global trade environment.”

Fiscal 2025 Guidance:
The Company tightened its Adjusted Diluted EPS* guidance for the year ending July 31, 2025 from $4.45 to $4.70 per share to $4.48 to $4.63 per share. The Company’s GAAP earnings per diluted Class A Nonvoting Share guidance for the year ending July 31, 2025 was updated for facility closure and other reorganization costs incurred to date to $3.95 to $4.10 per share, from $3.99 to $4.24 per share.
The assumptions included in fiscal 2025 guidance include a full-year income tax rate of approximately 20 percent, depreciation and amortization expense of approximately $40 million, and capital expenditures of approximately $25 million. Fiscal 2025 guidance is based upon foreign currency exchange rates as of April 30, 2025 and assumes economic growth.


A webcast regarding Brady’s fiscal 2025 third quarter financial results will be available at www.bradycorp.com/investors beginning at 9:30 a.m. central time today.

Brady Corporation is an international manufacturer and marketer of complete solutions that identify and protect people, products and places. Brady’s products help customers increase safety, security, productivity and performance and include high-performance labels, signs, safety devices, printing systems and software. Founded in 1914, the Company has a diverse customer base in electronics, telecommunications, manufacturing, electrical, construction, medical, aerospace and a variety of other industries. Brady is headquartered in Milwaukee, Wisconsin and as of July 31, 2024, employed approximately 5,700 people in its worldwide businesses. Brady’s fiscal 2024 sales were approximately $1.34 billion. Brady stock trades on the New York Stock Exchange under the symbol BRC. More information is available on the Internet at www.bradyid.com.

* Adjusted Income Before Income Taxes, Adjusted Net Income, and Adjusted Diluted EPS are non-GAAP measures. See appendix for more information on these measures, including reconciliations to the most directly comparable GAAP measures.
###

In this news release, statements that are not reported financial results or other historic information are “forward-looking statements.” These forward-looking statements relate to, among other things, the Company's future financial position, business strategy, targets, projected sales, costs, earnings, capital expenditures, debt levels and cash flows, and plans and objectives of management for future operations.

The use of words such as “may,” “will,” “expect,” “intend,” “estimate,” “anticipate,” “believe,” “should,” “project,” “plan” or similar terminology are generally intended to identify forward-looking statements. These forward-looking statements by their nature address matters that are, to different degrees, uncertain and are subject to risks, assumptions, and other factors, some of which are beyond Brady’s control, that could cause actual results to differ materially from those expressed or implied by such forward-looking statements. For Brady, uncertainties arise from: increased cost of materials, labor, material shortages and supply chain disruptions, including as a result of tariffs or other impacts of the global trade environment; decreased demand for our products; our ability to compete effectively or to successfully execute our strategy; our ability to develop technologically advanced products that meet customer demands; Brady’s ability to identify, integrate and grow acquired companies, and to manage contingent liabilities from divested businesses; difficulties in protecting our websites, networks, and systems against security breaches; risks associated with the loss of key employees; extensive regulations by U.S. and non-U.S. governmental and self-regulatory entities; global climate change and environmental regulations; litigation, including product liability claims; foreign currency fluctuations; changes in tax legislation and tax rates; potential write-offs of goodwill and other intangible assets; differing interests of voting and non-voting shareholders and changes in the regulatory and business environment around dual-class voting structures; numerous other matters of national, regional and global scale, including major public health crises and government responses thereto and those of a political, economic, business, competitive, and regulatory nature contained from time to time in Brady’s U.S. Securities and Exchange Commission filings, including, but not limited to, those factors listed in the “Risk Factors” section within Item 1A of Part I of Brady’s Form 10-K for the year ended July 31, 2024.

These uncertainties may cause Brady's actual future results to be materially different than those expressed in its forward-looking statements. Brady does not undertake to update its forward-looking statements except as required by law.


BRADY CORPORATION AND SUBSIDIARIES
CONSOLIDATED STATEMENTS OF INCOME
(Unaudited; Dollars in thousands, except per share data)

Three months ended April 30,Nine months ended April 30,
 2025202420252024
Net sales$382,590 $343,384 $1,116,330 $997,991 
Cost of goods sold187,531 166,357 555,739 487,162 
Gross margin195,059 177,027 560,591 510,829 
Operating expenses:
Research and development19,191 17,681 56,835 50,215 
Selling, general and administrative108,678 95,803 326,410 283,415 
Total operating expenses127,869 113,484 383,245 333,630 
Operating income 67,190 63,543 177,346 177,199 
Other (expense) income:
Investment and other (expense) income(509)1,596 2,850 4,718 
Interest expense(936)(728)(3,604)(2,284)
Income before income taxes65,745 64,411 176,592 179,633 
Income tax expense13,482 13,521 37,212 37,874 
Net income$52,263 $50,890 $139,380 $141,759 
Net income per Class A Nonvoting Common Share:
Basic$1.10 $1.06 $2.92 $2.94 
Diluted$1.09 $1.05 $2.89 $2.91 
Net income per Class B Voting Common Share:
Basic$1.10 $1.06 $2.90 $2.92 
Diluted$1.09 $1.05 $2.88 $2.90 
Weighted average common shares outstanding:
Basic47,644 48,004 47,743 48,294 
Diluted48,066 48,386 48,196 48,640 


BRADY CORPORATION AND SUBSIDIARIES
CONSOLIDATED BALANCE SHEETS
(Dollars in thousands)

 April 30, 2025July 31, 2024
(Unaudited)
ASSETS
Current assets:
Cash and cash equivalents$152,154 $250,118 
Accounts receivable, net of allowance for credit losses of $8,967 and $6,749, respectively224,358 185,486 
Inventories189,991 152,729 
Prepaid expenses and other current assets15,399 11,382 
Total current assets581,902 599,715 
Property, plant and equipment—net219,082 195,758 
Goodwill682,554 589,611 
Other intangible assets111,685 51,839 
Deferred income taxes20,583 15,596 
Operating lease assets58,118 38,504 
Other assets24,191 24,546 
Total$1,698,115 $1,515,569 
LIABILITIES AND STOCKHOLDERS’ EQUITY
Current liabilities:
Accounts payable$99,754 $84,691 
Accrued compensation and benefits87,506 77,954 
Taxes, other than income taxes19,711 14,061 
Accrued income taxes2,976 7,424 
Current operating lease liabilities15,030 13,382 
Other current liabilities86,809 67,170 
Total current liabilities311,786 264,682 
Long-term debt102,819 90,935 
Long-term operating lease liabilities43,772 25,342 
Other liabilities72,185 67,952 
Total liabilities530,562 448,911 
Stockholders’ equity:
Common stock:
Class A nonvoting common stock—Issued 51,261,487 shares, and outstanding 43,774,580 and 44,042,462 shares, respectively513 513 
Class B voting common stock—Issued and outstanding, 3,538,628 shares35 35 
Additional paid-in capital357,545 353,654 
Retained earnings1,279,168 1,174,025 
Treasury stock—7,486,907 and 7,219,025 shares, respectively, of Class A nonvoting common stock, at cost(375,974)(351,947)
Accumulated other comprehensive loss(93,734)(109,622)
Total stockholders’ equity1,167,553 1,066,658 
Total$1,698,115 $1,515,569 


BRADY CORPORATION AND SUBSIDIARIES
CONSOLIDATED STATEMENTS OF CASH FLOWS
(Unaudited; Dollars in thousands)

Nine months ended April 30,
20252024
Operating activities:
Net income$139,380 $141,759 
Adjustments to reconcile net income to net cash provided by operating activities:
Depreciation and amortization30,279 22,406 
Stock-based compensation expense9,762 6,422 
Deferred income taxes(6,038)(6,902)
Other(181)1,358 
Changes in operating assets and liabilities:
Accounts receivable(6,869)(15,915)
Inventories(8,209)20,861 
Prepaid expenses and other assets(3,754)(1,849)
Accounts payable and accrued liabilities(26,415)7,347 
Income taxes(5,081)(4,393)
Net cash provided by operating activities122,874 171,094 
Investing activities:
Purchases of property, plant and equipment(18,685)(69,157)
Acquisition of businesses, net of cash acquired(147,248)— 
Other854 (1,174)
Net cash used in investing activities(165,079)(70,331)
Financing activities:
Payment of dividends(34,237)(33,890)
Proceeds from exercise of stock options5,759 5,583 
Payments for employee taxes withheld from stock-based awards(2,518)(2,664)
Purchase of treasury stock(33,155)(72,225)
Proceeds from borrowing on credit agreement206,249 111,790 
Repayment of borrowing on credit agreement(194,365)(97,732)
Other190 149 
Net cash used in financing activities(52,077)(88,989)
Effect of exchange rate changes on cash and cash equivalents(3,682)(2,848)
Net (decrease) increase in cash and cash equivalents(97,964)8,926 
Cash and cash equivalents, beginning of period250,118 151,532 
Cash and cash equivalents, end of period$152,154 $160,458 


BRADY CORPORATION AND SUBSIDIARIES
SEGMENT INFORMATION
(Unaudited; Dollars in thousands)

Three months ended April 30,Nine months ended April 30,
2025202420252024
NET SALES
Americas & Asia$253,652 $224,766 $732,926 $658,035 
Europe & Australia128,938 118,618 383,404 339,956 
Total$382,590 $343,384 $1,116,330 $997,991 
SALES INFORMATION
Americas & Asia
Organic5.4 %4.5 %5.0 %3.0 %
Acquisitions8.6 %— %7.9 %— %
Currency(1.1)%(0.1)%(1.0)%— %
Divestiture— %(3.5)%(0.5)%(3.5)%
Total12.9 %0.9 %11.4 %(0.5)%
Europe & Australia
Organic(5.4)%4.4 %(1.9)%2.8 %
Acquisitions14.2 %— %14.8 %— %
Currency(0.1)%(0.6)%(0.1)%1.9 %
Total8.7 %3.8 %12.8 %4.7 %
Total Company
Organic1.6 %4.5 %2.6 %3.0 %
Acquisitions10.5 %— %10.2 %— %
Currency(0.7)%(0.3)%(0.5)%0.6 %
Divestiture— %(2.3)%(0.4)%(2.4)%
Total11.4 %1.9 %11.9 %1.2 %
SEGMENT PROFIT
Americas & Asia$57,164 $49,697 $158,148 $143,489 
Europe & Australia17,478 19,537 41,872 51,335 
Total segment profit$74,642 $69,234 $200,020 $194,824 
SEGMENT PROFIT AS A PERCENT OF NET SALES
Americas & Asia22.5 %22.1 %21.6 %21.8 %
Europe & Australia13.6 %16.5 %10.9 %15.1 %
Total19.5 %20.2 %17.9 %19.5 %
Three months ended April 30,Nine months ended April 30,
2025202420252024
Total segment profit$74,642 $69,234 $200,020 $194,824 
Unallocated amounts:
Administrative costs(7,452)(5,691)(22,674)(17,625)
Investment and other (expense) income(509)1,596 2,850 4,718 
Interest expense(936)(728)(3,604)(2,284)
Income before income taxes$65,745 $64,411 $176,592 $179,633 


GAAP to NON-GAAP MEASURES
(Unaudited; Dollars in Thousands, Except Per Share Amounts)
In accordance with the U.S. Securities and Exchange Commission’s Regulation G, the following provides definitions of the non-GAAP measures used in the earnings release and the reconciliation to the most closely related GAAP measure.
Adjusted Income Before Income Taxes:
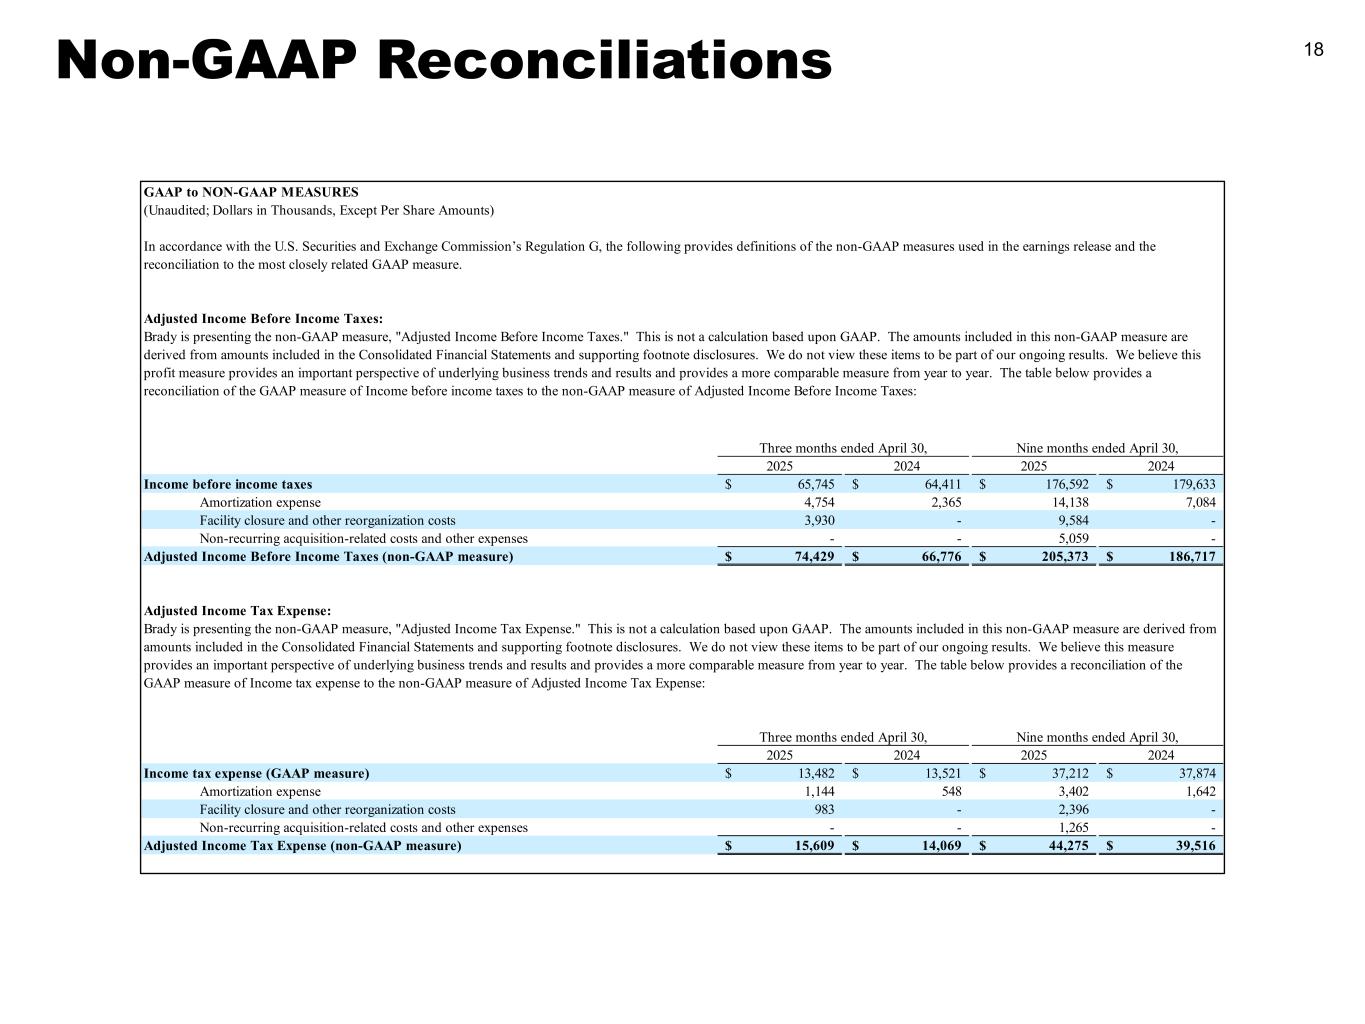
Brady is presenting the non-GAAP measure, "Adjusted Income Before Income Taxes." This is not a calculation based upon GAAP. The amounts included in this non-GAAP measure are derived from amounts included in the Consolidated Financial Statements and supporting footnote disclosures. We do not view these items to be part of our ongoing results. We believe this profit measure provides an important perspective of underlying business trends and results and provides a more comparable measure from year to year. The table below provides a reconciliation of the GAAP measure of Income before income taxes to the non-GAAP measure of Adjusted Income Before Income Taxes:
Three months ended April 30,Nine months ended April 30,
2025202420252024
Income before income taxes (GAAP measure)$65,745 $64,411 $176,592 $179,633 
Amortization expense4,754 2,365 14,138 7,084 
Facility closure and other reorganization costs3,930 — 9,584 — 
Non-recurring acquisition-related costs and other expenses— — 5,059 — 
Adjusted Income Before Income Taxes (non-GAAP measure)$74,429 $66,776 $205,373 $186,717 


Adjusted Income Tax Expense:
Brady is presenting the non-GAAP measure, "Adjusted Income Tax Expense." This is not a calculation based upon GAAP. The amounts included in this non-GAAP measure are derived from amounts included in the Consolidated Financial Statements and supporting footnote disclosures. We do not view these items to be part of our ongoing results. We believe this measure provides an important perspective of underlying business trends and results and provides a more comparable measure from year to year. The table below provides a reconciliation of the GAAP measure of Income tax expense to the non-GAAP measure of Adjusted Income Tax Expense:
Three months ended April 30,Nine months ended April 30,
2025202420252024
Income tax expense (GAAP measure)$13,482 $13,521 $37,212 $37,874 
Amortization expense1,144 548 3,402 1,642 
Facility closure and other reorganization costs983 — 2,396 — 
Non-recurring acquisition-related costs and other expenses— — 1,265 — 
Adjusted Income Tax Expense (non-GAAP measure)$15,609 $14,069 $44,275 $39,516 


Adjusted Net Income:
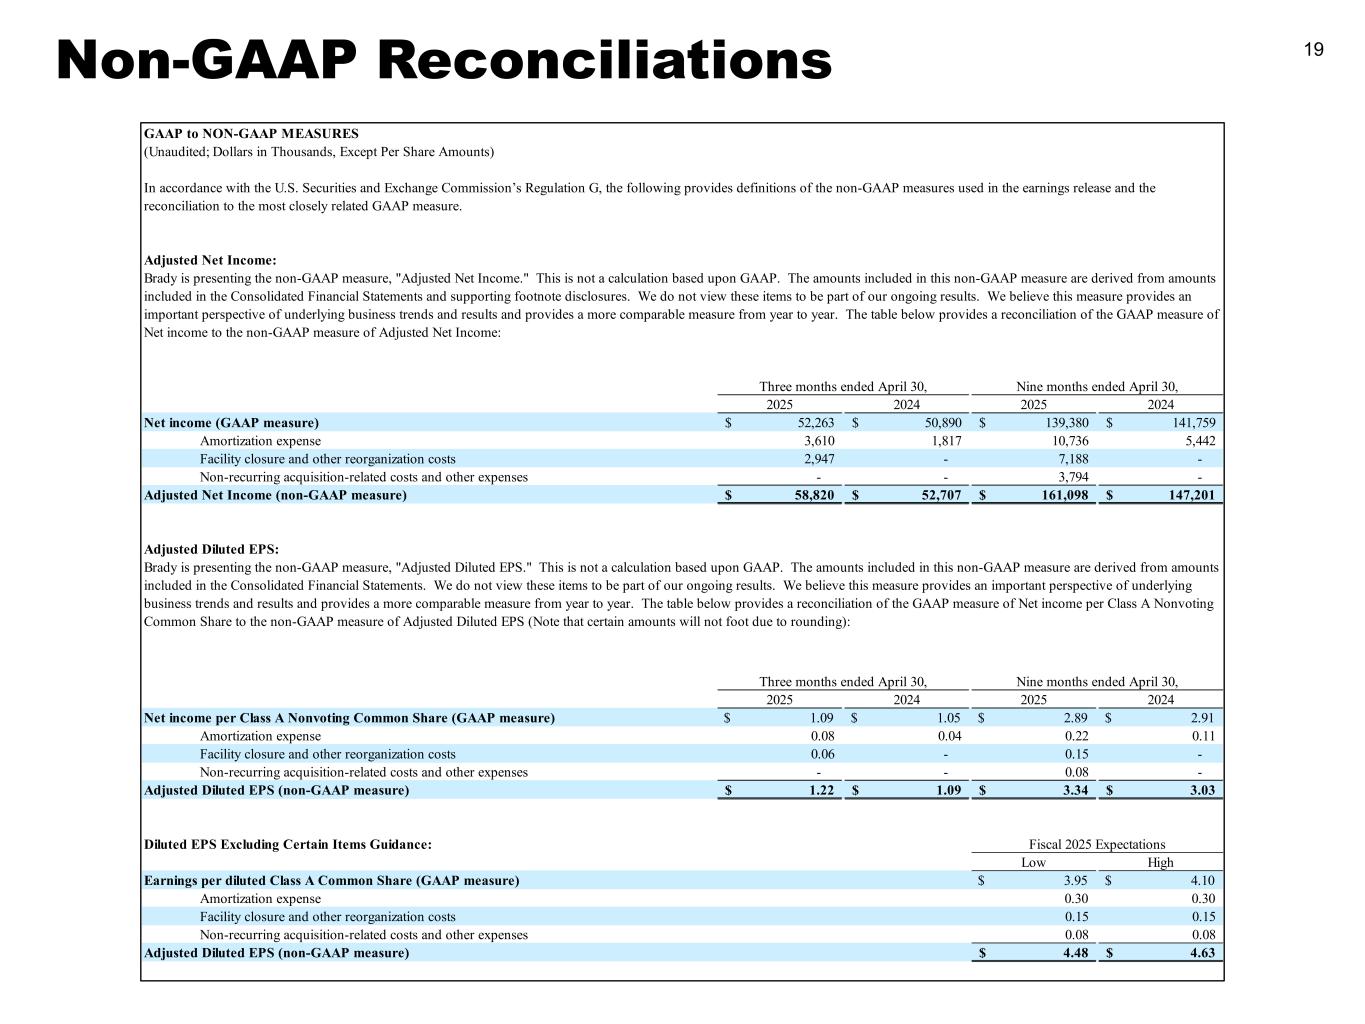
Brady is presenting the non-GAAP measure, "Adjusted Net Income." This is not a calculation based upon GAAP. The amounts included in this non-GAAP measure are derived from amounts included in the Consolidated Financial Statements and supporting footnote disclosures. We do not view these items to be part of our ongoing results. We believe this measure provides an important perspective of underlying business trends and results and provides a more comparable measure from year to year. The table below provides a reconciliation of the GAAP measure of Net income to the non-GAAP measure of Adjusted Net Income:
Three months ended April 30,Nine months ended April 30,
2025202420252024
Net income (GAAP measure)$52,263 $50,890 $139,380 $141,759 
Amortization expense3,610 1,817 10,736 5,442 
Facility closure and other reorganization costs2,947 — 7,188 — 
Non-recurring acquisition-related costs and other expenses— — 3,794 — 
Adjusted Net Income (non-GAAP measure)$58,820 $52,707 $161,098 $147,201 


Adjusted Diluted EPS:
Brady is presenting the non-GAAP measure, "Adjusted Diluted EPS." This is not a calculation based upon GAAP. The amounts included in this non-GAAP measure are derived from amounts included in the Consolidated Financial Statements. We do not view these items to be part of our ongoing results. We believe this measure provides an important perspective of underlying business trends and results and provides a more comparable measure from year to year. The table below provides a reconciliation of the GAAP measure of Net income per Class A Nonvoting Common Share to the non-GAAP measure of Adjusted Diluted EPS (Note that certain amounts will not foot due to rounding):
Three months ended April 30,Nine months ended April 30,
2025202420252024
Net income per Class A Nonvoting Common Share (GAAP measure)$1.09 $1.05 $2.89 $2.91 
Amortization expense0.08 0.04 0.22 0.11 
Facility closure and other reorganization costs0.06 — 0.15 — 
Non-recurring acquisition-related costs and other expenses— — 0.08 — 
Adjusted Diluted EPS (non-GAAP measure)$1.22 $1.09 $3.34 $3.03 


Adjusted Diluted EPS Guidance:
Fiscal 2025 Expectations
LowHigh
Earnings per Class A Nonvoting Common Share (GAAP measure)$3.95 $4.10 
Amortization expense0.30 0.30 
Facility closure and other reorganization costs0.15 0.15 
Non-recurring acquisition-related costs and other expenses0.08 0.08 
Adjusted Diluted EPS (non-GAAP measure)$4.48 $4.63 

F’25 Q3 Financial Results Brady Corporation May 16, 2025

 
Forward-Looking Statements In this news release, statements that are not reported financial results or other historic information are “forward-looking statements.” These forward-looking statements relate to, among other things, the Company's future financial position, business strategy, targets, projected sales, costs, income, capital expenditures, debt levels and cash flows, and plans and objectives of management for future operations. The use of words such as “may,” “will,” “expect,” “intend,” “estimate,” “anticipate,” “believe,” “should,” “project,” “plan” or similar terminology are generally intended to identify forward-looking statements. These forward-looking statements by their nature address matters that are, to different degrees, uncertain and are subject to risks, assumptions, and other factors, some of which are beyond Brady’s control, that could cause actual results to differ materially from those expressed or implied by such forward-looking statements. For Brady, uncertainties arise from: increased cost of materials, labor, material shortages and supply chain disruptions, including as a result of tariffs or other impacts of the global trade environment; decreased demand for our products; our ability to compete effectively or to successfully execute our strategy; our ability to develop technologically advanced products that meet customer demands; Brady’s ability to identify, integrate, and grow acquired companies, and to manage contingent liabilities from divested businesses; difficulties in protecting our websites, networks and systems against security breaches; risks associated with the loss of key employees; extensive regulations by U.S. and non-U.S. governmental and self-regulatory entities; global climate change and environmental regulations; litigation, including product liability claims; foreign currency fluctuations; potential write-offs of goodwill and other intangible assets; differing interests of voting and non-voting shareholders and changes in the regulatory and business environment around dual-class voting structures; changes in tax legislation and tax rates; numerous other matters of national, regional and global scale, including major public health crises and government responses thereto and those of a political, economic, business, competitive, and regulatory nature contained from time to time in Brady’s U.S. Securities and Exchange Commission filings, including, but not limited to, those factors listed in the “Risk Factors” section within Item 1A of Part I of Brady’s Form 10-K for the year ended July 31, 2024. These uncertainties may cause Brady's actual future results to be materially different than those expressed in its forward- looking statements. Brady does not undertake to update its forward-looking statements except as required by law. 2
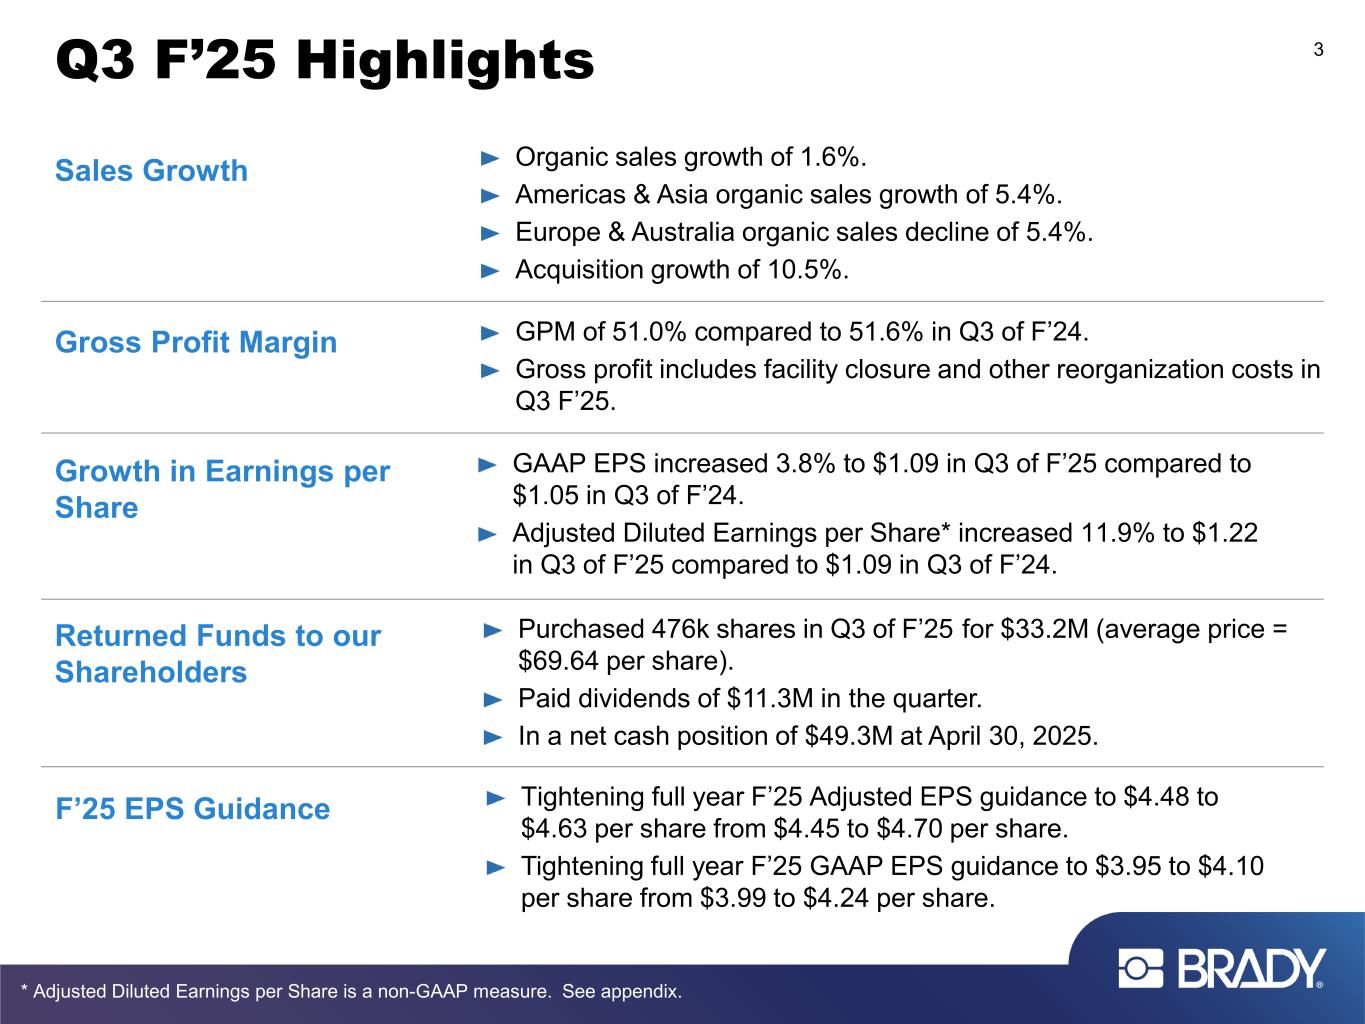

 
Q3 F’25 Highlights 3 * Adjusted Diluted Earnings per Share is a non-GAAP measure. See appendix. Organic sales growth of 1.6%. Americas & Asia organic sales growth of 5.4%. Europe & Australia organic sales decline of 5.4%. Acquisition growth of 10.5%. Sales Growth GPM of 51.0% compared to 51.6% in Q3 of F’24. Gross profit includes facility closure and other reorganization costs in Q3 F’25. Gross Profit Margin GAAP EPS increased 3.8% to $1.09 in Q3 of F’25 compared to $1.05 in Q3 of F’24. Adjusted Diluted Earnings per Share* increased 11.9% to $1.22 in Q3 of F’25 compared to $1.09 in Q3 of F’24. Growth in Earnings per Share Purchased 476k shares in Q3 of F’25 for $33.2M (average price = $69.64 per share). Paid dividends of $11.3M in the quarter. In a net cash position of $49.3M at April 30, 2025. Returned Funds to our Shareholders F’25 EPS Guidance Tightening full year F’25 Adjusted EPS guidance to $4.48 to $4.63 per share from $4.45 to $4.70 per share. Tightening full year F’25 GAAP EPS guidance to $3.95 to $4.10 per share from $3.99 to $4.24 per share.
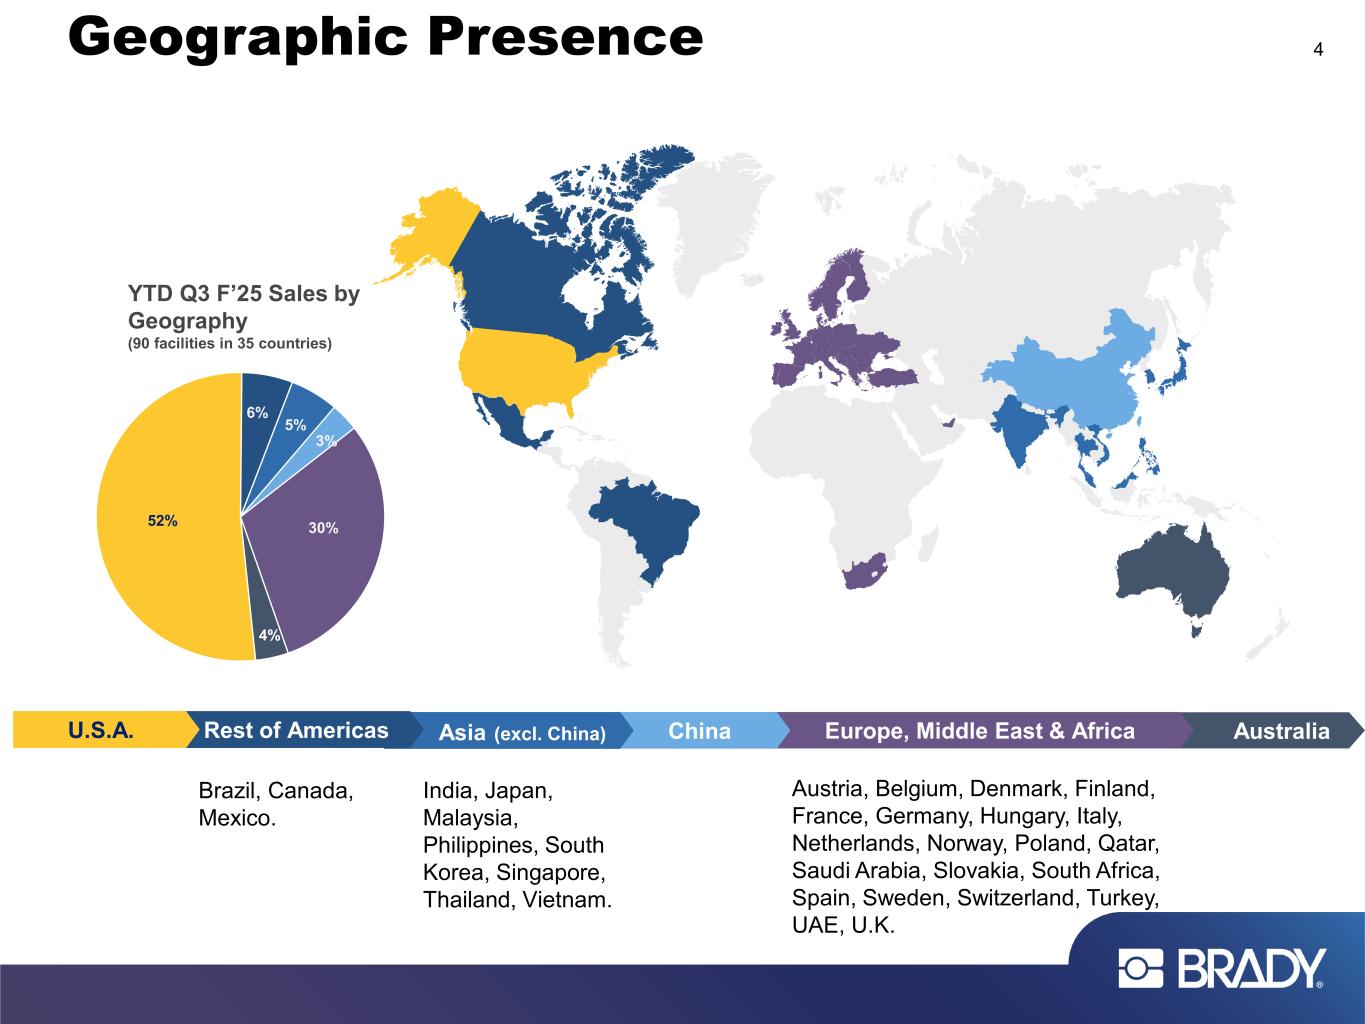

 
AustraliaEurope, Middle East & AfricaChina Geographic Presence 4 Asia (excl. China) 52% 6% 5% 3% 30% 4% Rest of AmericasU.S.A. YTD Q3 F’25 Sales by Geography (90 facilities in 35 countries) Austria, Belgium, Denmark, Finland, France, Germany, Hungary, Italy, Netherlands, Norway, Poland, Qatar, Saudi Arabia, Slovakia, South Africa, Spain, Sweden, Switzerland, Turkey, UAE, U.K. Brazil, Canada, Mexico. India, Japan, Malaysia, Philippines, South Korea, Singapore, Thailand, Vietnam.
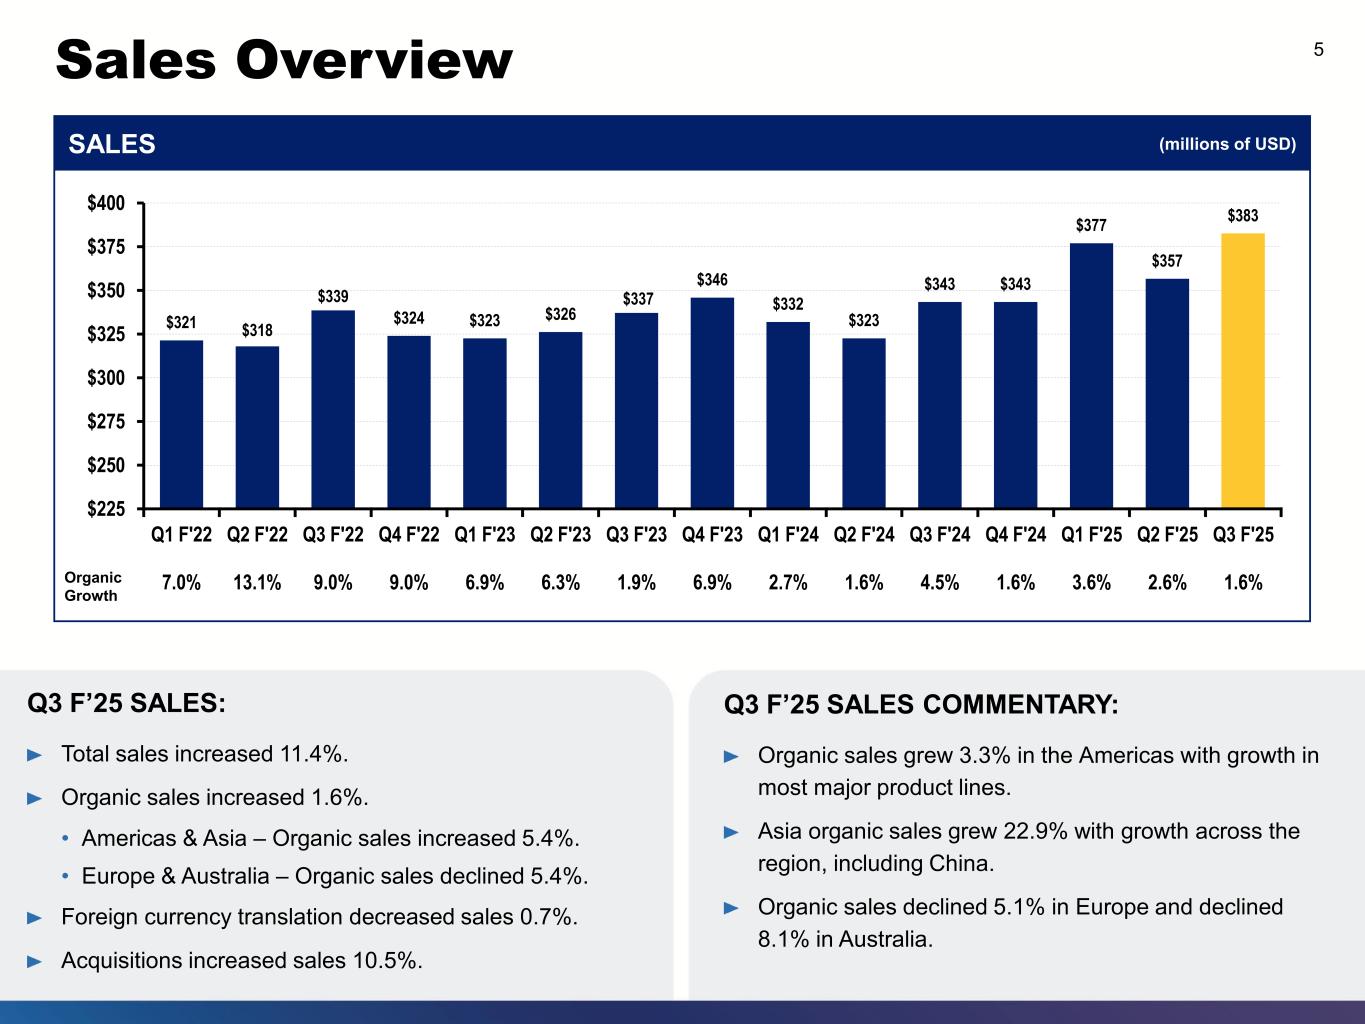

 
Sales Overview 5 Q3 F’25 SALES: Total sales increased 11.4%. Organic sales increased 1.6%. • Americas & Asia – Organic sales increased 5.4%. • Europe & Australia – Organic sales declined 5.4%. Foreign currency translation decreased sales 0.7%. Acquisitions increased sales 10.5%. $321 $318 $339 $324 $323 $326 $337 $346 $332 $323 $343 $343 $377 $357 $383 $225 $250 $275 $300 $325 $350 $375 $400 Q1 F'22 7.0% Q2 F'22 13.1% Q3 F'22 9.0% Q4 F'22 9.0% Q1 F'23 6.9% Q2 F'23 6.3% Q3 F'23 1.9% Q4 F'23 6.9% Q1 F'24 2.7% Q2 F'24 1.6% Q3 F'24 4.5% Q4 F'24 1.6% Q1 F'25 3.6% Q2 F'25 2.6% Q3 F'25 1.6%Organic Growth SALES (millions of USD) Q3 F’25 SALES COMMENTARY: Organic sales grew 3.3% in the Americas with growth in most major product lines. Asia organic sales grew 22.9% with growth across the region, including China. Organic sales declined 5.1% in Europe and declined 8.1% in Australia.
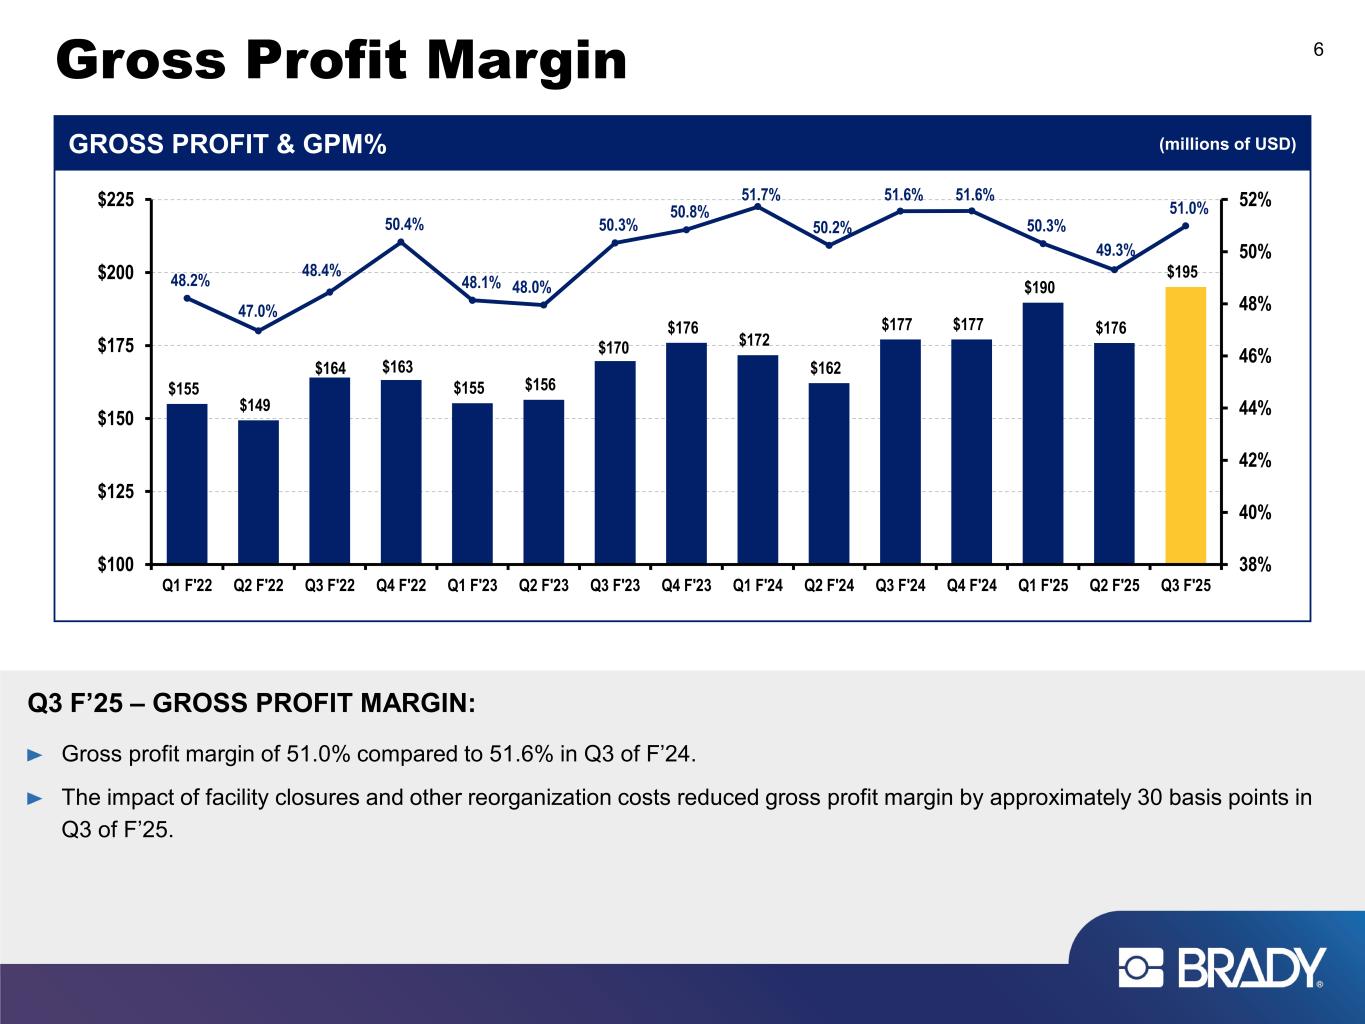

 
Gross Profit Margin 6 $155 $149 $164 $163 $155 $156 $170 $176 $172 $162 $177 $177 $190 $176 $19548.2% 47.0% 48.4% 50.4% 48.1% 48.0% 50.3% 50.8% 51.7% 50.2% 51.6% 51.6% 50.3% 49.3% 51.0% 38% 40% 42% 44% 46% 48% 50% 52% $100 $125 $150 $175 $200 $225 Q1 F'22 Q2 F'22 Q3 F'22 Q4 F'22 Q1 F'23 Q2 F'23 Q3 F'23 Q4 F'23 Q1 F'24 Q2 F'24 Q3 F'24 Q4 F'24 Q1 F'25 Q2 F'25 Q3 F'25 GROSS PROFIT & GPM% (millions of USD) Q3 F’25 – GROSS PROFIT MARGIN: Gross profit margin of 51.0% compared to 51.6% in Q3 of F’24. The impact of facility closures and other reorganization costs reduced gross profit margin by approximately 30 basis points in Q3 of F’25.
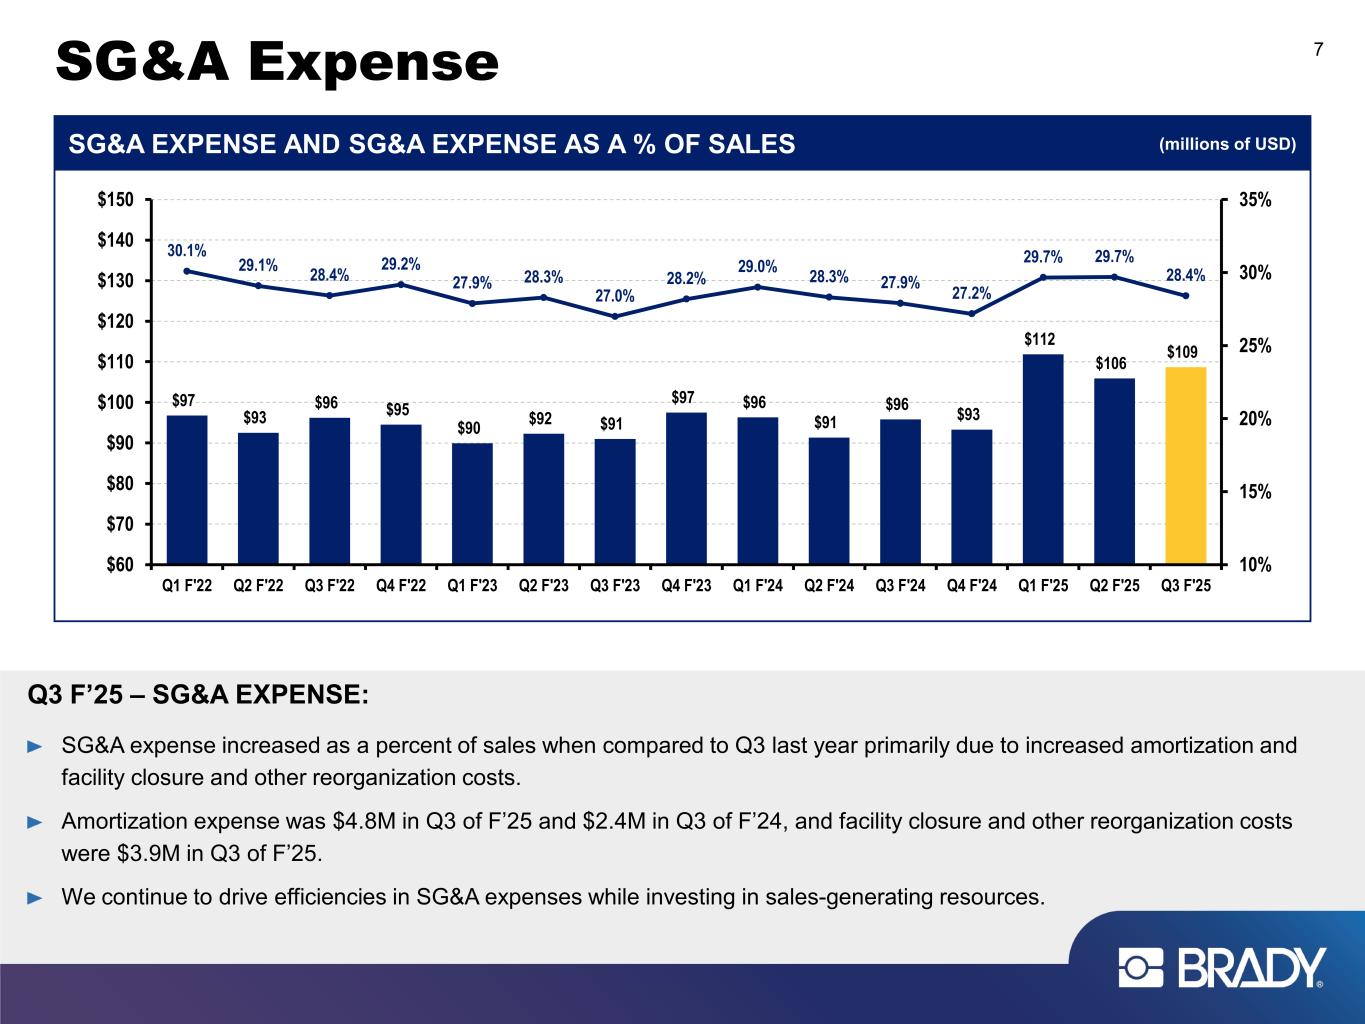

 
SG&A Expense 7 Q3 F’25 – SG&A EXPENSE: SG&A expense increased as a percent of sales when compared to Q3 last year primarily due to increased amortization and facility closure and other reorganization costs. Amortization expense was $4.8M in Q3 of F’25 and $2.4M in Q3 of F’24, and facility closure and other reorganization costs were $3.9M in Q3 of F’25. We continue to drive efficiencies in SG&A expenses while investing in sales-generating resources. $97 $93 $96 $95 $90 $92 $91 $97 $96 $91 $96 $93 $112 $106 $109 30.1% 29.1% 28.4% 29.2% 27.9% 28.3% 27.0% 28.2% 29.0% 28.3% 27.9% 27.2% 29.7% 29.7% 28.4% 10% 15% 20% 25% 30% 35% $60 $70 $80 $90 $100 $110 $120 $130 $140 $150 Q1 F'22 Q2 F'22 Q3 F'22 Q4 F'22 Q1 F'23 Q2 F'23 Q3 F'23 Q4 F'23 Q1 F'24 Q2 F'24 Q3 F'24 Q4 F'24 Q1 F'25 Q2 F'25 Q3 F'25 SG&A EXPENSE AND SG&A EXPENSE AS A % OF SALES (millions of USD)
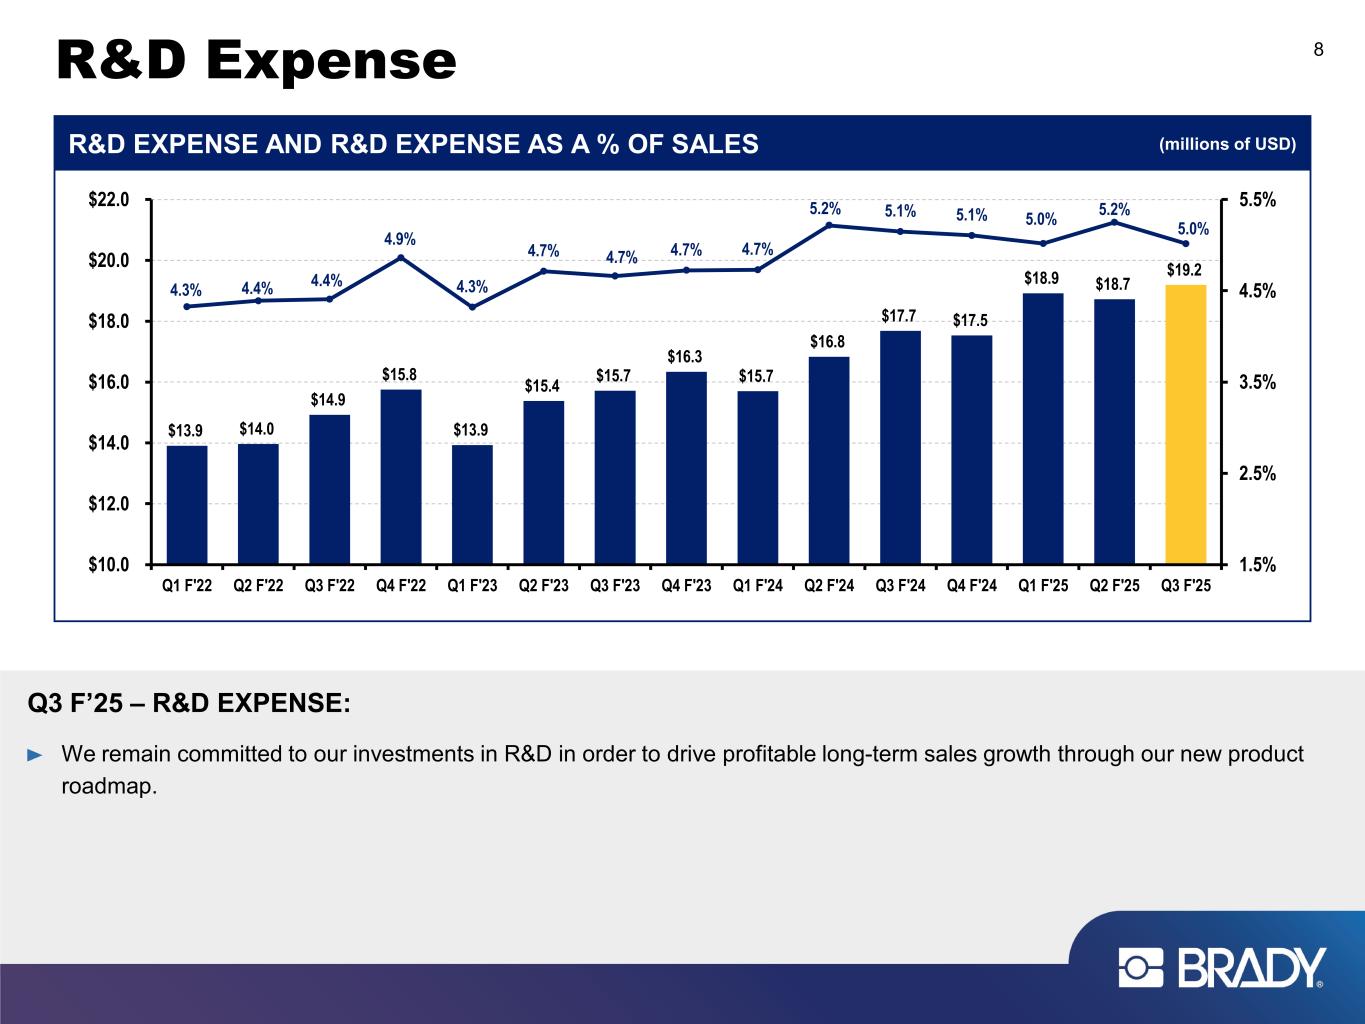

 
R&D Expense 8 Q3 F’25 – R&D EXPENSE: We remain committed to our investments in R&D in order to drive profitable long-term sales growth through our new product roadmap. $13.9 $14.0 $14.9 $15.8 $13.9 $15.4 $15.7 $16.3 $15.7 $16.8 $17.7 $17.5 $18.9 $18.7 $19.2 4.3% 4.4% 4.4% 4.9% 4.3% 4.7% 4.7% 4.7% 4.7% 5.2% 5.1% 5.1% 5.0% 5.2% 5.0% 1.5% 2.5% 3.5% 4.5% 5.5% $10.0 $12.0 $14.0 $16.0 $18.0 $20.0 $22.0 Q1 F'22 Q2 F'22 Q3 F'22 Q4 F'22 Q1 F'23 Q2 F'23 Q3 F'23 Q4 F'23 Q1 F'24 Q2 F'24 Q3 F'24 Q4 F'24 Q1 F'25 Q2 F'25 Q3 F'25 R&D EXPENSE AND R&D EXPENSE AS A % OF SALES (millions of USD)
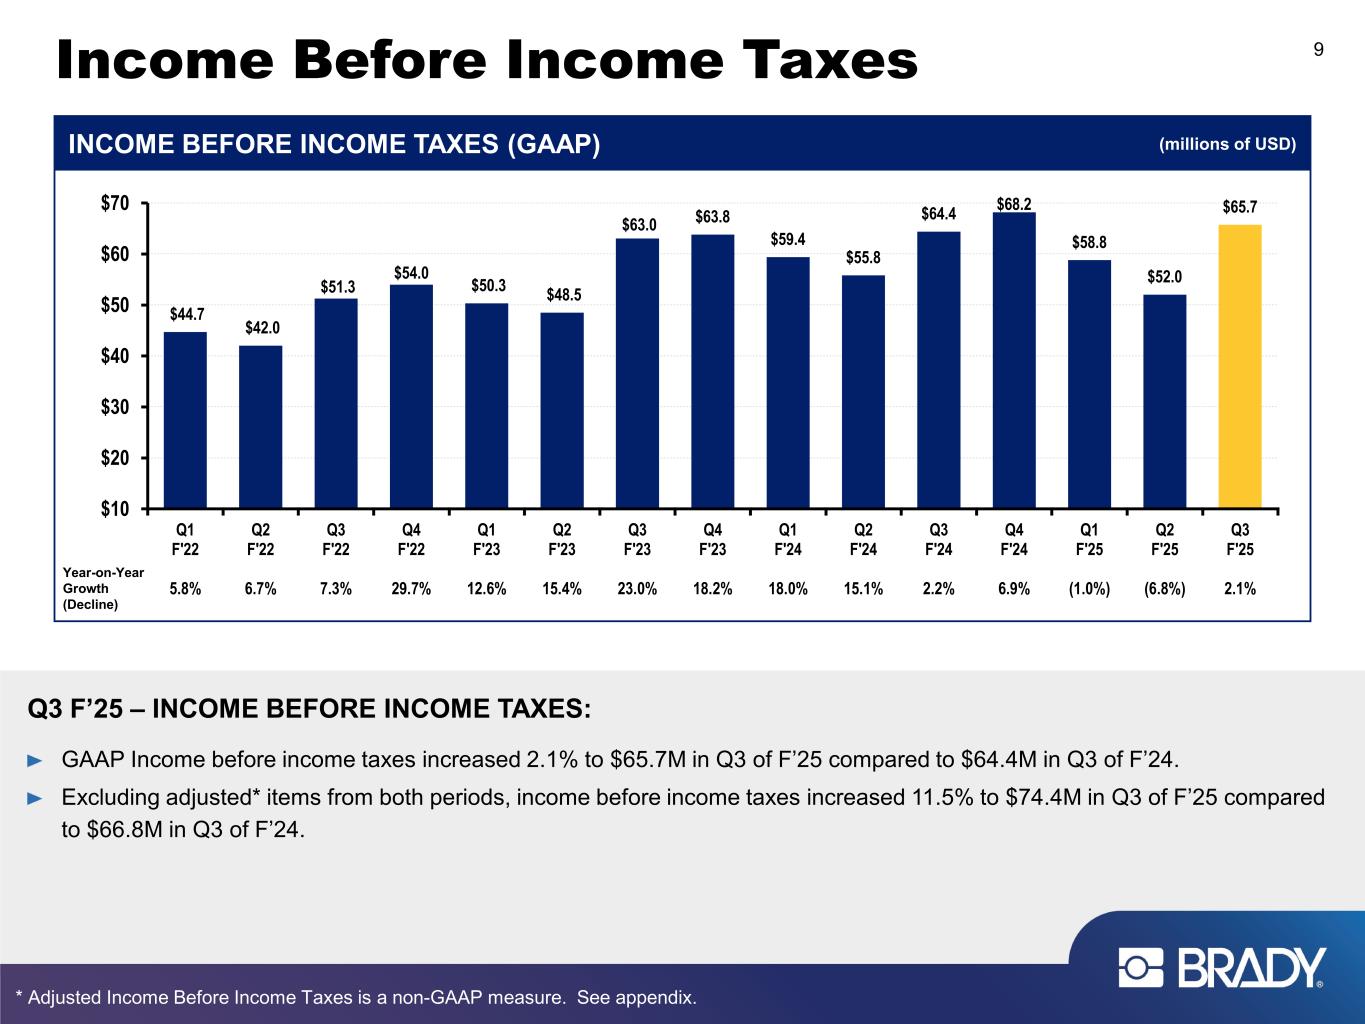

 
Income Before Income Taxes 9 $44.7 $42.0 $51.3 $54.0 $50.3 $48.5 $63.0 $63.8 $59.4 $55.8 $64.4 $68.2 $58.8 $52.0 $65.7 $10 $20 $30 $40 $50 $60 $70 Q1 F'22 5.8% Q2 F'22 6.7% Q3 F'22 7.3% Q4 F'22 29.7% Q1 F'23 12.6% Q2 F'23 15.4% Q3 F'23 23.0% Q4 F'23 18.2% Q1 F'24 18.0% Q2 F'24 15.1% Q3 F'24 2.2% Q4 F'24 6.9% Q1 F'25 (1.0%) Q2 F'25 (6.8%) Q3 F'25 2.1% * Adjusted Income Before Income Taxes is a non-GAAP measure. See appendix. (millions of USD)INCOME BEFORE INCOME TAXES (GAAP) Q3 F’25 – INCOME BEFORE INCOME TAXES: GAAP Income before income taxes increased 2.1% to $65.7M in Q3 of F’25 compared to $64.4M in Q3 of F’24. Excluding adjusted* items from both periods, income before income taxes increased 11.5% to $74.4M in Q3 of F’25 compared to $66.8M in Q3 of F’24. Year-on-Year Growth (Decline)
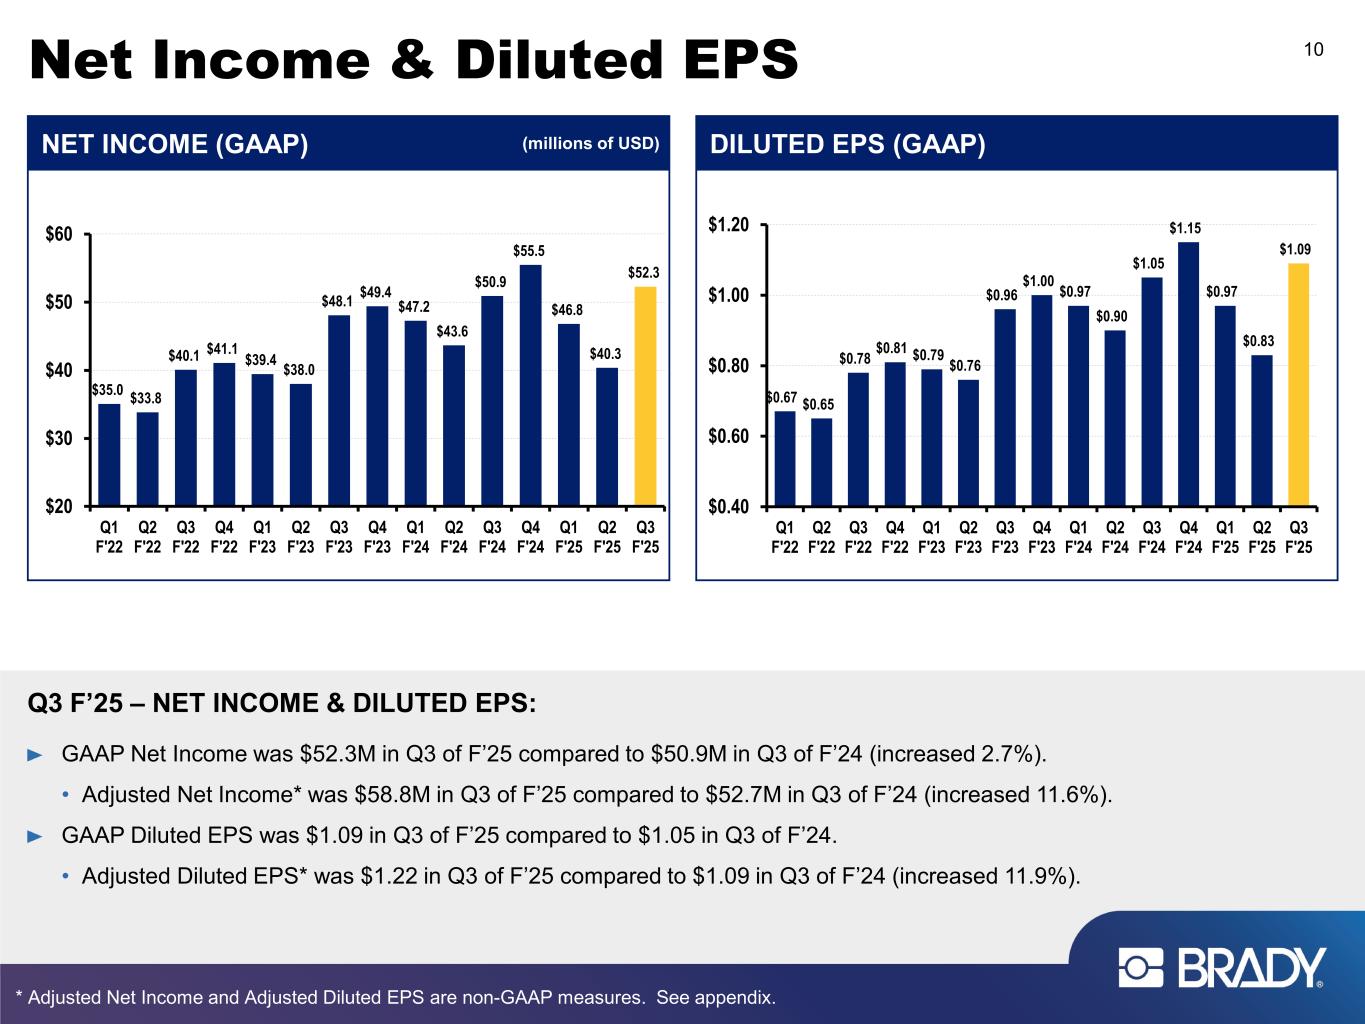

 
Net Income & Diluted EPS 10 Q3 F’25 – NET INCOME & DILUTED EPS: GAAP Net Income was $52.3M in Q3 of F’25 compared to $50.9M in Q3 of F’24 (increased 2.7%). • Adjusted Net Income* was $58.8M in Q3 of F’25 compared to $52.7M in Q3 of F’24 (increased 11.6%). GAAP Diluted EPS was $1.09 in Q3 of F’25 compared to $1.05 in Q3 of F’24. • Adjusted Diluted EPS* was $1.22 in Q3 of F’25 compared to $1.09 in Q3 of F’24 (increased 11.9%). * Adjusted Net Income and Adjusted Diluted EPS are non-GAAP measures. See appendix. $35.0 $33.8 $40.1 $41.1 $39.4 $38.0 $48.1 $49.4 $47.2 $43.6 $50.9 $55.5 $46.8 $40.3 $52.3 $20 $30 $40 $50 $60 Q1 F'22 Q2 F'22 Q3 F'22 Q4 F'22 Q1 F'23 Q2 F'23 Q3 F'23 Q4 F'23 Q1 F'24 Q2 F'24 Q3 F'24 Q4 F'24 Q1 F'25 Q2 F'25 Q3 F'25 NET INCOME (GAAP) (millions of USD) $0.67 $0.65 $0.78 $0.81 $0.79 $0.76 $0.96 $1.00 $0.97 $0.90 $1.05 $1.15 $0.97 $0.83 $1.09 $0.40 $0.60 $0.80 $1.00 $1.20 Q1 F'22 Q2 F'22 Q3 F'22 Q4 F'22 Q1 F'23 Q2 F'23 Q3 F'23 Q4 F'23 Q1 F'24 Q2 F'24 Q3 F'24 Q4 F'24 Q1 F'25 Q2 F'25 Q3 F'25 DILUTED EPS (GAAP)
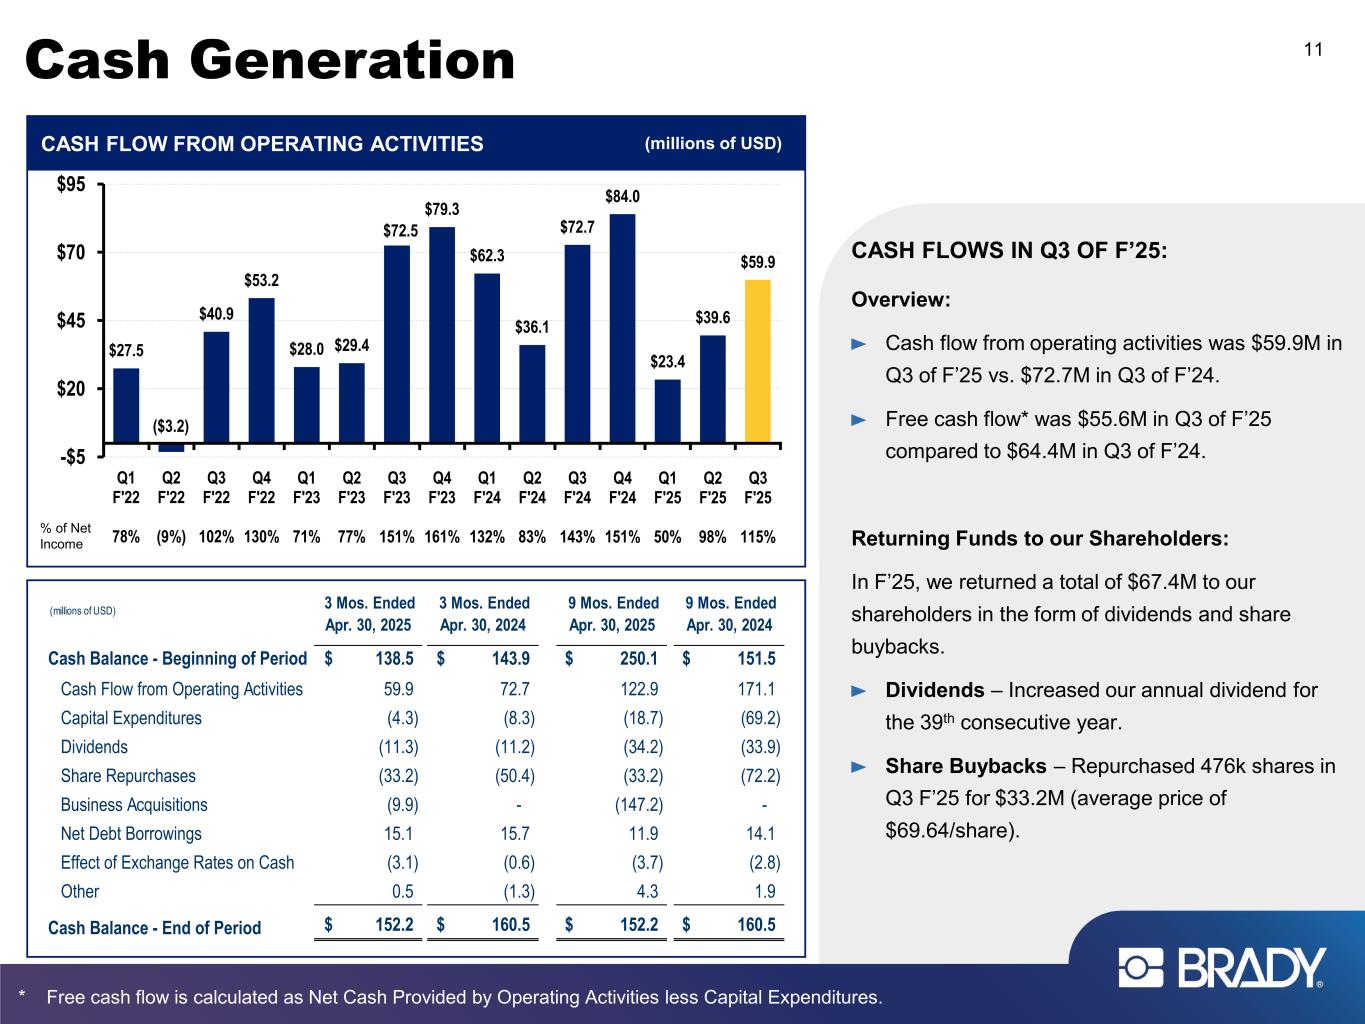

 
Cash Generation 11 CASH FLOW FROM OPERATING ACTIVITIES $27.5 ($3.2) $40.9 $53.2 $28.0 $29.4 $72.5 $79.3 $62.3 $36.1 $72.7 $84.0 $23.4 $39.6 $59.9 -$5 $20 $45 $70 $95 Q1 F'22 78% Q2 F'22 (9%) Q3 F'22 102% Q4 F'22 130% Q1 F'23 71% Q2 F'23 77% Q3 F'23 151% Q4 F'23 161% Q1 F'24 132% Q2 F'24 83% Q3 F'24 143% Q4 F'24 151% Q1 F'25 50% Q2 F'25 98% Q3 F'25 115%% of Net Income CASH FLOWS IN Q3 OF F’25: Overview: Cash flow from operating activities was $59.9M in Q3 of F’25 vs. $72.7M in Q3 of F’24. Free cash flow* was $55.6M in Q3 of F’25 compared to $64.4M in Q3 of F’24. Returning Funds to our Shareholders: In F’25, we returned a total of $67.4M to our shareholders in the form of dividends and share buybacks. Dividends – Increased our annual dividend for the 39th consecutive year. Share Buybacks – Repurchased 476k shares in Q3 F’25 for $33.2M (average price of $69.64/share). * Free cash flow is calculated as Net Cash Provided by Operating Activities less Capital Expenditures. (millions of USD) (millions of USD) 3 Mos. Ended Apr. 30, 2025 3 Mos. Ended Apr. 30, 2024 9 Mos. Ended Apr. 30, 2025 9 Mos. Ended Apr. 30, 2024 Cash Balance - Beginning of Period 138.5$ 143.9$ 250.1$ 151.5$ Cash Flow from Operating Activities 59.9 72.7 122.9 171.1 Capital Expenditures (4.3) (8.3) (18.7) (69.2) Dividends (11.3) (11.2) (34.2) (33.9) Share Repurchases (33.2) (50.4) (33.2) (72.2) Business Acquisitions (9.9) - (147.2) - Net Debt Borrowings 15.1 15.7 11.9 14.1 Effect of Exchange Rates on Cash (3.1) (0.6) (3.7) (2.8) Other 0.5 (1.3) 4.3 1.9 Cash Balance - End of Period 152.2$ 160.5$ 152.2$ 160.5$
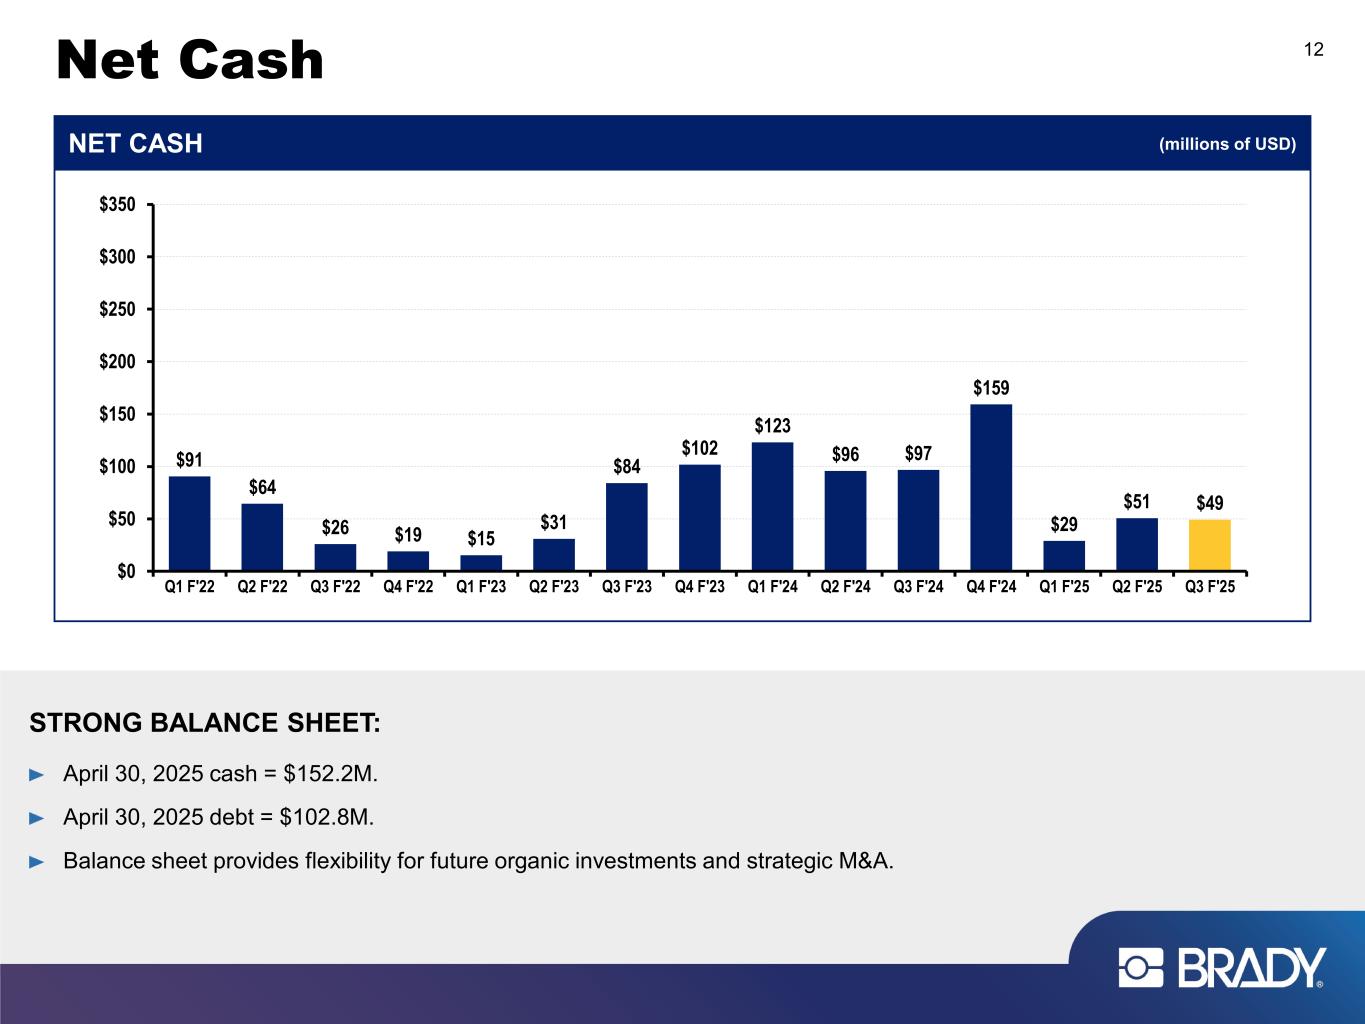

 
Net Cash 12 STRONG BALANCE SHEET: April 30, 2025 cash = $152.2M. April 30, 2025 debt = $102.8M. Balance sheet provides flexibility for future organic investments and strategic M&A. $91 $64 $26 $19 $15 $31 $84 $102 $123 $96 $97 $159 $29 $51 $49 $0 $50 $100 $150 $200 $250 $300 $350 Q1 F'22 Q2 F'22 Q3 F'22 Q4 F'22 Q1 F'23 Q2 F'23 Q3 F'23 Q4 F'23 Q1 F'24 Q2 F'24 Q3 F'24 Q4 F'24 Q1 F'25 Q2 F'25 Q3 F'25 NET CASH (millions of USD)
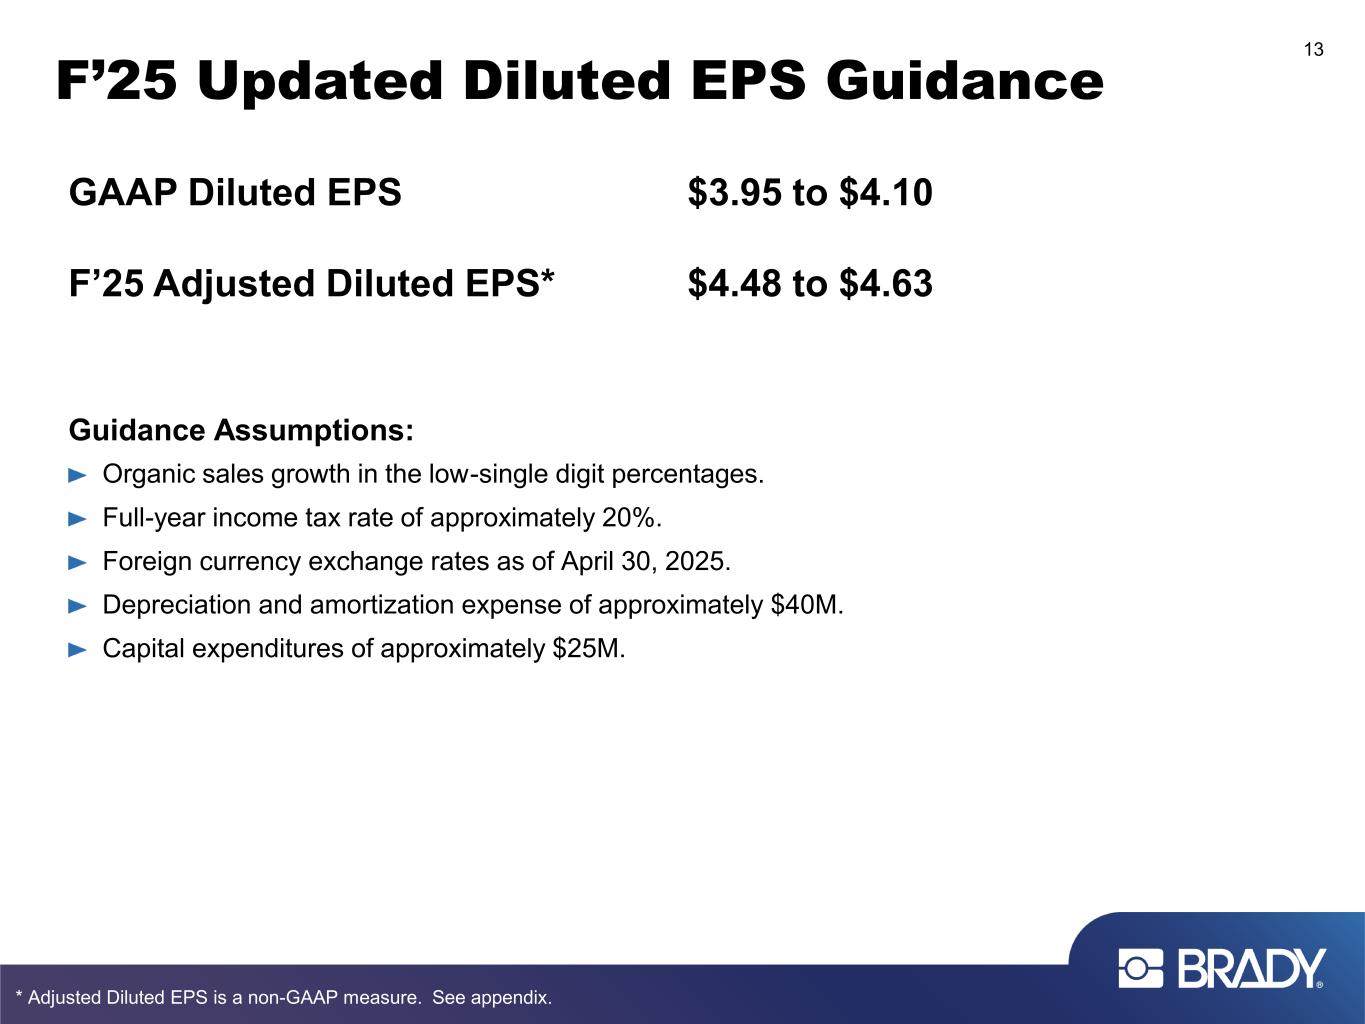

 
F’25 Updated Diluted EPS Guidance GAAP Diluted EPS $3.95 to $4.10 F’25 Adjusted Diluted EPS* $4.48 to $4.63 Guidance Assumptions: Organic sales growth in the low-single digit percentages. Full-year income tax rate of approximately 20%. Foreign currency exchange rates as of April 30, 2025. Depreciation and amortization expense of approximately $40M. Capital expenditures of approximately $25M. 13 * Adjusted Diluted EPS is a non-GAAP measure. See appendix.
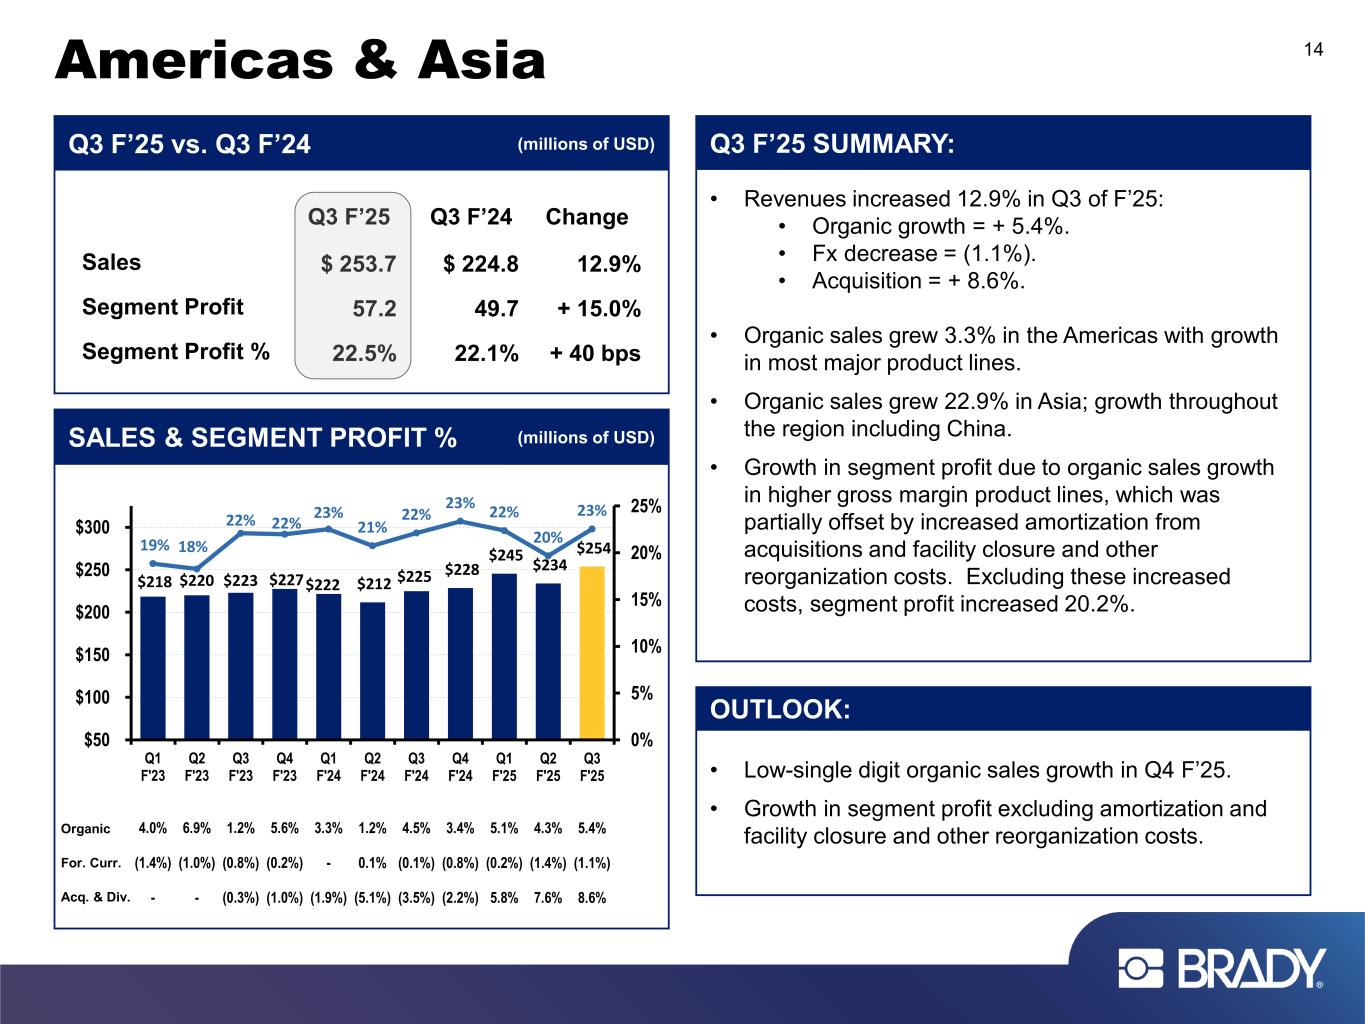

 
Americas & Asia 14 • Revenues increased 12.9% in Q3 of F’25: • Organic growth = + 5.4%. • Fx decrease = (1.1%). • Acquisition = + 8.6%. • Organic sales grew 3.3% in the Americas with growth in most major product lines. • Organic sales grew 22.9% in Asia; growth throughout the region including China. • Growth in segment profit due to organic sales growth in higher gross margin product lines, which was partially offset by increased amortization from acquisitions and facility closure and other reorganization costs. Excluding these increased costs, segment profit increased 20.2%. Q3 F’25 SUMMARY:Q3 F’25 vs. Q3 F’24 (millions of USD) $218 $220 $223 $227 $222 $212 $225 $228 $245 $234 $254 19% 18% 22% 22% 23% 21% 22% 23% 22% 20% 23% 0% 5% 10% 15% 20% 25% $50 $100 $150 $200 $250 $300 Q1 F'23 4.0% (1.4%) - Q2 F'23 6.9% (1.0%) - Q3 F'23 1.2% (0.8%) (0.3%) Q4 F'23 5.6% (0.2%) (1.0%) Q1 F'24 3.3% - (1.9%) Q2 F'24 1.2% 0.1% (5.1%) Q3 F'24 4.5% (0.1%) (3.5%) Q4 F'24 3.4% (0.8%) (2.2%) Q1 F'25 5.1% (0.2%) 5.8% Q2 F'25 4.3% (1.4%) 7.6% Q3 F'25 5.4% (1.1%) 8.6% SALES & SEGMENT PROFIT % (millions of USD) Q3 F’25 Q3 F’24 Change Sales $ 253.7 $ 224.8 12.9% Segment Profit 57.2 49.7 + 15.0% Segment Profit % 22.5% 22.1% + 40 bps • Low-single digit organic sales growth in Q4 F’25. • Growth in segment profit excluding amortization and facility closure and other reorganization costs. OUTLOOK: Organic For. Curr. Acq. & Div.
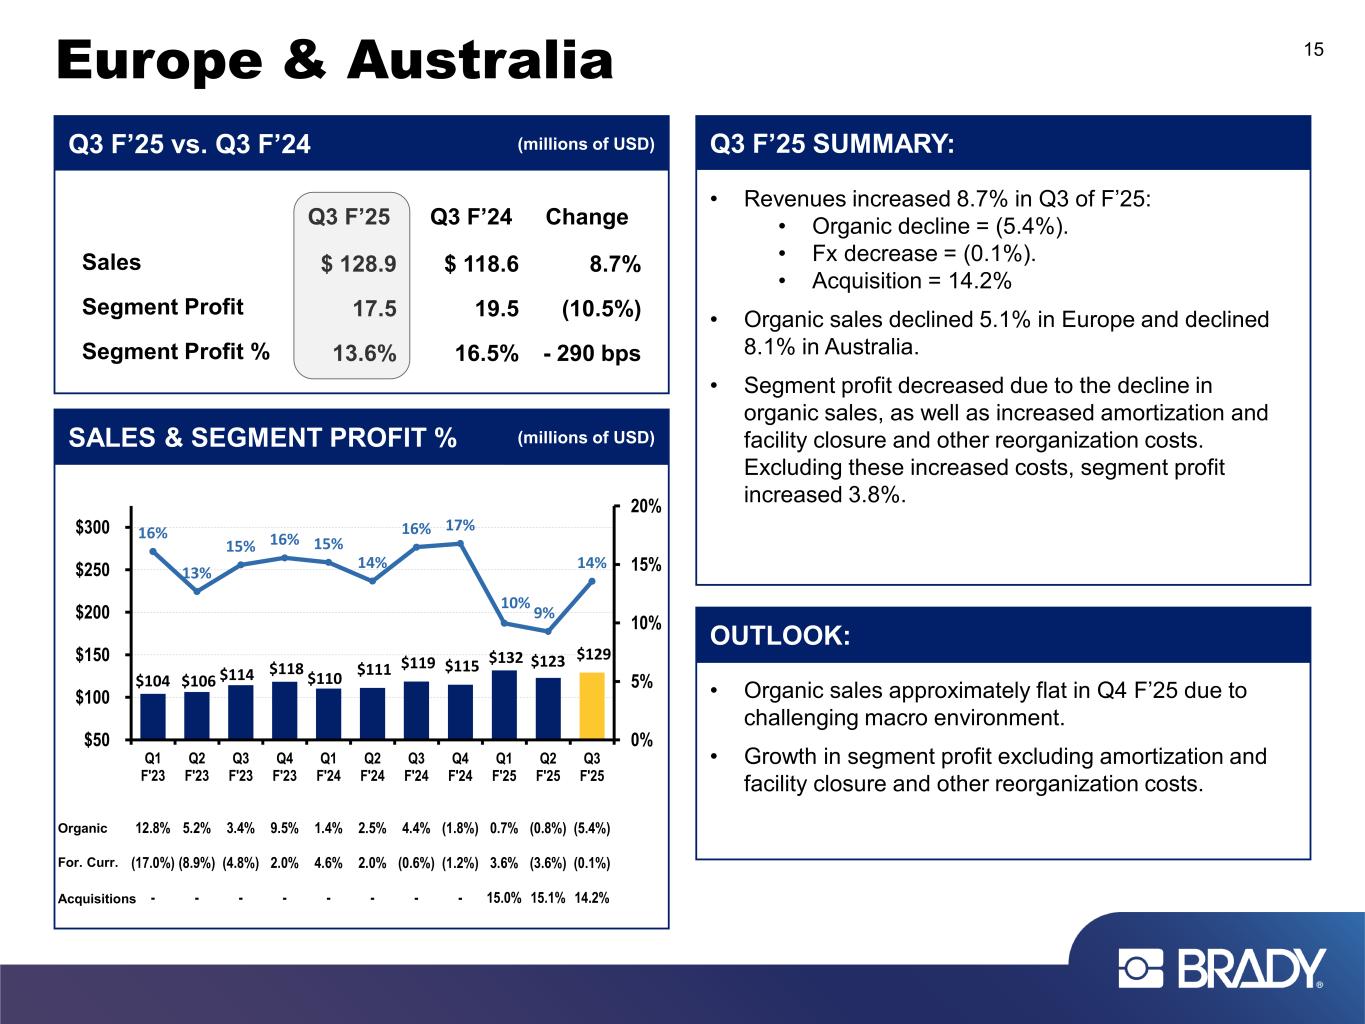

 
Europe & Australia 15 • Revenues increased 8.7% in Q3 of F’25: • Organic decline = (5.4%). • Fx decrease = (0.1%). • Acquisition = 14.2% • Organic sales declined 5.1% in Europe and declined 8.1% in Australia. • Segment profit decreased due to the decline in organic sales, as well as increased amortization and facility closure and other reorganization costs. Excluding these increased costs, segment profit increased 3.8%. Q3 F’25 SUMMARY:Q3 F’25 vs. Q3 F’24 (millions of USD) $104 $106 $114 $118 $110 $111 $119 $115 $132 $123 $129 16% 13% 15% 16% 15% 14% 16% 17% 10% 9% 14% 0% 5% 10% 15% 20% $50 $100 $150 $200 $250 $300 Q1 F'23 12.8% (17.0%) - Q2 F'23 5.2% (8.9%) - Q3 F'23 3.4% (4.8%) - Q4 F'23 9.5% 2.0% - Q1 F'24 1.4% 4.6% - Q2 F'24 2.5% 2.0% - Q3 F'24 4.4% (0.6%) - Q4 F'24 (1.8%) (1.2%) - Q1 F'25 0.7% 3.6% 15.0% Q2 F'25 (0.8%) (3.6%) 15.1% Q3 F'25 (5.4%) (0.1%) 14.2% SALES & SEGMENT PROFIT % Q3 F’25 Q3 F’24 Change Sales $ 128.9 $ 118.6 8.7% Segment Profit 17.5 19.5 (10.5%) Segment Profit % 13.6% 16.5% - 290 bps Organic For. Curr. Acquisitions • Organic sales approximately flat in Q4 F’25 due to challenging macro environment. • Growth in segment profit excluding amortization and facility closure and other reorganization costs. OUTLOOK: (millions of USD)


 
Investor Relations Brady Contact: Ann Thornton Investor Relations 414-438-6887 [email protected] See our website at www.bradycorp.com/investors 16

 
Appendix GAAP to Non-GAAP Reconciliations

 
Non-GAAP Reconciliations 18 2025 2024 2025 2024 65,745$ 64,411$ 176,592$ 179,633$ Amortization expense 4,754 2,365 14,138 7,084 Facility closure and other reorganization costs 3,930 - 9,584 - Non-recurring acquisition-related costs and other expenses - - 5,059 - 74,429$ 66,776$ 205,373$ 186,717$ 2025 2024 2025 2024 13,482$ 13,521$ 37,212$ 37,874$ Amortization expense 1,144 548 3,402 1,642 Facility closure and other reorganization costs 983 - 2,396 - Non-recurring acquisition-related costs and other expenses - - 1,265 - 15,609$ 14,069$ 44,275$ 39,516$ GAAP to NON-GAAP MEASURES (Unaudited; Dollars in Thousands, Except Per Share Amounts) In accordance with the U.S. Securities and Exchange Commission’s Regulation G, the following provides definitions of the non-GAAP measures used in the earnings release and the reconciliation to the most closely related GAAP measure. Three months ended April 30, Three months ended April 30, Adjusted Income Tax Expense (non-GAAP measure) Income before income taxes Adjusted Income Before Income Taxes (non-GAAP measure) Brady is presenting the non-GAAP measure, "Adjusted Income Tax Expense." This is not a calculation based upon GAAP. The amounts included in this non-GAAP measure are derived from amounts included in the Consolidated Financial Statements and supporting footnote disclosures. We do not view these items to be part of our ongoing results. We believe this measure provides an important perspective of underlying business trends and results and provides a more comparable measure from year to year. The table below provides a reconciliation of the GAAP measure of Income tax expense to the non-GAAP measure of Adjusted Income Tax Expense: Nine months ended April 30, Adjusted Income Before Income Taxes: Brady is presenting the non-GAAP measure, "Adjusted Income Before Income Taxes." This is not a calculation based upon GAAP. The amounts included in this non-GAAP measure are derived from amounts included in the Consolidated Financial Statements and supporting footnote disclosures. We do not view these items to be part of our ongoing results. We believe this profit measure provides an important perspective of underlying business trends and results and provides a more comparable measure from year to year. The table below provides a reconciliation of the GAAP measure of Income before income taxes to the non-GAAP measure of Adjusted Income Before Income Taxes: Adjusted Income Tax Expense: Nine months ended April 30, Income tax expense (GAAP measure)

 
Non-GAAP Reconciliations 19 2025 2024 2025 2024 52,263$ 50,890$ 139,380$ 141,759$ Amortization expense 3,610 1,817 10,736 5,442 Facility closure and other reorganization costs 2,947 - 7,188 - Non-recurring acquisition-related costs and other expenses - - 3,794 - 58,820$ 52,707$ 161,098$ 147,201$ 2025 2024 2025 2024 $ 1.09 $ 1.05 $ 2.89 $ 2.91 Amortization expense 0.08 0.04 0.22 0.11 Facility closure and other reorganization costs 0.06 - 0.15 - Non-recurring acquisition-related costs and other expenses - - 0.08 - 1.22$ 1.09$ 3.34$ 3.03$ Diluted EPS Excluding Certain Items Guidance: Low High Earnings per diluted Class A Common Share (GAAP measure) $ 3.95 $ 4.10 Amortization expense 0.30 0.30 Facility closure and other reorganization costs 0.15 0.15 Non-recurring acquisition-related costs and other expenses 0.08 0.08 Adjusted Diluted EPS (non-GAAP measure) 4.48$ 4.63$ Adjusted Net Income: Fiscal 2025 Expectations Three months ended April 30, Brady is presenting the non-GAAP measure, "Adjusted Diluted EPS." This is not a calculation based upon GAAP. The amounts included in this non-GAAP measure are derived from amounts included in the Consolidated Financial Statements. We do not view these items to be part of our ongoing results. We believe this measure provides an important perspective of underlying business trends and results and provides a more comparable measure from year to year. The table below provides a reconciliation of the GAAP measure of Net income per Class A Nonvoting Common Share to the non-GAAP measure of Adjusted Diluted EPS (Note that certain amounts will not foot due to rounding): Nine months ended April 30, Net income per Class A Nonvoting Common Share (GAAP measure) Adjusted Diluted EPS: GAAP to NON-GAAP MEASURES (Unaudited; Dollars in Thousands, Except Per Share Amounts) In accordance with the U.S. Securities and Exchange Commission’s Regulation G, the following provides definitions of the non-GAAP measures used in the earnings release and the reconciliation to the most closely related GAAP measure. Adjusted Diluted EPS (non-GAAP measure) Three months ended April 30, Brady is presenting the non-GAAP measure, "Adjusted Net Income." This is not a calculation based upon GAAP. The amounts included in this non-GAAP measure are derived from amounts included in the Consolidated Financial Statements and supporting footnote disclosures. We do not view these items to be part of our ongoing results. We believe this measure provides an important perspective of underlying business trends and results and provides a more comparable measure from year to year. The table below provides a reconciliation of the GAAP measure of Net income to the non-GAAP measure of Adjusted Net Income: Nine months ended April 30, Net income (GAAP measure) Adjusted Net Income (non-GAAP measure)