UNITED STATES
SECURITIES AND EXCHANGE COMMISSION
Washington, D.C. 20549


FORM 8-K


CURRENT REPORT
 
Pursuant to Section 13 or 15(d) of the
Securities Exchange Act of 1934
 
Date of Report (Date of earliest event reported)
 
July 27, 2020


Bank7 Corp.
(Exact name of registrant as specified in its charter)


Oklahoma
001-38656
20-0764349
(State or other jurisdiction of incorporation)
(Commission File Number)
(IRS Employer Identification No.)

1039 N.W. 63rd Street, Oklahoma City, Oklahoma 73116
(Address of principal executive offices) (Zip Code)

(405) 810-8600
 (Registrant’s telephone number, including area code)
 
Not Applicable
(Former name or former address, if changed since last report)


Check the appropriate box below if the Form 8-K filing is intended to simultaneously satisfy the filing obligation of the registrant under any of the following provisions:

☐
Written communications pursuant to Rule 425 under the Securities Act (17 CFR 230.425)

☐
Soliciting material pursuant to Rule 14a-12 under the Exchange Act (17 CFR 240.14a-12)

☐
Pre-commencement communications pursuant to Rule 14d-2(b) under the Exchange Act (17 CFR 240.14d-2(b))

☐
Pre-commencement communications pursuant to Rule 13e-4(c) under the Exchange Act (17 CFR 240.13e-4(c))

 Securities registered pursuant to Section 12(b) of the Act:

Title of each class
Trading
Symbol(s)
Name of each exchange on which
registered
Common Stock, $0.01 par value
BSVN
The NASDAQ Global Select Market

Indicate by check mark whether the registrant is an emerging growth company as defined in Rule 405 of the Securities Act of 1933 (17 CFR §230.405) or Rule 12b-2 of the Securities Exchange Act of 1934 (17 CFR §240.12b-2).

Emerging growth company  ☑

If an emerging growth company, indicate by check mark if the registrant has elected not to use the extended transition period for complying with any new or revised financial accounting standards provided pursuant to Section 13(a) of the Exchange Act. ☐


Item 2.02.
Results of Operations and Financial Condition

Item 7.01
Regulation FD Disclosure

On July 27, 2020, Bank7 Corp. (the “Company”), the holding company for Bank7, issued a press release announcing its results of operation and financial condition for the three and six month periods ended June 30, 2020.  A copy of the press release is attached to this Current Report on Form 8-K as Exhibit 99.1 and is incorporated herein by reference.

The Company is conducting a conference call on July 27, 2020 at 4:00 pm ET to discuss its second quarter 2020 financial results.   A copy of the presentation slides to be used during the earnings call is attached to this Current Report on Form 8-K as Exhibit 99.2 and is incorporated herein by reference.

In accordance with General Instruction B.2 of Form 8-K, the information in this Current Report on Form 8-K, including Exhibit 99.1 and Exhibit 99.2, shall not be deemed “filed” for the purposes of Section 18 of the Securities Exchange Act of 1934, as amended (the “Exchange Act”), and shall not be incorporated by reference into any filing or other document pursuant to the Securities Act of 1933, as amended, or the Exchange Act except as shall be expressly set forth by specific reference in such filing.

Item 9.01
Financial Statements and Exhibits


(d)
Exhibits.

The following exhibits are filed herewith:

Item
 
 Description
     
 
Press Release dated July 27, 2020
 
Second Quarter 2020 Investor Presentation


SIGNATURES
 
Pursuant to the requirements of the Securities Exchange Act of 1934, the registrant has duly caused this report to be signed on its behalf by the undersigned hereunto duly authorized.

 
BANK7 CORP.
     
Date: July 27, 2020
By:
/s/ Kelly J. Harris
   
Kelly J. Harris
   
Senior Vice President and Chief Financial Officer


Exhibit 99.1


FOR IMMEDIATE RELEASE: Bank7 Corp. Announces 2Q 2020 Earnings

Oklahoma City, OK, July 27, 2020 – Bank7 Corp. (NASDAQ: BSVN) ("the Company"), the parent company of Oklahoma City-based Bank7 (the "Bank"), today reported unaudited results for the fiscal quarter ended June 30, 2020.  “We are happy to report strong second quarter earnings reflected by (i) record pre-tax, pre-provision earnings and (ii) net income substantially in line with previous quarters. Clearly, the future is uncertain and we are adding loan loss reserves to make sure we are prepared for possible exposures; nonetheless, we continue to have confidence in our overall loan portfolio. In addition, our team continues to perform at a high level and because of that we expect to be able to navigate through these difficult times,” said Thomas L. Travis, President and CEO of the Company.

Three months ended June 30, 2020 compared to three months ended June 30, 2019:


-
Pre-tax, pre-provision earnings of $8.1 million, an increase of 18.70%

-
Interest income on loans, including loan fee income, totaled $13.4 million, an increase of 10.61%

-
Total assets of $1.0 billion, an increase of 25.75%

-
Total loans of $837.9 million, an increase of 32.70%

-
Total deposits of $894.2 million, an increase of 28.47%

Six months ended June 30, 2020 compared to six months ended June 30, 2019:


-
Pre-tax, pre-provision earnings of $15.5 million, an increase of 13.66%

-
Interest income on loans, including loan fee income, totaled $26.5 million, an increase of 11.67%

-
Efficiency ratio of 35.3%, compared to 36.3%

Additional Highlights

For the six months ended June 30, 2020 compared to six months ended June 30, 2019:


-
Cost of funds was 0.91%, a decrease of 35.48%

-
Average loans of $786.9 million, an increase of 31.11%

-
Core deposits of $802.8 million, an increase of 30.4%

Both the Bank’s and the Company’s capital levels continue to be significantly above the minimum levels required to be designated as “well-capitalized” for regulatory purposes.  At June 30, 2020 the Tier 1 leverage ratio, Tier 1 risk based capital ratio, and total risk-based capital ratios were 10.30%, 13.09%, and 14.34% respectively for the Bank.  At June 30, 2020 the Tier 1 leverage ratio, Tier 1 risk based capital ratio, and total risk-based capital ratios were 10.29%, 13.08%, and 14.33% respectively for the Company on a consolidated basis.  Designation as a well-capitalized institution under regulations does not constitute a recommendation or endorsement by bank regulators.
 
Pre-tax, pre-provision earnings is defined as income before taxes and provision for loan losses.  We believe the most directly comparable GAAP financial measure is income before taxes.  Disclosure of this measure enables you to compare our operations to those of other banking companies before consideration of taxes and provision expense.  We calculate our tax-adjusted net income, return on average assets, and return on average equity, and per share amounts by using a combined effective tax rate for federal and state income taxes of 24.9% and 25.0% in the second quarter of 2020 and 2019, respectively.  We acknowledge that our non-GAAP financial measures have a number of limitations.  As such, you should not view these disclosures as a substitute for results determined in accordance with GAAP, and they are not necessarily comparable to non-GAAP financial measures that other banking companies use.  Other banking companies may use names similar to those we use for non-GAAP financial measures we disclose, but may calculate them differently.  You should understand how we and other companies each calculate their non-GAAP financial measures when making comparisons.  The following reconciliation table provides a more detailed analysis of these non-GAAP financial measures:


Three months ended
June 30,
   
Six months ended
June 30,
 
(Dollars in thousands, except per share data)
 
2020
   
2019
   
2020
   
2019
 
Loan interest income (excluding loan fees)
                       
Total loan interest income, including loan fee income
 
$
13,385
   
$
12,101
   
$
26,491
   
$
23,723
 
Loan fee income
   
(1,632
)
   
(1,369
)
   
(2,892
)
   
(2,658
)
Loan interest income excluding loan fee income
 
$
11,753
   
$
10,732
   
$
23,599
   
$
21,065
 
                                 
Average total loans
 
$
826,111
   
$
613,892
   
$
786,943
   
$
600,224
 
Yield on loans (including loan fee income)
   
6.52
%
   
7.91
%
   
6.77
%
   
7.97
%
Yield on loans (excluding loan fee income)
   
5.72
%
   
7.01
%
   
6.03
%
   
7.08
%
                                 
Net interest margin (excluding loan fees)
                               
Net interest income
 
$
11,929
   
$
10,583
   
$
23,361
   
$
20,936
 
Loan fee income
   
(1,632
)
   
(1,369
)
   
(2,892
)
   
(2,658
)
Net interest income excluding loan fees
 
$
10,297
   
$
9,214
   
$
20,469
   
$
18,278
 
                                 
Average earning assets
 
$
962,186
   
$
777,190
   
$
914,118
   
$
761,607
 
Net interest margin (including loan fee income)
   
4.99
%
   
5.46
%
   
5.14
%
   
5.54
%
Net interest margin (excluding loan fee income)
   
4.30
%
   
4.76
%
   
4.50
%
   
4.84
%
                                 
Pre-tax, pre-provision net earnings
                               
Net income before income taxes
 
$
6,707
   
$
6,830
   
$
13,466
   
$
13,651
 
Plus: Provision (reversal of) for loan losses
   
(1,400
)
   
-
     
(2,050
)
   
-
 
Pre-tax, pre-provision net earnings
 
$
8,107
   
$
6,830
   
$
15,516
   
$
13,651
 
                                 
Adjusted provision for income tax
                               
Net income before income taxes
 
$
6,707
   
$
6,830
   
$
13,466
   
$
13,651
 
Total effective adjusted tax rate
   
24.9
%
   
25.0
%
   
25.1
%
   
25.0
%
Adjusted provision for income taxes
 
$
1,671
   
$
1,704
   
$
3,379
   
$
3,409
 
                                 
Tax-adjusted net income
                               
Net income before income taxes
 
$
6,707
   
$
6,830
   
$
13,466
   
$
13,651
 
Adjusted provision for income taxes
   
1,671
     
1,704
     
3,379
     
3,409
 
Tax-adjusted net income
 
$
5,036
   
$
5,126
   
$
10,087
   
$
10,242
 
                                 
Tax-adjusted ratios and per share data
                               
Tax-adjusted net income (numerator)
 
$
5,036
   
$
5,126
   
$
10,087
   
$
10,242
 
                                 
Average assets (denominator)
 
$
971,373
   
$
786,773
   
$
923,087
   
$
770,621
 
Tax-adjusted return on average assets
   
2.09
%
   
2.61
%
   
2.20
%
   
2.68
%
                                 
Average shareholders' equity (denominator)
 
$
99,469
   
$
96,044
   
$
100,593
   
$
93,443
 
Tax-adjusted return on average shareholders' equity
   
20.36
%
   
21.41
%
   
20.17
%
   
22.10
%
                                 
Average tangible common equity (denominator)
 
$
97,760
   
$
94,128
   
$
98,858
   
$
91,498
 
Tax-adjusted return on average tangible common equity
   
20.72
%
   
21.84
%
   
20.52
%
   
22.57
%
                                 
Weighted average common shares outstanding basic (denominator)
   
9,232,509
     
10,187,500
     
9,598,232
     
10,187,500
 
Tax-adjusted net income per common share--basic
 
$
0.54
   
$
0.50
   
$
1.05
   
$
1.00
 
                                 
Weighted average common shares outstanding diluted (denominator)
   
9,232,509
     
10,192,649
     
9,598,232
     
10,187,500
 
Tax-adjusted net income per common share--diluted
 
$
0.54
   
$
0.50
   
$
1.05
   
$
1.00
 
Tangible assets
                               
Total assets
 
$
1,004,085
   
$
798,448
                 
Less: Goodwill and intangibles
   
(1,686
)
   
(1,892
)
               
Tangible assets
 
$
1,002,399
   
$
796,556
                 
                                 
Tangible shareholders' equity
                               
Total shareholders' equity
 
$
101,618
   
$
99,037
                 
Less: Goodwill and intangibles
   
(1,686
)
   
(1,892
)
               
Tangible shareholders' equity
 
$
99,932
   
$
97,145
                 
                                 
Tangible shareholders' equity
                               
Tangible shareholders' equity (numerator)
 
$
99,932
   
$
97,145
                 
Tangible assets (denominator)
 
$
1,002,399
   
$
796,556
                 
Tangible common equity to tangible assets
   
9.97
%
   
12.20
%
               
                                 
End of period common shares outstanding
   
9,226,252
     
10,187,500
                 
Book value per share
 
$
11.01
   
$
9.72
                 
Tangible book value per share
 
$
10.83
   
$
9.54
                 
Total shareholders' equity to total assets
   
10.12
%
   
12.40
%


Net Interest Margin Excluding Loan Fee Income
   
         
For the Three Months Ended June 30,
   
   
2020
   
2019
 
   
Average
Balance
   
Interest
Income/
Expense
   
Average
Yield/
Rate

 
Average
Balance
 
Interest
Income/
Expense
 
Average
Yield/
Rate
 
   
(Dollars in thousands)
 
Interest-earning assets:
                                 
Short-term investments(1)
 
$
134,764
   
$
156
     
0.47
%
 
$
162,056
   
$
941
     
2.33
%
Investment securities(2)
   
1,089
     
15
     
5.54
     
1,063
     
24
     
9.06
 
Loans held for sale
   
222
     
—
     
0.00
     
179
     
—
     
0.00
 
Total loans(3)
   
826,111
     
11,753
     
5.72
     
613,892
     
10,732
     
7.01
 
Total interest-earning assets
   
962,186
     
11,924
     
4.98
     
777,190
     
11,697
     
6.04
 
Noninterest-earning assets
   
9,187
                     
9,583
                 
Total assets
 
$
971,373
                      
$
786,773
                 
                                                 
Funding sources:
                                               
Interest-bearing liabilities:
                                               
Deposits:
                                               
Transaction accounts
 
$
373,812
     
704
     
0.76
%
 
$
294,926
     
1,388
     
1.89
%
Time deposits
   
219,990
     
923
     
1.69
     
205,978
     
1,095
     
2.13
 
Total interest-bearing deposits
   
593,802
     
1,627
     
1.10
     
500,904
     
2,483
     
1.99
 
Other borrowings
   
—
     
—
     
0.00
     
—
     
—
     
0.00
 
Total interest-bearing liabilities
   
593,802
     
1,627
     
1.10
     
500,904
     
2,483
     
1.99
 
                                                 
Noninterest-bearing liabilities:
                                               
Noninterest-bearing deposits
   
272,373
                     
185,715
                 
Other noninterest-bearing liabilities
   
5,729
                     
4,110
                 
Total noninterest-bearing liabilities
   
278,102
                     
189,825
                 
Shareholders’ equity
   
99,469
                     
96,044
                 
Total liabilities and shareholders’ equity
 
$
971,373
                      
$
786,773
                 
                                                 
Net interest income including loan fee income
         
$
10,297
                 
$
9,214
         
Net interest spread including loan fee income(4)
                   
3.88
%
                   
4.05
%
Net interest margin including loan fee income
                   
4.30
%
                   
4.76
%


Net Interest Margin With Loan Fee Income
         
           
For the Three Months Ended June 30,
         
    2020    
2019
 
   
Average
Balance
   
Interest
Income/
Expense
   
Average
Yield/
Rate
   
Average
Balance
   
Interest
Income/
Expense
     
Average
Yield/
Rate
 
   
(Dollars in thousands)
 
Interest-earning assets:
                                               
Short-term investments(1)
 
$
134,764
   
$
156
     
0.47
%
 
$
162,056
   
$
941
     
2.33
%
Investment securities(2)
   
1,089
     
15
     
5.54
     
1,063
     
24
     
9.06
 
Loans held for sale
   
222
     
—
     
0.00
     
179
     
—
     
0.00
 
Total loans(3)
   
826,111
     
13,385
     
6.52
     
613,892
     
12,101
     
7.91
 
Total interest-earning assets
   
962,186
     
13,556
     
5.67
     
777,190
     
13,066
     
6.74
 
Noninterest-earning assets
   
9,187
                     
9,583
                 
Total assets
 
$
971,373
                   
$
786,773
                 
                                                 
Funding sources:
                                               
Interest-bearing liabilities:
                                               
Deposits:
                                               
Transaction accounts
 
$
373,812
     
704
     
0.76
%
 
$
294,926
     
1,388
     
1.89
%
Time deposits
   
219,990
     
923
     
1.69
     
205,978
     
1,095
     
2.13
 
Total interest-bearing deposits
   
593,802
     
1,627
     
1.10
     
500,904
     
2,483
     
1.99
 
Other borrowings
   
—
     
—
     
0.00
     
—
     
—
     
0.00
 
Total interest-bearing liabilities
   
593,802
     
1,627
     
1.10
     
500,904
     
2,483
     
1.99
 
                                                 
Noninterest-bearing liabilities:
                                               
Noninterest-bearing deposits
   
272,373
                     
185,715
                 
Other noninterest-bearing liabilities
   
5,729
                     
4,110
                 
Total noninterest-bearing liabilities
   
278,102
                     
189,825
                 
Shareholders’ equity
   
99,469
                     
96,044
                 
Total liabilities and shareholders’ equity
 
$
971,373
                   
$
786,773
                 
                                                 
Net interest income excluding loan fee income
         
$
11,929
                   
$
10,583
         
Net interest spread excluding loan fee income(4)
                   
4.56
%
                   
4.76
%
Net interest margin excluding loan fee income
                   
4.99
%
                   
5.46
%

(1)
Includes income and average balances for fed funds sold, interest-earning deposits in banks and other miscellaneous interest-earning assets.

(2)
Includes income and average balances for FHLB and FRB stock.

(3)
Non-accrual loans are included in loans.

(4)
Net interest spread is the average yield on interest-earning assets minus the average rate on interest-bearing liabilities.


          Net Interest Margin Excluding Loan Fee Income        
          For the Six Months Ended June 30,        
   
2020
    2019  
   
Average
Balance
   
Interest
Income/
Expense
   
Average
Yield/
Rate
   
Average
Balance
   
Interest
Income/
Expense
   
Average
Yield/
Rate
 
   
(Dollars in thousands)
 
Interest-earning assets:
                                   
Short-term investments(1)
 
$
125,906
   
$
554
     
0.88
%
 
$
160,129
   
$
1,896
     
2.39
%
Investment securities(2)
   
1,095
     
18
     
3.31
     
1,059
     
24
     
4.57
 
Loans held for sale
   
174
     
—
     
0.00
     
195
     
—
     
0.00
 
Total loans(3)
   
786,943
     
23,599
     
6.03
     
600,224
     
21,065
     
7.08
 
Total interest-earning assets
   
914,118
     
24,171
     
5.32
     
761,607
     
22,985
     
6.09
 
Noninterest-earning assets
   
8,969
                     
9,014
                 
Total assets
 
$
923,087
                   
$
770,621
                 
                                                 
Funding sources:
                                               
Interest-bearing liabilities:
                                               
Deposits:
                                               
Transaction accounts
 
$
358,167
     
1,714
     
0.96
%
 
$
290,204
     
2,687
     
1.87
%
Time deposits
   
212,537
     
1,988
     
1.88
     
199,276
     
2,020
     
2.04
 
Total interest-bearing deposits
   
570,704
     
3,702
     
1.30
     
489,480
     
4,707
     
1.94
 
Other borrowings
   
—
     
—
     
0.00
     
—
     
—
     
0.00
 
Total interest-bearing liabilities
   
570,704
     
3,702
     
1.30
     
489,480
     
4,707
     
1.94
 
                                                 
Noninterest-bearing liabilities:
                                               
Noninterest-bearing deposits
   
246,630
                     
182,760
                 
Other noninterest-bearing liabilities
   
5,160
                     
4,938
                 
Total noninterest-bearing liabilities
   
251,790
                     
187,698
                 
Shareholders’ equity
   
100,593
                     
93,443
                 
Total liabilities and shareholders’ equity
 
$
923,087
                   
$
770,621
                 
                                                 
Net interest income including loan fee income
         
$
20,469
                   
$
18,278
         
Net interest spread including loan fee income(4)
                   
4.01
%
                   
4.15
%
Net interest margin including loan fee income
                   
4.50
%
                   
4.84
%


Net Interest Margin With Loan Fee Income
       
         
For the Six Months Ended June 30,
       
   
2020
   
2019
 
   
Average
Balance
   
Interest
Income/
Expense
   
Average
Yield/
Rate
   
Average
Balance
   
Interest
Income/
Expense
   
Average
Yield/
Rate
 
   
(Dollars in thousands)
 
Interest-earning assets:
                                   
Short-term investments(1)
 
$
125,906
   
$
554
     
0.88
%
 
$
160,129
   
$
1,896
     
2.39
%
Investment securities(2)
   
1,095
     
18
     
3.31
     
1,059
     
24
     
4.57
 
Loans held for sale
   
174
     
—
     
0.00
     
195
     
—
     
0.00
 
Total loans(3)
   
786,943
     
26,491
     
6.77
     
600,224
     
23,723
     
7.97
 
Total interest-earning assets
   
914,118
     
27,063
     
5.95
     
761,607
     
25,643
     
6.79
 
Noninterest-earning assets
   
8,969
                     
9,014
                 
Total assets
 
$
923,087
                   
$
770,621


Funding sources:
                                               
Interest-bearing liabilities:
                                               
Deposits:
                                               
Transaction accounts
 
$
358,167
     
1,714
     
0.96
%
 
$
290,204
     
2,687
     
1.87
%
Time deposits
   
212,537
     
1,988
     
1.88
     
199,276
     
2,020
     
2.04
 
Total interest-bearing deposits
   
570,704
     
3,702
     
1.30
     
489,480
     
4,707
     
1.94
 
Other borrowings
   
—
     
—
     
0.00
     
—
     
—
     
0.00
 
Total interest-bearing liabilities
   
570,704
     
3,702
     
1.30
     
489,480
     
4,707
     
1.94


Noninterest-bearing liabilities:
                                               
Noninterest-bearing deposits
   
246,630
                     
182,760
                 
Other noninterest-bearing liabilities
   
5,160
                     
4,938
                 
Total noninterest-bearing liabilities
   
251,790
                     
187,698
                 
Shareholders’ equity
   
100,593
                     
93,443
                 
Total liabilities and shareholders’ equity
 
$
923,087
                   
$
770,621


Net interest income excluding loan fee income
         
$
23,361
                   
$
20,936
         
Net interest spread excluding loan fee income(4)
                   
4.65
%
                   
4.85
%
Net interest margin excluding loan fee income
                   
5.14
%
                   
5.54
%


Bank7 Corp.
Consolidated Balance Sheets

Dollars in thousands, exceper per share data
 
Unaudited as of
       
Assets
 
June 30,
   
December 31,
 
   
2020
   
2019
   
2019
 
                   
Cash and due from banks
 
$
127,780
   
$
123,763
   
$
117,128
 
Interest-bearing time deposits in other banks
   
27,865
     
32,632
     
30,147
 
Loans, net
   
828,065
     
623,614
     
699,458
 
Loans held for sale
   
500
     
8
     
1,031
 
Premises and equipment, net
   
9,519
     
8,757
     
9,624
 
Nonmarketable equity securities
   
1,095
     
1,069
     
1,100
 
Foreclosed assets held for sale
   
-
     
188
     
0
 
Goodwill and intangibles
   
1,686
     
1,892
     
1,789
 
Interest receivable and other assets
   
7,575
     
6,525
     
6,115
 
                         
Total assets
 
$
1,004,085
   
$
798,448
   
$
866,392
 
                         
Liabilities and Shareholders’ Equity
                       
                         
Deposits
                       
Noninterest-bearing
 
$
254,735
   
$
190,092
   
$
219,221
 
Interest-bearing
   
639,496
     
505,963
     
538,262
 
                         
Total deposits
   
894,231
     
696,055
     
757,483
 
                         
Income taxes payable
   
4,022
     
20
     
357
 
Interest payable and other liabilities
   
4,214
     
3,336
     
8,426
 
                         
Total liabilities
   
902,467
     
699,411
     
766,266
 
                         
Common stock
   
92
     
102
     
101
 
Additional paid-in capital
   
92,761
     
80,604
     
92,391
 
Retained earnings
   
8,765
     
18,331
     
7,634
 
                         
Total shareholders’ equity
   
101,618
     
99,037
     
100,126


Total liabilities and shareholders’ equity
 
$
1,004,085
   
$
798,448
   
$
866,392


Bank7 Corp.
Consolidated Statements of Income

   
Unaudited as of
 
   
Three Months Ended
   
Six Months Ended
 
   
June 30,
   
June 30,
 
Dollars in thousands, exceper per share data
 
2020
   
2019
   
2020
   
2019
 
Interest Income
                       
Loans, including fees
 
$
13,385
   
$
12,101
   
$
26,491
   
$
23,723
 
Interest-bearing time deposits in other banks
   
133
     
497
     
295
     
914
 
Interest-bearing deposits in other banks
   
38
     
468
     
277
     
1,006
 
                                 
Total interest income
   
13,556
     
13,066
     
27,063
     
25,643
 
                                 
Interest Expense
                               
Deposits
   
1,627
     
2,483
     
3,702
     
4,707
 
                                 
Total interest expense
   
1,627
     
2,483
     
3,702
     
4,707
 
                                 
Net Interest Income
   
11,929
     
10,583
     
23,361
     
20,936
 
                                 
Provision for Loan Losses
   
1,400
     
-
     
2,050
     
-
 
                                 
Net Interest Income After Provision for Loan Losses
   
10,529
     
10,583
     
21,311
     
20,936
 
                                 
Noninterest Income
                               
Secondary market income
   
39
     
40
     
77
     
77
 
Service charges on deposit accounts
   
95
     
109
     
214
     
169
 
Other
   
167
     
146
     
340
     
272
 
                                 
Total noninterest income
   
301
     
295
     
631
     
518
 
                                 
Noninterest Expense
                               
Salaries and employee benefits
   
2,597
     
2,365
     
5,071
     
4,536
 
Furniture and equipment
   
218
     
218
     
434
     
377
 
Occupancy
   
413
     
378
     
874
     
721
 
Data and item processing
   
269
     
276
     
545
     
538
 
Accounting, marketing and legal fees
   
77
     
142
     
203
     
289
 
Regulatory assessments
   
94
     
31
     
117
     
63
 
Advertising and public relations
   
29
     
92
     
298
     
278
 
Travel, lodging and entertainment
   
43
     
92
     
96
     
134
 
Other
   
383
     
454
     
838
     
867
 
                                 
Total noninterest expense
   
4,123
     
4,048
     
8,476
     
7,803
 
                                 
Income Before Taxes
   
6,707
     
6,830
     
13,466
     
13,651
 
Income tax expense
   
1,671
     
1,704
     
3,379
     
3,409
 
Net Income
 
$
5,036
   
$
5,126
   
$
10,087
   
$
10,242
 
                                 
Earnings per common share - basic
 
$
0.54
   
$
0.50
   
$
1.05
   
$
1.00
 
Diluted earnings per common share
   
0.54
     
0.50
     
1.05
     
1.00
 
Weighted average common shares outstanding - basic
   
9,232,509
     
10,187,500
     
9,598,232
     
10,187,500
 
Weighted average common shares outstanding - diluted
   
9,232,509
     
10,192,649
     
9,598,232
     
10,187,500


About Bank7 Corp.

We are Bank7 Corp., a bank holding company headquartered in Oklahoma City, Oklahoma. Through our wholly-owned subsidiary, Bank7, we operate nine locations in Oklahoma, the Dallas/Fort Worth, Texas metropolitan area and Kansas. We are focused on serving business owners and entrepreneurs by delivering fast, consistent and well-designed loan and deposit products to meet their financing needs. We intend to grow organically by selectively opening additional branches in our target markets as well as pursue strategic acquisitions.

Conference call

Bank7 Corp. has scheduled a conference call to discuss its first quarter results, which will be broadcast live over the Internet, on Monday, July 27, 2020 at 4:00 p.m. Eastern Time. To participate in the call, dial 1-888-348-6421, or access it live over the Internet at https://www.webcaster4.com/Webcast/Page/2179/35698.   For those not able to participate in the live call, an archive of the webcast will be available at https://www.webcaster4.com/Webcast/Page/2179/35698 shortly after the call for 1 year.

Cautionary Statements Regarding Forward-Looking Information

This communication contains a number of forward-looking statements. These forward-looking statements reflect Bank7 Corp.’s current views with respect to, among other things, future events and Bank7 Corp.’s financial performance. Any statements about Bank7 Corp.’s expectations, beliefs, plans, predictions, forecasts, objectives, assumptions or future events or performance are not historical facts and may be forward-looking. These statements are often, but not always, made through the use of words or phrases such as “anticipate,” “believes,” “can,” “could,” “may,” “predicts,” “potential,” “should,” “will,” “estimate,” “plans,” “projects,” “continuing,” “ongoing,”
“expects,” “intends” and similar words or phrases. Any or all of the forward-looking statements in (or conveyed orally regarding) this presentation may turn out to be inaccurate. The inclusion of or reference to forward-looking information in this presentation should not be regarded as a representation by Bank7 Corp. or any other person that the future plans, estimates or expectations contemplated by Bank7 Corp. will be achieved.

These forward-looking statements are subject to significant uncertainties because they are based upon:  the amount and timing of future changes in interest rates, market behavior, and other economic conditions; future laws, regulations, and accounting principles; changes in regulatory standards and examination policies, and a variety of other matters.  These other matters include, among other things, the impact of COVID-19 on the United States economy and our operations, the direct and indirect effect of economic conditions on interest rates, credit quality, loan demand, liquidity, and monetary and supervisory policies of banking regulators.  Bank7 Corp. has based these forward-looking statements largely on its current expectations and projections about future events and financial trends that Bank7 Corp. believes may affect its financial condition, results of operations, business strategy and financial needs. Bank7 Corp.’s actual results could differ materially from those anticipated in such forward-looking statements as a result of risks, uncertainties and assumptions that are difficult to predict. If one or more events related to these or other risks or uncertainties materialize, or if Bank7 Corp.’s underlying assumptions prove to be incorrect, actual results may differ materially from what Bank7 Corp. anticipates. You are cautioned not to place undue reliance on forward-looking statements. Further, any forward-looking statement speaks only as of the date on which it is made and Bank7 Corp. undertakes no obligation to update or revise any forward-looking statement to reflect events or circumstances after the date on which the statement is made or to reflect the occurrence of unanticipated events, except as may be required by law. All forward-looking statements herein are qualified by these cautionary statements.

About Non-GAAP Financial Measures

This communication includes certain non-GAAP financial measures, including tax-adjusted net income, tax-adjusted earnings per share, tax-adjusted return on average assets and tax-adjusted return on average shareholders’ equity. These non-GAAP financial measures and any other non-GAAP financial measures that we discuss in this presentation should not be considered in isolation, and should be considered as additions to, and not substitutes for or superior to, measures of financial performance prepared in accordance with GAAP. There are a number of limitations related to the use of these non-GAAP financial measures versus their nearest GAAP equivalents. For example, other companies may calculate non-GAAP financial measures differently or may use other measures to evaluate their performance, all of which could reduce the usefulness of Bank7 Corp.’s non-GAAP financial measures as tools for comparison. See the table above in this communication for a reconciliation of the non-GAAP financial measures used in (or conveyed orally during) this communication to their most directly comparable GAAP financial measures.

Contact:
 
Thomas Travis
President & CEO
(405) 810-8600


Exhibit 99.2

 BSVN  2Q 2020EARNINGS RELEASEJuly 27, 2020 
 

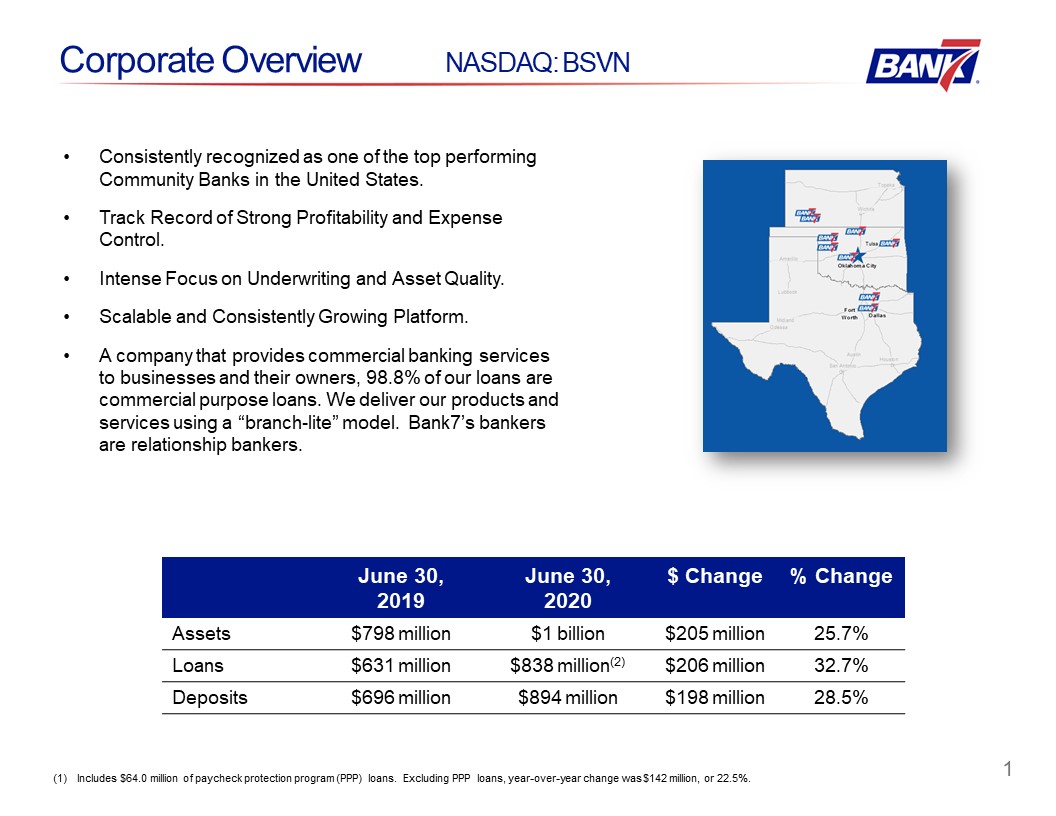
 1  Corporate Overview NASDAQ: BSVN    June 30, 2019  June 30, 2020  $ Change  % Change  Assets  $798 million  $1 billion  $205 million  25.7%  Loans  $631 million  $838 million(2)  $206 million  32.7%  Deposits  $696 million  $894 million  $198 million  28.5%  Consistently recognized as one of the top performing Community Banks in the United States.Track Record of Strong Profitability and Expense Control.Intense Focus on Underwriting and Asset Quality.Scalable and Consistently Growing Platform.A company that provides commercial banking services to businesses and their owners, 98.8% of our loans are commercial purpose loans. We deliver our products and services using a “branch-lite” model.  Bank7’s bankers are relationship bankers.   Includes $64.0 million of paycheck protection program (PPP) loans. Excluding PPP loans, year-over-year change was $142 million, or 22.5%. 
 

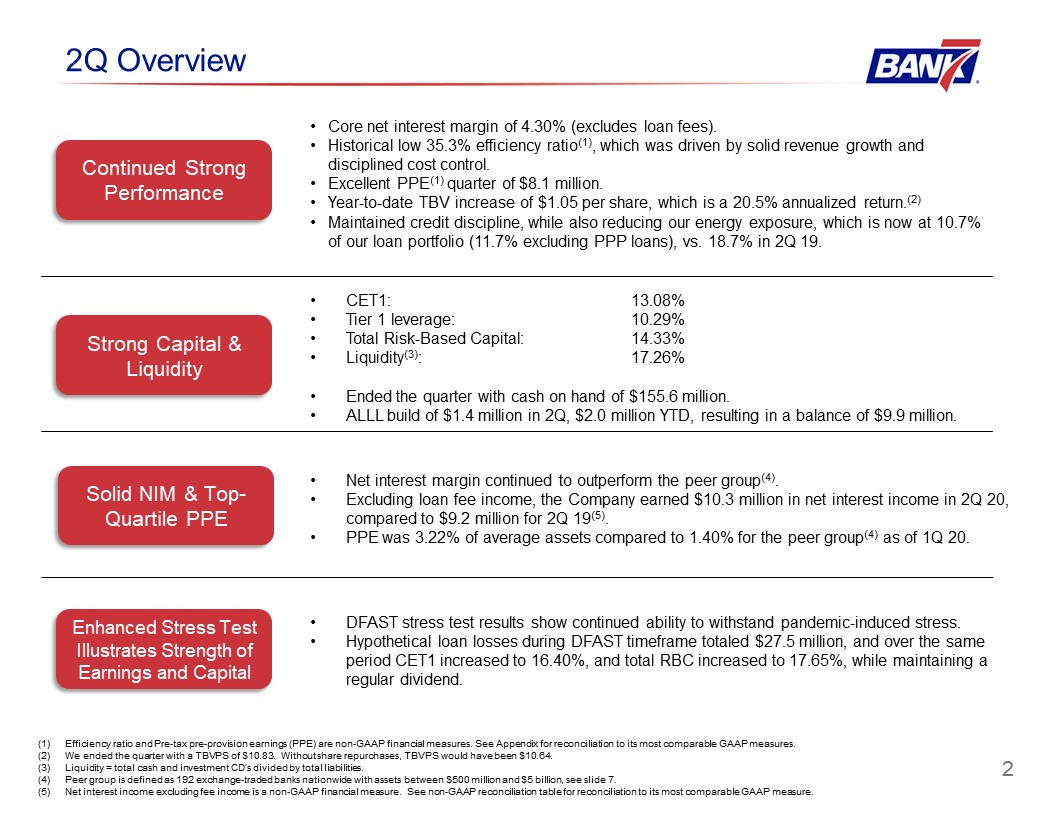
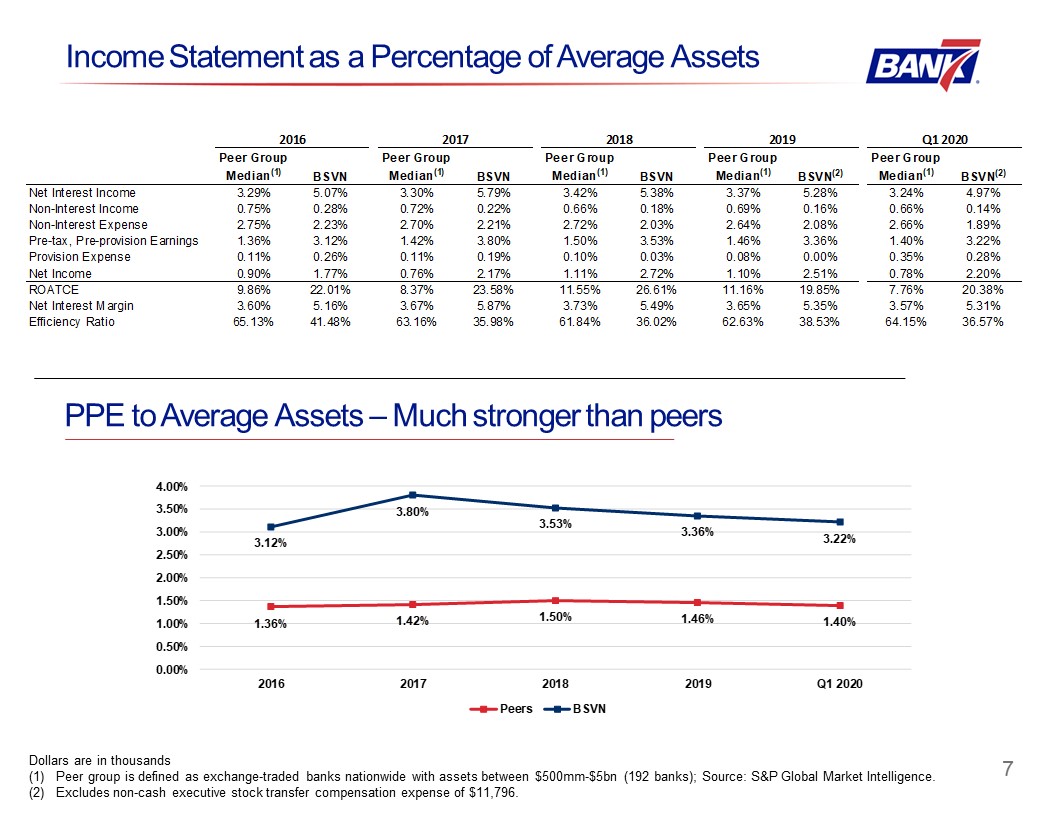
 2  2Q Overview  Solid NIM & Top-Quartile PPE  Net interest margin continued to outperform the peer group(4).Excluding loan fee income, the Company earned $10.3 million in net interest income in 2Q 20, compared to $9.2 million for 2Q 19(5).PPE was 3.22% of average assets compared to 1.40% for the peer group(4) as of 1Q 20.   Continued Strong Performance  Core net interest margin of 4.30% (excludes loan fees).Historical low 35.3% efficiency ratio(1), which was driven by solid revenue growth and disciplined cost control.Excellent PPE(1) quarter of $8.1 million.Year-to-date TBV increase of $1.05 per share, which is a 20.5% annualized return.(2)Maintained credit discipline, while also reducing our energy exposure, which is now at 10.7% of our loan portfolio (11.7% excluding PPP loans), vs. 18.7% in 2Q 19.   Enhanced Stress Test Illustrates Strength of Earnings and Capital  DFAST stress test results show continued ability to withstand pandemic-induced stress.Hypothetical loan losses during DFAST timeframe totaled $27.5 million, and over the same period CET1 increased to 16.40%, and total RBC increased to 17.65%, while maintaining a regular dividend.   Efficiency ratio and Pre-tax pre-provision earnings (PPE) are non-GAAP financial measures. See Appendix for reconciliation to its most comparable GAAP measures.We ended the quarter with a TBVPS of $10.83. Without share repurchases, TBVPS would have been $10.64.Liquidity = total cash and investment CD’s divided by total liabilities. Peer group is defined as 192 exchange-traded banks nationwide with assets between $500 million and $5 billion, see slide 7.Net interest income excluding fee income is a non-GAAP financial measure. See non-GAAP reconciliation table for reconciliation to its most comparable GAAP measure.  Strong Capital & Liquidity  CET1: 13.08%Tier 1 leverage: 10.29%Total Risk-Based Capital: 14.33%Liquidity(3): 17.26% Ended the quarter with cash on hand of $155.6 million.ALLL build of $1.4 million in 2Q, $2.0 million YTD, resulting in a balance of $9.9 million. 
 

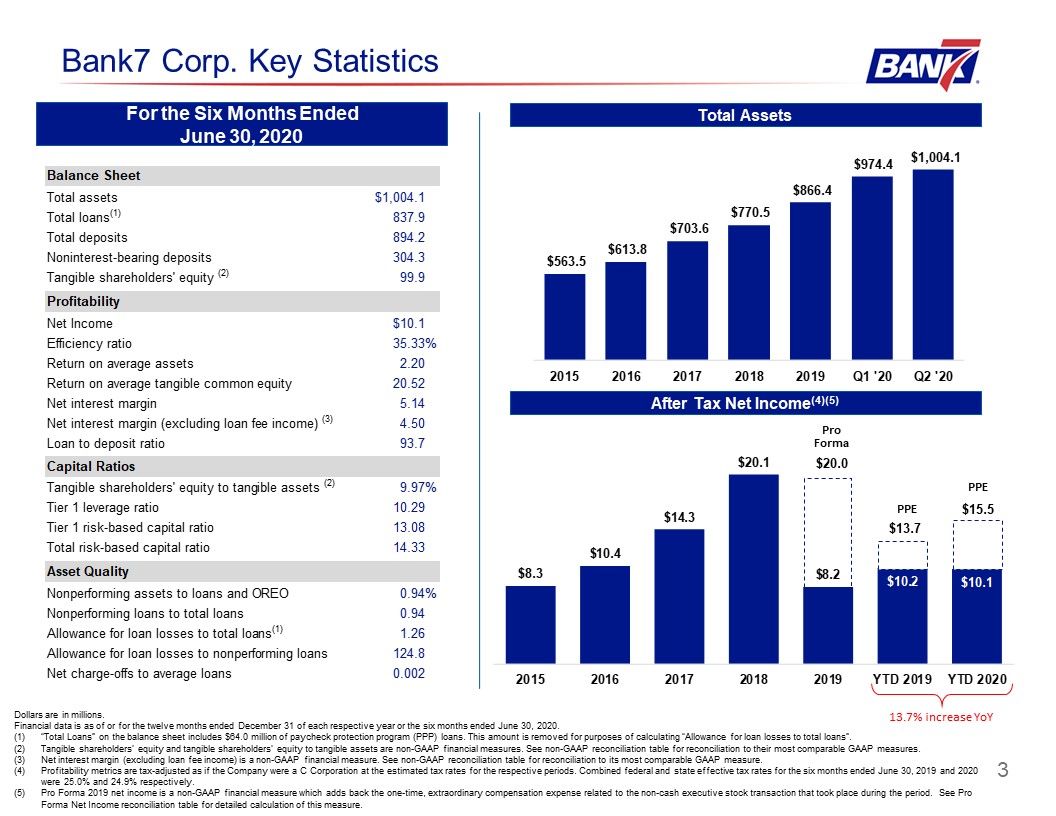
 13.7% increase YoY    Bank7 Corp. Key Statistics  For the Six Months EndedJune 30, 2020  After Tax Net Income(4)(5)  Dollars are in millions. Financial data is as of or for the twelve months ended December 31 of each respective year or the six months ended June 30, 2020.“Total Loans” on the balance sheet includes $64.0 million of paycheck protection program (PPP) loans. This amount is removed for purposes of calculating “Allowance for loan losses to total loans”.Tangible shareholders’ equity and tangible shareholders’ equity to tangible assets are non-GAAP financial measures. See non-GAAP reconciliation table for reconciliation to their most comparable GAAP measures.Net interest margin (excluding loan fee income) is a non-GAAP financial measure. See non-GAAP reconciliation table for reconciliation to its most comparable GAAP measure.Profitability metrics are tax-adjusted as if the Company were a C Corporation at the estimated tax rates for the respective periods. Combined federal and state effective tax rates for the six months ended June 30, 2019 and 2020 were 25.0% and 24.9% respectively. Pro Forma 2019 net income is a non-GAAP financial measure which adds back the one-time, extraordinary compensation expense related to the non-cash executive stock transaction that took place during the period. See Pro Forma Net Income reconciliation table for detailed calculation of this measure.  Total Assets  3  Pro Forma    $20.0  $13.7  $15.5    PPE  PPE   
 

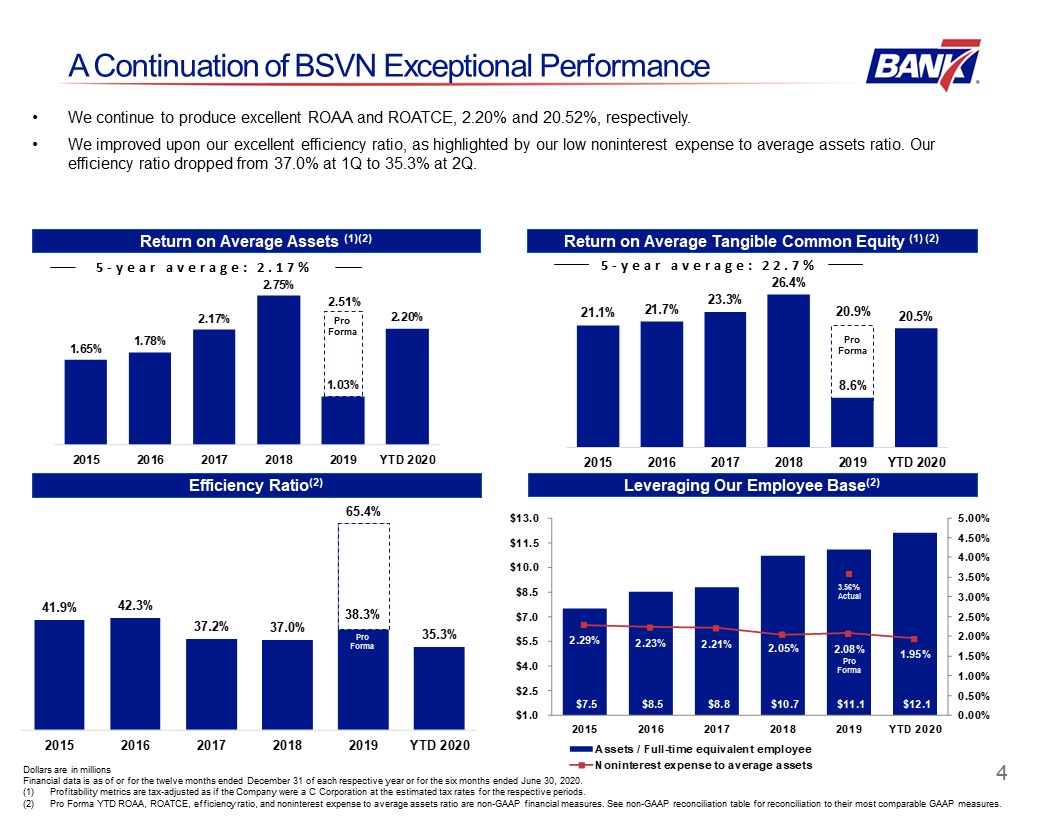
 A Continuation of BSVN Exceptional Performance  Return on Average Assets (1)(2)  Return on Average Tangible Common Equity (1) (2)  Dollars are in millionsFinancial data is as of or for the twelve months ended December 31 of each respective year or for the six months ended June 30, 2020.Profitability metrics are tax-adjusted as if the Company were a C Corporation at the estimated tax rates for the respective periods. Pro Forma YTD ROAA, ROATCE, efficiency ratio, and noninterest expense to average assets ratio are non-GAAP financial measures. See non-GAAP reconciliation table for reconciliation to their most comparable GAAP measures.  Leveraging Our Employee Base(2)  Efficiency Ratio(2)  We continue to produce excellent ROAA and ROATCE, 2.20% and 20.52%, respectively. We improved upon our excellent efficiency ratio, as highlighted by our low noninterest expense to average assets ratio. Our efficiency ratio dropped from 37.0% at 1Q to 35.3% at 2Q.  4  5-year average: 2.17%  5-year average: 22.7%  Pro Forma  Pro Forma  Pro Forma  Pro Forma    38.3%    2.51%    20.9%    3.56%Actual 
 

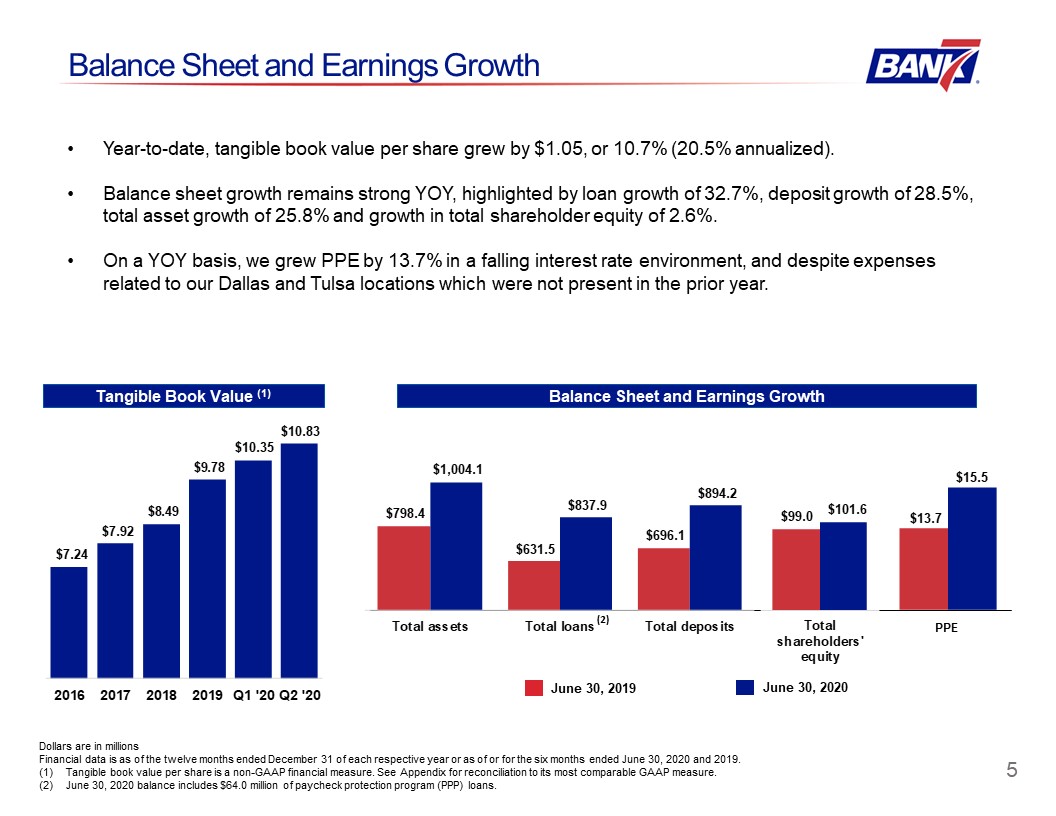
 PPE    June 30, 2019    June 30, 2020  Balance Sheet and Earnings Growth  Dollars are in millionsFinancial data is as of the twelve months ended December 31 of each respective year or as of or for the six months ended June 30, 2020 and 2019. Tangible book value per share is a non-GAAP financial measure. See Appendix for reconciliation to its most comparable GAAP measure.June 30, 2020 balance includes $64.0 million of paycheck protection program (PPP) loans.  Balance Sheet and Earnings Growth  Tangible Book Value (1)  Year-to-date, tangible book value per share grew by $1.05, or 10.7% (20.5% annualized). Balance sheet growth remains strong YOY, highlighted by loan growth of 32.7%, deposit growth of 28.5%, total asset growth of 25.8% and growth in total shareholder equity of 2.6%.On a YOY basis, we grew PPE by 13.7% in a falling interest rate environment, and despite expenses related to our Dallas and Tulsa locations which were not present in the prior year.  5  (2) 
 

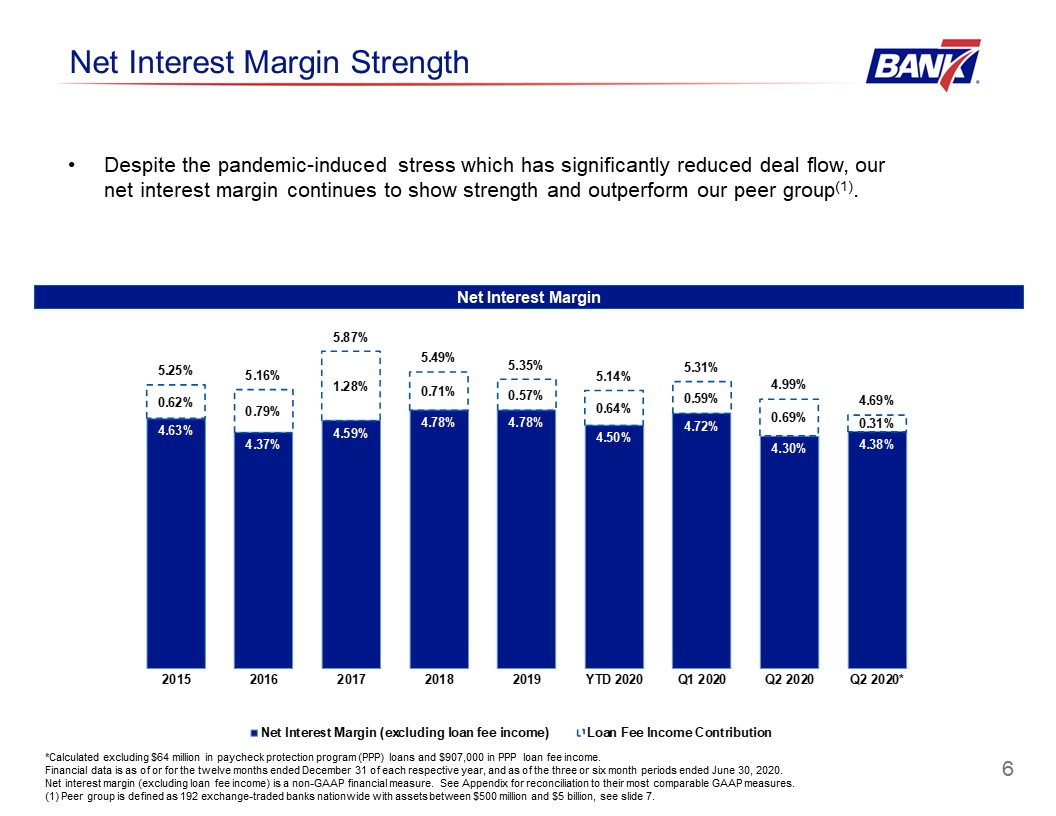
 Net Interest Margin Strength  *Calculated excluding $64 million in paycheck protection program (PPP) loans and $907,000 in PPP loan fee income.Financial data is as of or for the twelve months ended December 31 of each respective year, and as of the three or six month periods ended June 30, 2020.Net interest margin (excluding loan fee income) is a non-GAAP financial measure. See Appendix for reconciliation to their most comparable GAAP measures.(1) Peer group is defined as 192 exchange-traded banks nationwide with assets between $500 million and $5 billion, see slide 7.  Net Interest Margin  Despite the pandemic-induced stress which has significantly reduced deal flow, our net interest margin continues to show strength and outperform our peer group(1).   6 
 

 7  Income Statement as a Percentage of Average Assets  Dollars are in thousandsPeer group is defined as exchange-traded banks nationwide with assets between $500mm-$5bn (192 banks); Source: S&P Global Market Intelligence.Excludes non-cash executive stock transfer compensation expense of $11,796.  PPE to Average Assets – Much stronger than peers 
 

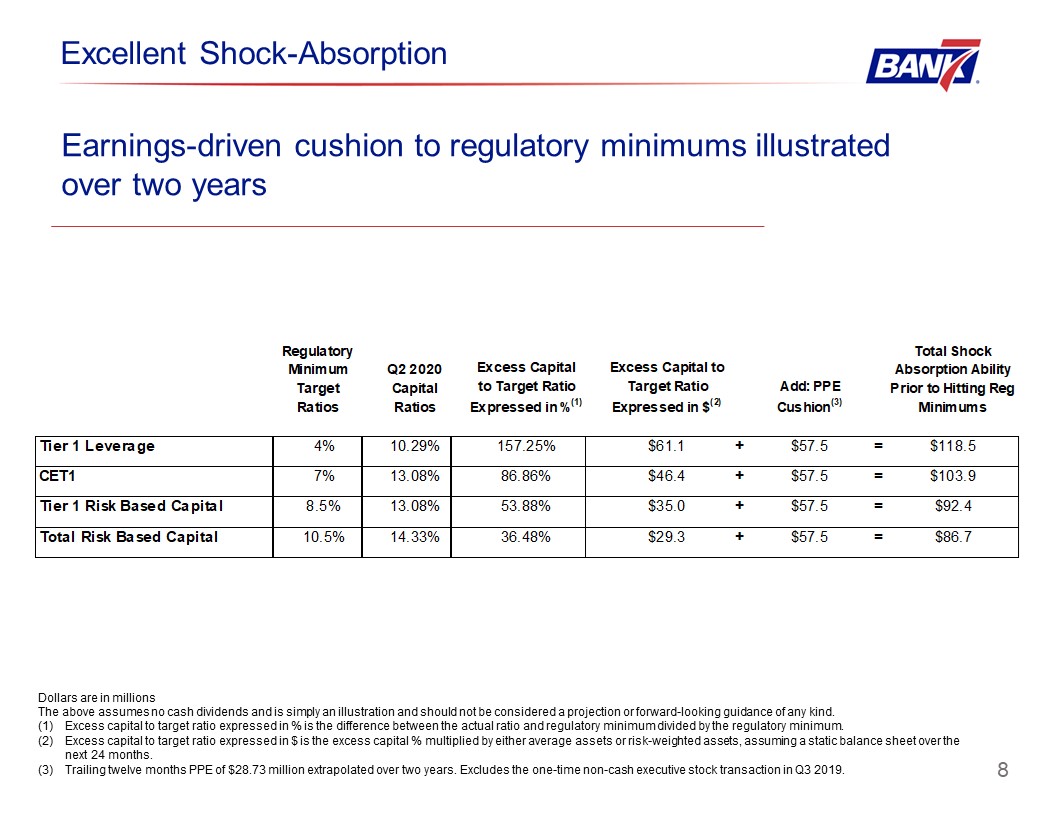
 8  Earnings-driven cushion to regulatory minimums illustrated over two years  Dollars are in millionsThe above assumes no cash dividends and is simply an illustration and should not be considered a projection or forward-looking guidance of any kind. Excess capital to target ratio expressed in % is the difference between the actual ratio and regulatory minimum divided by the regulatory minimum.Excess capital to target ratio expressed in $ is the excess capital % multiplied by either average assets or risk-weighted assets, assuming a static balance sheet over the next 24 months. Trailing twelve months PPE of $28.73 million extrapolated over two years. Excludes the one-time non-cash executive stock transaction in Q3 2019.   Excellent Shock-Absorption 
 

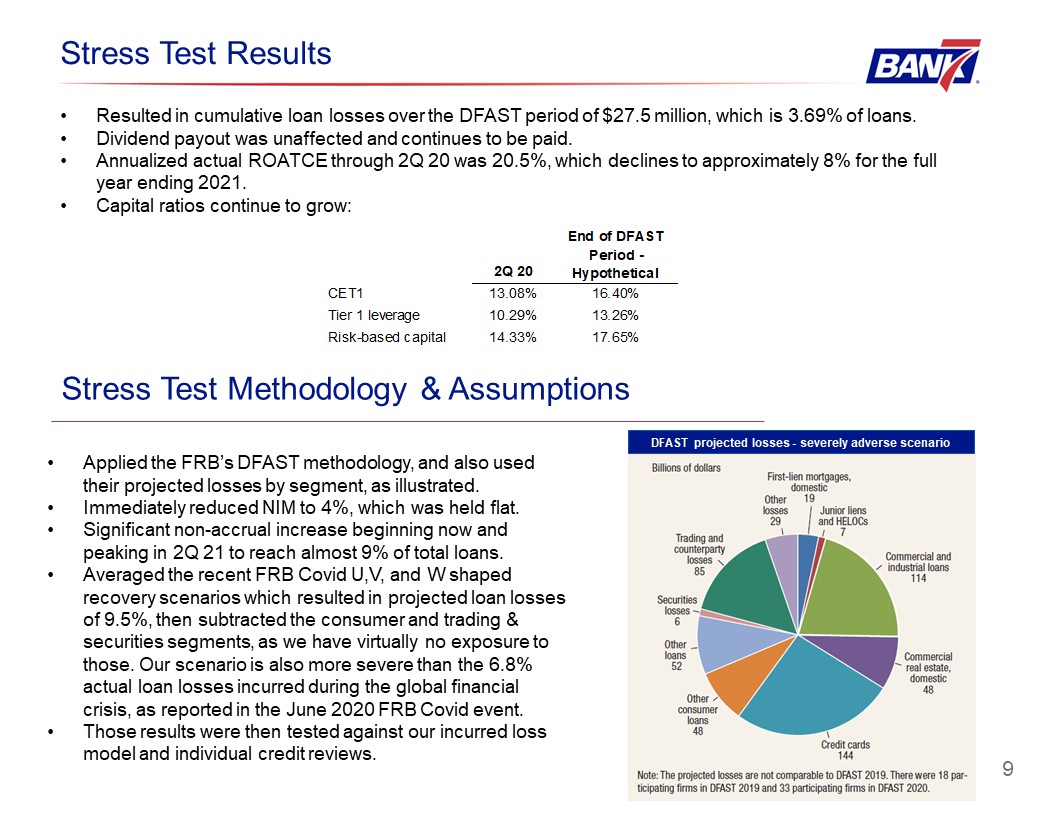
 9  Stress Test Methodology & Assumptions  Stress Test Results  Resulted in cumulative loan losses over the DFAST period of $27.5 million, which is 3.69% of loans.Dividend payout was unaffected and continues to be paid. Annualized actual ROATCE through 2Q 20 was 20.5%, which declines to approximately 8% for the full year ending 2021.Capital ratios continue to grow:  Applied the FRB’s DFAST methodology, and also used their projected losses by segment, as illustrated.Immediately reduced NIM to 4%, which was held flat.Significant non-accrual increase beginning now and peaking in 2Q 21 to reach almost 9% of total loans.Averaged the recent FRB Covid U,V, and W shaped recovery scenarios which resulted in projected loan losses of 9.5%, then subtracted the consumer and trading & securities segments, as we have virtually no exposure to those. Our scenario is also more severe than the 6.8% actual loan losses incurred during the global financial crisis, as reported in the June 2020 FRB Covid event. Those results were then tested against our incurred loss model and individual credit reviews.  DFAST projected losses - severely adverse scenario 
 

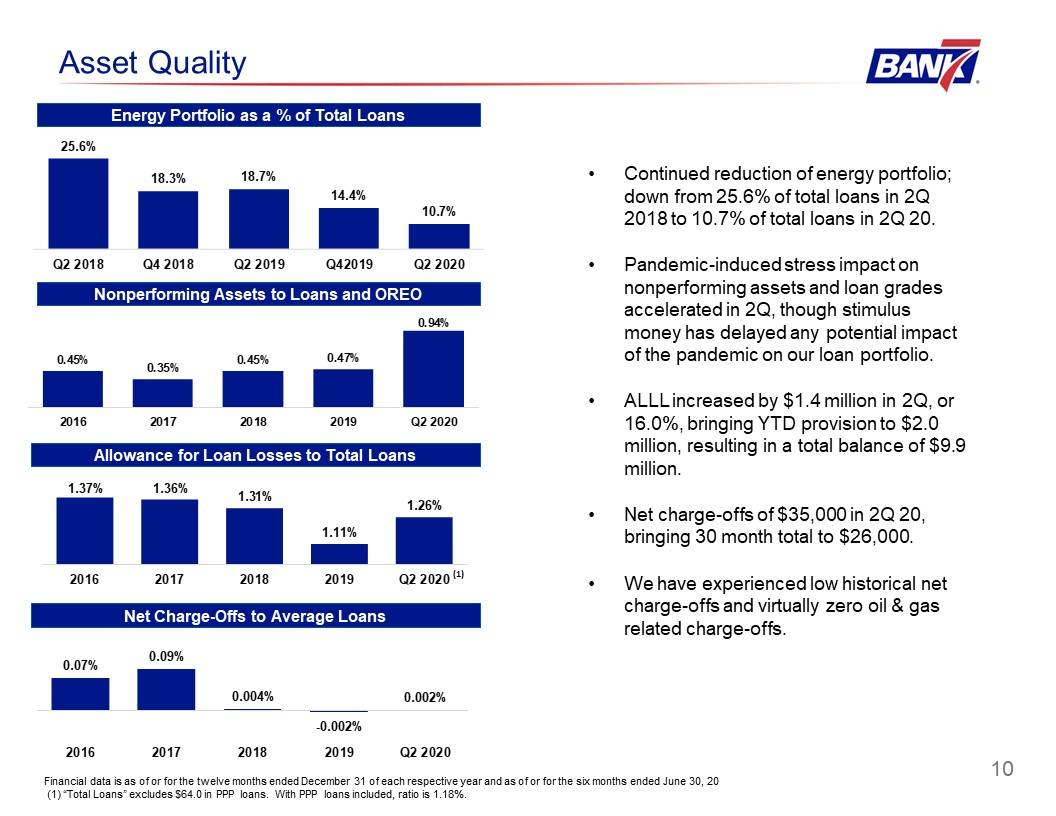
 10  Allowance for Loan Losses to Total Loans  Nonperforming Assets to Loans and OREO  Asset Quality  Net Charge-Offs to Average Loans  Financial data is as of or for the twelve months ended December 31 of each respective year and as of or for the six months ended June 30, 2020. (1) “Total Loans” excludes $64.0 in PPP loans. With PPP loans included, ratio is 1.18%.   Continued reduction of energy portfolio; down from 25.6% of total loans in 2Q 2018 to 10.7% of total loans in 2Q 20.Pandemic-induced stress impact on nonperforming assets and loan grades accelerated in 2Q, though stimulus money has delayed any potential impact of the pandemic on our loan portfolio. ALLL increased by $1.4 million in 2Q, or 16.0%, bringing YTD provision to $2.0 million, resulting in a total balance of $9.9 million.Net charge-offs of $35,000 in 2Q 20, bringing 30 month total to $26,000.We have experienced low historical net charge-offs and virtually zero oil & gas related charge-offs.  (1)  Energy Portfolio as a % of Total Loans 
 

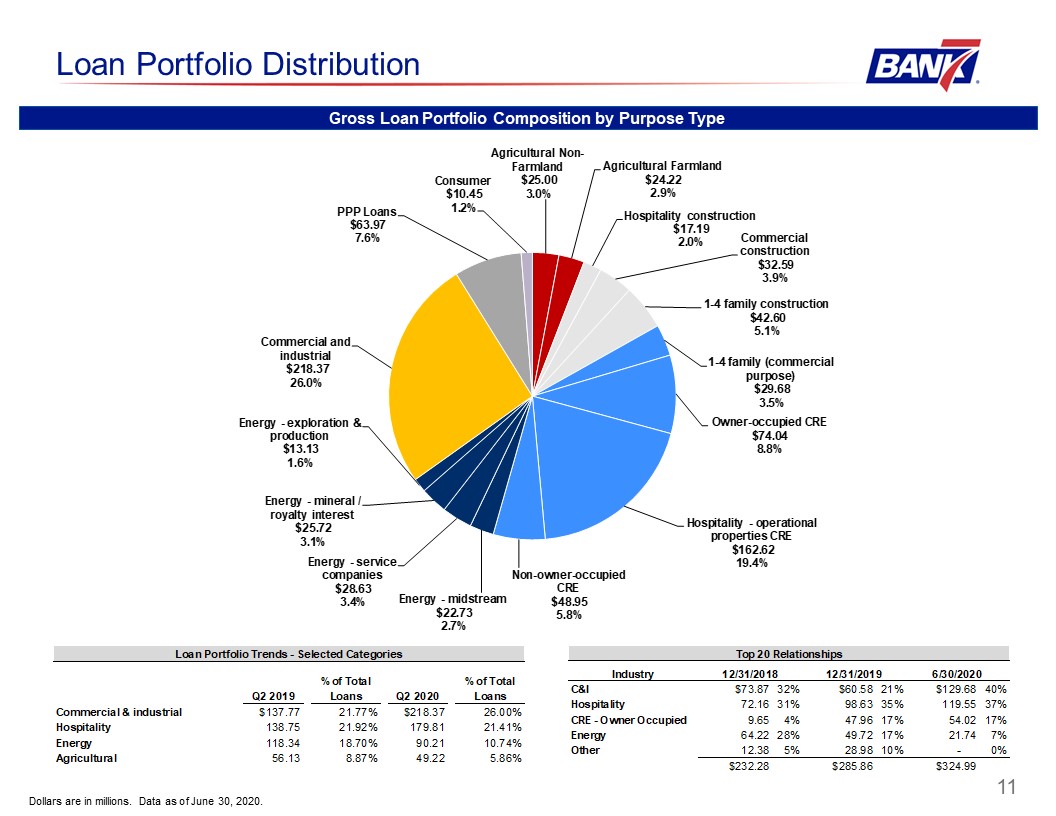
 Loan Portfolio Distribution  Dollars are in millions. Data as of June 30, 2020.  Gross Loan Portfolio Composition by Purpose Type  11 
 

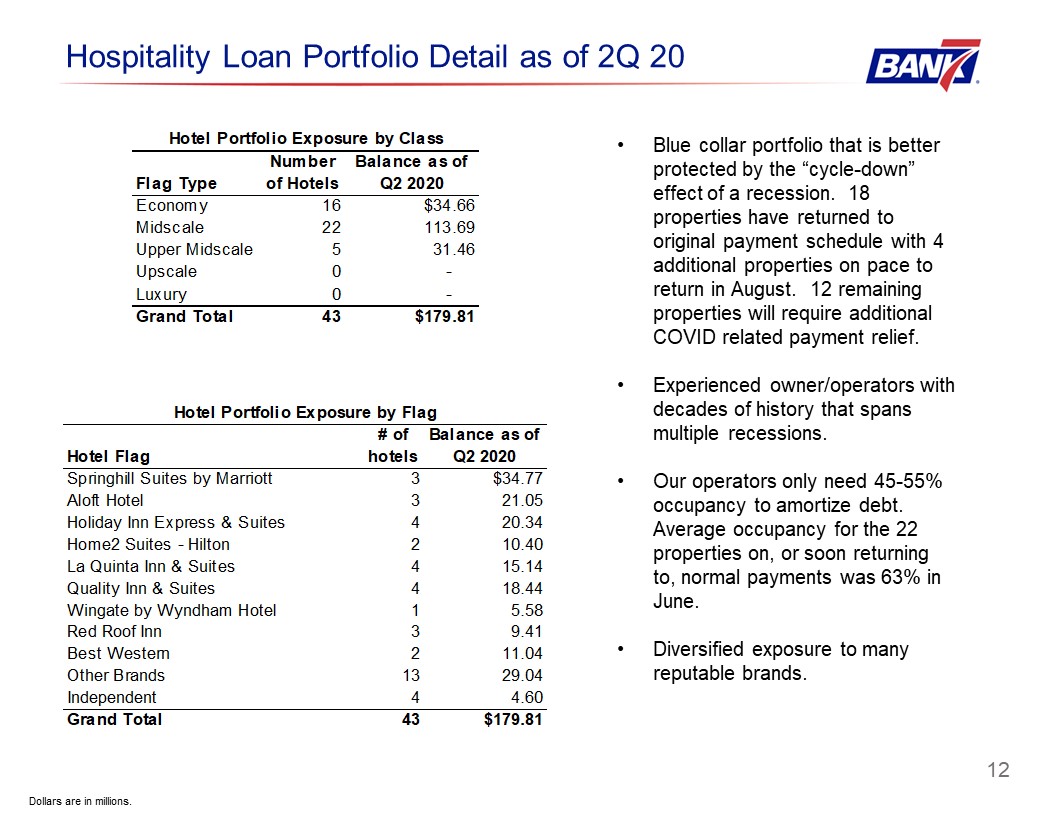
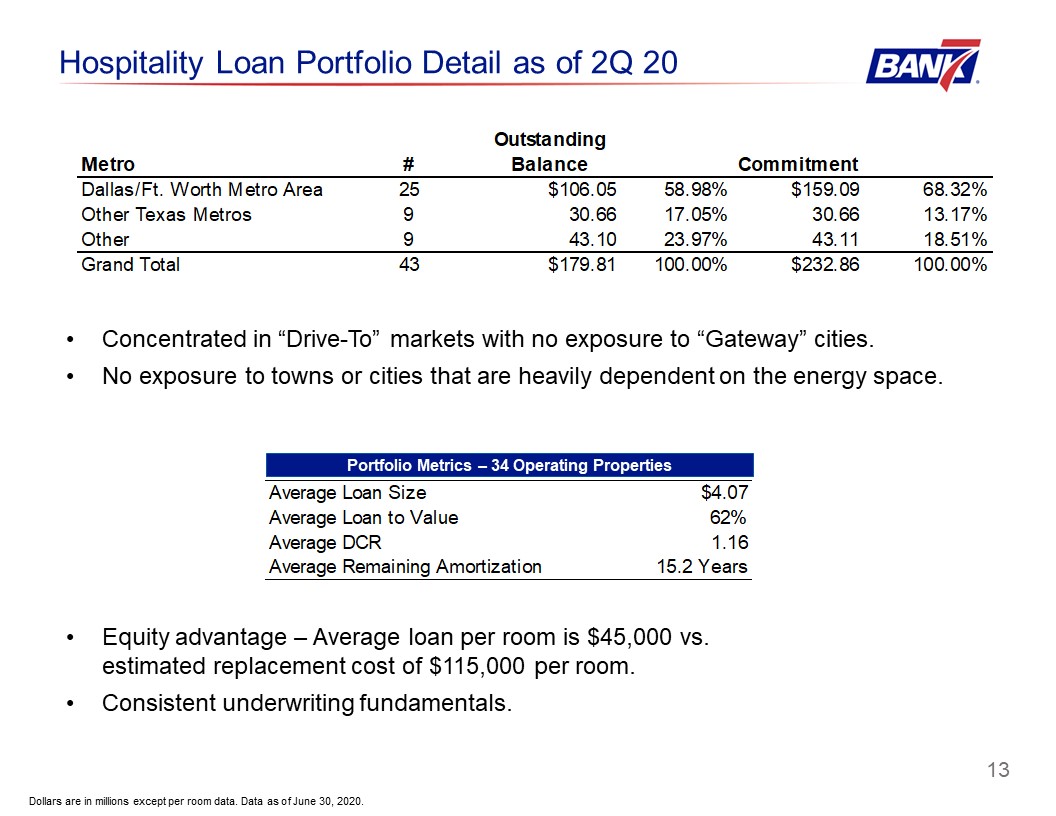
 Hospitality Loan Portfolio Detail as of 2Q 20  12  Blue collar portfolio that is better protected by the “cycle-down” effect of a recession. 18 properties have returned to original payment schedule with 4 additional properties on pace to return in August. 12 remaining properties will require additional COVID related payment relief.Experienced owner/operators with decades of history that spans multiple recessions. Our operators only need 45-55% occupancy to amortize debt. Average occupancy for the 22 properties on, or soon returning to, normal payments was 63% in June.Diversified exposure to many reputable brands.  Dollars are in millions. 
 

 13  Hospitality Loan Portfolio Detail as of 2Q 20  Equity advantage – Average loan per room is $45,000 vs. estimated replacement cost of $115,000 per room.Consistent underwriting fundamentals.  Concentrated in “Drive-To” markets with no exposure to “Gateway” cities.No exposure to towns or cities that are heavily dependent on the energy space.  Portfolio Metrics – 34 Operating Properties  Dollars are in millions except per room data. Data as of June 30, 2020. 
 

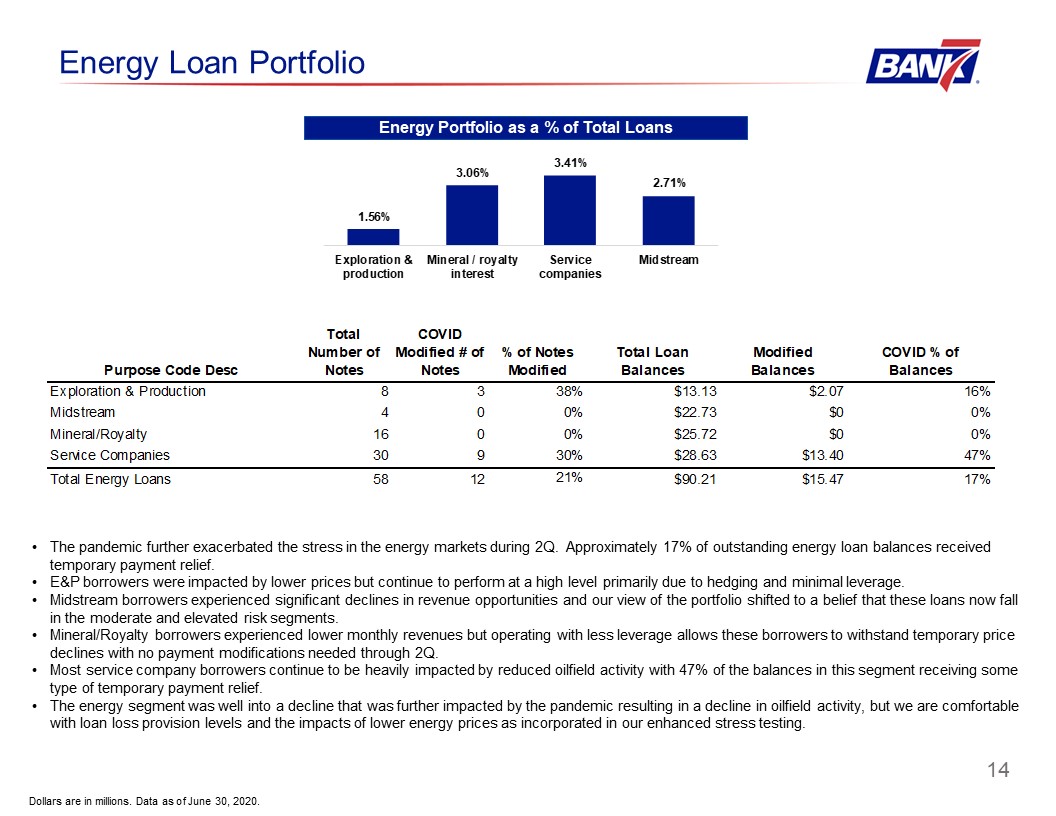
 14  Dollars are in millions. Data as of June 30, 2020.  Energy Loan Portfolio  Energy Portfolio as a % of Total Loans  The pandemic further exacerbated the stress in the energy markets during 2Q. Approximately 17% of outstanding energy loan balances received temporary payment relief.E&P borrowers were impacted by lower prices but continue to perform at a high level primarily due to hedging and minimal leverage.Midstream borrowers experienced significant declines in revenue opportunities and our view of the portfolio shifted to a belief that these loans now fall in the moderate and elevated risk segments.Mineral/Royalty borrowers experienced lower monthly revenues but operating with less leverage allows these borrowers to withstand temporary price declines with no payment modifications needed through 2Q.Most service company borrowers continue to be heavily impacted by reduced oilfield activity with 47% of the balances in this segment receiving some type of temporary payment relief.The energy segment was well into a decline that was further impacted by the pandemic resulting in a decline in oilfield activity, but we are comfortable with loan loss provision levels and the impacts of lower energy prices as incorporated in our enhanced stress testing. 
 

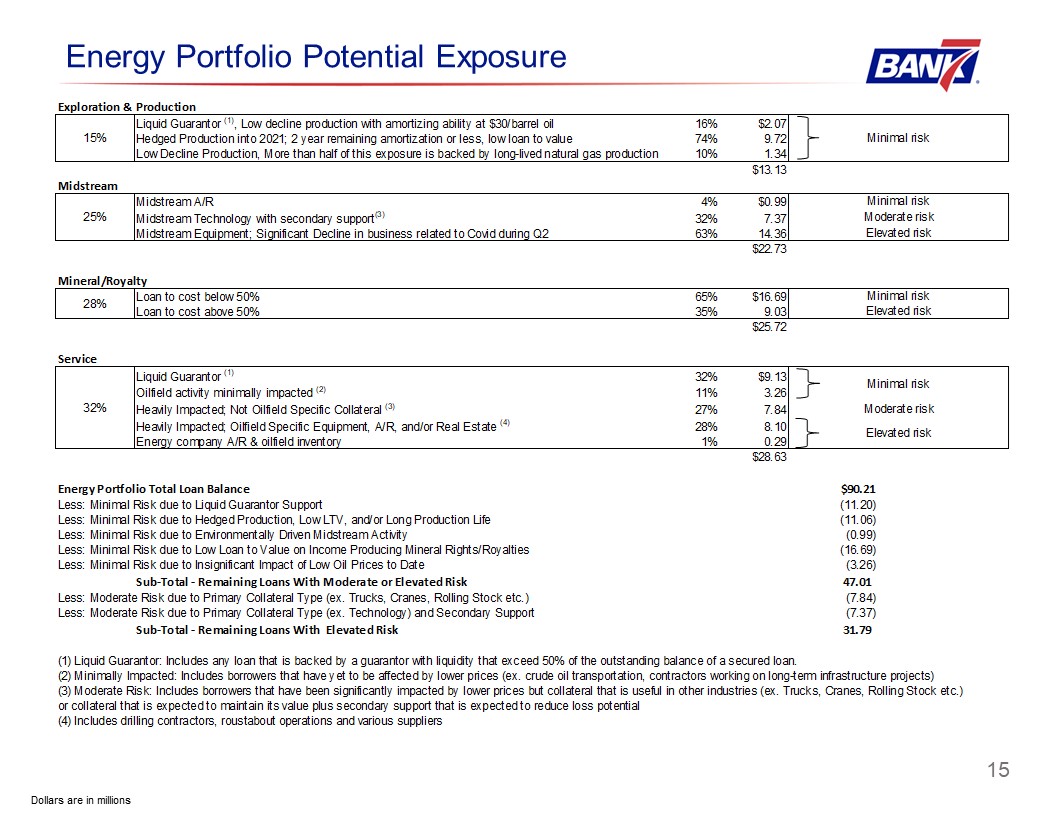
 Dollars are in millions  Energy Portfolio Potential Exposure  15 
 

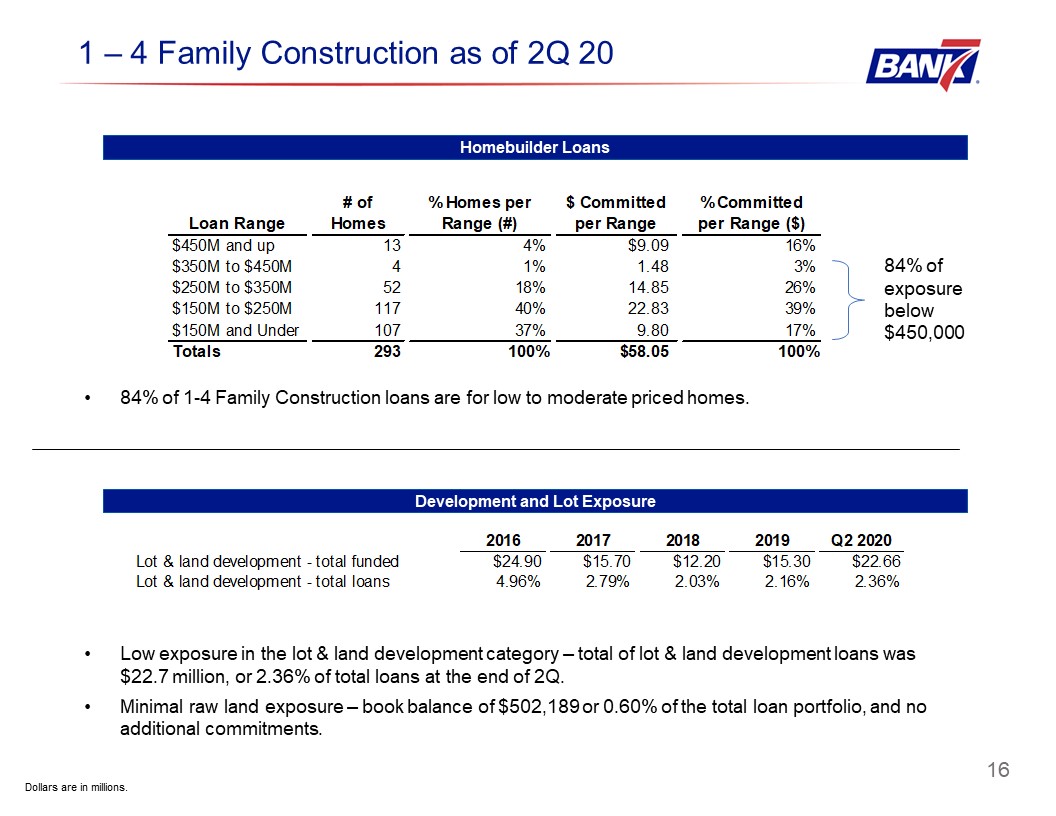
 16  Development and Lot Exposure  Low exposure in the lot & land development category – total of lot & land development loans was $22.7 million, or 2.36% of total loans at the end of 2Q.Minimal raw land exposure – book balance of $502,189 or 0.60% of the total loan portfolio, and no additional commitments.  Dollars are in millions.  1 – 4 Family Construction as of 2Q 20    84% of exposure below $450,000  Homebuilder Loans  84% of 1-4 Family Construction loans are for low to moderate priced homes. 
 

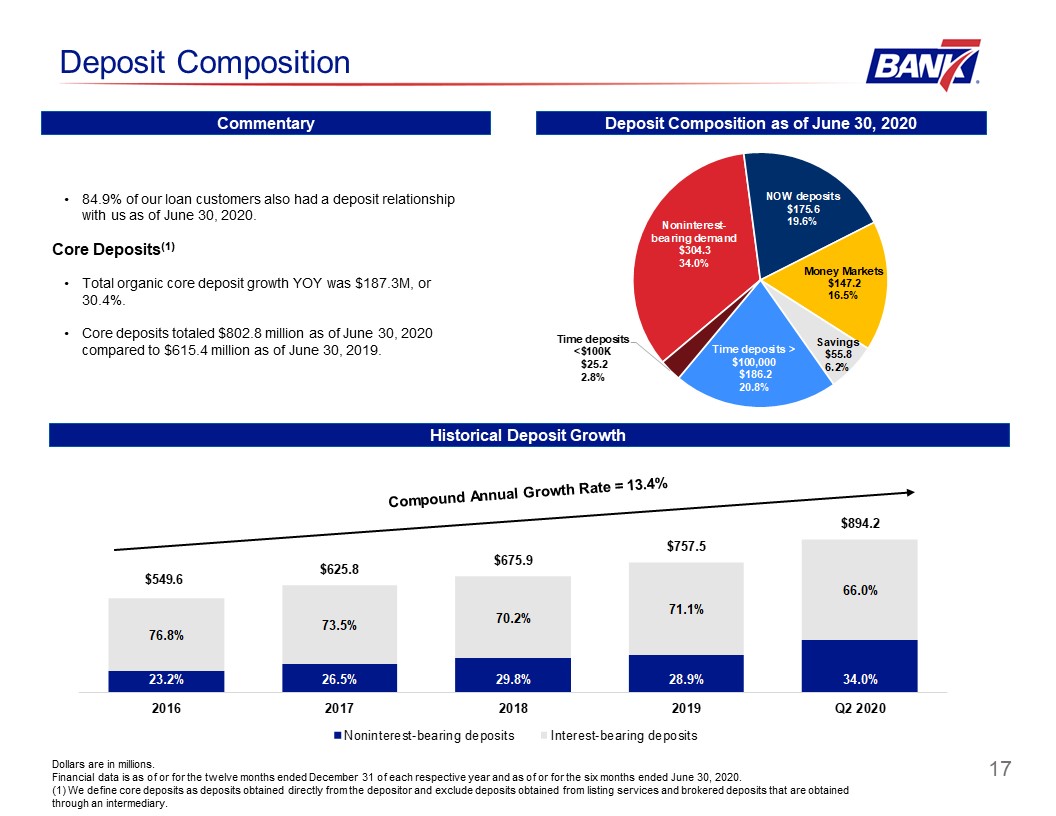
 Deposit Composition  Historical Deposit Growth  Compound Annual Growth Rate = 13.4%  Deposit Composition as of June 30, 2020  84.9% of our loan customers also had a deposit relationship with us as of June 30, 2020.Core Deposits(1)Total organic core deposit growth YOY was $187.3M, or 30.4%.  Core deposits totaled $802.8 million as of June 30, 2020 compared to $615.4 million as of June 30, 2019.  Dollars are in millions.Financial data is as of or for the twelve months ended December 31 of each respective year and as of or for the six months ended June 30, 2020.(1) We define core deposits as deposits obtained directly from the depositor and exclude deposits obtained from listing services and brokered deposits that are obtained through an intermediary.  28.4%  26.3%  Commentary  17 
 

 Appendix  18 
 

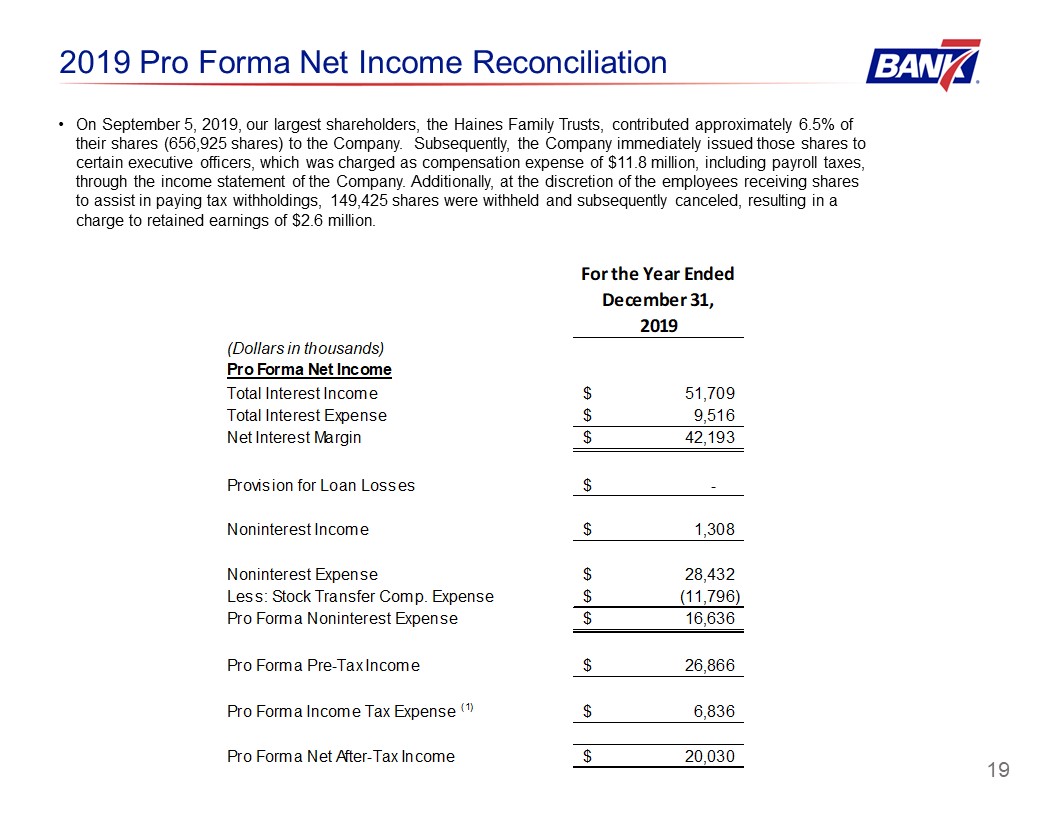
 19  2019 Pro Forma Net Income Reconciliation   On September 5, 2019, our largest shareholders, the Haines Family Trusts, contributed approximately 6.5% of their shares (656,925 shares) to the Company.  Subsequently, the Company immediately issued those shares to certain executive officers, which was charged as compensation expense of $11.8 million, including payroll taxes, through the income statement of the Company. Additionally, at the discretion of the employees receiving shares to assist in paying tax withholdings, 149,425 shares were withheld and subsequently canceled, resulting in a charge to retained earnings of $2.6 million. 
 

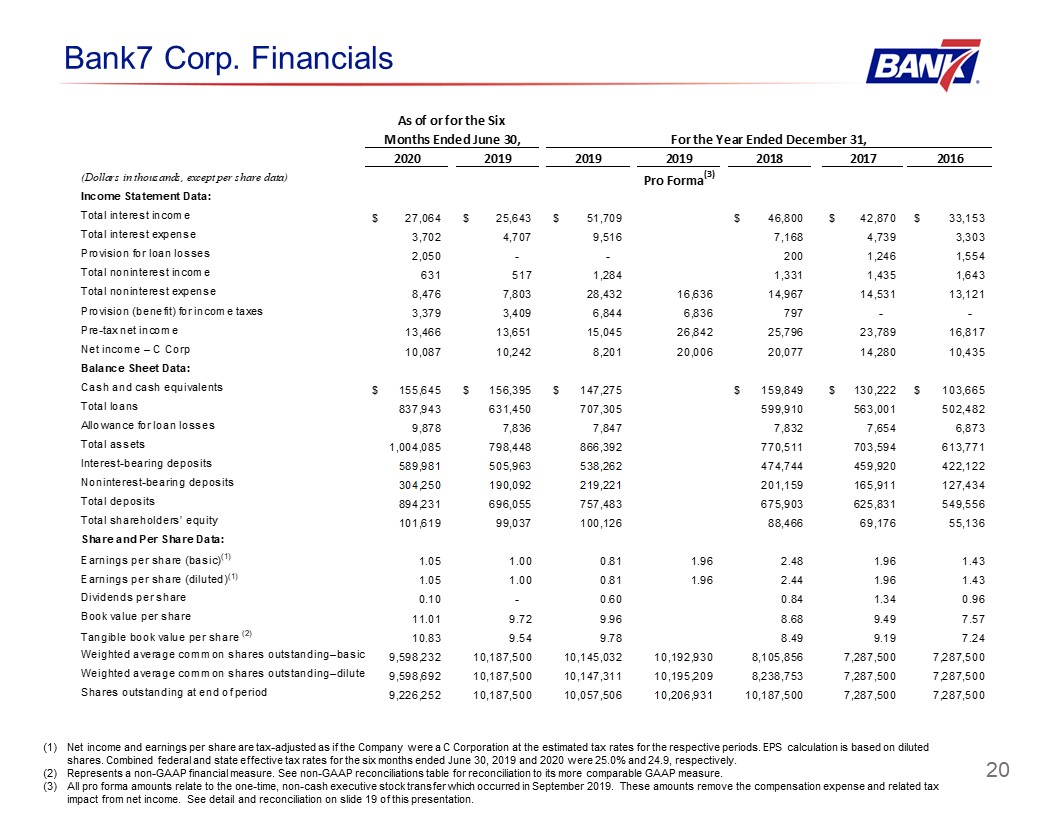
 20  Bank7 Corp. Financials  Net income and earnings per share are tax-adjusted as if the Company were a C Corporation at the estimated tax rates for the respective periods. EPS calculation is based on diluted shares. Combined federal and state effective tax rates for the six months ended June 30, 2019 and 2020 were 25.0% and 24.9, respectively. Represents a non-GAAP financial measure. See non-GAAP reconciliations table for reconciliation to its more comparable GAAP measure. All pro forma amounts relate to the one-time, non-cash executive stock transfer which occurred in September 2019. These amounts remove the compensation expense and related tax impact from net income. See detail and reconciliation on slide 19 of this presentation. 
 

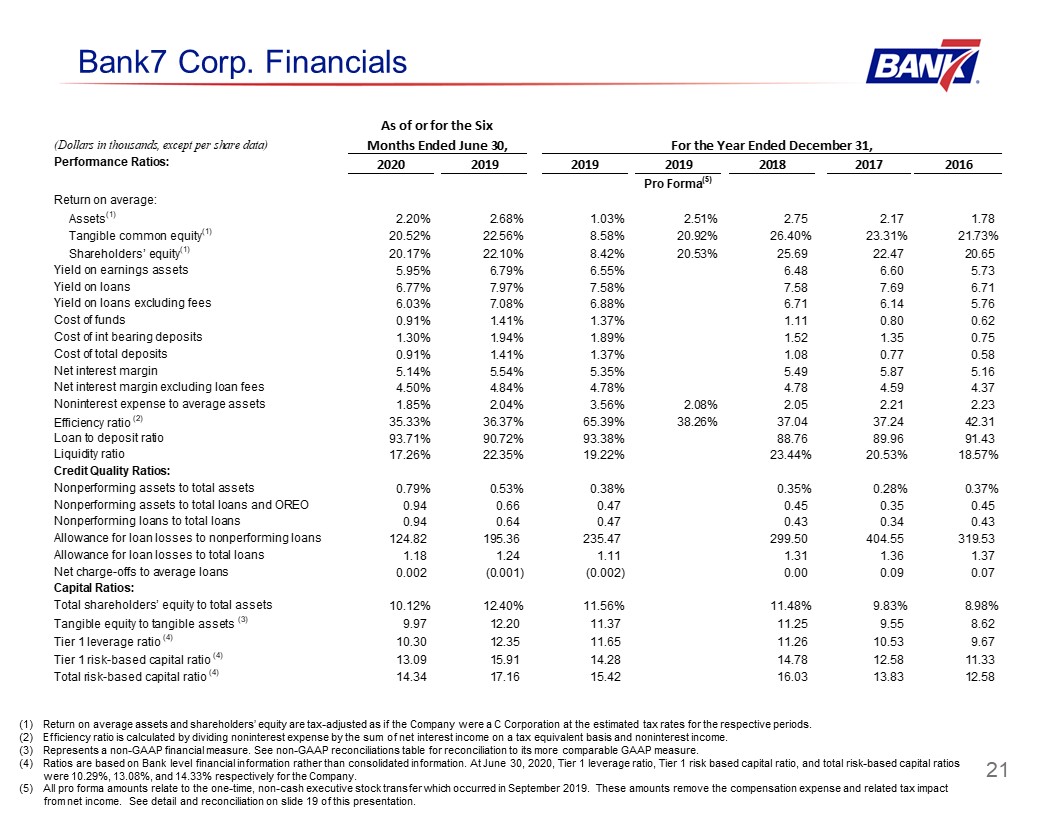
 21  Bank7 Corp. Financials  Return on average assets and shareholders’ equity are tax-adjusted as if the Company were a C Corporation at the estimated tax rates for the respective periods.Efficiency ratio is calculated by dividing noninterest expense by the sum of net interest income on a tax equivalent basis and noninterest income.   Represents a non-GAAP financial measure. See non-GAAP reconciliations table for reconciliation to its more comparable GAAP measure. Ratios are based on Bank level financial information rather than consolidated information. At June 30, 2020, Tier 1 leverage ratio, Tier 1 risk based capital ratio, and total risk-based capital ratios were 10.29%, 13.08%, and 14.33% respectively for the Company.All pro forma amounts relate to the one-time, non-cash executive stock transfer which occurred in September 2019. These amounts remove the compensation expense and related tax impact from net income. See detail and reconciliation on slide 19 of this presentation. 
 

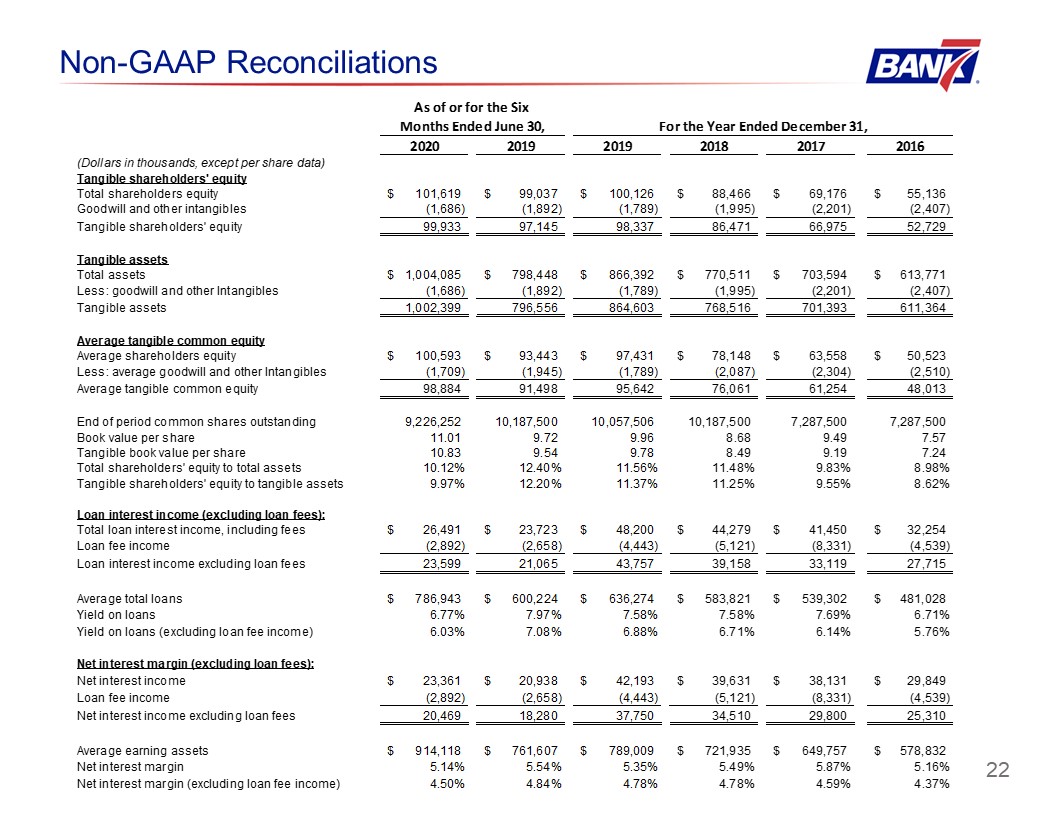
 22  Non-GAAP Reconciliations 
 

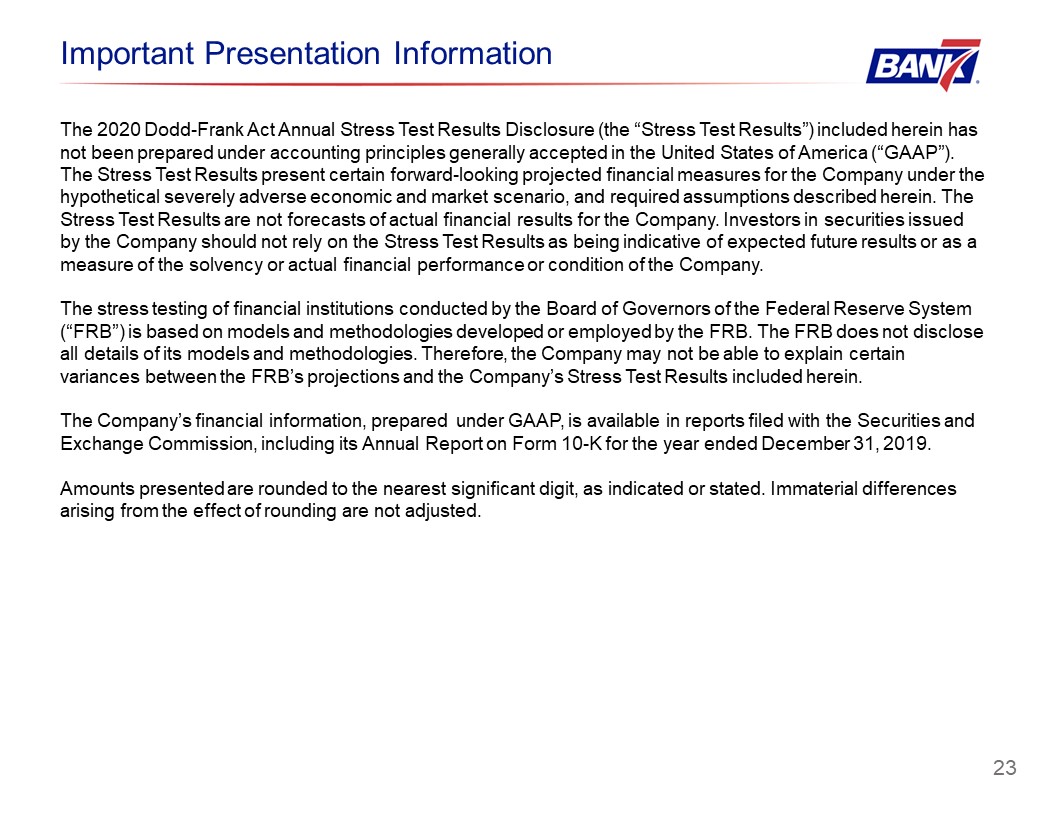
 23  Important Presentation Information  The 2020 Dodd-Frank Act Annual Stress Test Results Disclosure (the “Stress Test Results”) included herein has not been prepared under accounting principles generally accepted in the United States of America (“GAAP”). The Stress Test Results present certain forward-looking projected financial measures for the Company under the hypothetical severely adverse economic and market scenario, and required assumptions described herein. The Stress Test Results are not forecasts of actual financial results for the Company. Investors in securities issued by the Company should not rely on the Stress Test Results as being indicative of expected future results or as a measure of the solvency or actual financial performance or condition of the Company. The stress testing of financial institutions conducted by the Board of Governors of the Federal Reserve System (“FRB”) is based on models and methodologies developed or employed by the FRB. The FRB does not disclose all details of its models and methodologies. Therefore, the Company may not be able to explain certain variances between the FRB’s projections and the Company’s Stress Test Results included herein.The Company’s financial information, prepared under GAAP, is available in reports filed with the Securities and Exchange Commission, including its Annual Report on Form 10-K for the year ended December 31, 2019.Amounts presented are rounded to the nearest significant digit, as indicated or stated. Immaterial differences arising from the effect of rounding are not adjusted.  
 

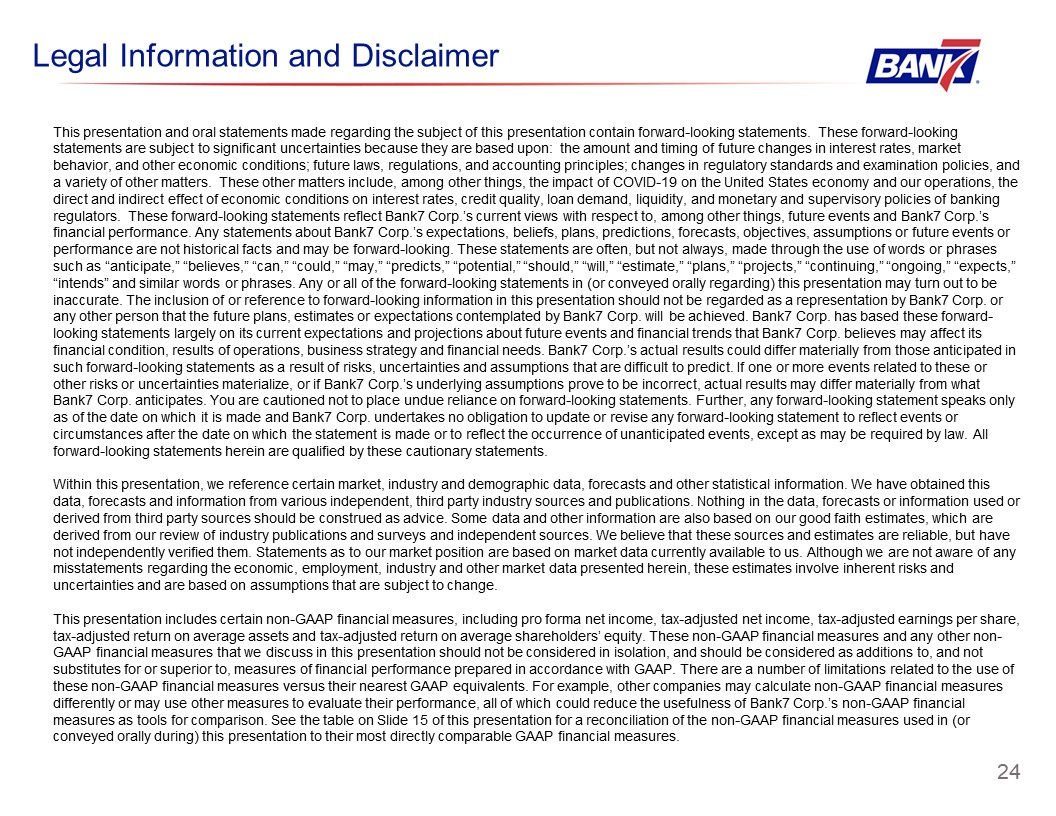
 24  Legal Information and Disclaimer  This presentation and oral statements made regarding the subject of this presentation contain forward-looking statements. These forward-looking statements are subject to significant uncertainties because they are based upon: the amount and timing of future changes in interest rates, market behavior, and other economic conditions; future laws, regulations, and accounting principles; changes in regulatory standards and examination policies, and a variety of other matters. These other matters include, among other things, the impact of COVID-19 on the United States economy and our operations, the direct and indirect effect of economic conditions on interest rates, credit quality, loan demand, liquidity, and monetary and supervisory policies of banking regulators. These forward-looking statements reflect Bank7 Corp.’s current views with respect to, among other things, future events and Bank7 Corp.’s financial performance. Any statements about Bank7 Corp.’s expectations, beliefs, plans, predictions, forecasts, objectives, assumptions or future events or performance are not historical facts and may be forward-looking. These statements are often, but not always, made through the use of words or phrases such as “anticipate,” “believes,” “can,” “could,” “may,” “predicts,” “potential,” “should,” “will,” “estimate,” “plans,” “projects,” “continuing,” “ongoing,” “expects,” “intends” and similar words or phrases. Any or all of the forward-looking statements in (or conveyed orally regarding) this presentation may turn out to be inaccurate. The inclusion of or reference to forward-looking information in this presentation should not be regarded as a representation by Bank7 Corp. or any other person that the future plans, estimates or expectations contemplated by Bank7 Corp. will be achieved. Bank7 Corp. has based these forward-looking statements largely on its current expectations and projections about future events and financial trends that Bank7 Corp. believes may affect its financial condition, results of operations, business strategy and financial needs. Bank7 Corp.’s actual results could differ materially from those anticipated in such forward-looking statements as a result of risks, uncertainties and assumptions that are difficult to predict. If one or more events related to these or other risks or uncertainties materialize, or if Bank7 Corp.’s underlying assumptions prove to be incorrect, actual results may differ materially from what Bank7 Corp. anticipates. You are cautioned not to place undue reliance on forward-looking statements. Further, any forward-looking statement speaks only as of the date on which it is made and Bank7 Corp. undertakes no obligation to update or revise any forward-looking statement to reflect events or circumstances after the date on which the statement is made or to reflect the occurrence of unanticipated events, except as may be required by law. All forward-looking statements herein are qualified by these cautionary statements. Within this presentation, we reference certain market, industry and demographic data, forecasts and other statistical information. We have obtained this data, forecasts and information from various independent, third party industry sources and publications. Nothing in the data, forecasts or information used or derived from third party sources should be construed as advice. Some data and other information are also based on our good faith estimates, which are derived from our review of industry publications and surveys and independent sources. We believe that these sources and estimates are reliable, but have not independently verified them. Statements as to our market position are based on market data currently available to us. Although we are not aware of any misstatements regarding the economic, employment, industry and other market data presented herein, these estimates involve inherent risks and uncertainties and are based on assumptions that are subject to change. This presentation includes certain non-GAAP financial measures, including pro forma net income, tax-adjusted net income, tax-adjusted earnings per share, tax-adjusted return on average assets and tax-adjusted return on average shareholders’ equity. These non-GAAP financial measures and any other non-GAAP financial measures that we discuss in this presentation should not be considered in isolation, and should be considered as additions to, and not substitutes for or superior to, measures of financial performance prepared in accordance with GAAP. There are a number of limitations related to the use of these non-GAAP financial measures versus their nearest GAAP equivalents. For example, other companies may calculate non-GAAP financial measures differently or may use other measures to evaluate their performance, all of which could reduce the usefulness of Bank7 Corp.’s non-GAAP financial measures as tools for comparison. See the table on Slide 15 of this presentation for a reconciliation of the non-GAAP financial measures used in (or conveyed orally during) this presentation to their most directly comparable GAAP financial measures.