UNITED STATES
SECURITIES AND EXCHANGE COMMISSION
Washington, D.C. 20549


FORM 8-K


CURRENT REPORT
 
Pursuant to Section 13 or 15(d) of the
Securities Exchange Act of 1934
 
Date of Report (Date of earliest event reported)
 
July 27, 2022


Bank7 Corp.
(Exact name of registrant as specified in its charter)


Oklahoma
001-38656
20-0764349
(State or other jurisdiction of incorporation)
(Commission File Number)
(IRS Employer Identification No.)

1039 N.W. 63rd Street, Oklahoma City, Oklahoma 73116
(Address of principal executive offices) (Zip Code)

(405) 810-8600
 (Registrant’s telephone number, including area code)
 
Not Applicable
(Former name or former address, if changed since last report)


Check the appropriate box below if the Form 8-K filing is intended to simultaneously satisfy the filing obligation of the registrant under any of the following provisions:


Written communications pursuant to Rule 425 under the Securities Act (17 CFR 230.425)


Soliciting material pursuant to Rule 14a-12 under the Exchange Act (17 CFR 240.14a-12)


Pre-commencement communications pursuant to Rule 14d-2(b) under the Exchange Act (17 CFR 240.14d-2(b))


Pre-commencement communications pursuant to Rule 13e-4(c) under the Exchange Act (17 CFR 240.13e-4(c))

 Securities registered pursuant to Section 12(b) of the Act:

Title of each class
Trading
Symbol(s)
Name of each exchange on which registered
Common Stock, $0.01 par value
BSVN
The NASDAQ Global Select Market

Indicate by check mark whether the registrant is an emerging growth company as defined in Rule 405 of the Securities Act of 1933 (17 CFR §230.405) or Rule 12b-2 of the Securities Exchange Act of 1934 (17 CFR §240.12b-2).

Emerging growth company 
 

If an emerging growth company, indicate by check mark if the registrant has elected not to use the extended transition period for complying with any new or revised financial accounting standards provided pursuant to Section 13(a) of the Exchange Act.


Item 2.02.
Results of Operations and Financial Condition

Item 7.01
Regulation FD Disclosure

On July 27, 2022, Bank7 Corp. (the “Company”), the holding company for Bank7, issued a press release announcing its results of operation and financial condition for the quarter ended June 30, 2022.  A copy of the press release is attached to this Current Report on Form 8-K as Exhibit 99.1 and is incorporated herein by reference.

The Company is conducting a conference call on July 27, 2022 at 10:00 am CST to discuss its second quarter financial results. A copy of the presentation slides to be used during the earnings call is attached to this Current Report on Form 8-K as Exhibit 99.2 and is incorporated herein by reference.

In accordance with General Instruction B.2 of Form 8-K, the information in this Current Report on Form 8-K, including Exhibit 99.1 and Exhibit 99.2, shall not be deemed “filed” for the purposes of Section 18 of the Securities Exchange Act of 1934, as amended (the “Exchange Act”), and shall not be incorporated by reference into any filing or other document pursuant to the Securities Act of 1933, as amended, or the Exchange Act except as shall be expressly set forth by specific reference in such filing.

Item 9.01
Financial Statements and Exhibits

 
(d)
Exhibits.
      
   The following exhibits are filed herewith:

  Item   Description
       
   
Press Release dated July 27, 2022
   
Second Quarter 2022 Investor Presentation


SIGNATURES
 
Pursuant to the requirements of the Securities Exchange Act of 1934, the registrant has duly caused this report to be signed on its behalf by the undersigned hereunto duly authorized.

 
BANK7 CORP.
     
Date: July 27, 2022
By:
/s/ Kelly J. Harris
   
Kelly J. Harris
   
Executive Vice President and Chief Financial Officer


Exhibit 99.1


FOR IMMEDIATE RELEASE: Bank7 Corp. Announces Q2 2022 Earnings

Oklahoma City, July 27, 2022 – Bank7 Corp. (NASDAQ: BSVN) ("the Company"), the parent company of Oklahoma City-based Bank7 (the "Bank"), today reported unaudited results for the fiscal quarter ended June 30, 2022.  “We are pleased to announce a strong quarter, as evidenced by record net income and earnings per share. Our dynamic geographic markets, strong loan growth and asset sensitive balance sheet, combined with our talented bankers, continues to produce outstanding results.  As we move forward, we intend to continue producing exceptional results through organic growth and strategic acquisitions,” said Thomas L. Travis, President and CEO of the Company.

Three months ended June 30, 2022 compared to three months ended March 31, 2022


-
Net income of $7.0 million compared to $6.2 million, an increase of 13.5%

-
Diluted Earnings per share of $0.76 compared to $0.67, an increase of 13.4%

-
Total assets of $1.5 billion compared to $1.4 billion, an increase of 4.7%

-
Total loans of $1.2 billion compared to $1.1 billion, an increase of 8.5%

-
PPE of $9.5 million compared to $8.6 million, an increase of 12.3%

-
Total interest income of $16.7 million compared to $14.9 million, an increase of 11.7%

Both the Bank’s and the Company’s capital levels continue to be significantly above the minimum levels required to be designated as “well-capitalized” for regulatory purposes.  On June 30, 2022, the Bank’s Tier 1 leverage ratio, Tier 1 risk based capital ratio, and total risk-based capital ratios were 8.97%, 11.21%, and 12.14%, respectively.  On June 30, 2022, on a consolidated basis, the Company’s Tier 1 leverage ratio, Tier 1 risk based capital ratio, and total risk-based capital ratios were 8.97%, 11.20%, and 12.14%, respectively.  Designation as a well-capitalized institution under regulations does not constitute a recommendation or endorsement by bank regulators.


Bank7 Corp.
Consolidated Balance Sheets

Assets
 
June 30, 2022
(unaudited)
   
December 31, 2021
 
             
Cash and due from banks
 
$
123,686
   
$
195,359
 
Federal funds sold
   
-
     
9,493
 
Cash and cash equivalents
   
123,686
     
204,852
 
Interest-bearing time deposits in other banks
   
1,992
     
3,237
 
Available-for-sale debt securities
   
185,048
     
84,808
 
Loans, net of allowance for loan losses of $10,819 and $10,316 at June 30, 2022 and December 31, 2021, respectively
   
1,141,497
     
1,018,085
 
Loans held for sale, at fair value
   
635
     
464
 
Premises and equipment, net
   
13,581
     
17,257
 
Nonmarketable equity securities
   
1,192
     
1,202
 
Core deposit intangibles
   
1,489
     
1,643
 
Goodwill
   
8,717
     
8,479
 
Interest receivable and other assets
   
9,983
     
10,522
 
                 
Total assets
 
$
1,487,820
   
$
1,350,549
 
                 
Liabilities and Shareholders’ Equity
               
                 
Deposits
               
Noninterest-bearing
 
$
442,150
   
$
366,705
 
Interest-bearing
   
903,627
     
850,766
 
                 
Total deposits
   
1,345,777
     
1,217,471
 
                 
Income taxes payable
   
2,865
     
-
 
Interest payable and other liabilities
   
7,687
     
5,670
 
                 
Total liabilities
   
1,356,329
     
1,223,141
 
                 
Shareholders’ equity
               
Common stock, $0.01 par value; 50,000,000 shares authorized; shares issued and outstanding: 9,098,655 and 9,071,417 at June 30, 2022 and December 31, 2021 respectively
   
91
     
91
 
Additional paid-in capital
   
95,016
     
94,024
 
Retained earnings
   
44,167
     
33,149
 
Accumulated other comprehensive income (loss)
   
(7,783
)
   
144
 
                 
Total shareholders’ equity
   
131,491
     
127,408


Total liabilities and shareholders’ equity
 
$
1,487,820
   
$
1,350,549


Three months ended
June 30,
   
Six months ended
June 30,
 
   
2022
   
2021
   
2022
   
2021
 
Interest Income
                       
Loans, including fees
 
$
15,754
   
$
14,357
   
$
30,131
   
$
27,450
 
Interest-bearing time deposits in other banks
   
13
     
38
     
29
     
106
 
Debt securities, taxable
   
571
     
-
     
935
     
-
 
Debt securities, tax-exempt
   
85
     
-
     
183
     
-
 
Other interest and dividend income
   
249
     
42
     
319
     
68
 
                                 
Total interest income
   
16,672
     
14,437
     
31,597
     
27,624
 
                                 
Interest Expense
                               
Deposits
   
878
     
772
     
1,595
     
1,647


Total interest expense
   
878
     
772
     
1,595
     
1,647
 
                                 
Net Interest Income
   
15,794
     
13,665
     
30,002
     
25,977
 
                                 
Provision for Loan Losses
   
219
     
1,300
     
495
     
2,575
 
                                 
Net Interest Income After Provision for Loan Losses
   
15,575
     
12,365
     
29,507
     
23,402
 
                                 
Noninterest Income
                               
Secondary market income
   
95
     
78
     
261
     
92
 
Gain (Loss) on sales of available-for-sale debt securities (includes accumulated other comprehensive loss reclassification of $10,000 and ($117,000) for the three months ended June 30, 2022 and 2021, respectively; $10,000 and $0 for the six months ended June 30, 2022 and 2021, respectively)
   
10
     
-
     
(117
)
   
-
 
Service charges on deposit accounts
   
219
     
119
     
468
     
239
 
Other
   
361
     
382
     
748
     
585


Total noninterest income
   
685
     
579
     
1,360
     
916
 
                                 
Noninterest Expense
                               
Salaries and employee benefits
   
4,126
     
2,949
     
8,152
     
5,739
 
Furniture and equipment
   
386
     
231
     
744
     
433
 
Occupancy
   
571
     
458
     
1,122
     
930
 
Data and item processing
   
559
     
286
     
946
     
565
 
Accounting, marketing and legal fees
   
209
     
149
     
442
     
297
 
Regulatory assessments
   
226
     
161
     
422
     
302
 
Advertsing and public relations
   
121
     
71
     
231
     
105
 
Travel, lodging and entertainment
   
74
     
118
     
122
     
207
 
Other
   
691
     
452
     
1,202
     
841
 
                                 
Total noninterest expense
   
6,963
     
4,875
     
13,383
     
9,419
 
                                 
Income Before Taxes
   
9,297
     
8,069
     
17,484
     
14,899
 
Income tax expense
   
2,280
     
1,964
     
4,283
     
3,690
 
Net Income
 
$
7,017
   
$
6,105
   
$
13,201
   
$
11,209
 
                                 
Earnings per common share - basic
 
$
0.77
   
$
0.67
   
$
1.45
   
$
1.24
 
Earnings per common share - diluted
   
0.76
     
0.67
     
1.44
     
1.24
 
Weighted average common shares outstanding - basic
   
9,097,280
     
9,050,606
     
9,093,150
     
9,050,295
 
Weighted average common shares outstanding - diluted
   
9,194,923
     
9,074,408
     
9,187,637
     
9,066,797


Other Comprehensive Income (Loss)
                               
Unrealized losses on securities, net of tax benefit of $1.5 million
 
$
(3,788
)
 
$
-
   
$
(7,783
)
 
$
-
 
Reclassification adjustment for realized gain(loss) included in net income, net of tax of $17,000
   
10
     
-
     
(134
)
   
-
 
Other comprehensive loss, net of tax benefit of $1.5 million
 
$
(3,778
)
 
$
-
   
$
(7,917
)
 
$
-
 
Comprehensive Income (Loss)
 
$
3,239
   
$
6,105
   
$
5,284
   
$
11,209


Net Interest Margin
   
For the Six Months Ended June 30,
   
2022
   
2021
 
   
Average
Balance
   
Interest
Income/
Expense
   
Average
Yield/
Rate
   
Average
Balance
   
Interest
Income/
Expense
   
Average
Yield/
Rate
 
   
(Dollars in thousands)
 
Interest-Earning Assets:
                                   
Short-term investments
 
$
159,157
   
$
330
     
0.42
%
 
$
127,203
   
$
157
     
0.25
%
Investment securities, taxable
   
132,298
     
948
     
1.45
     
1,180
     
17
     
2.91
 
Debt securities, tax exempt
   
22,275
     
188
     
1.70
     
-
     
-
     
-
 
Loans held for sale
   
383
     
-
     
-
     
445
     
-
     
-
 
Total loans(1)
   
1,047,220
     
30,131
     
5.80
     
868,526
     
27,450
     
6.37
 
Total interest-earning assets
   
1,361,333
     
31,597
     
4.68
     
997,354
     
27,624
     
5.59
 
Noninterest-earning assets
   
24,506
                     
6,090
                 
Total assets
 
$
1,385,839
                   
$
1,003,444
                 
                                                 
Funding sources:
                                               
Interest-bearing liabilities:
                                               
Deposits:
                                               
Transaction accounts
 
$
667,159
     
1,012
     
0.31
%
 
$
412,070
     
691
     
0.34
%
Time deposits
   
176,587
     
583
     
0.67
     
208,903
     
956
     
0.92
 
Total interest-bearing deposits
   
843,746
     
1,595
     
0.38
     
620,973
     
1,647
     
0.53
 
Total interest-bearing liabilities
   
843,746
     
1,595
     
0.38
     
620,973
     
1,647
     
0.53
 
                                                 
Noninterest-bearing liabilities:
                                               
Noninterest-bearing deposits
   
405,674
                     
266,237
                 
Other noninterest-bearing liabilities
   
6,615
                     
5,126
                 
Total noninterest-bearing liabilities
   
412,289
                     
271,363
                 
Shareholders' equity
   
129,804
                     
111,108
                 
Total liabilities and shareholders' equity
 
$
1,385,839
                   
$
1,003,444
                 
                                                 
Net interest income
         
$
30,002
                   
$
25,977
         
Net interest spread
                   
4.30
%
                   
5.05
%
Net interest margin
                   
4.44
%
                   
5.25
%

(1)
Nonaccrual loans are included in total loans


For the Three Months Ended June 30,
 
   
2022
   
2021
 
   
Average
Balance
   
Interest
Income/
Expense
   
Average
Yield/
Rate
   
Average
Balance
   
Interest
Income/
Expense
   
Average
Yield/
Rate
 
   
(Dollars in thousands)
 
Interest-Earning Assets:
                                   
Short-term investments
 
$
130,961
   
$
249
     
0.76
%
 
$
128,643
   
$
64
     
0.20
%
Debt securities, taxable-equivalent
   
174,583
     
584
     
1.34
     
1,187
     
16
     
5.41
 
Debt securities, tax exempt
   
22,244
     
85
     
1.53
     
-
     
-
     
-
 
Loans held for sale
   
279
     
-
     
-
     
557
     
-
     
-
 
Total loans(1)
   
1,090,053
     
15,754
     
5.80
     
889,278
     
14,357
     
6.48
 
Total interest-earning assets
   
1,418,120
     
16,672
     
4.72
     
1,019,665
     
14,437
     
5.68
 
Noninterest-earning assets
   
25,341
                     
5,086
                 
Total assets
 
$
1,443,461
                   
$
1,024,751
                 
                                                 
Funding sources:
                                               
Interest-bearing liabilities:
                                               
Deposits:
                                               
Transaction accounts
 
$
693,619
     
555
     
0.32
%
 
$
399,293
     
329
     
0.33
%
Time deposits
   
183,494
     
323
     
0.71
     
212,212
     
443
     
0.84
 
Total interest-bearing deposits
   
877,113
     
878
     
0.40
     
611,505
     
772
     
0.51
 
Total interest-bearing liabilities
 
$
877,113
     
878
     
0.40
   
$
611,505
     
772
     
0.51
 
                                                 
Noninterest-bearing liabilities:
                                               
Noninterest-bearing deposits
 
$
429,388
                   
$
293,867
                 
Other noninterest-bearing liabilities
   
6,925
                     
6,047
                 
Total noninterest-bearing liabilities
   
436,313
                     
299,914
                 
Shareholders' equity
   
130,035
                     
113,332
                 
Total liabilities and shareholders' equity
 
$
1,443,461
                   
$
1,024,751
                 
                                                 
Net interest income
         
$
15,794
                   
$
13,665
         
Net interest spread
                   
4.31
%
                   
5.17
%
Net interest margin
                   
4.47
%
                   
5.38
%

(1)
Nonaccrual loans are included in total loans


About Bank7 Corp.

We are Bank7 Corp., a bank holding company headquartered in Oklahoma City, Oklahoma. Through our wholly-owned subsidiary, Bank7, we operate twelve locations in Oklahoma, the Dallas/Fort Worth, Texas metropolitan area and Kansas. We are focused on serving business owners and entrepreneurs by delivering fast, consistent and well-designed loan and deposit products to meet their financing needs. We intend to grow organically by selectively opening additional branches in our target markets as well as pursue strategic acquisitions.

Conference Call

Bank7 Corp. has scheduled a conference call to discuss its first quarter results, which will be broadcast live over the Internet, on Wednesday, July 27, 2022 at 10:00 a.m. central standard time. To participate in the call, dial 1-888-348-6421, or access it live over the Internet at https://app.webinar.net/lO0ZkVNkM4w. For those not able to participate in the live call, an archive of the webcast will be available at https://app.webinar.net/lO0ZkVNkM4w shortly after the call for 1 year.

Cautionary Statements Regarding Forward-Looking Information

This communication contains a number of forward-looking statements. These forward-looking statements reflect Bank7 Corp.’s current views with respect to, among other things, future events and Bank7 Corp.’s financial performance. Any statements about Bank7 Corp.’s expectations, beliefs, plans, predictions, forecasts, objectives, assumptions or future events or performance are not historical facts and may be forward-looking. These statements are often, but not always, made through the use of words or phrases such as “anticipate,” “believes,” “can,” “could,” “may,” “predicts,” “potential,” “should,” “will,” “estimate,” “plans,” “projects,” “continuing,” “ongoing,” “expects,” “intends” and similar words or phrases. Any or all of the forward-looking statements in (or conveyed orally regarding) this presentation may turn out to be inaccurate. The inclusion of or reference to forward-looking information in this presentation should not be regarded as a representation by Bank7 Corp. or any other person that the future plans, estimates or expectations contemplated by Bank7 Corp. will be achieved.

These forward-looking statements are subject to significant uncertainties because they are based upon:  the amount and timing of future changes in interest rates, market behavior, and other economic conditions; future laws, regulations, and accounting principles; changes in regulatory standards and examination policies, and a variety of other matters.  These other matters include, among other things, the impact of COVID-19 on the United States economy and our operations, the direct and indirect effect of economic conditions on interest rates, credit quality, loan demand, liquidity, and monetary and supervisory policies of banking regulators.  Bank7 Corp. has based these forward-looking statements largely on its current expectations and projections about future events and financial trends that Bank7 Corp. believes may affect its financial condition, results of operations, business strategy and financial needs. Bank7 Corp.’s actual results could differ materially from those anticipated in such forward-looking statements as a result of risks, uncertainties and assumptions that are difficult to predict. If one or more events related to these or other risks or uncertainties materialize, or if Bank7 Corp.’s underlying assumptions prove to be incorrect, actual results may differ materially from what Bank7 Corp. anticipates. You are cautioned not to place undue reliance on forward-looking statements. Further, any forward-looking statement speaks only as of the date on which it is made and Bank7 Corp. undertakes no obligation to update or revise any forward-looking statement to reflect events or circumstances after the date on which the statement is made or to reflect the occurrence of unanticipated events, except as may be required by law. All forward-looking statements herein are qualified by these cautionary statements.

Contact:
 
Thomas Travis
President & CEO
(405) 810-8600


Exhibit 99.2

 BSVN  Q2 2022  EARNINGS RELEASE  July 27, 2022 
 

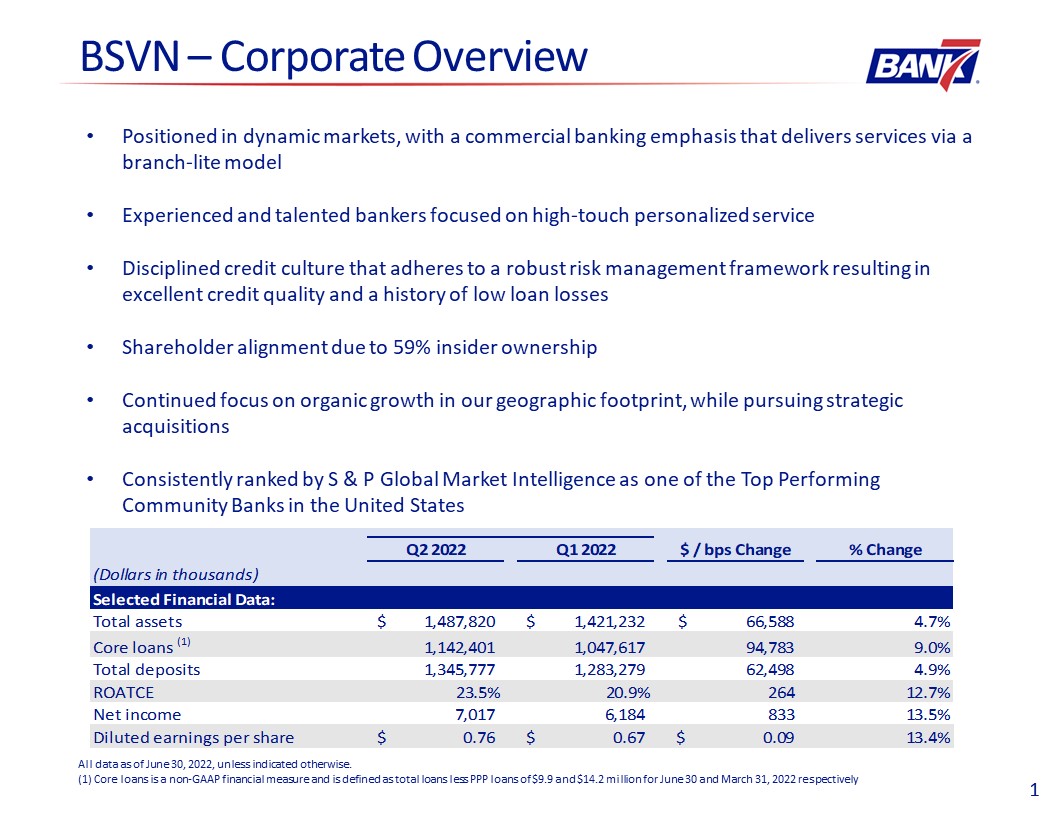
 1  BSVN – Corporate Overview  All data as of June 30, 2022, unless indicated otherwise.  (1) Core loans is a non-GAAP financial measure and is defined as total loans less PPP loans of $9.9 and $14.2 million for June 30 and March 31, 2022 respectively  Positioned in dynamic markets, with a commercial banking emphasis that delivers services via a branch-lite model  Experienced and talented bankers focused on high-touch personalized service  Disciplined credit culture that adheres to a robust risk management framework resulting in excellent credit quality and a history of low loan losses  Shareholder alignment due to 59% insider ownership   Continued focus on organic growth in our geographic footprint, while pursuing strategic acquisitions  Consistently ranked by S & P Global Market Intelligence as one of the Top Performing Community Banks in the United States 
 

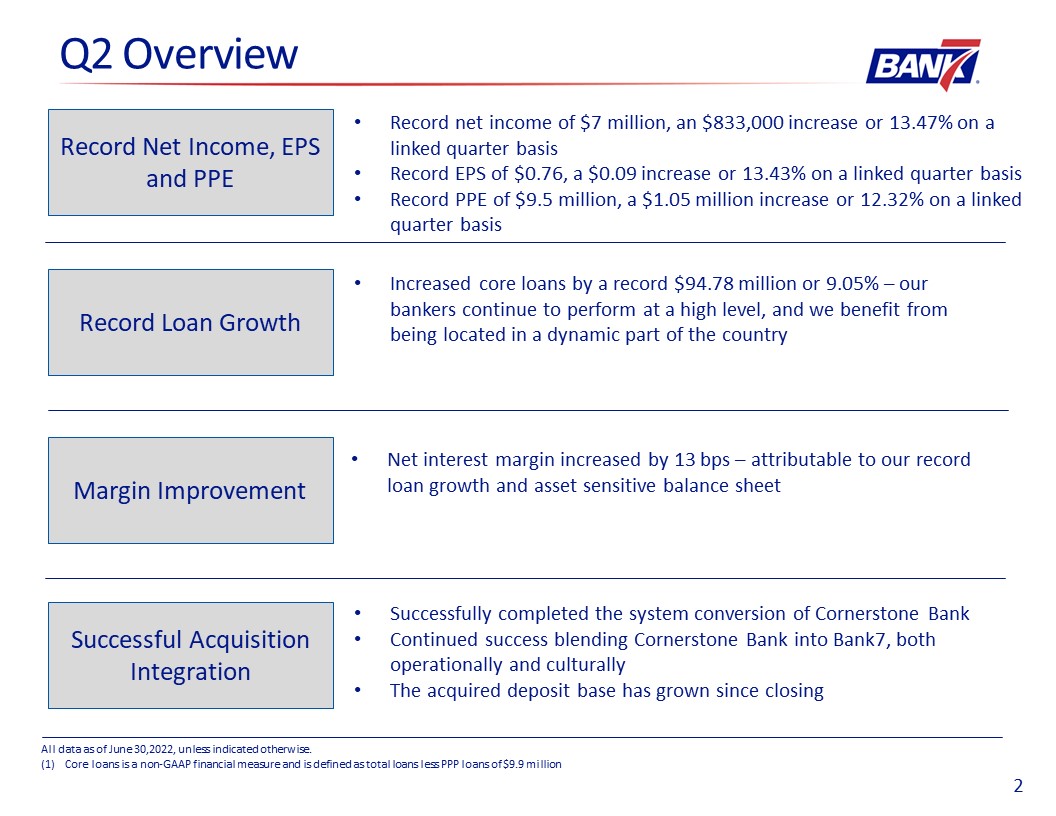
 2  Q2 Overview  All data as of June 30,2022, unless indicated otherwise.  Core loans is a non-GAAP financial measure and is defined as total loans less PPP loans of $9.9 million  Record Loan Growth  Increased core loans by a record $94.78 million or 9.05% – our bankers continue to perform at a high level, and we benefit from being located in a dynamic part of the country   Margin Improvement  Net interest margin increased by 13 bps – attributable to our record loan growth and asset sensitive balance sheet  Successful Acquisition Integration  Record Net Income, EPS and PPE  Successfully completed the system conversion of Cornerstone Bank  Continued success blending Cornerstone Bank into Bank7, both operationally and culturally  The acquired deposit base has grown since closing  Record net income of $7 million, an $833,000 increase or 13.47% on a linked quarter basis  Record EPS of $0.76, a $0.09 increase or 13.43% on a linked quarter basis  Record PPE of $9.5 million, a $1.05 million increase or 12.32% on a linked quarter basis 
 

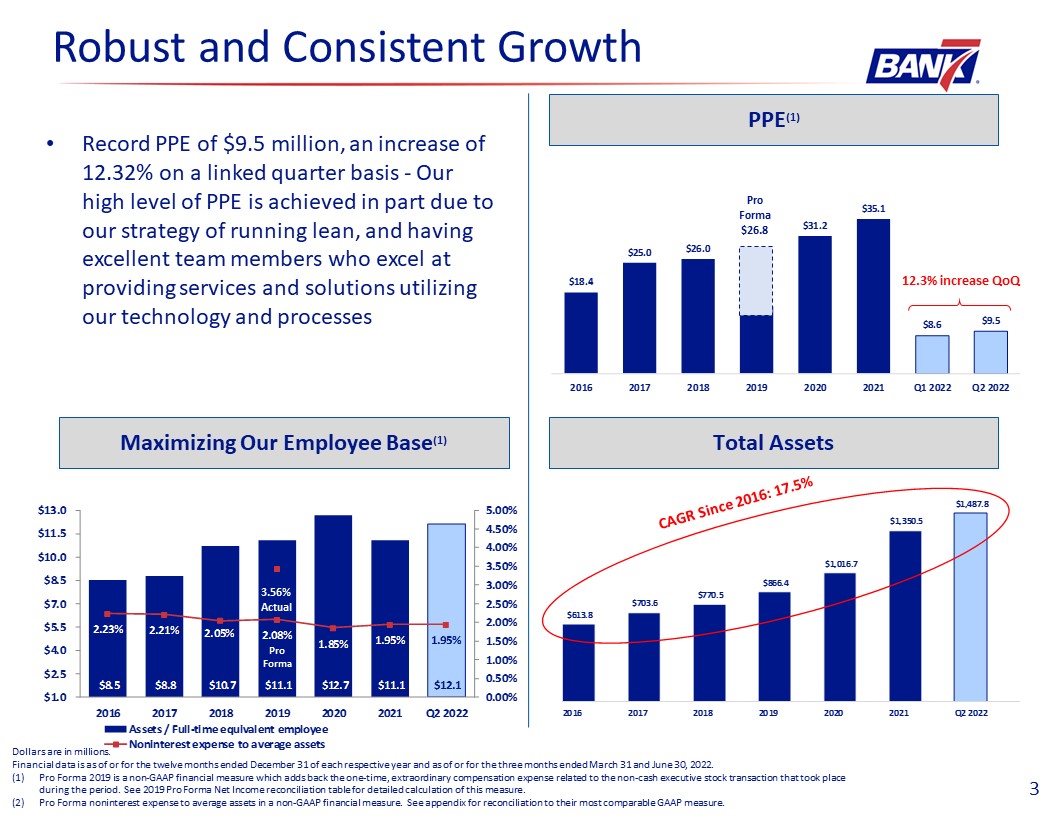
 Dollars are in millions.   Financial data is as of or for the twelve months ended December 31 of each respective year and as of or for the three months ended March 31 and June 30, 2022.  Pro Forma 2019 is a non-GAAP financial measure which adds back the one-time, extraordinary compensation expense related to the non-cash executive stock transaction that took place during the period. See 2019 Pro Forma Net Income reconciliation table for detailed calculation of this measure.  Pro Forma noninterest expense to average assets in a non-GAAP financial measure. See appendix for reconciliation to their most comparable GAAP measure.  12.3% increase QoQ  Robust and Consistent Growth  PPE(1)  Total Assets  3  $26.8  Pro Forma  Record PPE of $9.5 million, an increase of 12.32% on a linked quarter basis - Our high level of PPE is achieved in part due to our strategy of running lean, and having excellent team members who excel at providing services and solutions utilizing our technology and processes  Maximizing Our Employee Base(1)   3.56%  Actual  Pro Forma  CAGR Since 2016: 17.5% 
 

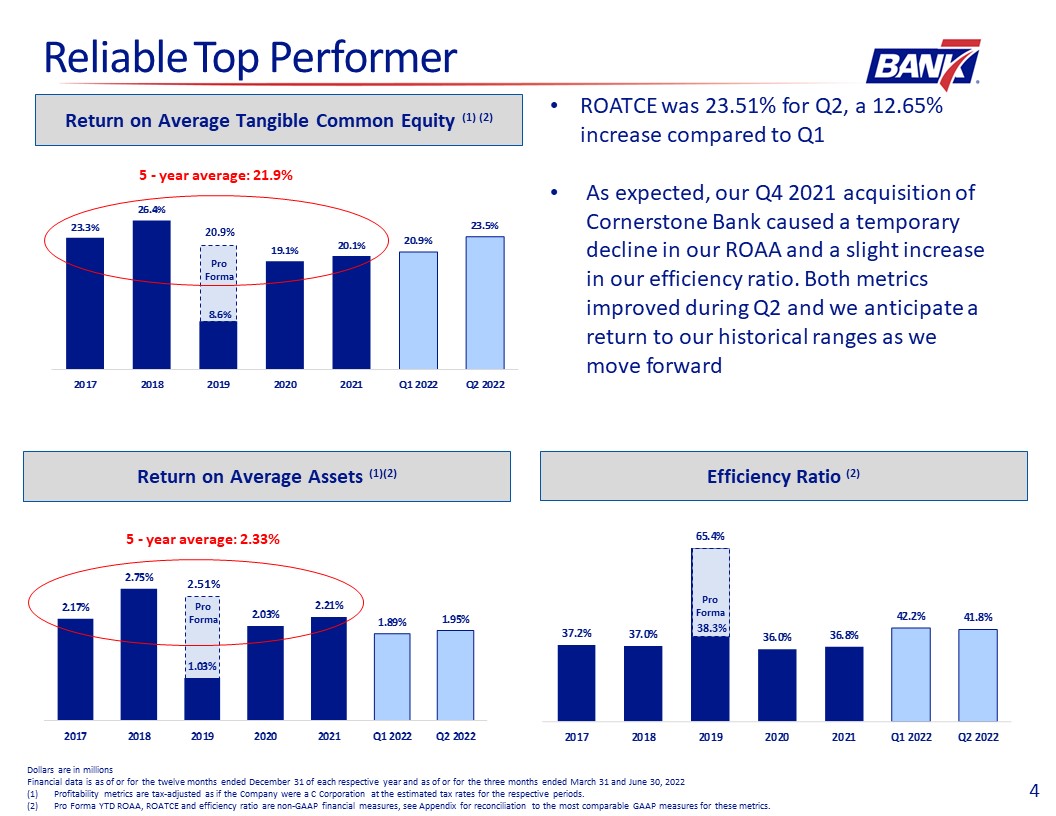
 2.51%  Pro Forma  Pro Forma  Reliable Top Performer  Return on Average Assets (1)(2)  Return on Average Tangible Common Equity (1) (2)  Dollars are in millions  Financial data is as of or for the twelve months ended December 31 of each respective year and as of or for the three months ended March 31 and June 30, 2022  Profitability metrics are tax-adjusted as if the Company were a C Corporation at the estimated tax rates for the respective periods.   Pro Forma YTD ROAA, ROATCE and efficiency ratio are non-GAAP financial measures, see Appendix for reconciliation to the most comparable GAAP measures for these metrics.  Efficiency Ratio (2)  ROATCE was 23.51% for Q2, a 12.65% increase compared to Q1  As expected, our Q4 2021 acquisition of Cornerstone Bank caused a temporary decline in our ROAA and a slight increase in our efficiency ratio. Both metrics improved during Q2 and we anticipate a return to our historical ranges as we move forward  4  38.3%  20.9%  Pro Forma  5 - year average: 21.9%  5 - year average: 2.33% 
 

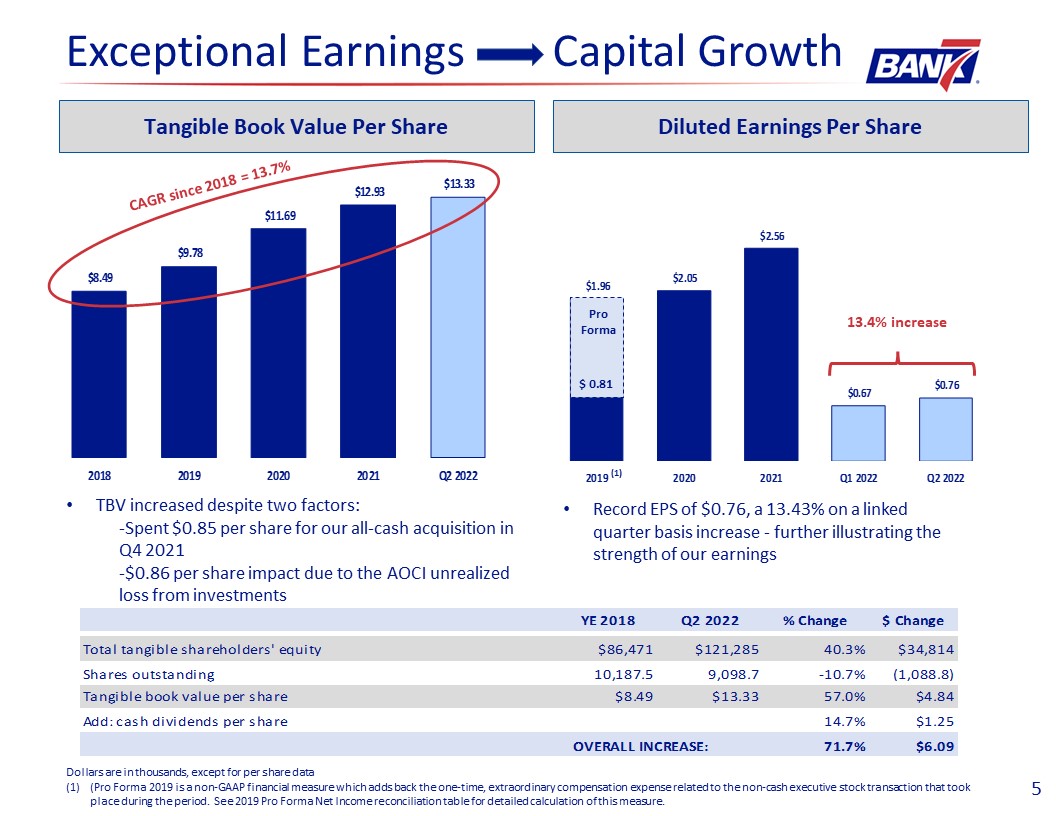
 5  Exceptional Earnings Capital Growth  Tangible Book Value Per Share  Dollars are in thousands, except for per share data   (Pro Forma 2019 is a non-GAAP financial measure which adds back the one-time, extraordinary compensation expense related to the non-cash executive stock transaction that took place during the period. See 2019 Pro Forma Net Income reconciliation table for detailed calculation of this measure.  CAGR since 2018 = 13.7%  Diluted Earnings Per Share  (1)  Pro Forma  13.4% increase  TBV increased despite two factors:  -Spent $0.85 per share for our all-cash acquisition in Q4 2021  -$0.86 per share impact due to the AOCI unrealized loss from investments  $ 0.81  Record EPS of $0.76, a 13.43% on a linked quarter basis increase - further illustrating the strength of our earnings 
 

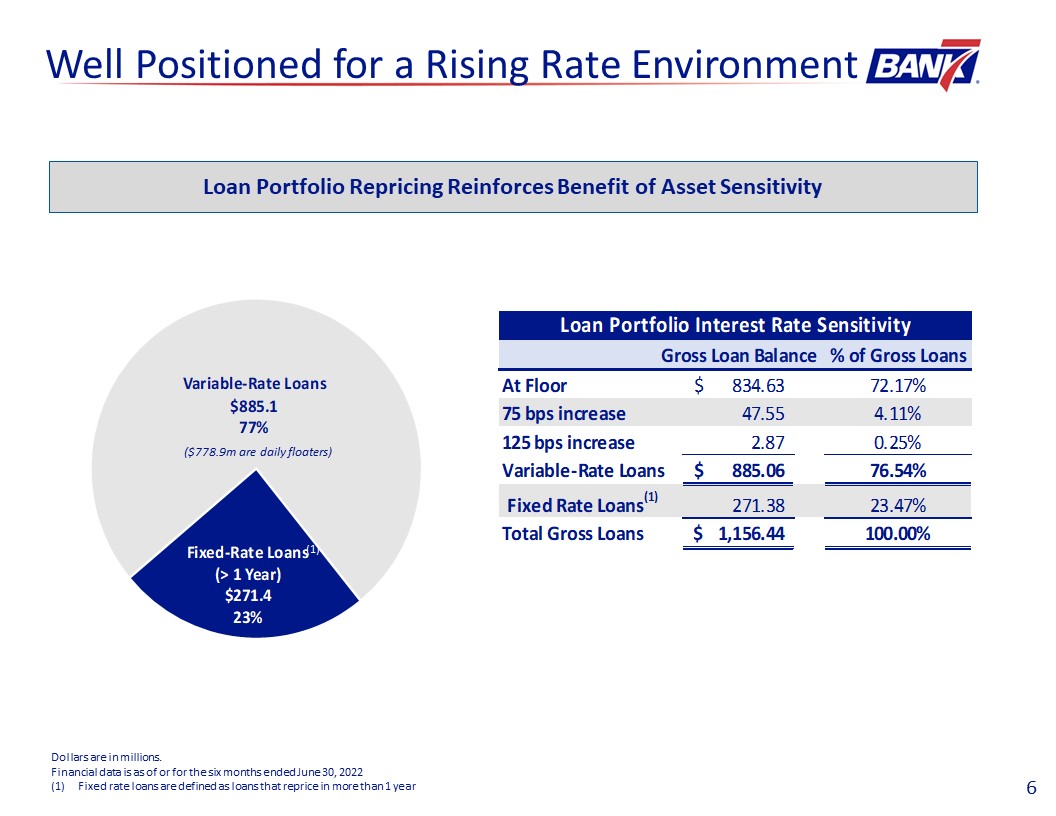
 Well Positioned for a Rising Rate Environment  Loan Portfolio Repricing Reinforces Benefit of Asset Sensitivity  Dollars are in millions.  Financial data is as of or for the six months ended June 30, 2022  Fixed rate loans are defined as loans that reprice in more than 1 year   6  (1)  ($778.9m are daily floaters) 
 

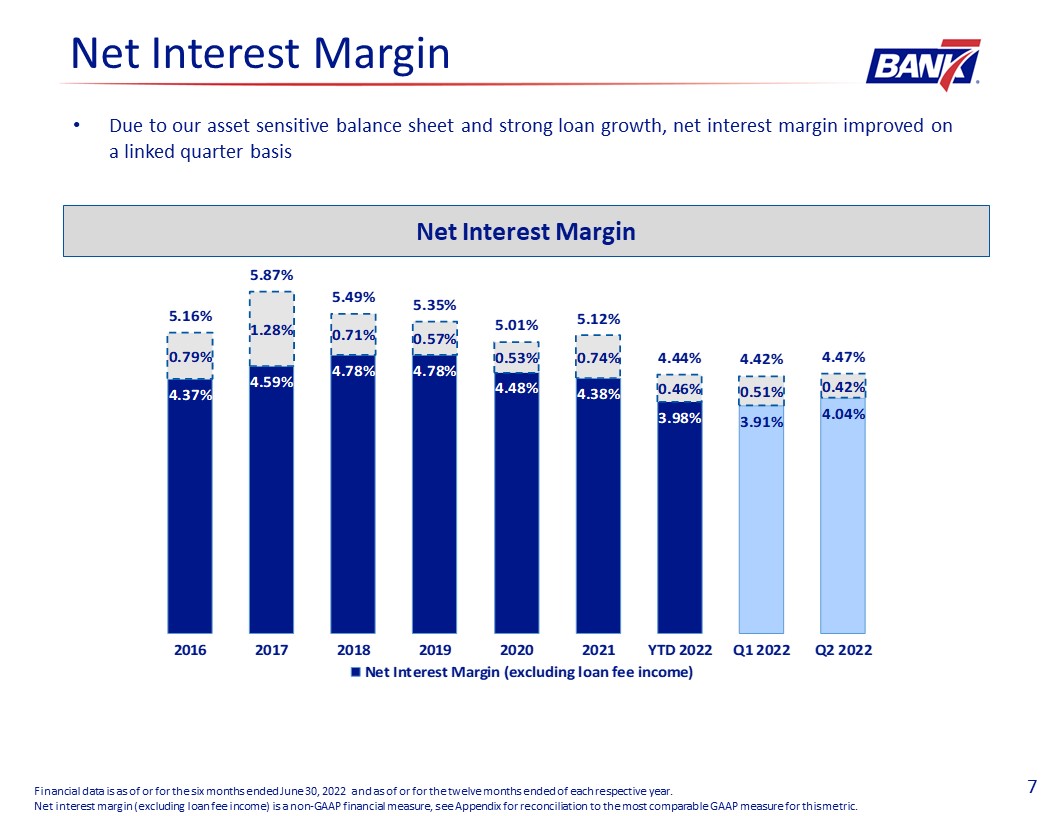
 Net Interest Margin  Financial data is as of or for the six months ended June 30, 2022 and as of or for the twelve months ended of each respective year.  Net interest margin (excluding loan fee income) is a non-GAAP financial measure, see Appendix for reconciliation to the most comparable GAAP measure for this metric.  Net Interest Margin  Due to our asset sensitive balance sheet and strong loan growth, net interest margin improved on a linked quarter basis  7 
 

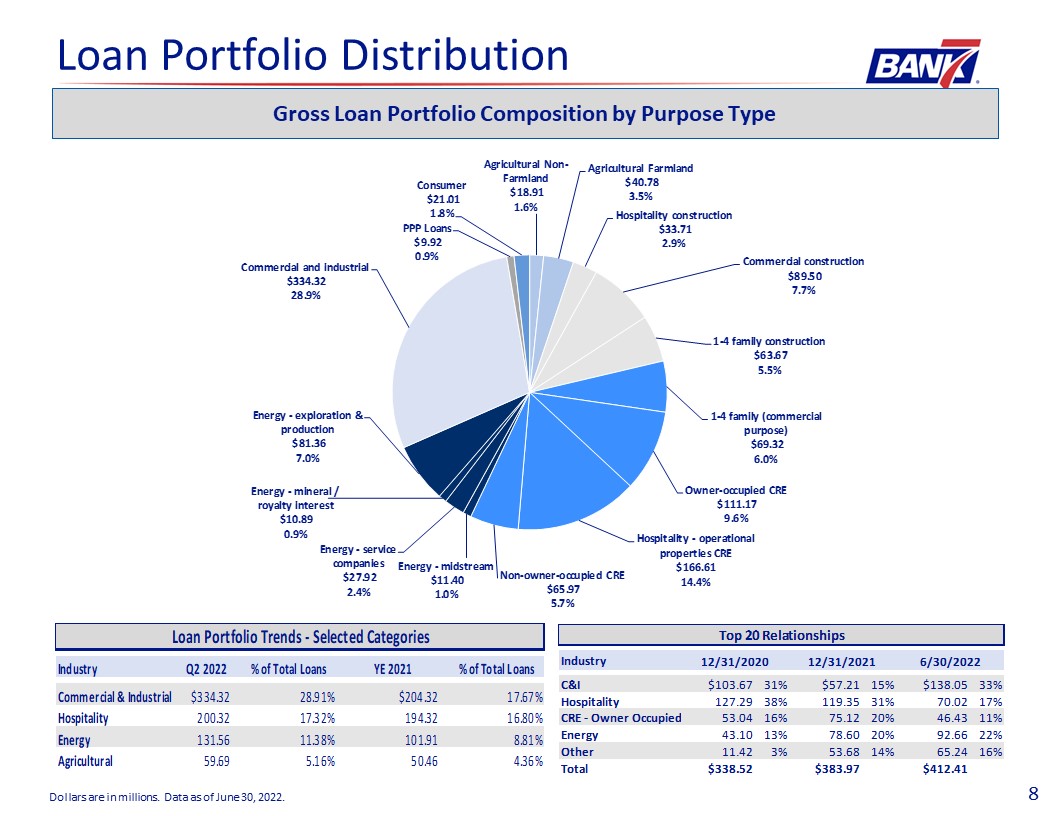
 Loan Portfolio Distribution  Dollars are in millions. Data as of June 30, 2022.  Gross Loan Portfolio Composition by Purpose Type  8 
 

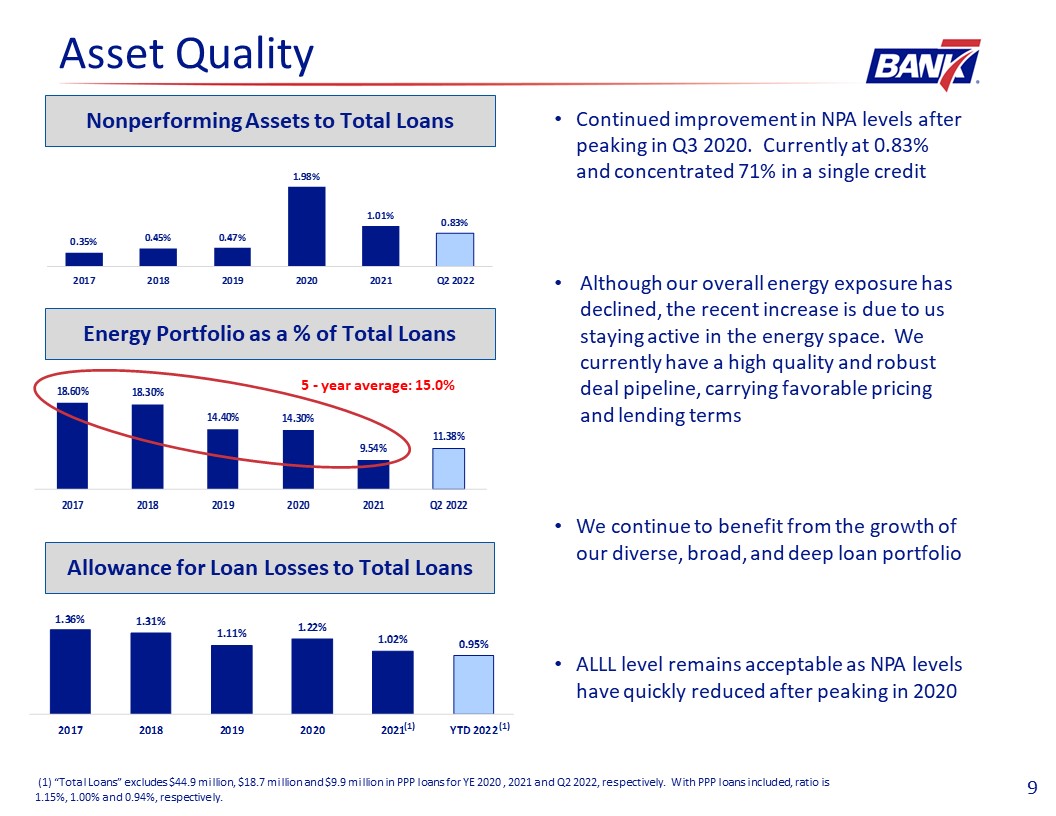
 9  Allowance for Loan Losses to Total Loans  Asset Quality   (1) “Total Loans” excludes $44.9 million, $18.7 million and $9.9 million in PPP loans for YE 2020 , 2021 and Q2 2022, respectively. With PPP loans included, ratio is 1.15%, 1.00% and 0.94%, respectively.   Energy Portfolio as a % of Total Loans  (1)  Nonperforming Assets to Total Loans  Continued improvement in NPA levels after peaking in Q3 2020. Currently at 0.83% and concentrated 71% in a single credit   Although our overall energy exposure has declined, the recent increase is due to us staying active in the energy space. We currently have a high quality and robust deal pipeline, carrying favorable pricing and lending terms  We continue to benefit from the growth of our diverse, broad, and deep loan portfolio   ALLL level remains acceptable as NPA levels have quickly reduced after peaking in 2020  5 - year average: 15.0%  (1) 
 

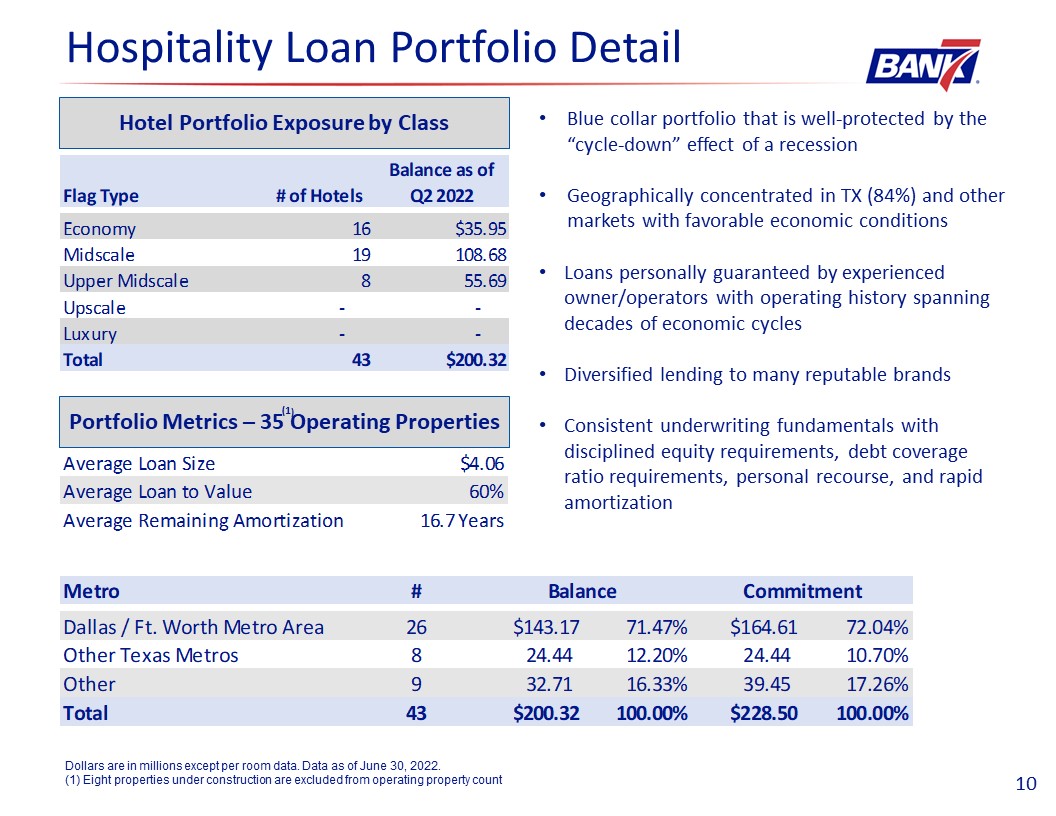
 Hospitality Loan Portfolio Detail  10  Dollars are in millions except per room data. Data as of June 30, 2022.  (1) Eight properties under construction are excluded from operating property count  Hotel Portfolio Exposure by Class  Portfolio Metrics – 35 Operating Properties  Blue collar portfolio that is well-protected by the “cycle-down” effect of a recession   Geographically concentrated in TX (84%) and other markets with favorable economic conditions  Loans personally guaranteed by experienced owner/operators with operating history spanning decades of economic cycles  Diversified lending to many reputable brands  Consistent underwriting fundamentals with disciplined equity requirements, debt coverage ratio requirements, personal recourse, and rapid amortization  (1) 
 

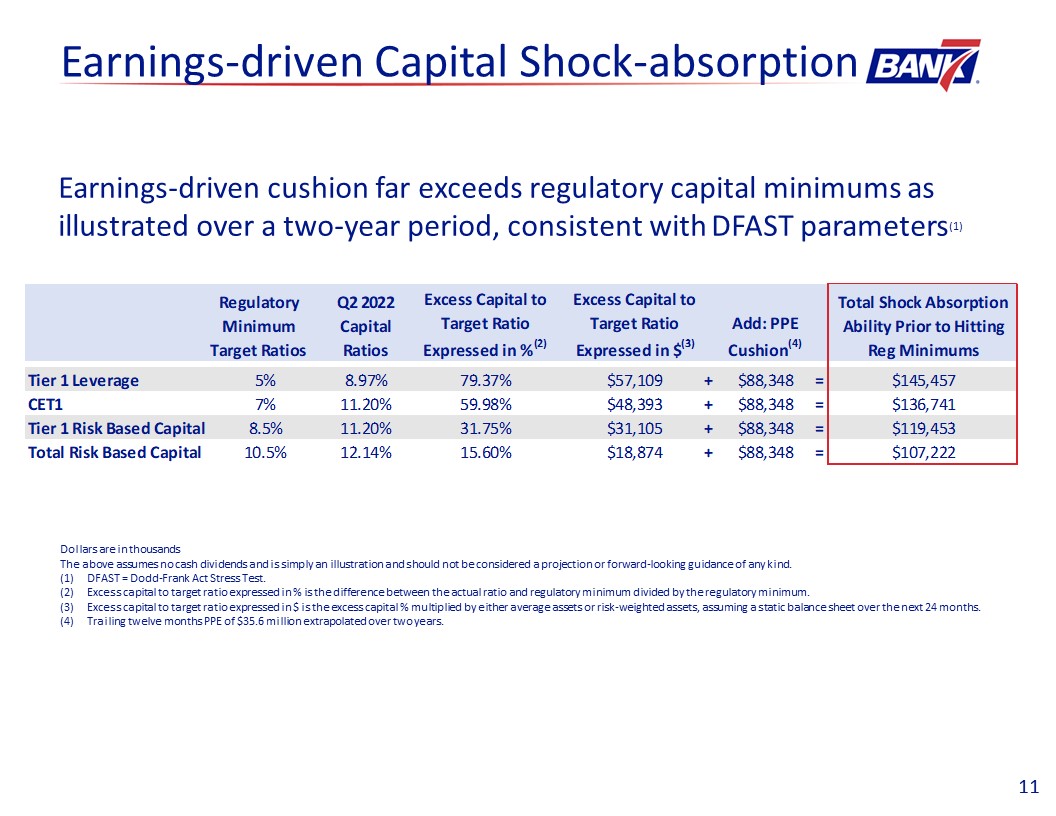
 11  Earnings-driven cushion far exceeds regulatory capital minimums as illustrated over a two-year period, consistent with DFAST parameters(1)  Dollars are in thousands  The above assumes no cash dividends and is simply an illustration and should not be considered a projection or forward-looking guidance of any kind.   DFAST = Dodd-Frank Act Stress Test.  Excess capital to target ratio expressed in % is the difference between the actual ratio and regulatory minimum divided by the regulatory minimum.  Excess capital to target ratio expressed in $ is the excess capital % multiplied by either average assets or risk-weighted assets, assuming a static balance sheet over the next 24 months.   Trailing twelve months PPE of $35.6 million extrapolated over two years.   Earnings-driven Capital Shock-absorption 
 

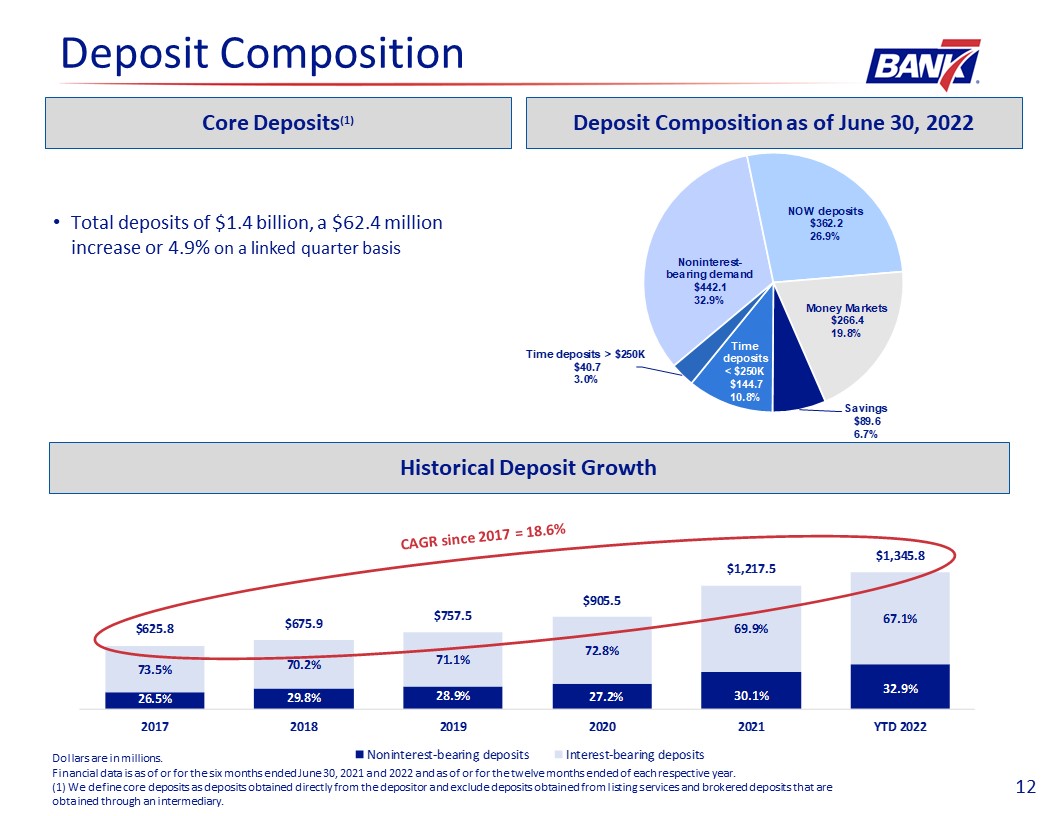
 Deposit Composition  Historical Deposit Growth  Deposit Composition as of June 30, 2022  Total deposits of $1.4 billion, a $62.4 million increase or 4.9% on a linked quarter basis  Dollars are in millions.  Financial data is as of or for the six months ended June 30, 2021 and 2022 and as of or for the twelve months ended of each respective year.  (1) We define core deposits as deposits obtained directly from the depositor and exclude deposits obtained from listing services and brokered deposits that are obtained through an intermediary.  Core Deposits(1)  12  CAGR since 2017 = 18.6% 
 

 Appendix 
 

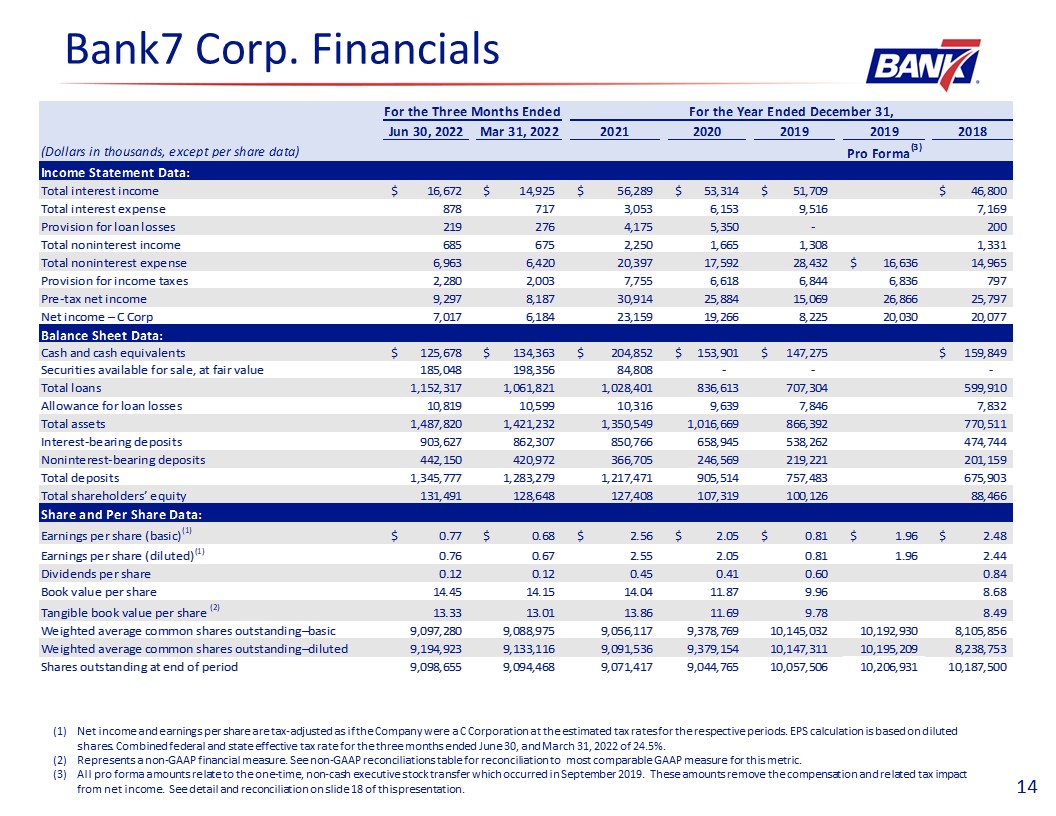
 14  Bank7 Corp. Financials  Net income and earnings per share are tax-adjusted as if the Company were a C Corporation at the estimated tax rates for the respective periods. EPS calculation is based on diluted shares. Combined federal and state effective tax rate for the three months ended June 30, and March 31, 2022 of 24.5%.  Represents a non-GAAP financial measure. See non-GAAP reconciliations table for reconciliation to most comparable GAAP measure for this metric.   All pro forma amounts relate to the one-time, non-cash executive stock transfer which occurred in September 2019. These amounts remove the compensation and related tax impact from net income. See detail and reconciliation on slide 18 of this presentation. 
 

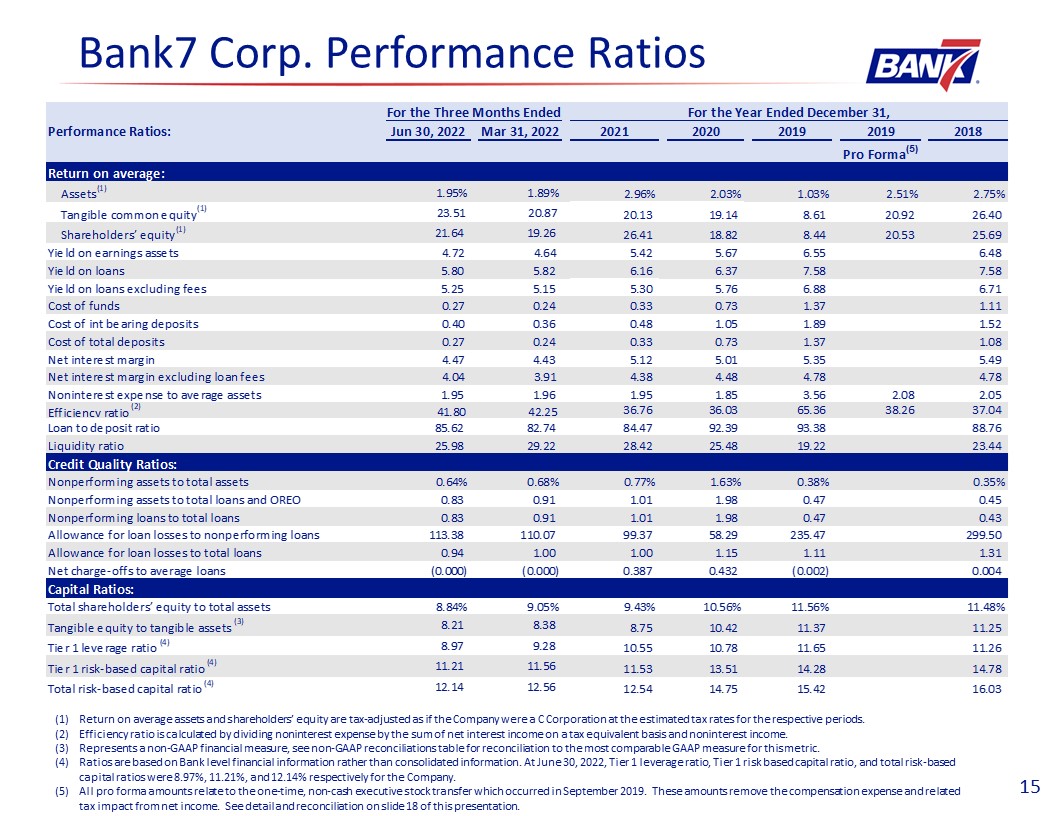
 15  Bank7 Corp. Performance Ratios  Return on average assets and shareholders’ equity are tax-adjusted as if the Company were a C Corporation at the estimated tax rates for the respective periods.  Efficiency ratio is calculated by dividing noninterest expense by the sum of net interest income on a tax equivalent basis and noninterest income.     Represents a non-GAAP financial measure, see non-GAAP reconciliations table for reconciliation to the most comparable GAAP measure for this metric.   Ratios are based on Bank level financial information rather than consolidated information. At June 30, 2022, Tier 1 leverage ratio, Tier 1 risk based capital ratio, and total risk-based capital ratios were 8.97%, 11.21%, and 12.14% respectively for the Company.  All pro forma amounts relate to the one-time, non-cash executive stock transfer which occurred in September 2019. These amounts remove the compensation expense and related tax impact from net income. See detail and reconciliation on slide 18 of this presentation. 
 

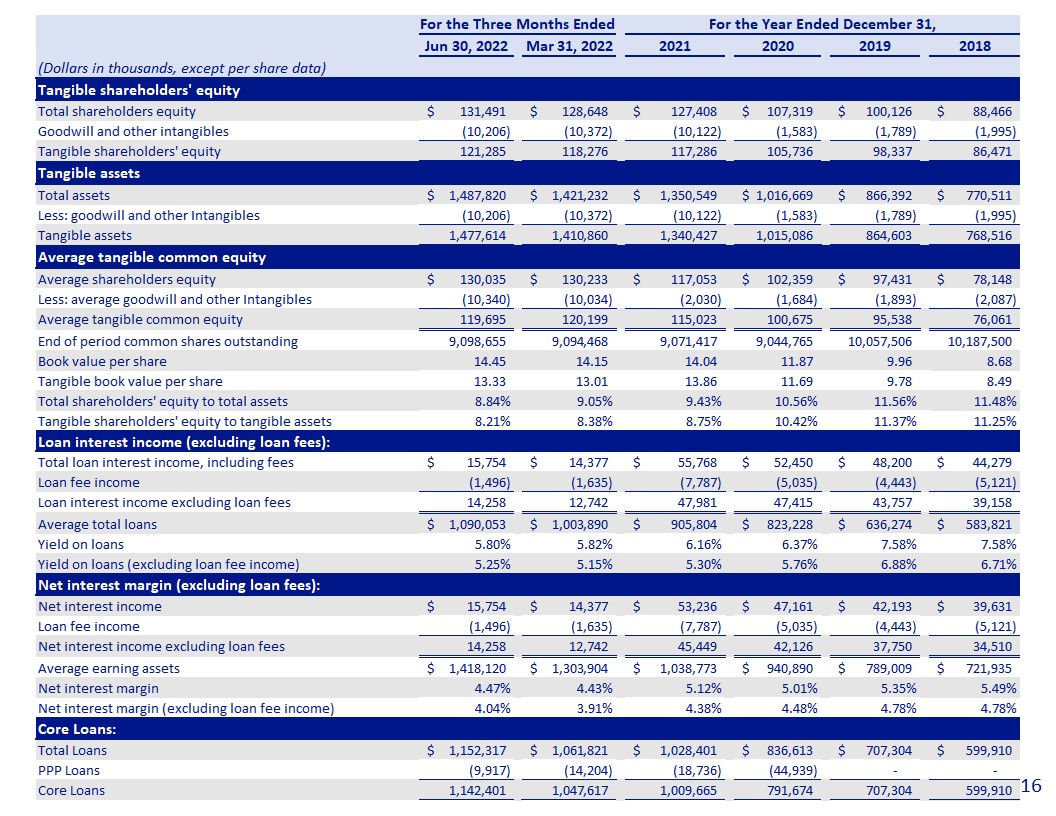
 16  Non-GAAP Reconciliations 
 

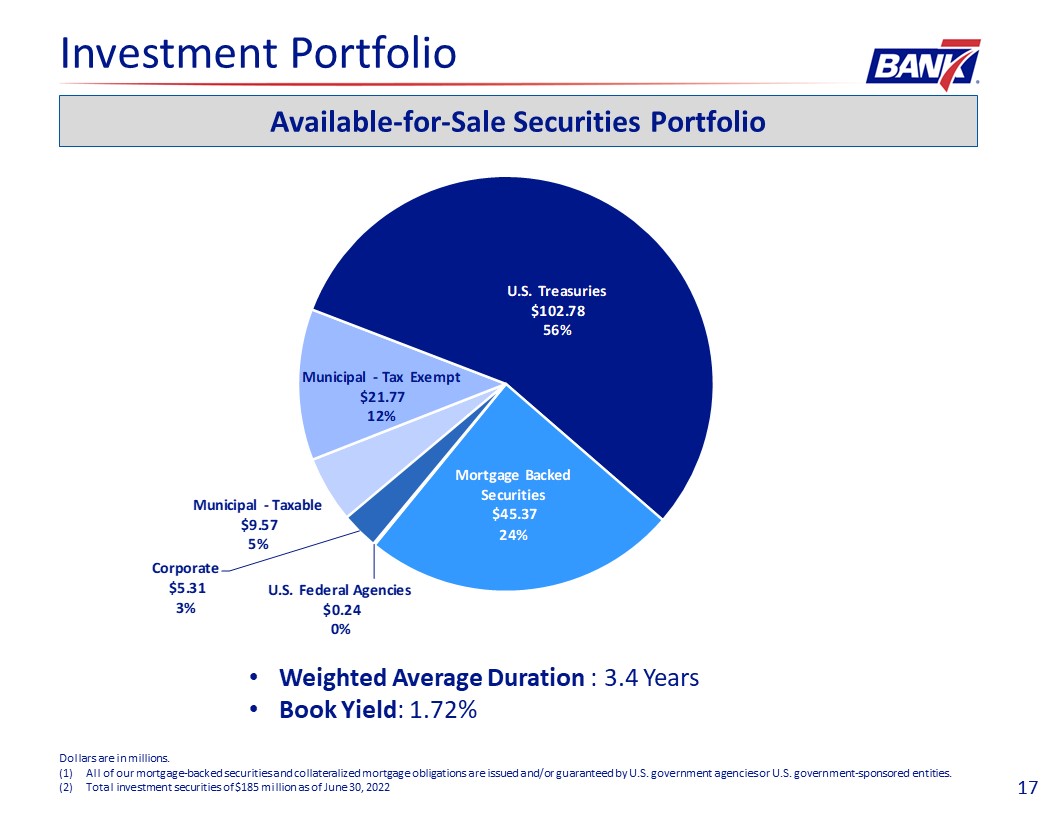
 Investment Portfolio  Available-for-Sale Securities Portfolio  Dollars are in millions.  All of our mortgage-backed securities and collateralized mortgage obligations are issued and/or guaranteed by U.S. government agencies or U.S. government-sponsored entities.  Total investment securities of $185 million as of June 30, 2022  17  Weighted Average Duration : 3.4 Years  Book Yield: 1.72%  (1) 
 

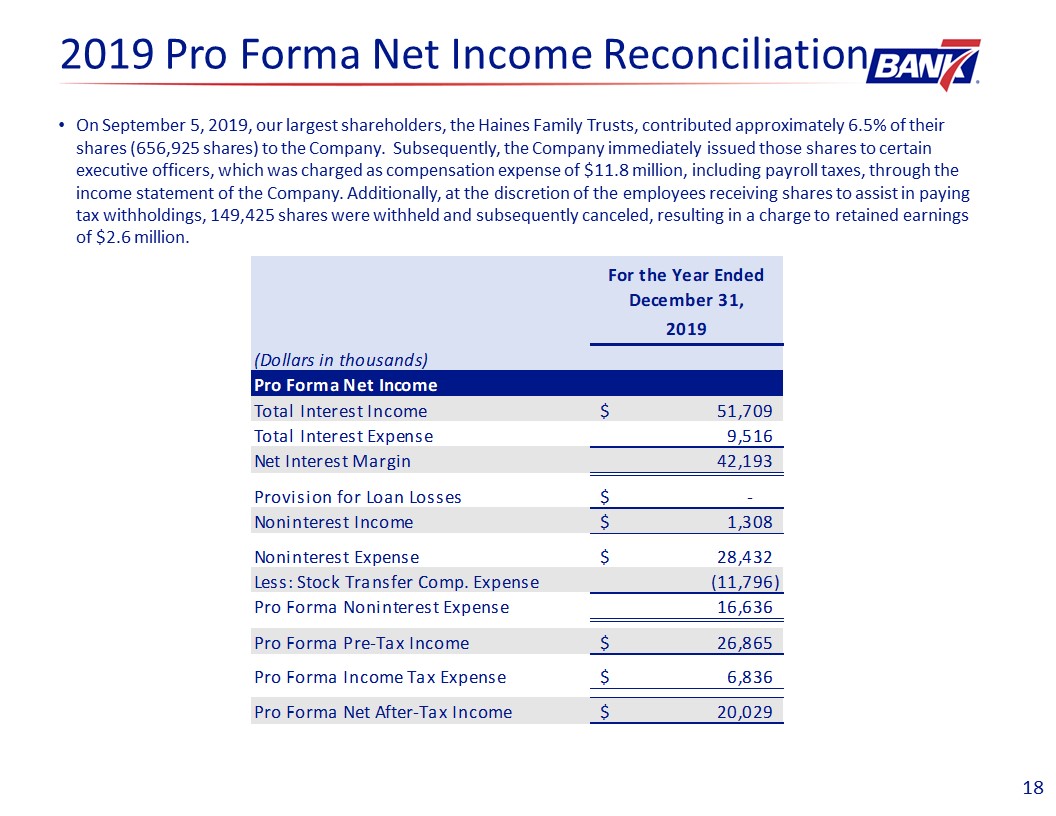
 18  2019 Pro Forma Net Income Reconciliation   On September 5, 2019, our largest shareholders, the Haines Family Trusts, contributed approximately 6.5% of their shares (656,925 shares) to the Company.  Subsequently, the Company immediately issued those shares to certain executive officers, which was charged as compensation expense of $11.8 million, including payroll taxes, through the income statement of the Company. Additionally, at the discretion of the employees receiving shares to assist in paying tax withholdings, 149,425 shares were withheld and subsequently canceled, resulting in a charge to retained earnings of $2.6 million. 
 

 19  Legal Information and Disclaimer  This presentation and oral statements made regarding the subject of this presentation contain forward-looking statements. These forward-looking statements are subject to significant uncertainties because they are based upon: the amount and timing of future changes in interest rates, market behavior, and other economic conditions; future laws, regulations, and accounting principles; changes in regulatory standards and examination policies, and a variety of other matters. These other matters include, among other things, the impact of COVID-19 on the United States economy and our operations, the direct and indirect effect of economic conditions on interest rates, credit quality, loan demand, liquidity, and monetary and supervisory policies of banking regulators. These forward-looking statements reflect Bank7 Corp.’s current views with respect to, among other things, future events and Bank7 Corp.’s financial performance. Any statements about Bank7 Corp.’s expectations, beliefs, plans, predictions, forecasts, objectives, assumptions or future events or performance are not historical facts and may be forward-looking. These statements are often, but not always, made through the use of words or phrases such as “anticipate,” “believes,” “can,” “could,” “may,” “predicts,” “potential,” “should,” “will,” “estimate,” “plans,” “projects,” “continuing,” “ongoing,” “expects,” “intends” and similar words or phrases. Any or all of the forward-looking statements in (or conveyed orally regarding) this presentation may turn out to be inaccurate. The inclusion of or reference to forward-looking information in this presentation should not be regarded as a representation by Bank7 Corp. or any other person that the future plans, estimates or expectations contemplated by Bank7 Corp. will be achieved. Bank7 Corp. has based these forward-looking statements largely on its current expectations and projections about future events and financial trends that Bank7 Corp. believes may affect its financial condition, results of operations, business strategy and financial needs. Bank7 Corp.’s actual results could differ materially from those anticipated in such forward-looking statements as a result of risks, uncertainties and assumptions that are difficult to predict. If one or more events related to these or other risks or uncertainties materialize, or if Bank7 Corp.’s underlying assumptions prove to be incorrect, actual results may differ materially from what Bank7 Corp. anticipates. You are cautioned not to place undue reliance on forward-looking statements. Further, any forward-looking statement speaks only as of the date on which it is made and Bank7 Corp. undertakes no obligation to update or revise any forward-looking statement to reflect events or circumstances after the date on which the statement is made or to reflect the occurrence of unanticipated events, except as may be required by law. All forward-looking statements herein are qualified by these cautionary statements.     Within this presentation, we reference certain market, industry and demographic data, forecasts and other statistical information. We have obtained this data, forecasts and information from various independent, third party industry sources and publications. Nothing in the data, forecasts or information used or derived from third party sources should be construed as advice. Some data and other information are also based on our good faith estimates, which are derived from our review of industry publications and surveys and independent sources. We believe that these sources and estimates are reliable, but have not independently verified them. Statements as to our market position are based on market data currently available to us. Although we are not aware of any misstatements regarding the economic, employment, industry and other market data presented herein, these estimates involve inherent risks and uncertainties and are based on assumptions that are subject to change.     This presentation includes certain non-GAAP financial measures, including pro forma net income, tax-adjusted net income, tax-adjusted earnings per share, tax-adjusted return on average assets and tax-adjusted return on average shareholders’ equity. These non-GAAP financial measures and any other non-GAAP financial measures that we discuss in this presentation should not be considered in isolation, and should be considered as additions to, and not substitutes for or superior to, measures of financial performance prepared in accordance with GAAP. There are a number of limitations related to the use of these non-GAAP financial measures versus their nearest GAAP equivalents. For example, other companies may calculate non-GAAP financial measures differently or may use other measures to evaluate their performance, all of which could reduce the usefulness of Bank7 Corp.’s non-GAAP financial measures as tools for comparison. See the table in the appendix of this presentation for a reconciliation of the non-GAAP financial measures used in (or conveyed orally during) this presentation to their most directly comparable GAAP financial measures.