Exhibit 99.2
BSVN Q3 2021EARNINGS RELEASEOctober 21, 2021
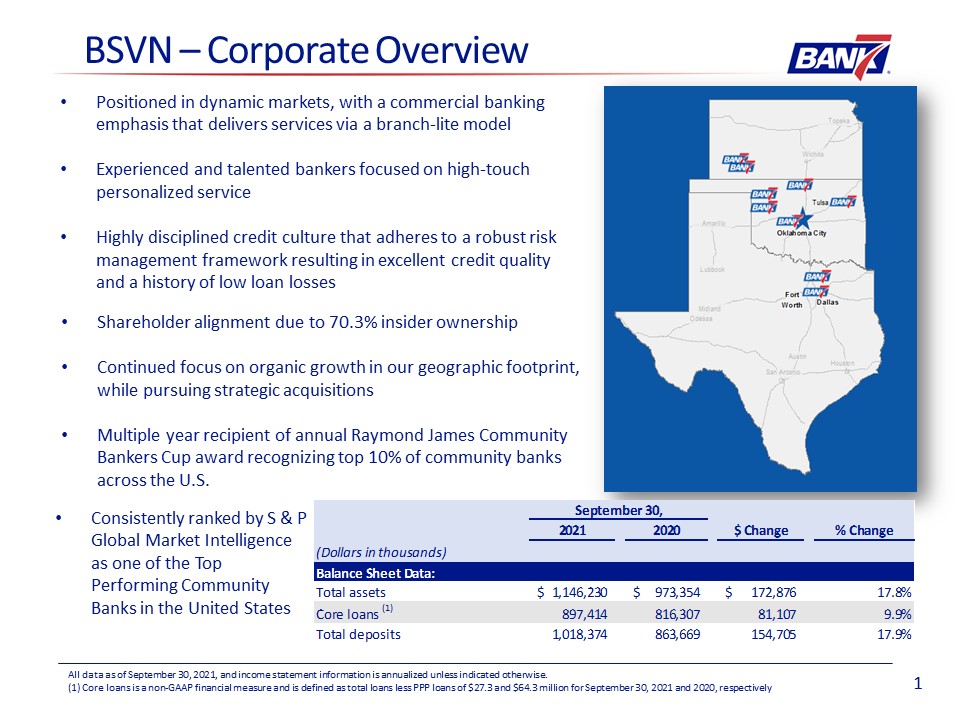
2 BSVN – Corporate Overview Shareholder alignment due to 70.3% insider ownership Continued focus on
organic growth in our geographic footprint, while pursuing strategic acquisitionsMultiple year recipient of annual Raymond James Community Bankers Cup award recognizing top 10% of community banks across the U.S. All data as of September 30,
2021, and income statement information is annualized unless indicated otherwise.(1) Core loans is a non-GAAP financial measure and is defined as total loans less PPP loans of $27.3 and $64.3 million for September 30, 2021 and 2020,
respectively Positioned in dynamic markets, with a commercial banking emphasis that delivers services via a branch-lite modelExperienced and talented bankers focused on high-touch personalized serviceHighly disciplined credit culture that
adheres to a robust risk management framework resulting in excellent credit quality and a history of low loan losses Consistently ranked by S & P Global Market Intelligence as one of the Top Performing Community Banks in the United States
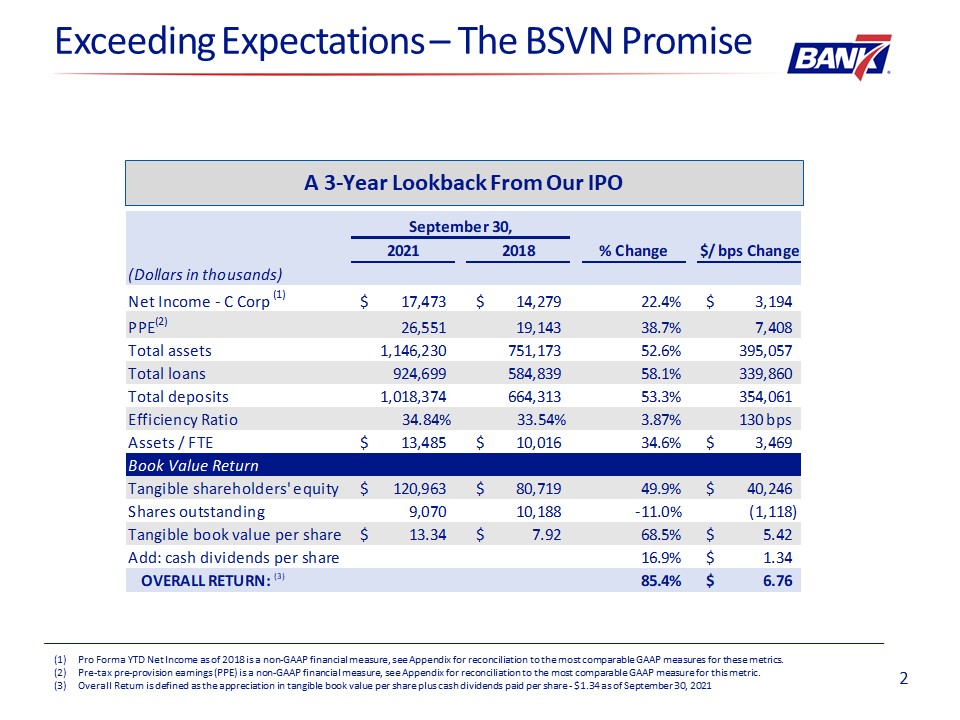
3 Pro Forma YTD Net Income as of 2018 is a non-GAAP financial measure, see Appendix for reconciliation
to the most comparable GAAP measures for these metrics.Pre-tax pre-provision earnings (PPE) is a non-GAAP financial measure, see Appendix for reconciliation to the most comparable GAAP measure for this metric.Overall Return is defined as the
appreciation in tangible book value per share plus cash dividends paid per share - $1.34 as of September 30, 2021 Exceeding Expectations – The BSVN Promise A 3-Year Lookback From Our IPO (3)
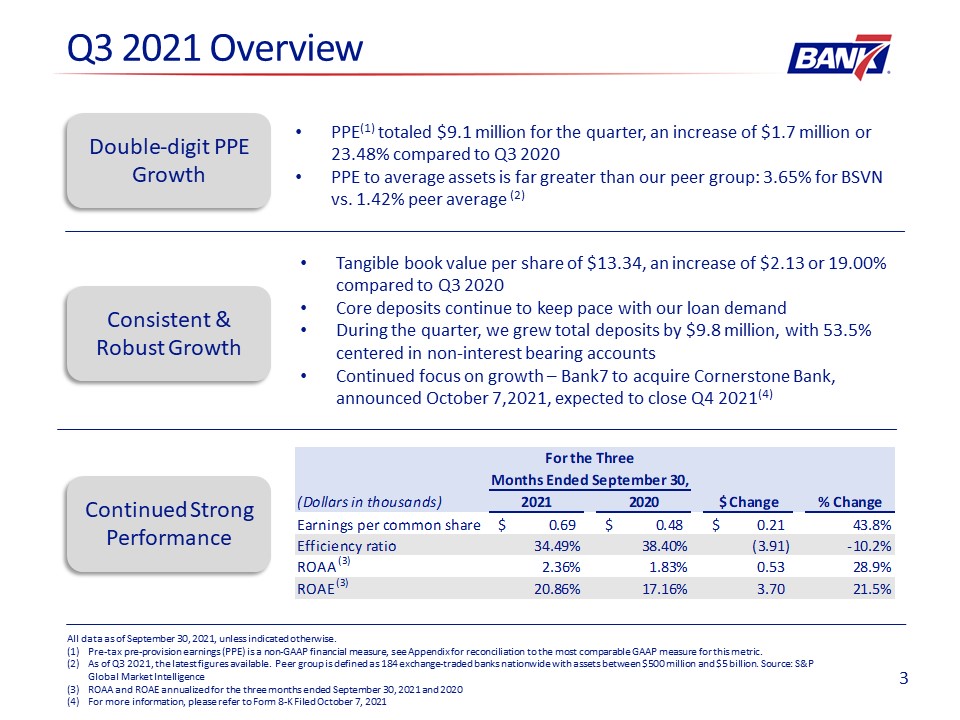
4 Q3 2021 Overview Continued Strong Performance Consistent & Robust Growth Tangible book value
per share of $13.34, an increase of $2.13 or 19.00% compared to Q3 2020Core deposits continue to keep pace with our loan demandDuring the quarter, we grew total deposits by $9.8 million, with 53.5% centered in non-interest
bearing accountsContinued focus on growth – Bank7 to acquire Cornerstone Bank, announced October 7,2021, expected to close Q4 2021(4) All data as of September 30, 2021, unless indicated otherwise.Pre-tax pre-provision earnings (PPE) is a
non-GAAP financial measure, see Appendix for reconciliation to the most comparable GAAP measure for this metric.As of Q3 2021, the latest figures available. Peer group is defined as 184 exchange-traded banks nationwide with assets between $500
million and $5 billion. Source: S&P Global Market IntelligenceROAA and ROAE annualized for the three months ended September 30, 2021 and 2020For more information, please refer to Form 8-K Filed October 7, 2021 Double-digit PPE
Growth PPE(1) totaled $9.1 million for the quarter, an increase of $1.7 million or 23.48% compared to Q3 2020PPE to average assets is far greater than our peer group: 3.65% for BSVN vs. 1.42% peer average (2)
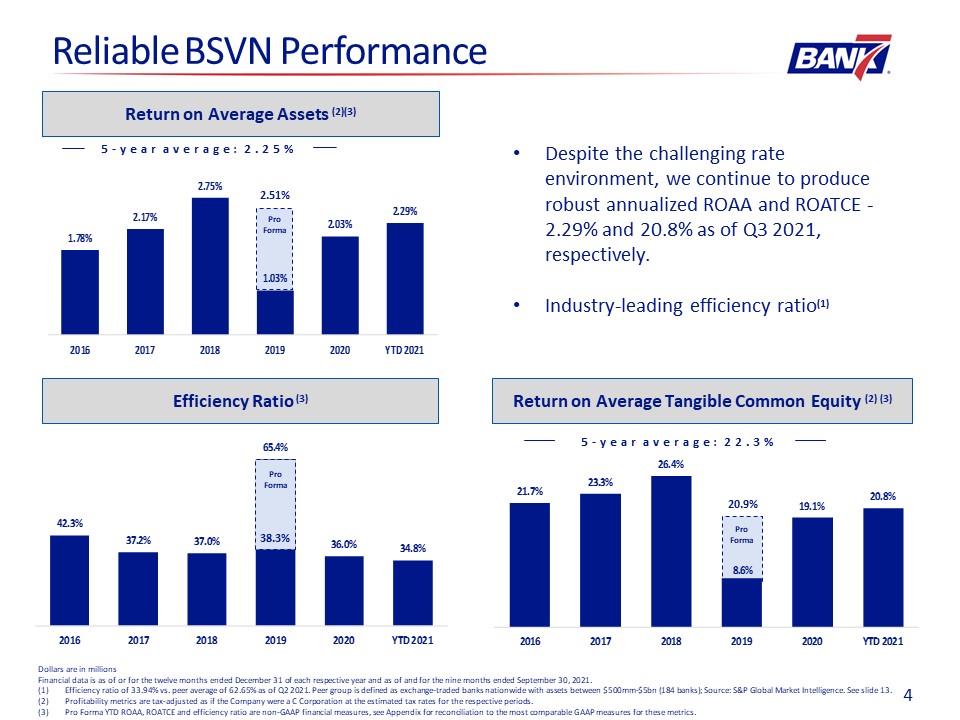
2.51% Pro Forma Pro Forma Reliable BSVN Performance Return on Average Assets (2)(3) Return on
Average Tangible Common Equity (2) (3) Dollars are in millionsFinancial data is as of or for the twelve months ended December 31 of each respective year and as of and for the nine months ended September 30, 2021.Efficiency ratio of 33.94% vs.
peer average of 62.65% as of Q2 2021. Peer group is defined as exchange-traded banks nationwide with assets between $500mm-$5bn (184 banks); Source: S&P Global Market Intelligence. See slide 13.Profitability metrics are tax-adjusted as if
the Company were a C Corporation at the estimated tax rates for the respective periods. Pro Forma YTD ROAA, ROATCE and efficiency ratio are non-GAAP financial measures, see Appendix for reconciliation to the most comparable GAAP measures for
these metrics. Efficiency Ratio (3) Despite the challenging rate environment, we continue to produce robust annualized ROAA and ROATCE - 2.29% and 20.8% as of Q3 2021, respectively.Industry-leading efficiency ratio(1) 5 5-year average:
2.25% 5-year average: 22.3% 38.3% 20.9% Pro Forma
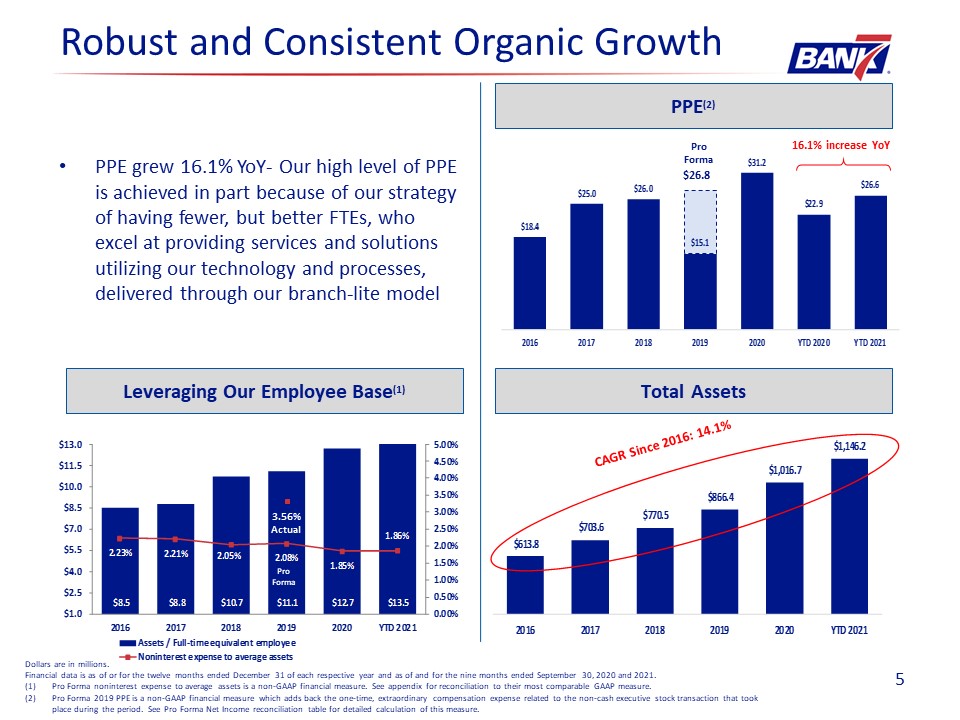
Dollars are in millions. Financial data is as of or for the twelve months ended December 31 of each
respective year and as of and for the nine months ended September 30, 2020 and 2021.Pro Forma noninterest expense to average assets is a non-GAAP financial measure. See appendix for reconciliation to their most comparable GAAP measure.Pro Forma
2019 PPE is a non-GAAP financial measure which adds back the one-time, extraordinary compensation expense related to the non-cash executive stock transaction that took place during the period. See Pro Forma Net Income reconciliation table for
detailed calculation of this measure. 16.1% increase YoY Robust and Consistent Organic Growth PPE(2) Total Assets 6 $26.8 Pro Forma PPE grew 16.1% YoY- Our high level of PPE is achieved in part because of our strategy of having fewer,
but better FTEs, who excel at providing services and solutions utilizing our technology and processes, delivered through our branch-lite model Leveraging Our Employee Base(1) 3.56%Actual Pro Forma CAGR Since 2016: 14.1%
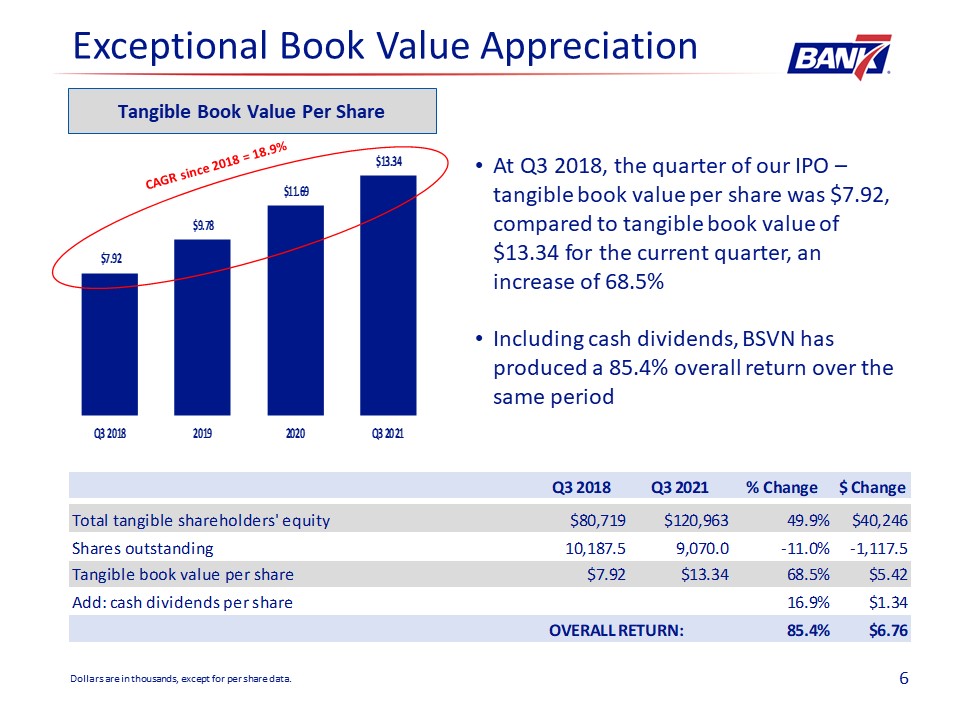
7 Exceptional Book Value Appreciation Tangible Book Value Per Share Dollars are in thousands, except
for per share data. CAGR since 2018 = 18.9% At Q3 2018, the quarter of our IPO – tangible book value per share was $7.92, compared to tangible book value of $13.34 for the current quarter, an increase of 68.5% Including cash dividends, BSVN
has produced a 85.4% overall return over the same period
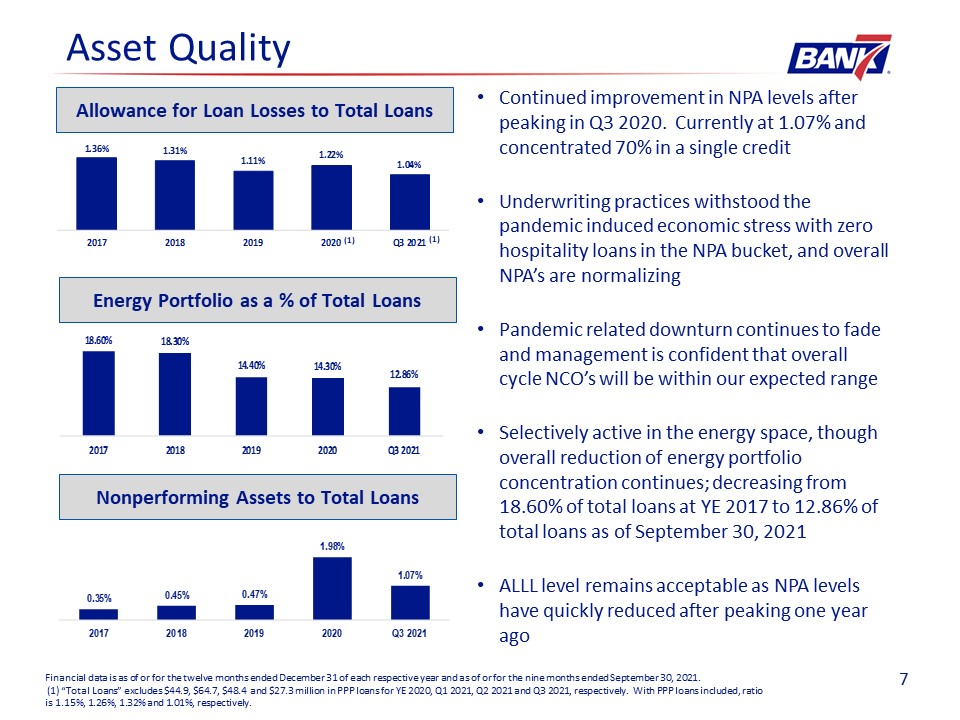
Continued improvement in NPA levels after peaking in Q3 2020. Currently at 1.07% and concentrated 70% in
a single credit Underwriting practices withstood the pandemic induced economic stress with zero hospitality loans in the NPA bucket, and overall NPA’s are normalizingPandemic related downturn continues to fade and management is confident that
overall cycle NCO’s will be within our expected rangeSelectively active in the energy space, though overall reduction of energy portfolio concentration continues; decreasing from 18.60% of total loans at YE 2017 to 12.86% of total loans as of
September 30, 2021ALLL level remains acceptable as NPA levels have quickly reduced after peaking one year ago 8 Allowance for Loan Losses to Total Loans Asset Quality Financial data is as of or for the twelve months ended December 31 of
each respective year and as of or for the nine months ended September 30, 2021. (1) “Total Loans” excludes $44.9, $64.7, $48.4 and $27.3 million in PPP loans for YE 2020, Q1 2021, Q2 2021 and Q3 2021, respectively. With PPP loans included,
ratio is 1.15%, 1.26%, 1.32% and 1.01%, respectively. (1) Energy Portfolio as a % of Total Loans (1) Nonperforming Assets to Total Loans
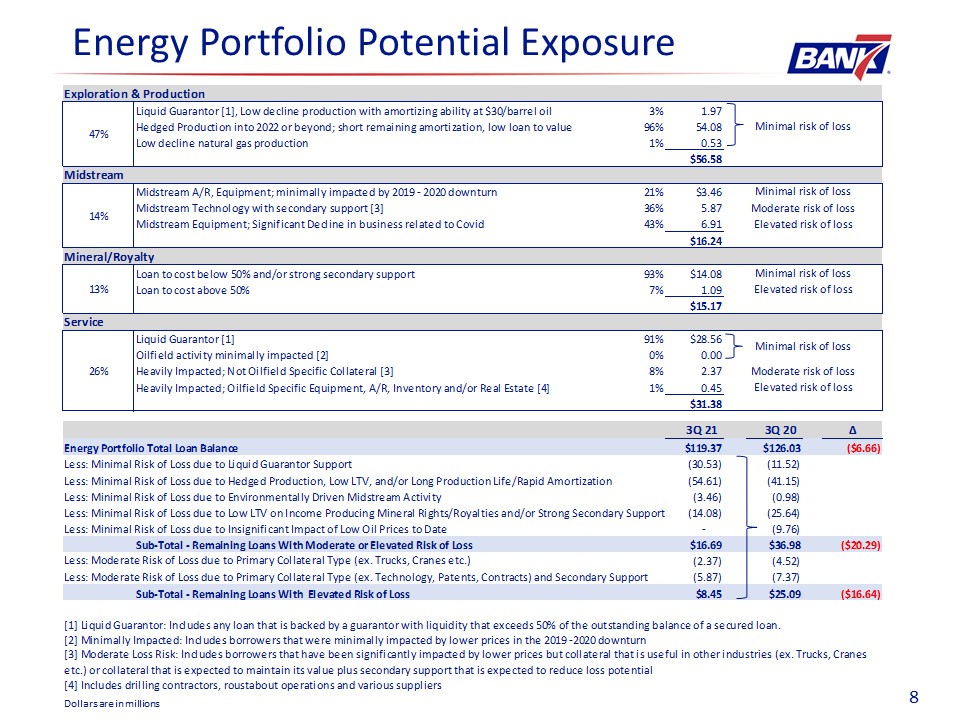
Dollars are in millions Energy Portfolio Potential Exposure 9
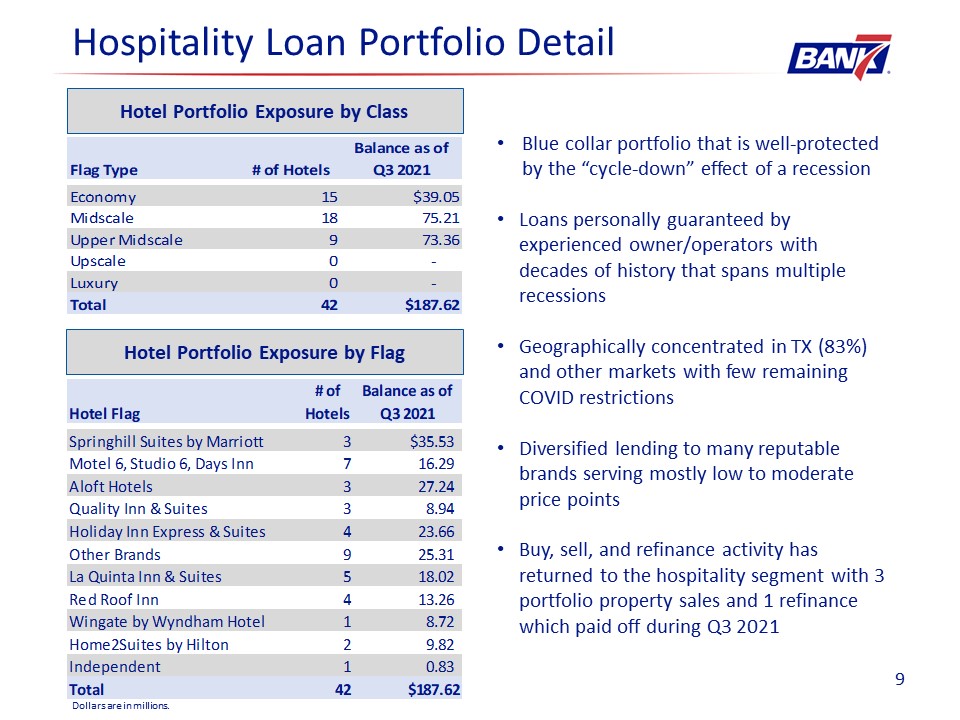
Hospitality Loan Portfolio Detail 10 Blue collar portfolio that is well-protected by the “cycle-down”
effect of a recession Loans personally guaranteed by experienced owner/operators with decades of history that spans multiple recessionsGeographically concentrated in TX (83%) and other markets with few remaining COVID restrictionsDiversified
lending to many reputable brands serving mostly low to moderate price pointsBuy, sell, and refinance activity has returned to the hospitality segment with 3 portfolio property sales and 1 refinance which paid off during Q3 2021 Dollars are in
millions. Hotel Portfolio Exposure by Class Hotel Portfolio Exposure by Flag
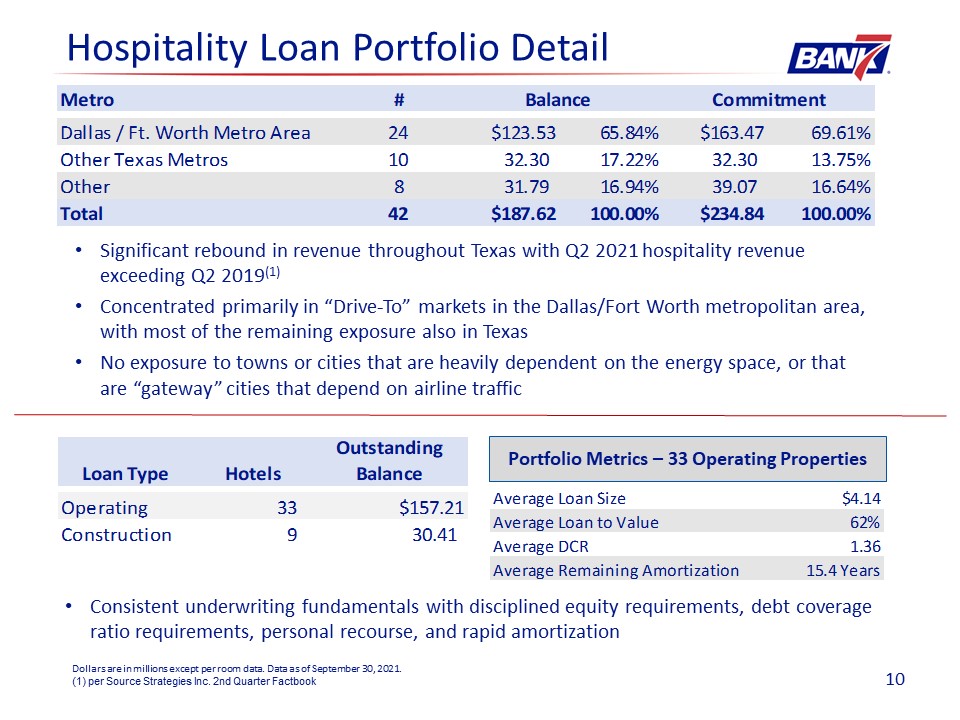
11 Hospitality Loan Portfolio Detail Consistent underwriting fundamentals with disciplined equity
requirements, debt coverage ratio requirements, personal recourse, and rapid amortization Portfolio Metrics – 33 Operating Properties Dollars are in millions except per room data. Data as of September 30, 2021.(1) per Source Strategies Inc.
2nd Quarter Factbook Significant rebound in revenue throughout Texas with Q2 2021 hospitality revenue exceeding Q2 2019(1) Concentrated primarily in “Drive-To” markets in the Dallas/Fort Worth metropolitan area, with most of the remaining
exposure also in TexasNo exposure to towns or cities that are heavily dependent on the energy space, or that are “gateway” cities that depend on airline traffic
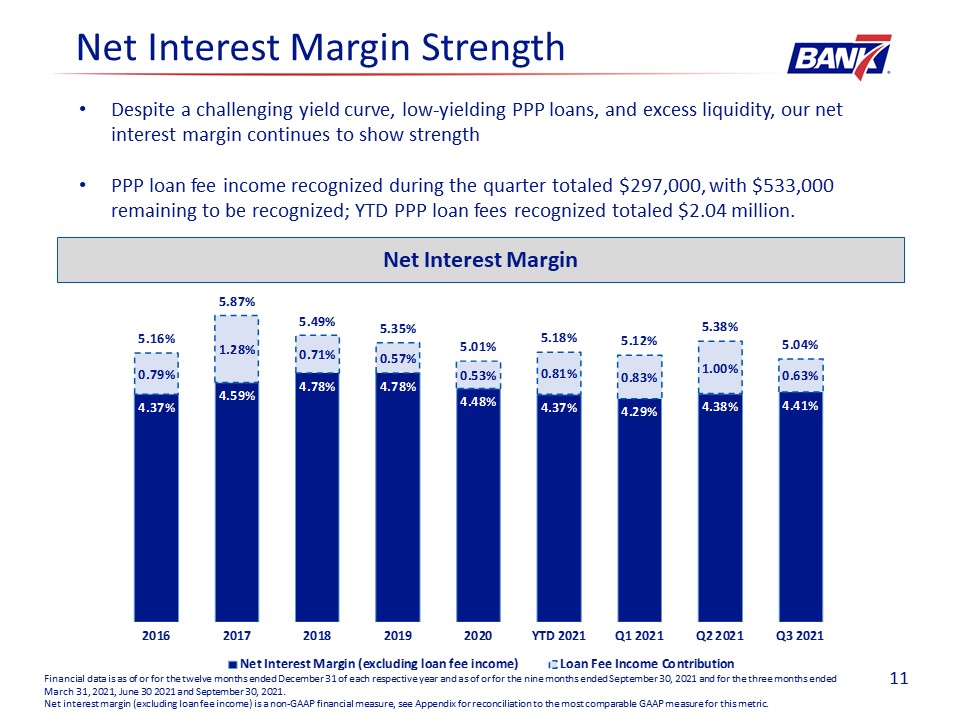
Net Interest Margin Strength Financial data is as of or for the twelve months ended December 31 of each
respective year and as of or for the nine months ended September 30, 2021 and for the three months ended March 31, 2021, June 30 2021 and September 30, 2021.Net interest margin (excluding loan fee income) is a non-GAAP financial measure, see
Appendix for reconciliation to the most comparable GAAP measure for this metric. Net Interest Margin Despite a challenging yield curve, low-yielding PPP loans, and excess liquidity, our net interest margin continues to show strengthPPP loan
fee income recognized during the quarter totaled $297,000, with $533,000 remaining to be recognized; YTD PPP loan fees recognized totaled $2.04 million. 12
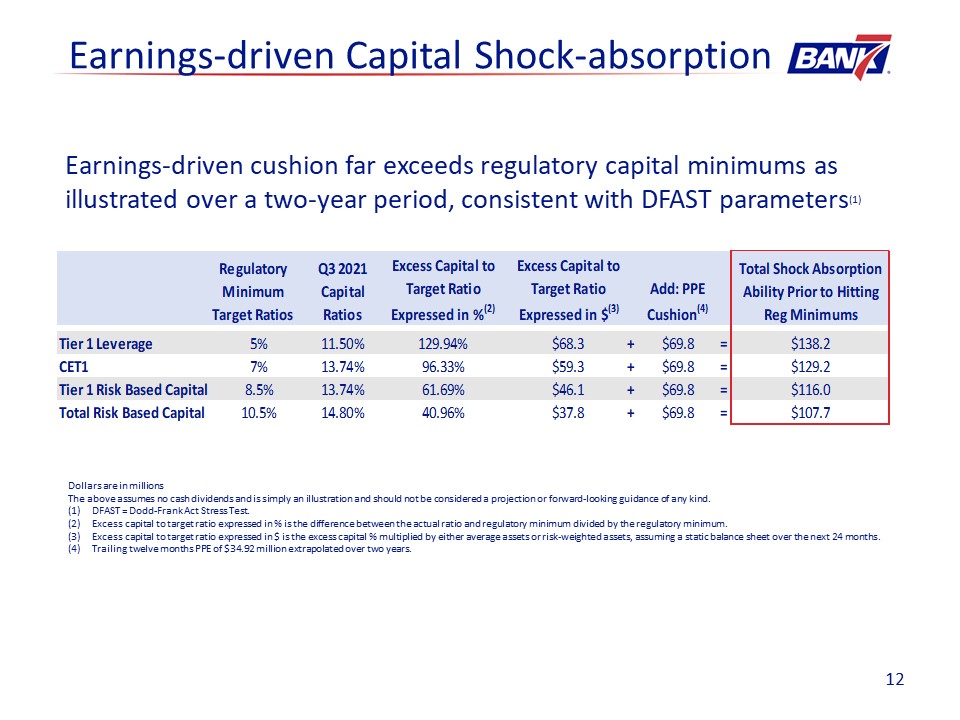
13 Earnings-driven cushion far exceeds regulatory capital minimums as illustrated over a two-year
period, consistent with DFAST parameters(1) Dollars are in millionsThe above assumes no cash dividends and is simply an illustration and should not be considered a projection or forward-looking guidance of any kind. DFAST = Dodd-Frank Act
Stress Test.Excess capital to target ratio expressed in % is the difference between the actual ratio and regulatory minimum divided by the regulatory minimum.Excess capital to target ratio expressed in $ is the excess capital % multiplied by
either average assets or risk-weighted assets, assuming a static balance sheet over the next 24 months. Trailing twelve months PPE of $34.92 million extrapolated over two years. Earnings-driven Capital Shock-absorption
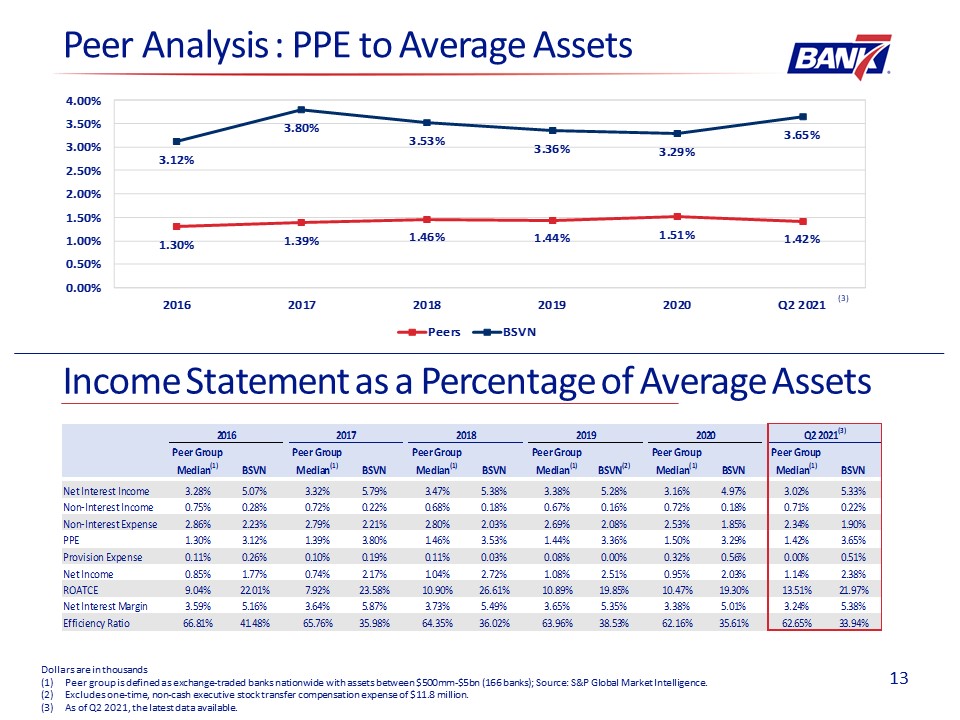
14 Income Statement as a Percentage of Average Assets Dollars are in thousandsPeer group is defined as
exchange-traded banks nationwide with assets between $500mm-$5bn (166 banks); Source: S&P Global Market Intelligence.Excludes one-time, non-cash executive stock transfer compensation expense of $11.8 million.As of Q2 2021, the latest data
available. (3) Peer Analysis : PPE to Average Assets
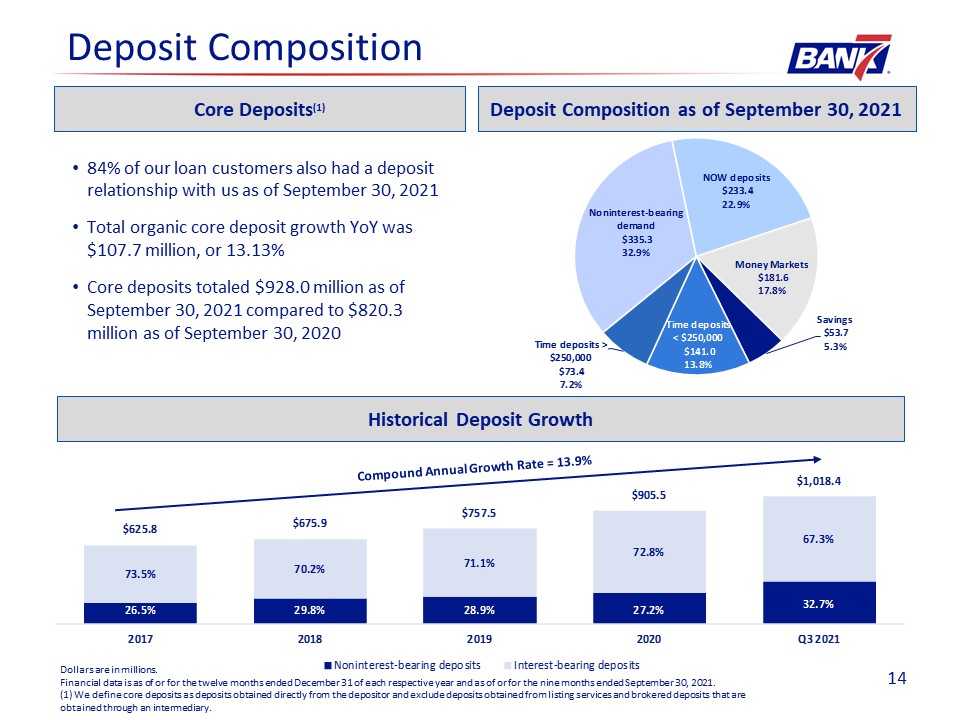
Deposit Composition Historical Deposit Growth Compound Annual Growth Rate = 13.9% Deposit Composition
as of September 30, 2021 84% of our loan customers also had a deposit relationship with us as of September 30, 2021Total organic core deposit growth YoY was $107.7 million, or 13.13%Core deposits totaled $928.0 million as of September 30, 2021
compared to $820.3 million as of September 30, 2020 Dollars are in millions.Financial data is as of or for the twelve months ended December 31 of each respective year and as of or for the nine months ended September 30, 2021.(1) We define core
deposits as deposits obtained directly from the depositor and exclude deposits obtained from listing services and brokered deposits that are obtained through an intermediary. Core Deposits(1) 15
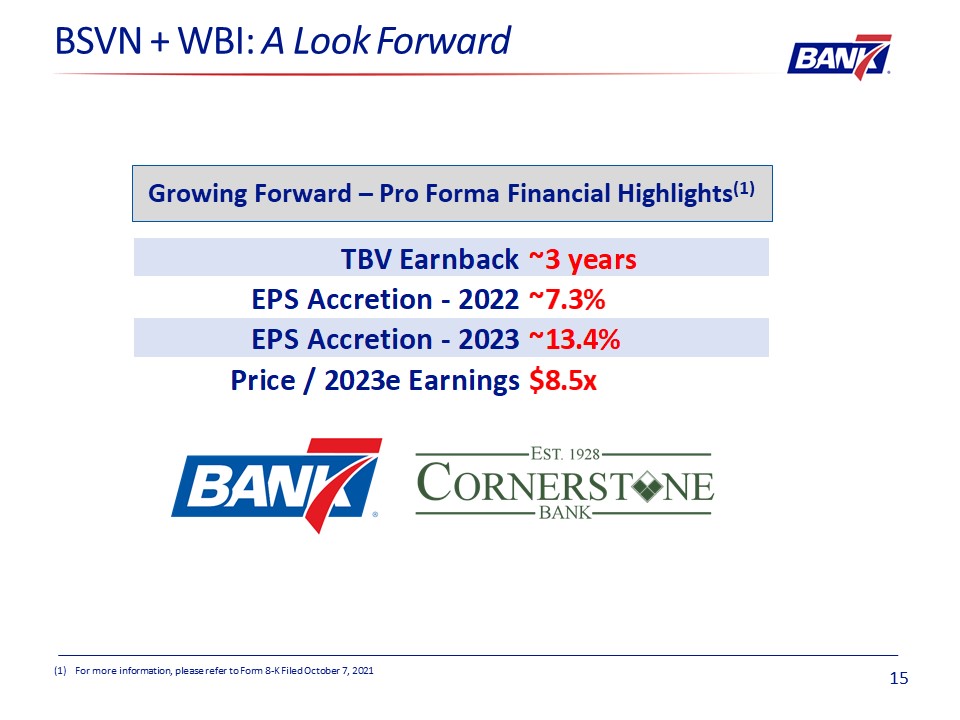
16 For more information, please refer to Form 8-K Filed October 7, 2021 BSVN + WBI: A Look
Forward Growing Forward – Pro Forma Financial Highlights(1)
Appendix 17
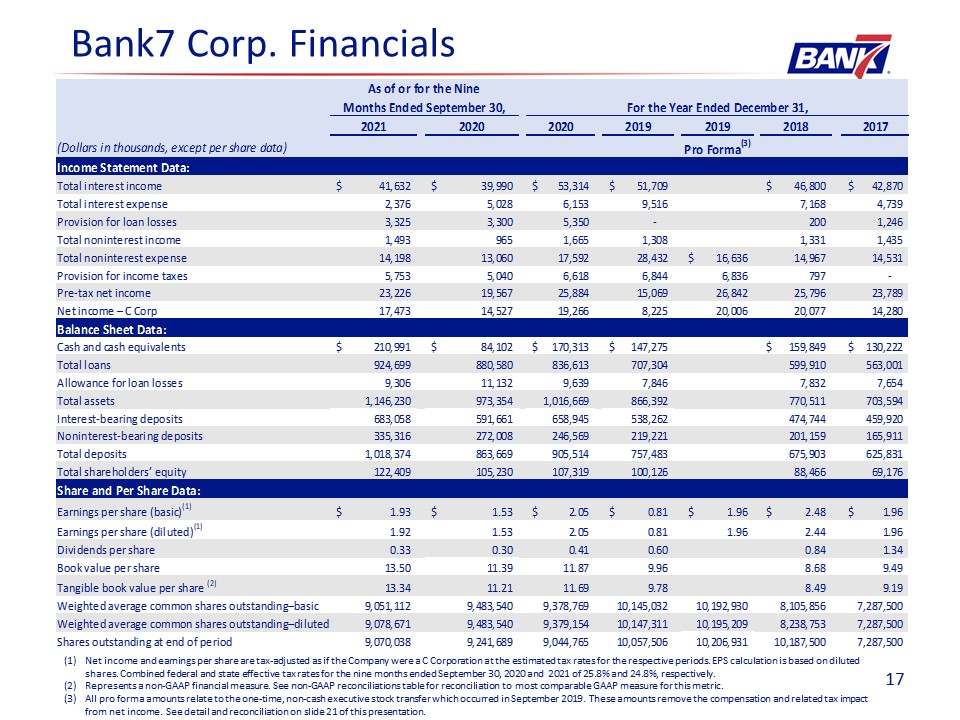
18 Bank7 Corp. Financials Net income and earnings per share are tax-adjusted as if the Company were a C
Corporation at the estimated tax rates for the respective periods. EPS calculation is based on diluted shares. Combined federal and state effective tax rates for the nine months ended September 30, 2020 and 2021 of 25.8% and 24.8%,
respectively.Represents a non-GAAP financial measure. See non-GAAP reconciliations table for reconciliation to most comparable GAAP measure for this metric. All pro forma amounts relate to the one-time, non-cash executive stock transfer which
occurred in September 2019. These amounts remove the compensation and related tax impact from net income. See detail and reconciliation on slide 21 of this presentation.
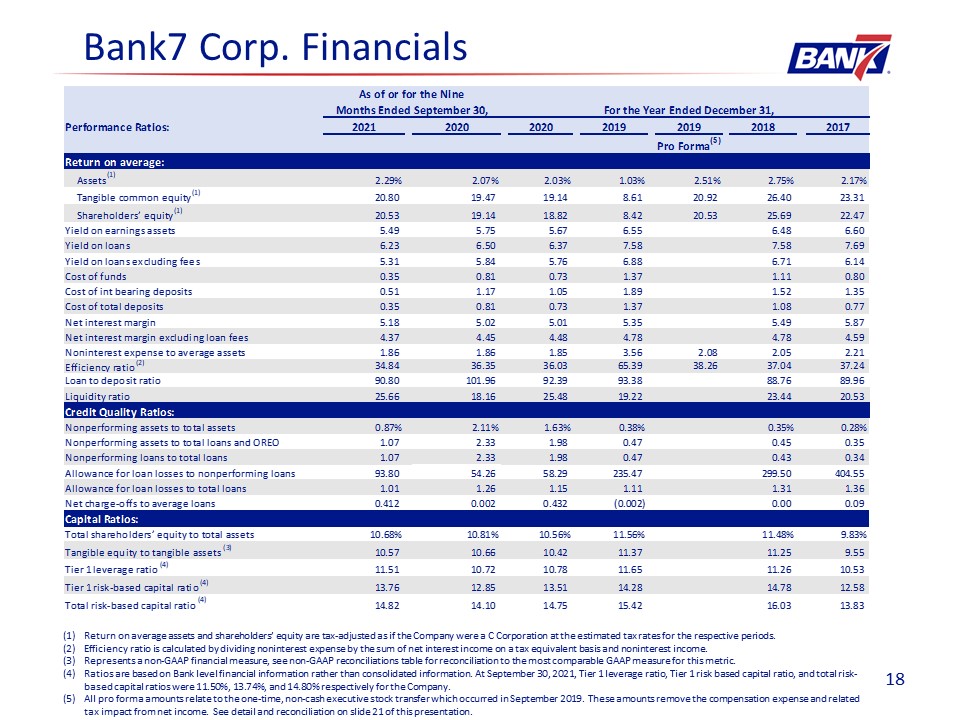
19 Bank7 Corp. Financials Return on average assets and shareholders’ equity are tax-adjusted as if the
Company were a C Corporation at the estimated tax rates for the respective periods.Efficiency ratio is calculated by dividing noninterest expense by the sum of net interest income on a tax equivalent basis and noninterest income. Represents a
non-GAAP financial measure, see non-GAAP reconciliations table for reconciliation to the most comparable GAAP measure for this metric. Ratios are based on Bank level financial information rather than consolidated information. At September 30,
2021, Tier 1 leverage ratio, Tier 1 risk based capital ratio, and total risk-based capital ratios were 11.50%, 13.74%, and 14.80% respectively for the Company.All pro forma amounts relate to the one-time, non-cash executive stock transfer which
occurred in September 2019. These amounts remove the compensation expense and related tax impact from net income. See detail and reconciliation on slide 21 of this presentation.
20 Non-GAAP Reconciliations
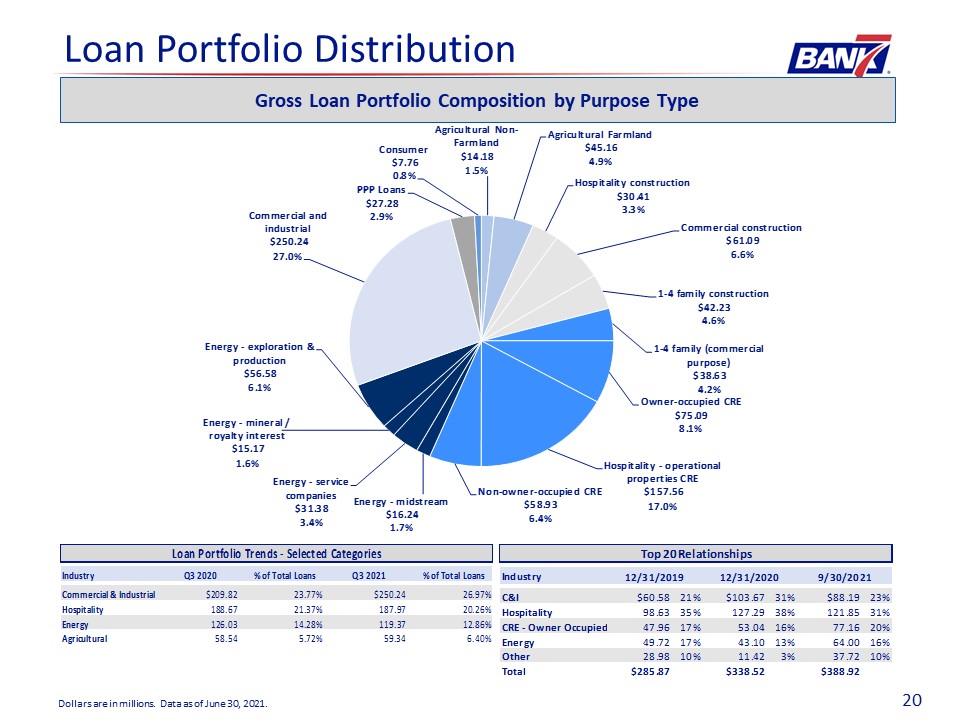
Loan Portfolio Distribution Dollars are in millions. Data as of June 30, 2021. Gross Loan Portfolio
Composition by Purpose Type 21
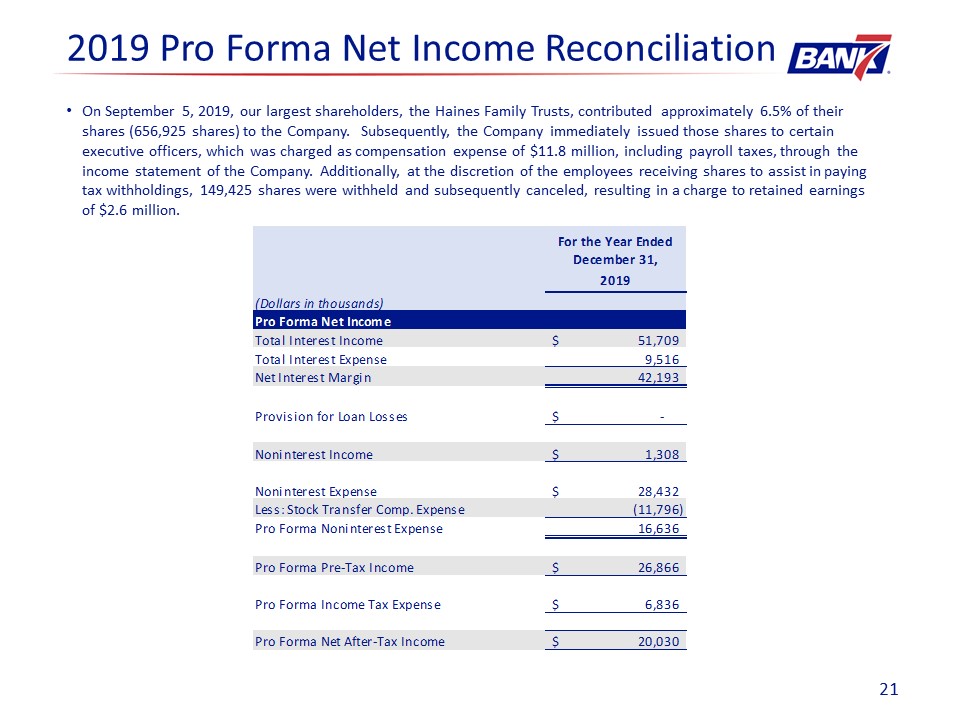
22 2019 Pro Forma Net Income Reconciliation On September 5, 2019, our largest shareholders, the Haines
Family Trusts, contributed approximately 6.5% of their shares (656,925 shares) to the Company. Subsequently, the Company immediately issued those shares to certain executive officers, which was charged as compensation expense of $11.8 million,
including payroll taxes, through the income statement of the Company. Additionally, at the discretion of the employees receiving shares to assist in paying tax withholdings, 149,425 shares were withheld and subsequently canceled, resulting in a
charge to retained earnings of $2.6 million.
23 Legal Information and Disclaimer This presentation and oral statements made regarding the subject of
this presentation contain forward-looking statements. These forward-looking statements are subject to significant uncertainties because they are based upon: the amount and timing of future changes in interest rates, market behavior, and other
economic conditions; future laws, regulations, and accounting principles; changes in regulatory standards and examination policies, and a variety of other matters. These other matters include, among other things, the impact of COVID-19 on the
United States economy and our operations, the direct and indirect effect of economic conditions on interest rates, credit quality, loan demand, liquidity, and monetary and supervisory policies of banking regulators. These forward-looking
statements reflect Bank7 Corp.’s current views with respect to, among other things, future events and Bank7 Corp.’s financial performance. Any statements about Bank7 Corp.’s expectations, beliefs, plans, predictions, forecasts, objectives,
assumptions or future events or performance are not historical facts and may be forward-looking. These statements are often, but not always, made through the use of words or phrases such as “anticipate,” “believes,” “can,” “could,” “may,”
“predicts,” “potential,” “should,” “will,” “estimate,” “plans,” “projects,” “continuing,” “ongoing,” “expects,” “intends” and similar words or phrases. Any or all of the forward-looking statements in (or conveyed orally regarding) this
presentation may turn out to be inaccurate. The inclusion of or reference to forward-looking information in this presentation should not be regarded as a representation by Bank7 Corp. or any other person that the future plans, estimates or
expectations contemplated by Bank7 Corp. will be achieved. Bank7 Corp. has based these forward-looking statements largely on its current expectations and projections about future events and financial trends that Bank7 Corp. believes may affect
its financial condition, results of operations, business strategy and financial needs. Bank7 Corp.’s actual results could differ materially from those anticipated in such forward-looking statements as a result of risks, uncertainties and
assumptions that are difficult to predict. If one or more events related to these or other risks or uncertainties materialize, or if Bank7 Corp.’s underlying assumptions prove to be incorrect, actual results may differ materially from what
Bank7 Corp. anticipates. You are cautioned not to place undue reliance on forward-looking statements. Further, any forward-looking statement speaks only as of the date on which it is made and Bank7 Corp. undertakes no obligation to update or
revise any forward-looking statement to reflect events or circumstances after the date on which the statement is made or to reflect the occurrence of unanticipated events, except as may be required by law. All forward-looking statements herein
are qualified by these cautionary statements. Within this presentation, we reference certain market, industry and demographic data, forecasts and other statistical information. We have obtained this data, forecasts and information from various
independent, third party industry sources and publications. Nothing in the data, forecasts or information used or derived from third party sources should be construed as advice. Some data and other information are also based on our good faith
estimates, which are derived from our review of industry publications and surveys and independent sources. We believe that these sources and estimates are reliable, but have not independently verified them. Statements as to our market position
are based on market data currently available to us. Although we are not aware of any misstatements regarding the economic, employment, industry and other market data presented herein, these estimates involve inherent risks and uncertainties and
are based on assumptions that are subject to change. This presentation includes certain non-GAAP financial measures, including pro forma net income, tax-adjusted net income, tax-adjusted earnings per share, tax-adjusted return on average assets
and tax-adjusted return on average shareholders’ equity. These non-GAAP financial measures and any other non-GAAP financial measures that we discuss in this presentation should not be considered in isolation, and should be considered as
additions to, and not substitutes for or superior to, measures of financial performance prepared in accordance with GAAP. There are a number of limitations related to the use of these non-GAAP financial measures versus their nearest GAAP
equivalents. For example, other companies may calculate non-GAAP financial measures differently or may use other measures to evaluate their performance, all of which could reduce the usefulness of Bank7 Corp.’s non-GAAP financial measures as
tools for comparison. See the table in the appendix of this presentation for a reconciliation of the non-GAAP financial measures used in (or conveyed orally during) this presentation to their most directly comparable GAAP financial measures.