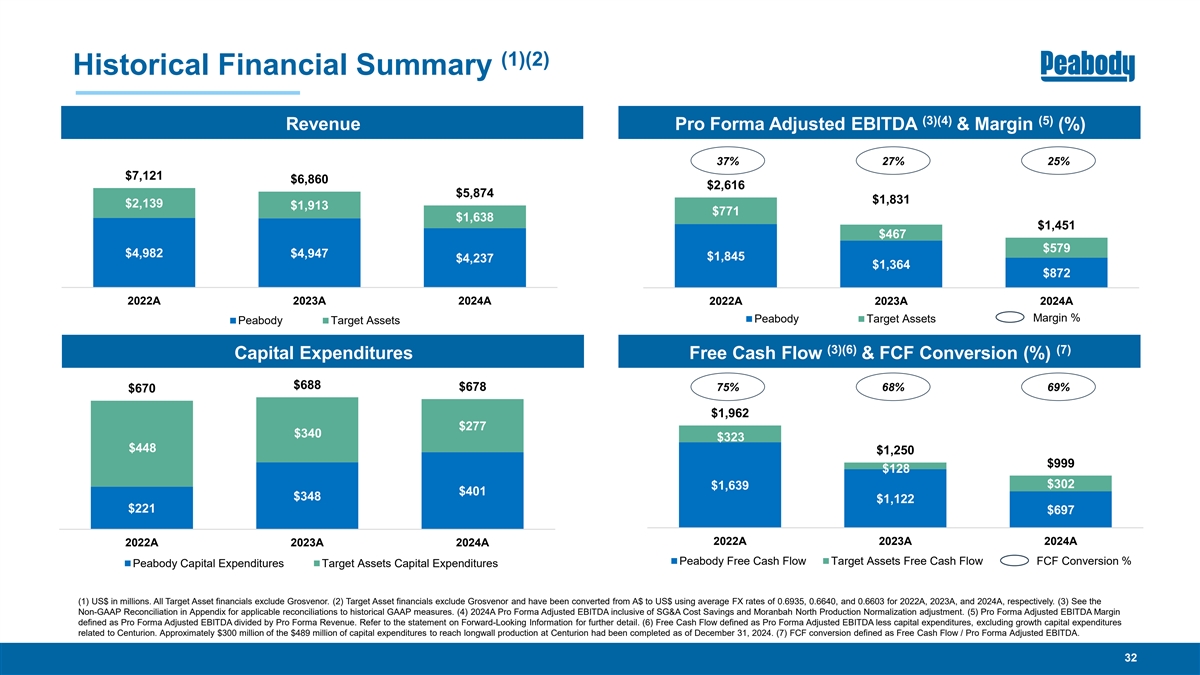
(1)(2) Historical Financial Summary (3)(4) (5) Revenue Pro Forma Adjusted EBITDA & Margin (%) 37% 27% 25% $7,121 $6,860 $2,616 $5,874 $1,831 $2,139 $1,913 $771 $1,638 $1,451 $467 $579 $4,982 $4,947 $1,845 $4,237 $1,364 $872 2022A 2023A 2024A 2022A 2023A 2024A Peabody Target Assets Margin % Peabody Target Assets (3)(6) (7) Capital Expenditures Free Cash Flow & FCF Conversion (%) $688 $678 75% 68% 69% $670 $1,962 $277 $340 $323 $448 $1,250 $999 $128 $302 $1,639 $401 $348 $1,122 $221 $697 2022A 2023A 2024A 2022A 2023A 2024A Peabody Free Cash Flow Target Assets Free Cash Flow FCF Conversion % Peabody Capital Expenditures Target Assets Capital Expenditures (1) US$ in millions. All Target Asset financials exclude Grosvenor. (2) Target Asset financials exclude Grosvenor and have been converted from A$ to US$ using average FX rates of 0.6935, 0.6640, and 0.6603 for 2022A, 2023A, and 2024A, respectively. (3) See the Non-GAAP Reconciliation in Appendix for applicable reconciliations to historical GAAP measures. (4) 2024A Pro Forma Adjusted EBITDA inclusive of SG&A Cost Savings and Moranbah North Production Normalization adjustment. (5) Pro Forma Adjusted EBITDA Margin defined as Pro Forma Adjusted EBITDA divided by Pro Forma Revenue. Refer to the statement on Forward-Looking Information for further detail. (6) Free Cash Flow defined as Pro Forma Adjusted EBITDA less capital expenditures, excluding growth capital expenditures related to Centurion. Approximately $300 million of the $489 million of capital expenditures to reach longwall production at Centurion had been completed as of December 31, 2024. (7) FCF conversion defined as Free Cash Flow / Pro Forma Adjusted EBITDA. 32
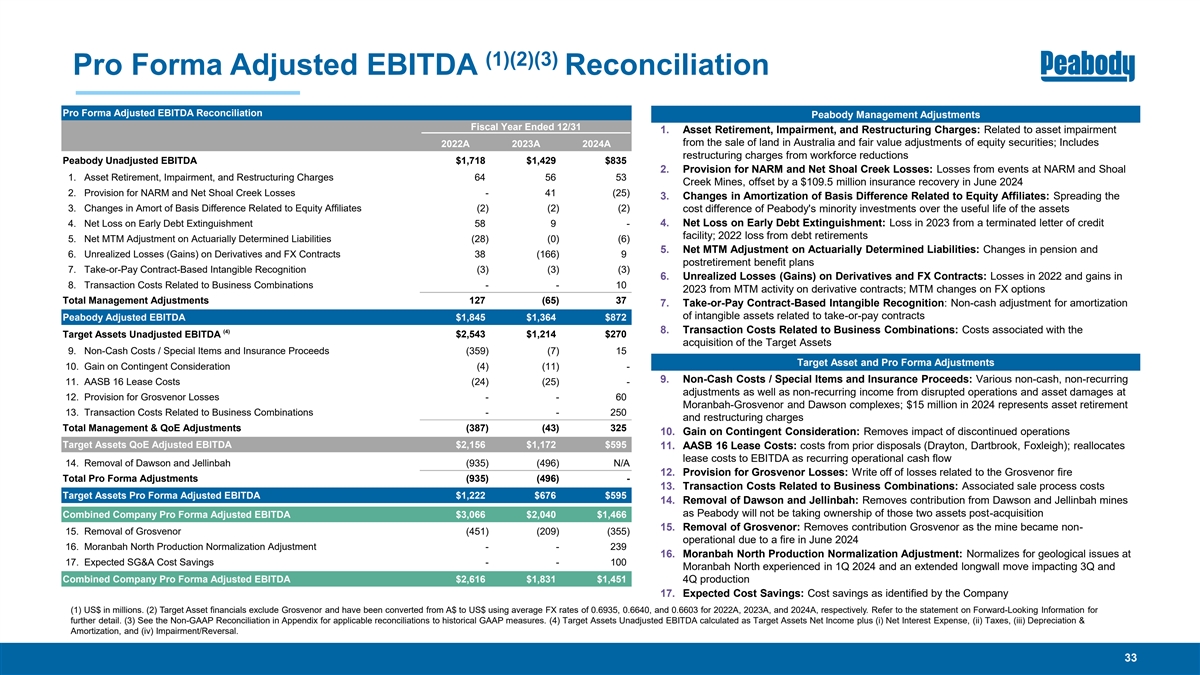
(1)(2)(3) Pro Forma Adjusted EBITDA Reconciliation Pro Forma Adjusted EBITDA Reconciliation Peabody Management Adjustments Fiscal Year Ended 12/31 1. Asset Retirement, Impairment, and Restructuring Charges: Related to asset impairment from the sale of land in Australia and fair value adjustments of equity securities; Includes 2022A 2023A 2024A restructuring charges from workforce reductions Peabody Unadjusted EBITDA $1,718 $1,429 $835 2. Provision for NARM and Net Shoal Creek Losses: Losses from events at NARM and Shoal 1. Asset Retirement, Impairment, and Restructuring Charges 64 56 53 Creek Mines, offset by a $109.5 million insurance recovery in June 2024 2. Provision for NARM and Net Shoal Creek Losses - 41 (25) 3. Changes in Amortization of Basis Difference Related to Equity Affiliates: Spreading the 3. Changes in Amort of Basis Difference Related to Equity Affiliates (2) (2) (2) cost difference of Peabody's minority investments over the useful life of the assets 4. Net Loss on Early Debt Extinguishment: Loss in 2023 from a terminated letter of credit 4. Net Loss on Early Debt Extinguishment 58 9 - facility; 2022 loss from debt retirements 5. Net MTM Adjustment on Actuarially Determined Liabilities (28) (0) (6) 5. Net MTM Adjustment on Actuarially Determined Liabilities: Changes in pension and 6. Unrealized Losses (Gains) on Derivatives and FX Contracts 38 (166) 9 postretirement benefit plans 7. Take-or-Pay Contract-Based Intangible Recognition (3) (3) (3) 6. Unrealized Losses (Gains) on Derivatives and FX Contracts: Losses in 2022 and gains in 8. Transaction Costs Related to Business Combinations - - 10 2023 from MTM activity on derivative contracts; MTM changes on FX options Total Management Adjustments 127 (65) 37 7. Take-or-Pay Contract-Based Intangible Recognition: Non-cash adjustment for amortization of intangible assets related to take-or-pay contracts Peabody Adjusted EBITDA $1,845 $1,364 $872 (4) 8. Transaction Costs Related to Business Combinations: Costs associated with the Target Assets Unadjusted EBITDA $2,543 $1,214 $270 acquisition of the Target Assets 9. Non-Cash Costs / Special Items and Insurance Proceeds (359) (7) 15 Target Asset and Pro Forma Adjustments 10. Gain on Contingent Consideration (4) (11) - 9. Non-Cash Costs / Special Items and Insurance Proceeds: Various non-cash, non-recurring 11. AASB 16 Lease Costs (24) (25) - adjustments as well as non-recurring income from disrupted operations and asset damages at 12. Provision for Grosvenor Losses - - 60 Moranbah-Grosvenor and Dawson complexes; $15 million in 2024 represents asset retirement 13. Transaction Costs Related to Business Combinations - - 250 and restructuring charges Total Management & QoE Adjustments (387) (43) 325 10. Gain on Contingent Consideration: Removes impact of discontinued operations Target Assets QoE Adjusted EBITDA $2,156 $1,172 $595 11. AASB 16 Lease Costs: costs from prior disposals (Drayton, Dartbrook, Foxleigh); reallocates lease costs to EBITDA as recurring operational cash flow 14. Removal of Dawson and Jellinbah (935) (496) N/A 12. Provision for Grosvenor Losses: Write off of losses related to the Grosvenor fire Total Pro Forma Adjustments (935) (496) - 13. Transaction Costs Related to Business Combinations: Associated sale process costs Target Assets Pro Forma Adjusted EBITDA $1,222 $676 $595 14. Removal of Dawson and Jellinbah: Removes contribution from Dawson and Jellinbah mines as Peabody will not be taking ownership of those two assets post-acquisition Combined Company Pro Forma Adjusted EBITDA $3,066 $2,040 $1,466 15. Removal of Grosvenor: Removes contribution Grosvenor as the mine became non- 15. Removal of Grosvenor (451) (209) (355) operational due to a fire in June 2024 16. Moranbah North Production Normalization Adjustment - - 239 16. Moranbah North Production Normalization Adjustment: Normalizes for geological issues at 17. Expected SG&A Cost Savings - - 100 Moranbah North experienced in 1Q 2024 and an extended longwall move impacting 3Q and Combined Company Pro Forma Adjusted EBITDA $2,616 $1,831 $1,451 4Q production 17. Expected Cost Savings: Cost savings as identified by the Company (1) US$ in millions. (2) Target Asset financials exclude Grosvenor and have been converted from A$ to US$ using average FX rates of 0.6935, 0.6640, and 0.6603 for 2022A, 2023A, and 2024A, respectively. Refer to the statement on Forward-Looking Information for further detail. (3) See the Non-GAAP Reconciliation in Appendix for applicable reconciliations to historical GAAP measures. (4) Target Assets Unadjusted EBITDA calculated as Target Assets Net Income plus (i) Net Interest Expense, (ii) Taxes, (iii) Depreciation & Amortization, and (iv) Impairment/Reversal. 33
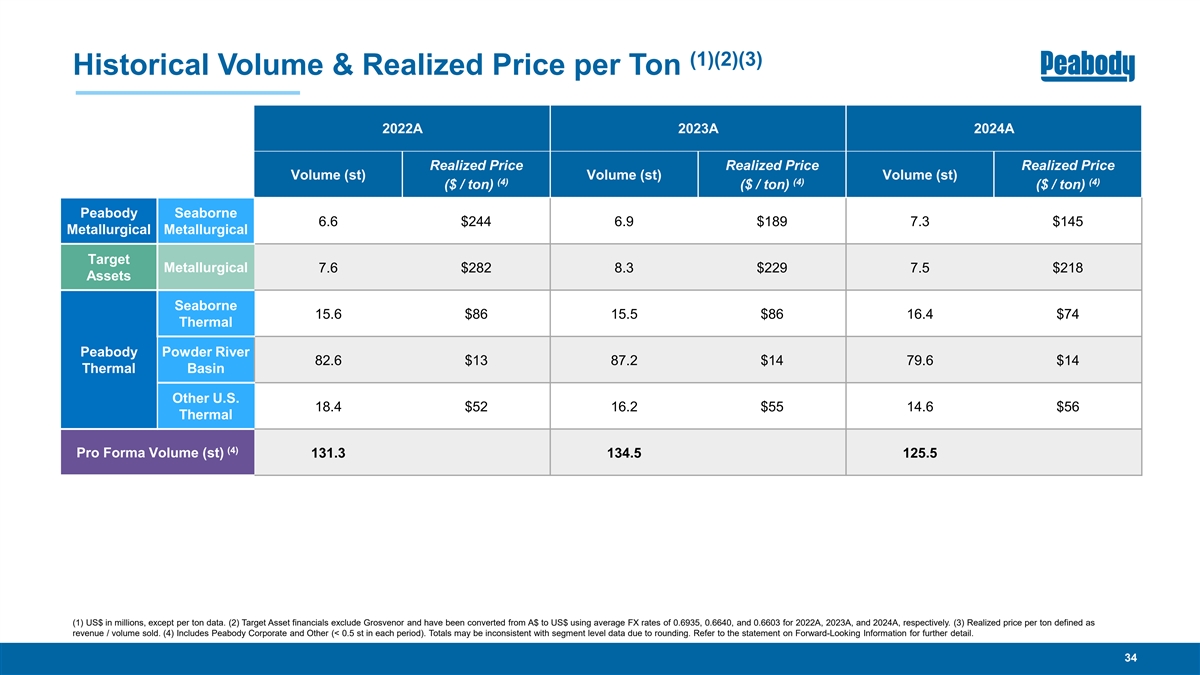
(1)(2)(3) Historical Volume & Realized Price per Ton 2022A 2023A 2024A Realized Price Realized Price Realized Price Volume (st) Volume (st) Volume (st) (4) (4) (4) ($ / ton) ($ / ton) ($ / ton) Peabody Seaborne 6.6 $244 6.9 $189 7.3 $145 Metallurgical Metallurgical Target Metallurgical 7.6 $282 8.3 $229 7.5 $218 Assets Seaborne 15.6 $86 15.5 $86 16.4 $74 Thermal Peabody Powder River 82.6 $13 87.2 $14 79.6 $14 Thermal Basin Other U.S. 18.4 $52 16.2 $55 14.6 $56 Thermal (4) Pro Forma Volume (st) 131.3 134.5 125.5 (1) US$ in millions, except per ton data. (2) Target Asset financials exclude Grosvenor and have been converted from A$ to US$ using average FX rates of 0.6935, 0.6640, and 0.6603 for 2022A, 2023A, and 2024A, respectively. (3) Realized price per ton defined as revenue / volume sold. (4) Includes Peabody Corporate and Other (< 0.5 st in each period). Totals may be inconsistent with segment level data due to rounding. Refer to the statement on Forward-Looking Information for further detail. 34
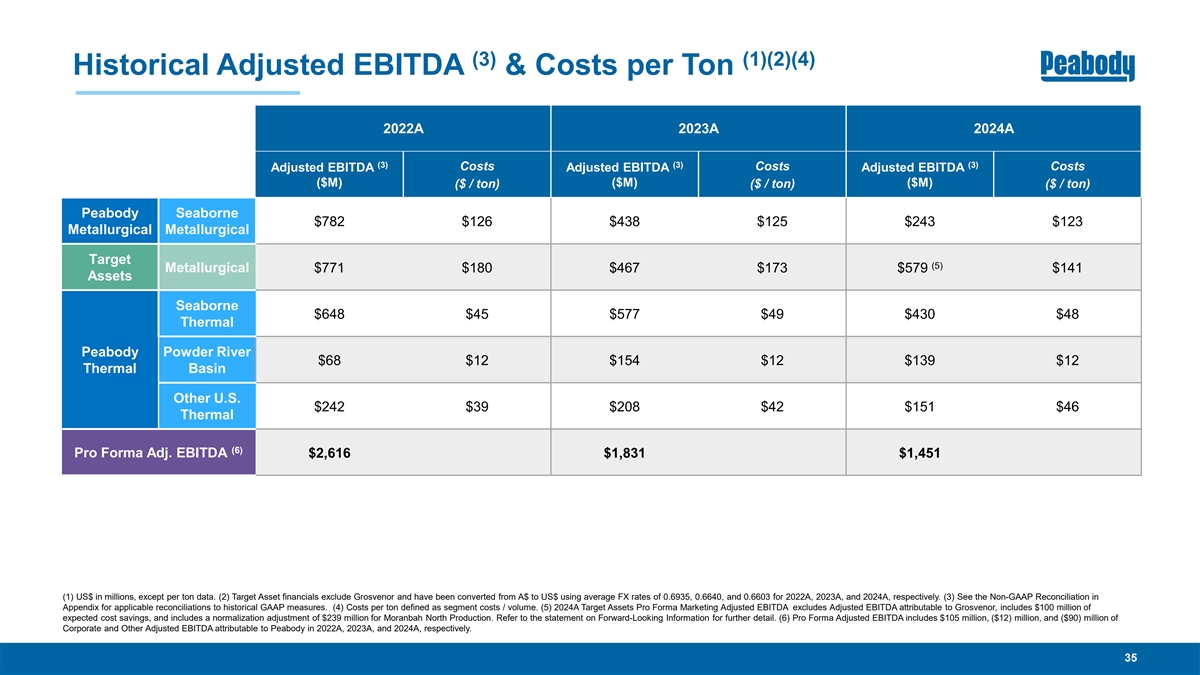
(3) (1)(2)(4) Historical Adjusted EBITDA & Costs per Ton 2022A 2023A 2024A (3) (3) (3) Costs Costs Costs Adjusted EBITDA Adjusted EBITDA Adjusted EBITDA ($M) ($M) ($M) ($ / ton) ($ / ton) ($ / ton) Peabody Seaborne $782 $126 $438 $125 $243 $123 Metallurgical Metallurgical Target (5) Metallurgical $771 $180 $467 $173 $579 $141 Assets Seaborne $648 $45 $577 $49 $430 $48 Thermal Peabody Powder River $68 $12 $154 $12 $139 $12 Thermal Basin Other U.S. $242 $39 $208 $42 $151 $46 Thermal (6) Pro Forma Adj. EBITDA $2,616 $1,831 $1,451 (1) US$ in millions, except per ton data. (2) Target Asset financials exclude Grosvenor and have been converted from A$ to US$ using average FX rates of 0.6935, 0.6640, and 0.6603 for 2022A, 2023A, and 2024A, respectively. (3) See the Non-GAAP Reconciliation in Appendix for applicable reconciliations to historical GAAP measures. (4) Costs per ton defined as segment costs / volume. (5) 2024A Target Assets Pro Forma Marketing Adjusted EBITDA excludes Adjusted EBITDA attributable to Grosvenor, includes $100 million of expected cost savings, and includes a normalization adjustment of $239 million for Moranbah North Production. Refer to the statement on Forward-Looking Information for further detail. (6) Pro Forma Adjusted EBITDA includes $105 million, ($12) million, and ($90) million of Corporate and Other Adjusted EBITDA attributable to Peabody in 2022A, 2023A, and 2024A, respectively. 35
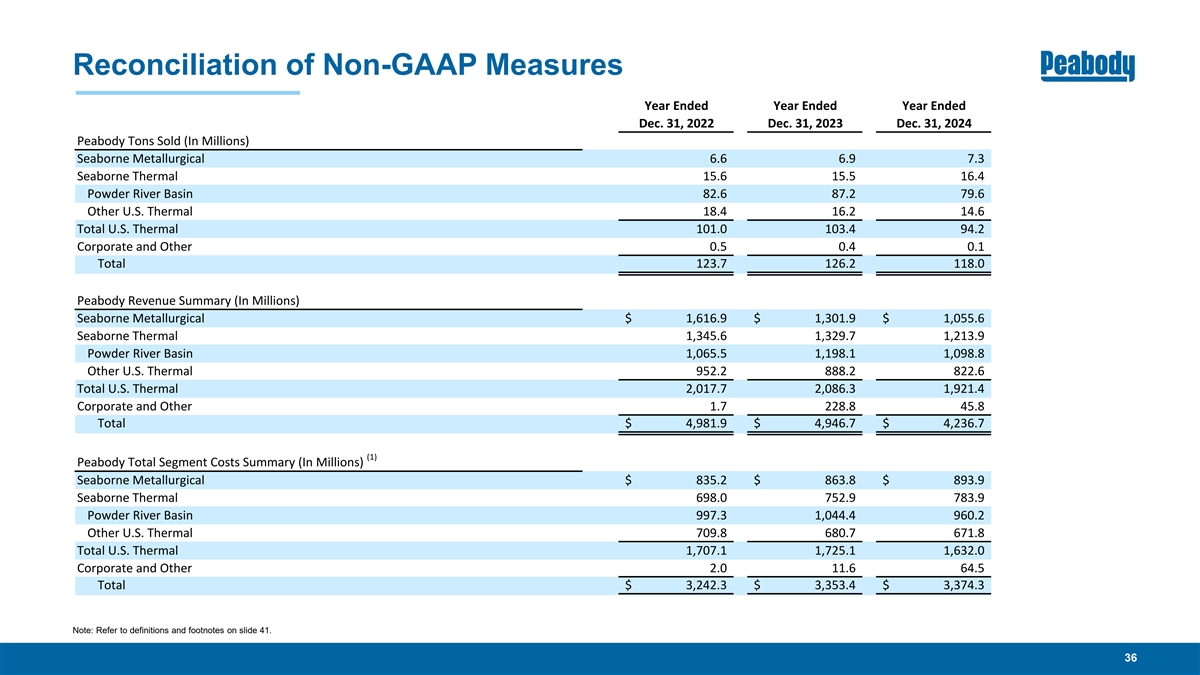
Reconciliation of Non-GAAP Measures Year Ended Year Ended Year Ended Dec. 31, 2022 Dec. 31, 2023 Dec. 31, 2024 Peabody Tons Sold (In Millions) Seaborne Metallurgical 6.6 6.9 7.3 Seaborne Thermal 15.6 15.5 16.4 Powder River Basin 82.6 87.2 79.6 Other U.S. Thermal 18.4 16.2 14.6 Total U.S. Thermal 101.0 103.4 94.2 Corporate and Other 0.5 0.4 0.1 Total 123.7 126.2 118.0 Peabody Revenue Summary (In Millions) Seaborne Metallurgical $ 1,616.9 $ 1,301.9 $ 1,055.6 Seaborne Thermal 1,345.6 1,329.7 1,213.9 Powder River Basin 1,065.5 1,198.1 1,098.8 Other U.S. Thermal 952.2 888.2 822.6 Total U.S. Thermal 2,017.7 2,086.3 1,921.4 Corporate and Other 1.7 228.8 45.8 Total $ 4,981.9 $ 4,946.7 $ 4,236.7 (1) Peabody Total Segment Costs Summary (In Millions) Seaborne Metallurgical $ 835.2 $ 863.8 $ 893.9 Seaborne Thermal 698.0 752.9 783.9 Powder River Basin 997.3 1,044.4 960.2 Other U.S. Thermal 709.8 680.7 671.8 Total U.S. Thermal 1,707.1 1,725.1 1,632.0 Corporate and Other 2.0 11.6 64.5 Total $ 3,242.3 $ 3,353.4 $ 3,374.3 Note: Refer to definitions and footnotes on slide 41. 36
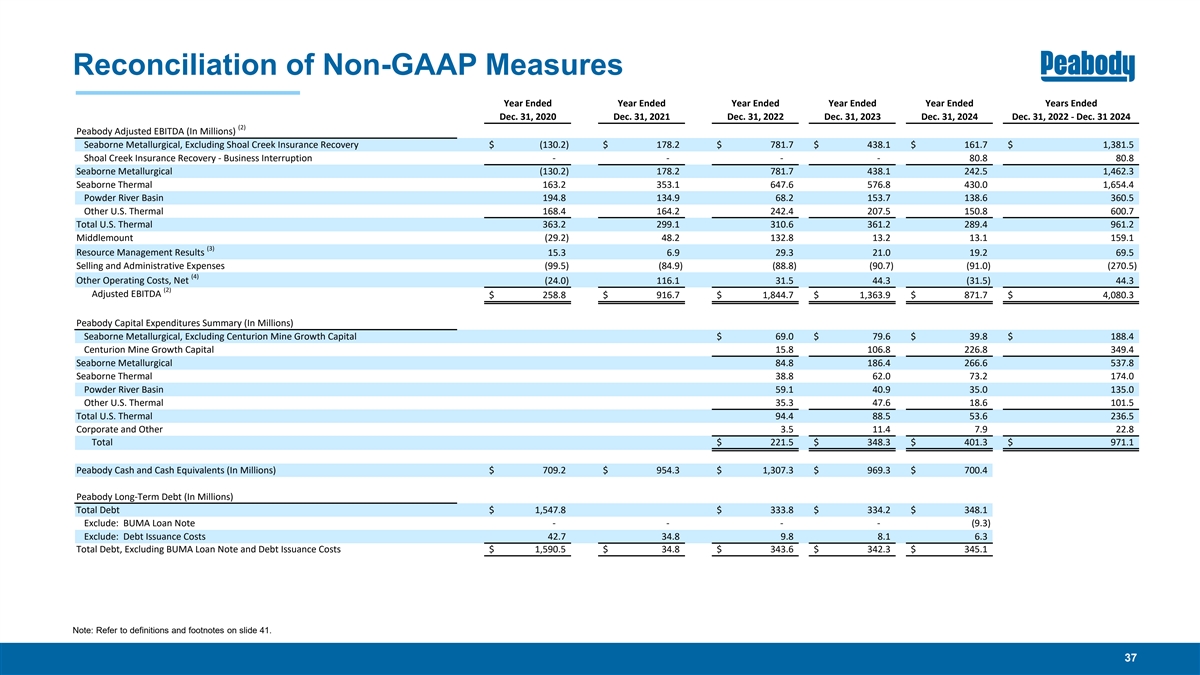
Reconciliation of Non-GAAP Measures Year Ended Year Ended Year Ended Year Ended Year Ended Years Ended Dec. 31, 2020 Dec. 31, 2021 Dec. 31, 2022 Dec. 31, 2023 Dec. 31, 2024 Dec. 31, 2022 - Dec. 31 2024 (2) Peabody Adjusted EBITDA (In Millions) Seaborne Metallurgical, Excluding Shoal Creek Insurance Recovery $ (130.2) $ 178.2 $ 781.7 $ 438.1 $ 161.7 $ 1,381.5 Shoal Creek Insurance Recovery - Business Interruption - - - - 80.8 80.8 Seaborne Metallurgical (130.2) 178.2 781.7 438.1 242.5 1,462.3 Seaborne Thermal 163.2 353.1 647.6 576.8 430.0 1,654.4 Powder River Basin 194.8 134.9 68.2 153.7 138.6 360.5 Other U.S. Thermal 168.4 164.2 242.4 207.5 150.8 600.7 Total U.S. Thermal 363.2 299.1 310.6 361.2 289.4 961.2 Middlemount (29 .2) 48.2 132.8 13.2 13.1 159.1 (3) Resource Management Results 15.3 6.9 29.3 21.0 19.2 69.5 Selling and Administrative Expenses (99 .5) (84 .9) (88 .8) (90 .7) (91 .0) (27 0.5) (4) Other Operating Costs, Net (24 .0) 116.1 31.5 44.3 (31 .5) 44.3 (2) Adjusted EBITDA $ 258.8 $ 916.7 $ 1,844.7 $ 1,363.9 $ 871.7 $ 4,080.3 Peabody Capital Expenditures Summary (In Millions) Seaborne Metallurgical, Excluding Centurion Mine Growth Capital $ 69.0 $ 79.6 $ 39.8 $ 188.4 Centurion Mine Growth Capital 15.8 106.8 226.8 349.4 Seaborne Metallurgical 84.8 186.4 266.6 537.8 Seaborne Thermal 38.8 62.0 73.2 174.0 Powder River Basin 59.1 40.9 35.0 135.0 Other U.S. Thermal 35.3 47.6 18.6 101.5 Total U.S. Thermal 94.4 88.5 53.6 236.5 Corporate and Other 3.5 11.4 7.9 22.8 Total $ 221.5 $ 348.3 $ 401.3 $ 971.1 Peabody Cash and Cash Equivalents (In Millions) $ 709.2 $ 954.3 $ 1,307.3 $ 969.3 $ 700.4 Peabody Long-Term Debt (In Millions) Total Debt $ 1,547.8 $ 333.8 $ 334.2 $ 348.1 Exclude: BUMA Loan Note - - - - (9.3) Exclude: Debt Issuance Costs 42.7 34.8 9.8 8.1 6.3 Total Debt, Excluding BUMA Loan Note and Debt Issuance Costs $ 1,590.5 $ 34.8 $ 343.6 $ 342.3 $ 345.1 Note: Refer to definitions and footnotes on slide 41. 37
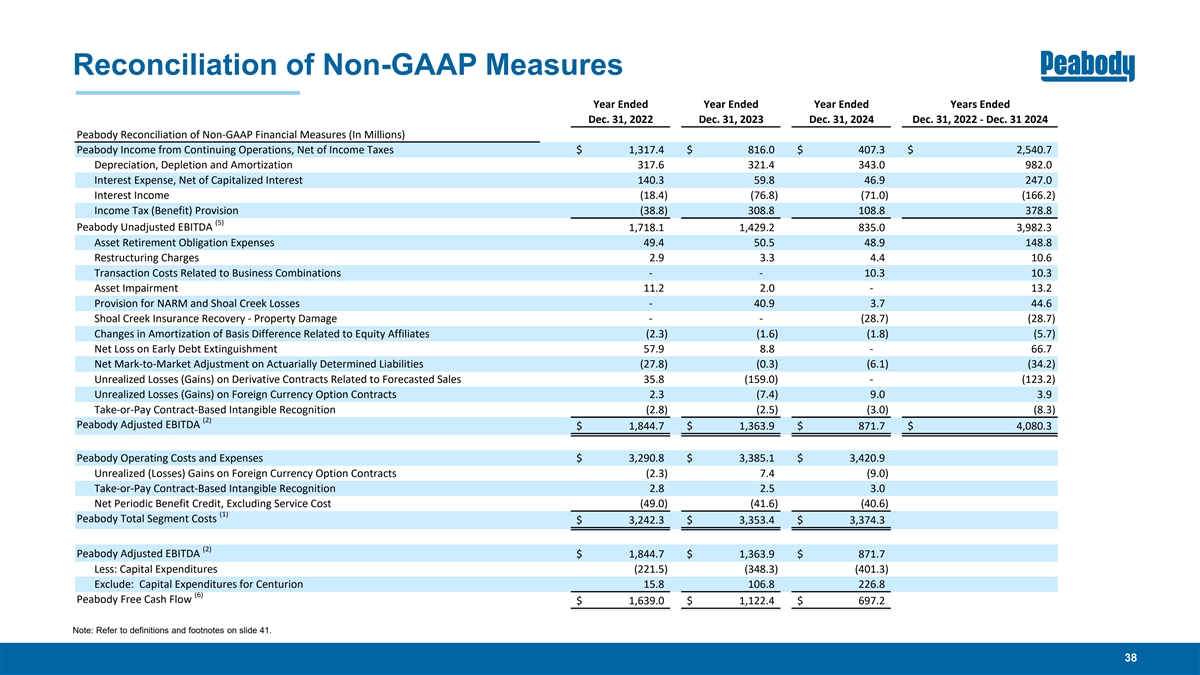
Reconciliation of Non-GAAP Measures Year Ended Year Ended Year Ended Years Ended Dec. 31, 2022 Dec. 31, 2023 Dec. 31, 2024 Dec. 31, 2022 - Dec. 31 2024 Peabody Reconciliation of Non-GAAP Financial Measures (In Millions) Peabody Income from Continuing Operations, Net of Income Taxes $ 1,317.4 $ 816.0 $ 407.3 $ 2,540.7 Depreciation, Depletion and Amortization 317.6 321.4 343.0 982.0 Interest Expense, Net of Capitalized Interest 140.3 59.8 46.9 247.0 Interest Income (18 .4) (76 .8) (71 .0) (16 6.2) Income Tax (Benefit) Provision (38 .8) 308.8 108.8 378.8 (5) Peabody Unadjusted EBITDA 1,718.1 1,429.2 835.0 3,982.3 Asset Retirement Obligation Expenses 49.4 50.5 48.9 148.8 Restructuring Charges 2.9 3.3 4.4 10.6 Transaction Costs Related to Business Combinations - - 10.3 10.3 Asset Impairment 11.2 2.0 - 13.2 Provision for NARM and Shoal Creek Losses - 40.9 3.7 44.6 Shoal Creek Insurance Recovery - Property Damage - - (28 .7) (28 .7) Changes in Amortization of Basis Difference Related to Equity Affiliates (2.3) (1.6) (1.8) (5.7) Net Loss on Early Debt Extinguishment 57.9 8.8 - 66.7 Net Mark-to-Market Adjustment on Actuarially Determined Liabilities (27 .8) (0.3) (6.1) (34 .2) Unrealized Losses (Gains) on Derivative Contracts Related to Forecasted Sales 35.8 (159.0) - (12 3.2) Unrealized Losses (Gains) on Foreign Currency Option Contracts 2.3 (7.4) 9.0 3.9 Take-or-Pay Contract-Based Intangible Recognition (2.8) (2.5) (3.0) (8.3) (2) Peabody Adjusted EBITDA $ 1,844.7 $ 1,363.9 $ 871.7 $ 4,080.3 Peabody Operating Costs and Expenses $ 3,290.8 $ 3,385.1 $ 3,420.9 Unrealized (Losses) Gains on Foreign Currency Option Contracts (2.3) 7.4 (9.0) Take-or-Pay Contract-Based Intangible Recognition 2.8 2.5 3.0 Net Periodic Benefit Credit, Excluding Service Cost (49 .0) (41 .6) (40 .6) (1) Peabody Total Segment Costs $ 3,242.3 $ 3,353.4 $ 3,374.3 (2) Peabody Adjusted EBITDA $ 1,844.7 $ 1,363.9 $ 871.7 Less: Capital Expenditures (221.5) (348.3) (401.3) Exclude: Capital Expenditures for Centurion 15.8 106.8 226.8 (6) Peabody Free Cash Flow $ 1,639.0 $ 1,122.4 $ 697.2 Note: Refer to definitions and footnotes on slide 41. 38
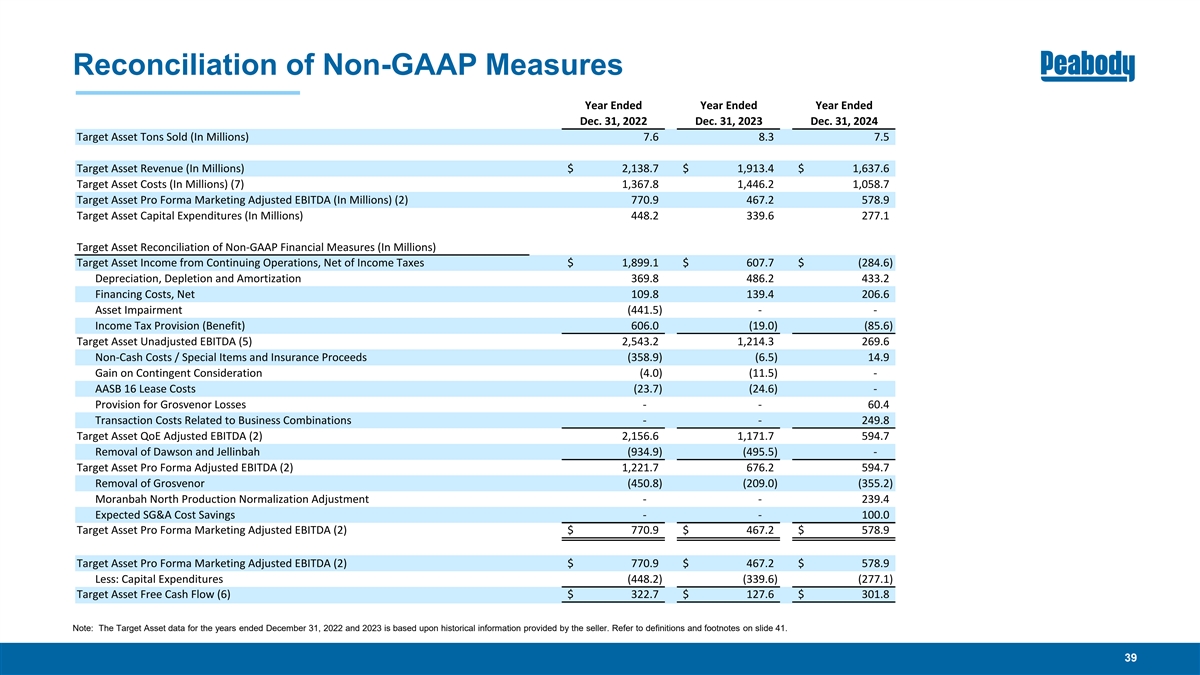
Reconciliation of Non-GAAP Measures Year Ended Year Ended Year Ended Dec. 31, 2022 Dec. 31, 2023 Dec. 31, 2024 Target Asset Tons Sold (In Millions) 7.6 8.3 7.5 Target Asset Revenue (In Millions) $ 2,138.7 $ 1,913.4 $ 1,637.6 Target Asset Costs (In Millions) (7) 1,367.8 1,446.2 1,058.7 Target Asset Pro Forma Marketing Adjusted EBITDA (In Millions) (2) 770.9 467.2 578.9 Target Asset Capital Expenditures (In Millions) 448.2 339.6 277.1 Target Asset Reconciliation of Non-GAAP Financial Measures (In Millions) Target Asset Income from Continuing Operations, Net of Income Taxes $ 1,899.1 $ 607.7 $ (284.6) Depreciation, Depletion and Amortization 369.8 486.2 433.2 Financing Costs, Net 109.8 139.4 206.6 Asset Impairment (441.5) - - Income Tax Provision (Benefit) 606.0 (19 .0) (85 .6) Target Asset Unadjusted EBITDA (5) 2,543.2 1,214.3 269.6 Non-Cash Costs / Special Items and Insurance Proceeds (358.9) (6.5) 14.9 Gain on Contingent Consideration (4.0) (11 .5) - AASB 16 Lease Costs (23 .7) (24 .6) - Provision for Grosvenor Losses - - 60.4 Transaction Costs Related to Business Combinations - - 249.8 Target Asset QoE Adjusted EBITDA (2) 2,156.6 1,171.7 594.7 Removal of Dawson and Jellinbah (934.9) (495.5) - Target Asset Pro Forma Adjusted EBITDA (2) 1,221.7 676.2 594.7 Removal of Grosvenor (450.8) (209.0) (355.2) Moranbah North Production Normalization Adjustment - - 239.4 Expected SG&A Cost Savings - - 100.0 Target Asset Pro Forma Marketing Adjusted EBITDA (2) $ 770.9 $ 467.2 $ 578.9 Target Asset Pro Forma Marketing Adjusted EBITDA (2) $ 770.9 $ 467.2 $ 578.9 Less: Capital Expenditures (448.2) (339.6) (277.1) Target Asset Free Cash Flow (6) $ 322.7 $ 127.6 $ 301.8 Note: The Target Asset data for the years ended December 31, 2022 and 2023 is based upon historical information provided by the seller. Refer to definitions and footnotes on slide 41. 39
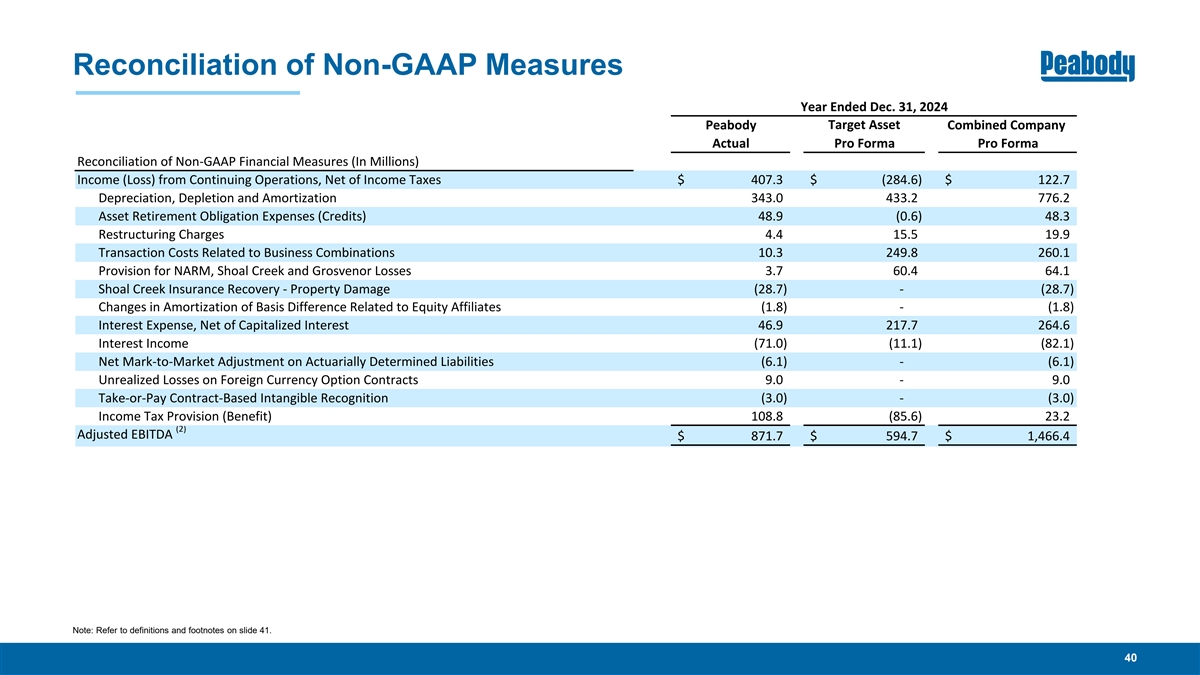
Reconciliation of Non-GAAP Measures Year Ended Dec. 31, 2024 Target Asset Peabody Combined Company Actual Pro Forma Pro Forma Reconciliation of Non-GAAP Financial Measures (In Millions) Income (Loss) from Continuing Operations, Net of Income Taxes $ 407.3 $ (284.6) $ 122.7 Depreciation, Depletion and Amortization 343.0 433.2 776.2 Asset Retirement Obligation Expenses (Credits) 48.9 (0.6) 48.3 Restructuring Charges 4.4 15.5 19.9 Transaction Costs Related to Business Combinations 10.3 249.8 260.1 Provision for NARM, Shoal Creek and Grosvenor Losses 3.7 60.4 64.1 Shoal Creek Insurance Recovery - Property Damage (28 .7) - (28 .7) Changes in Amortization of Basis Difference Related to Equity Affiliates (1.8) - (1.8) Interest Expense, Net of Capitalized Interest 46.9 217.7 264.6 Interest Income (71 .0) (11.1) (82 .1) Net Mark-to-Market Adjustment on Actuarially Determined Liabilities (6.1) - (6.1) Unrealized Losses on Foreign Currency Option Contracts 9.0 - 9.0 Take-or-Pay Contract-Based Intangible Recognition (3.0) - (3.0) Income Tax Provision (Benefit) 108.8 (85.6) 23.2 (2) Adjusted EBITDA $ 871.7 $ 594.7 $ 1,466.4 Note: Refer to definitions and footnotes on slide 41. 40
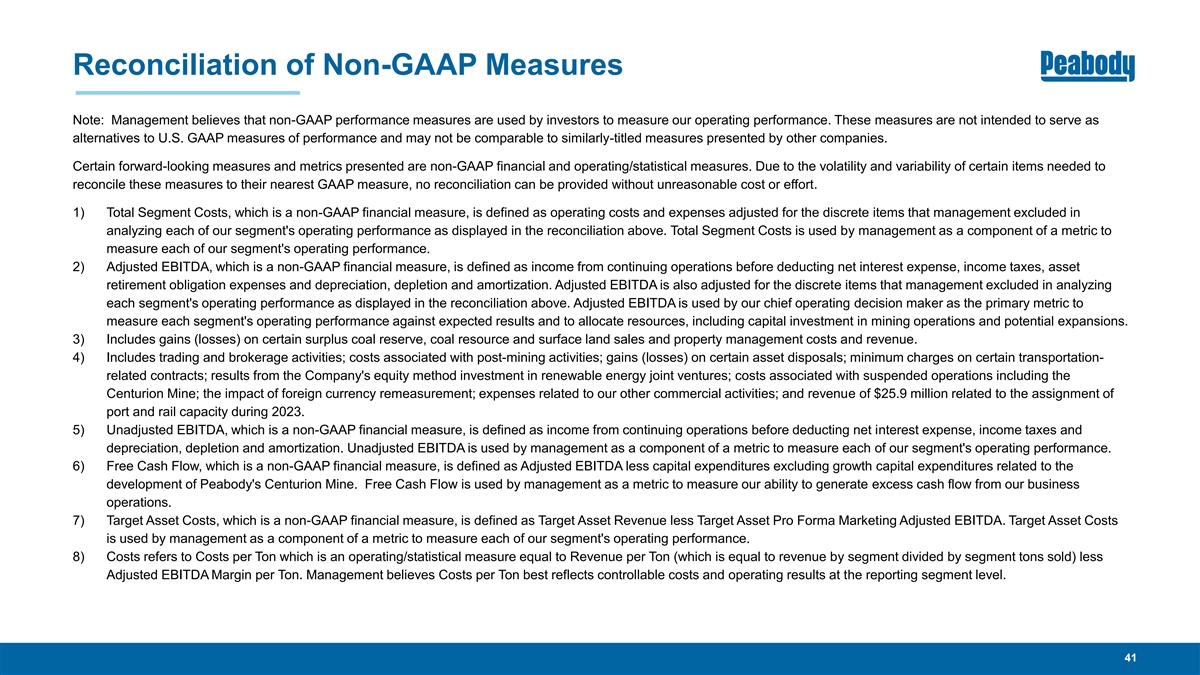
Reconciliation of Non-GAAP Measures Note: Management believes that non-GAAP performance measures are used by investors to measure our operating performance. These measures are not intended to serve as alternatives to U.S. GAAP measures of performance and may not be comparable to similarly-titled measures presented by other companies. Certain forward-looking measures and metrics presented are non-GAAP financial and operating/statistical measures. Due to the volatility and variability of certain items needed to reconcile these measures to their nearest GAAP measure, no reconciliation can be provided without unreasonable cost or effort. 1) Total Segment Costs, which is a non-GAAP financial measure, is defined as operating costs and expenses adjusted for the discrete items that management excluded in analyzing each of our segment's operating performance as displayed in the reconciliation above. Total Segment Costs is used by management as a component of a metric to measure each of our segment's operating performance. 2) Adjusted EBITDA, which is a non-GAAP financial measure, is defined as income from continuing operations before deducting net interest expense, income taxes, asset retirement obligation expenses and depreciation, depletion and amortization. Adjusted EBITDA is also adjusted for the discrete items that management excluded in analyzing each segment's operating performance as displayed in the reconciliation above. Adjusted EBITDA is used by our chief operating decision maker as the primary metric to measure each segment's operating performance against expected results and to allocate resources, including capital investment in mining operations and potential expansions. 3) Includes gains (losses) on certain surplus coal reserve, coal resource and surface land sales and property management costs and revenue. 4) Includes trading and brokerage activities; costs associated with post-mining activities; gains (losses) on certain asset disposals; minimum charges on certain transportation- related contracts; results from the Company's equity method investment in renewable energy joint ventures; costs associated with suspended operations including the Centurion Mine; the impact of foreign currency remeasurement; expenses related to our other commercial activities; and revenue of $25.9 million related to the assignment of port and rail capacity during 2023. 5) Unadjusted EBITDA, which is a non-GAAP financial measure, is defined as income from continuing operations before deducting net interest expense, income taxes and depreciation, depletion and amortization. Unadjusted EBITDA is used by management as a component of a metric to measure each of our segment's operating performance. 6) Free Cash Flow, which is a non-GAAP financial measure, is defined as Adjusted EBITDA less capital expenditures excluding growth capital expenditures related to the development of Peabody's Centurion Mine. Free Cash Flow is used by management as a metric to measure our ability to generate excess cash flow from our business operations. 7) Target Asset Costs, which is a non-GAAP financial measure, is defined as Target Asset Revenue less Target Asset Pro Forma Marketing Adjusted EBITDA. Target Asset Costs is used by management as a component of a metric to measure each of our segment's operating performance. 8) Costs refers to Costs per Ton which is an operating/statistical measure equal to Revenue per Ton (which is equal to revenue by segment divided by segment tons sold) less Adjusted EBITDA Margin per Ton. Management believes Costs per Ton best reflects controllable costs and operating results at the reporting segment level. 41