F I R S T B U S E Y C O R P O R A T I O N
A N N O U N C E S
2 0 2 5
T H I R D
Q U A R T E R
E A R N I N G S
Q 3 | 2 0 2 5
| | | | | |
| www.busey.com |
| INVESTOR CONTACT: Christopher H.M. Chan, Chief Financial Officer | 913-647-9825 |
LEAWOOD, KS, October 28, 2025 (GLOBE NEWSWIRE) – First Busey Corporation (Nasdaq: BUSE) Announces 2025 Third Quarter Earnings.
| | | | | | | | | | | | | | | | | | | | | | | | | | |
Net Income | | Diluted EPS | | Net Interest Margin(1) | | ROAA(1) | | ROATCE(1) |
$57.1 million $62.5 million (adj)(2) | | $0.58 $0.64 (adj)(2) | | 3.58% 3.45% (adj)(2) | | 1.21% 1.33% (adj)(2) | | 11.96% 13.20% (adj)(2) |
| | | | | | | | | | | |
MESSAGE FROM OUR CHAIRMAN & CEO | | CONTENTS | |
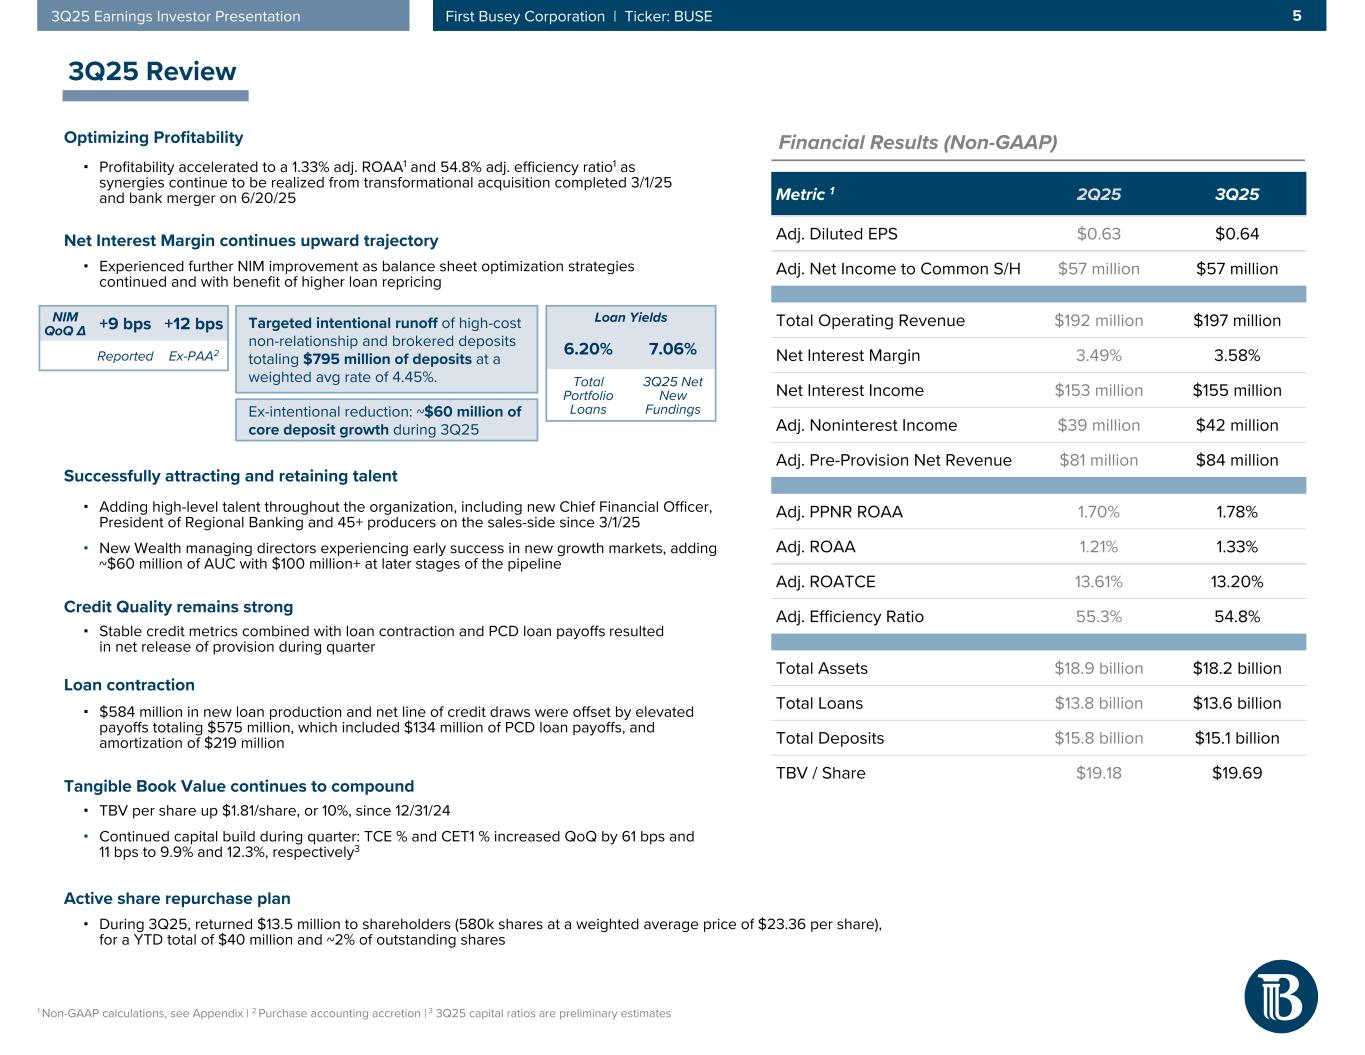
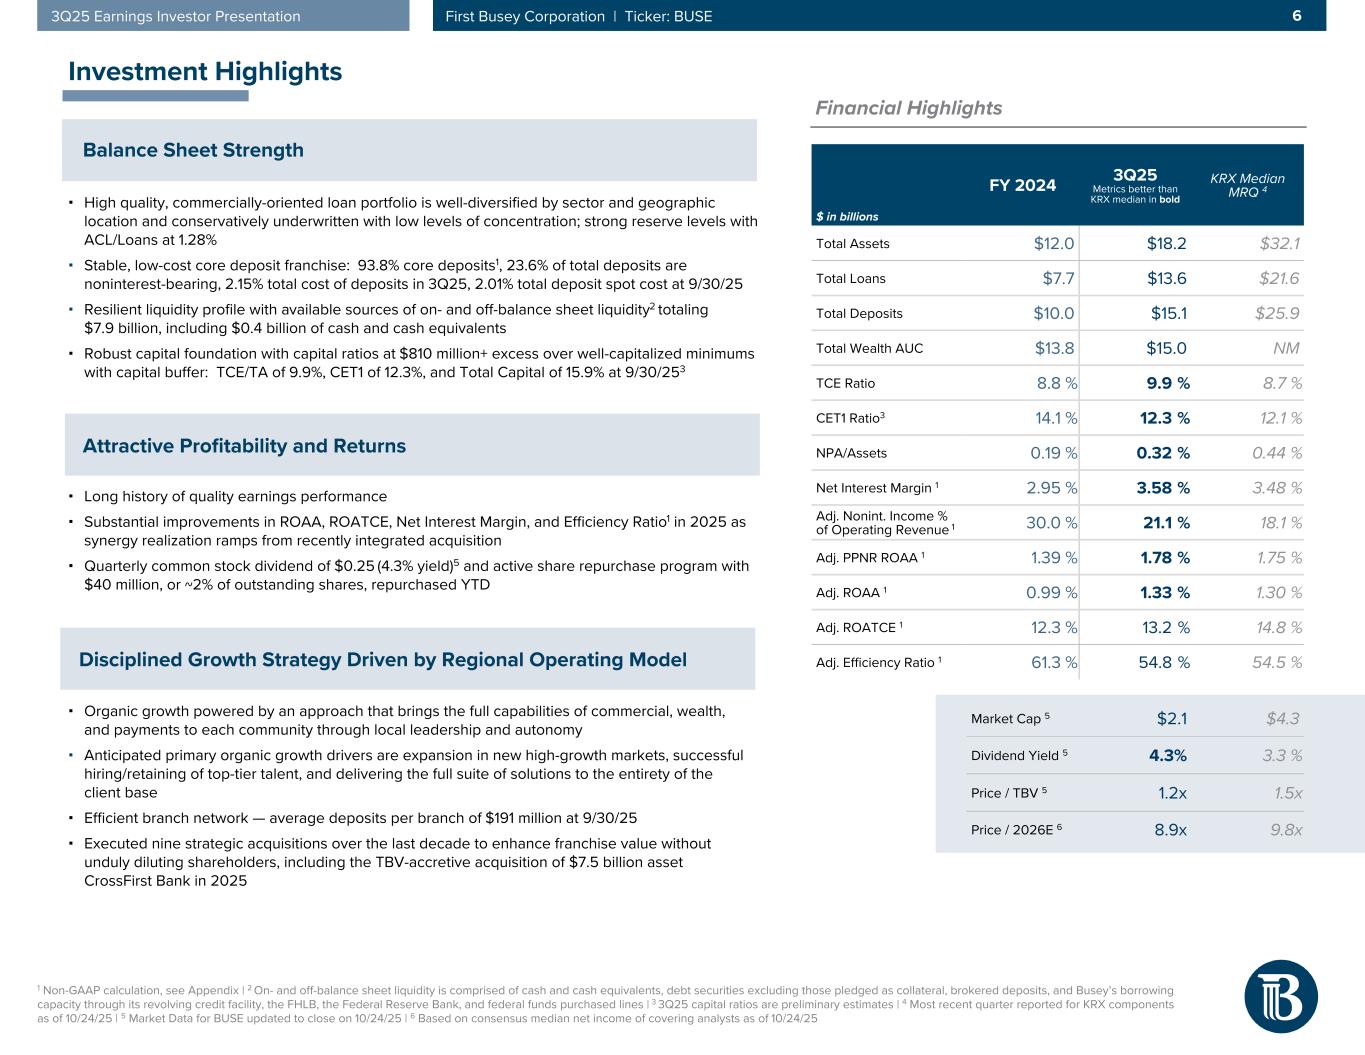
We continued to optimize our balance sheet to be more efficient and profitable with adjusted return on average assets(2) improving to 1.33% and net interest margin(2) expanding 9 basis points to 3.58% in the third quarter, driven by the intentional runoff of $794.6 million high-cost, non-relationship deposits with a weighted average cost of 4.45%. Deposit costs continued to fall as spot deposit cost at the end of the quarter improved 21 basis points to 2.01%, an 84% beta versus the September rate cut. Capital remained strong and Common Equity Tier 1 Capital(3) grew to 12.33%. Tangible common equity to tangible assets(2) grew to 9.9%, with tangible book value per common share(2) increasing 10.1% since year end even as we continued to repurchase stock at attractive levels. Credit quality showed improvement with classified assets as a percentage of capital falling to 7.0% and net charge-offs at 0.17%. Loan balances fell modestly as higher than anticipated payoffs impacted the quarter. As we look ahead to the end of the year, we expect our balance sheet optimization to be largely complete and for relative stability in loans and deposits as we continue to execute on our disciplined organic growth strategy.
Van A. Dukeman Chairman and Chief Executive Officer | | | |
| | |
| | |
| | |
| | |
| | |
| | |
| | |
FINANCIAL RESULTS
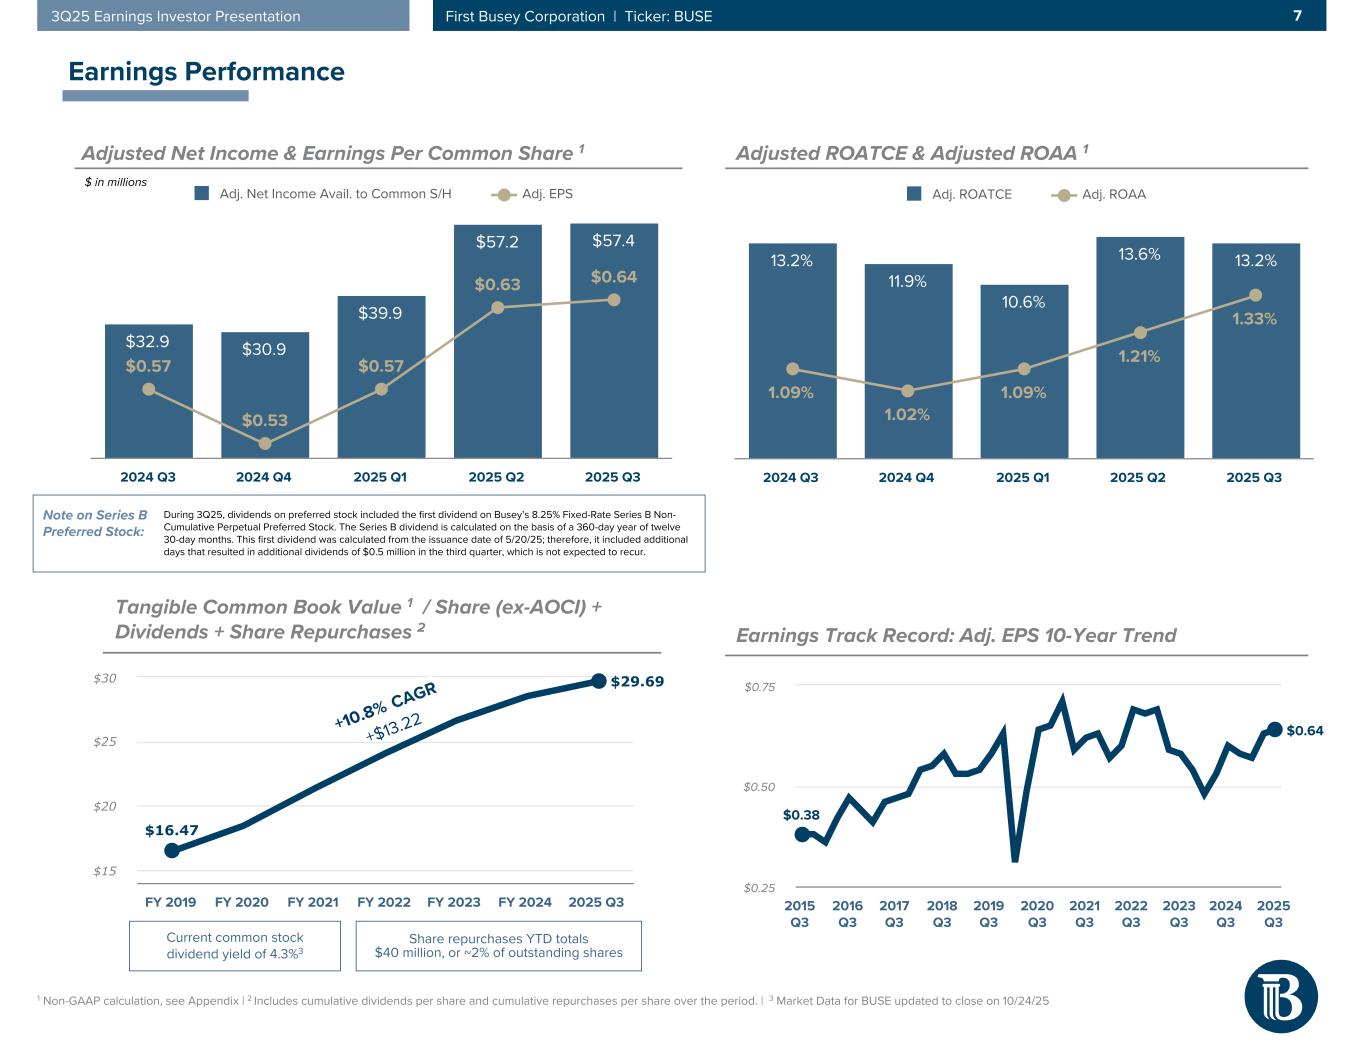
Third quarter 2025 net income for First Busey Corporation, together with its consolidated subsidiaries (“Busey,” the “Company,” “we,” “us,”, or “our”) was $57.1 million, or $0.58 per diluted common share, compared to $47.4 million, or $0.52 per diluted common share, for the second quarter of 2025, and $32.0 million, or $0.55 per diluted common share, for the third quarter of 2024. Annualized return on average assets and annualized return on average tangible common equity(2) were 1.21% and 11.96%, respectively, for the third quarter of 2025.
First Busey Corporation (BUSE) | 2025 Q3 — 2
| | | | | | | | | | | | | | | | | | | | | | | | | | | | | | | | |
CONDENSED CONSOLIDATED STATEMENTS OF INCOME (unaudited) |
| | | | | | | | | | |
| | Three Months Ended | | Nine Months Ended |
| (dollars in thousands, except per share amounts) | | September 30,
2025 | | June 30,
2025 | | September 30,
2024 | | September 30,
2025 | | September 30,
2024 |
Total interest income | | $ | 244,505 | | | $ | 247,446 | | | $ | 134,606 | | | $ | 658,766 | | | $ | 392,365 | |
Total interest expense | | 89,368 | | | 94,263 | | | 51,959 | | | 246,715 | | | 151,332 | |
Net interest income | | 155,137 | | | 153,183 | | | 82,647 | | | 412,051 | | | 241,033 | |
Provision for credit losses1 | | (985) | | | 5,700 | | | 409 | | | 50,308 | | | 6,677 | |
Net interest income after provision for credit losses1 | | 156,122 | | | 147,483 | | | 82,238 | | | 361,743 | | | 234,356 | |
Total noninterest income | | 41,198 | | | 44,863 | | | 35,845 | | | 107,284 | | | 104,461 | |
Total noninterest expense1 | | 120,018 | | | 127,833 | | | 75,519 | | | 359,881 | | | 222,872 | |
Income before income taxes | | 77,302 | | | 64,513 | | | 42,564 | | | 109,146 | | | 115,945 | |
Income taxes | | 20,204 | | | 17,109 | | | 10,560 | | | 34,634 | | | 30,359 | |
Net income | | 57,098 | | | 47,404 | | | 32,004 | | | 74,512 | | | 85,586 | |
| Dividends on preferred stock | | 5,131 | | | 155 | | | — | | | 5,286 | | | — | |
| Net income available to common stockholders | | $ | 51,967 | | | $ | 47,249 | | | $ | 32,004 | | | $ | 69,226 | | | $ | 85,586 | |
| | | | | | | | | | |
Basic earnings per common share | | $ | 0.58 | | | $ | 0.53 | | | $ | 0.56 | | | $ | 0.84 | | | $ | 1.52 | |
Diluted earnings per common share | | $ | 0.58 | | | $ | 0.52 | | | $ | 0.55 | | | $ | 0.83 | | | $ | 1.49 | |
Effective income tax rate | | 26.14 | % | | 26.52 | % | | 24.81 | % | | 31.73 | % | | 26.18 | % |
___________________________________________
1.Beginning in the second quarter of 2025, Busey revised its presentation, for all periods presented, to reclassify the provision for unfunded commitments so that it is now included within the provision for credit losses; therefore, it is no longer included within total noninterest expense.
Busey views certain non-operating items, including acquisition-related expenses, restructuring charges, and nonrecurring strategic events, as adjustments to net income reported under U.S. generally accepted accounting principles ("GAAP"). We also adjust for net securities gains and losses to align with industry and research analyst reporting. The objective of our presentation of adjusted earnings and adjusted earnings metrics is to allow investors and analysts to more clearly identify quarterly trends in core earnings performance. Pre-tax non-GAAP adjustments were as follows:
| | | | | | | | | | | | | | | | | | | | | | | | | | | | | | | | |
| | Three Months Ended September 30, | | Nine Months Ended September 30, |
| (dollars in thousands) | | September 30,
2025 | | June 30,
2025 | | September 30,
2024 | | September 30,
2025 | | September 30,
2024 |
| Pre-tax non-GAAP adjusting items | | | | | | | | | | |
| Realized net (gains) losses on the sale of mortgage servicing rights | | $ | — | | | $ | — | | | $ | 18 | | | $ | — | | | $ | (7,724) | |
| Net securities (gains) losses | | 288 | | | (5,997) | | | (822) | | | 10,059 | | | 5,906 | |
| Other noninterest income | | 44 | | | — | | | — | | | 44 | | | — | |
| Provision for credit losses | | — | | | 4,030 | | | — | | | 49,602 | | | — | |
| Salaries, wages, and employee benefits | | 5,610 | | | 11,557 | | | 73 | | | 33,045 | | | 1,333 | |
| Data processing | | 424 | | | 3,964 | | | 90 | | | 6,690 | | | 534 | |
| Net occupancy expense of premises | | 9 | | | — | | | — | | | 9 | | | 5 | |
| Furniture and equipment expenses | | 66 | | | 1 | | | 27 | | | 67 | | | 88 | |
| Professional fees | | 358 | | | 317 | | | 1,371 | | | 7,969 | | | 1,908 | |
| Other noninterest expense | | 740 | | | 761 | | | 374 | | | 2,053 | | | 687 | |
| Total pre-tax non-GAAP adjustments | | $ | 7,539 | | | $ | 14,633 | | | $ | 1,131 | | | $ | 109,538 | | | $ | 2,737 | |
| | | | | | | | | | |
| | | | | | | | | | |
| | | | | | | | | | |
| | | | | | | | | | |
| | | | | | | | | | |
| | | | | | | | | | |
| | | | | | | | | | |
| | | | | | | | | | |
| | | | | | | | | | |
| | | | | | | | | | |
| | | | | | | | | | |
| | | | | | | | | | |
| | | | | | | | | | |
| | | | | | | | | | |
| | | | | | | | | | |
For more information and a reconciliation of non-GAAP measures—which are identified with the End Note labeled as (2)—in tabular form, see "Non-GAAP Financial Information" beginning on page 14. First Busey Corporation (BUSE) | 2025 Q3 — 3
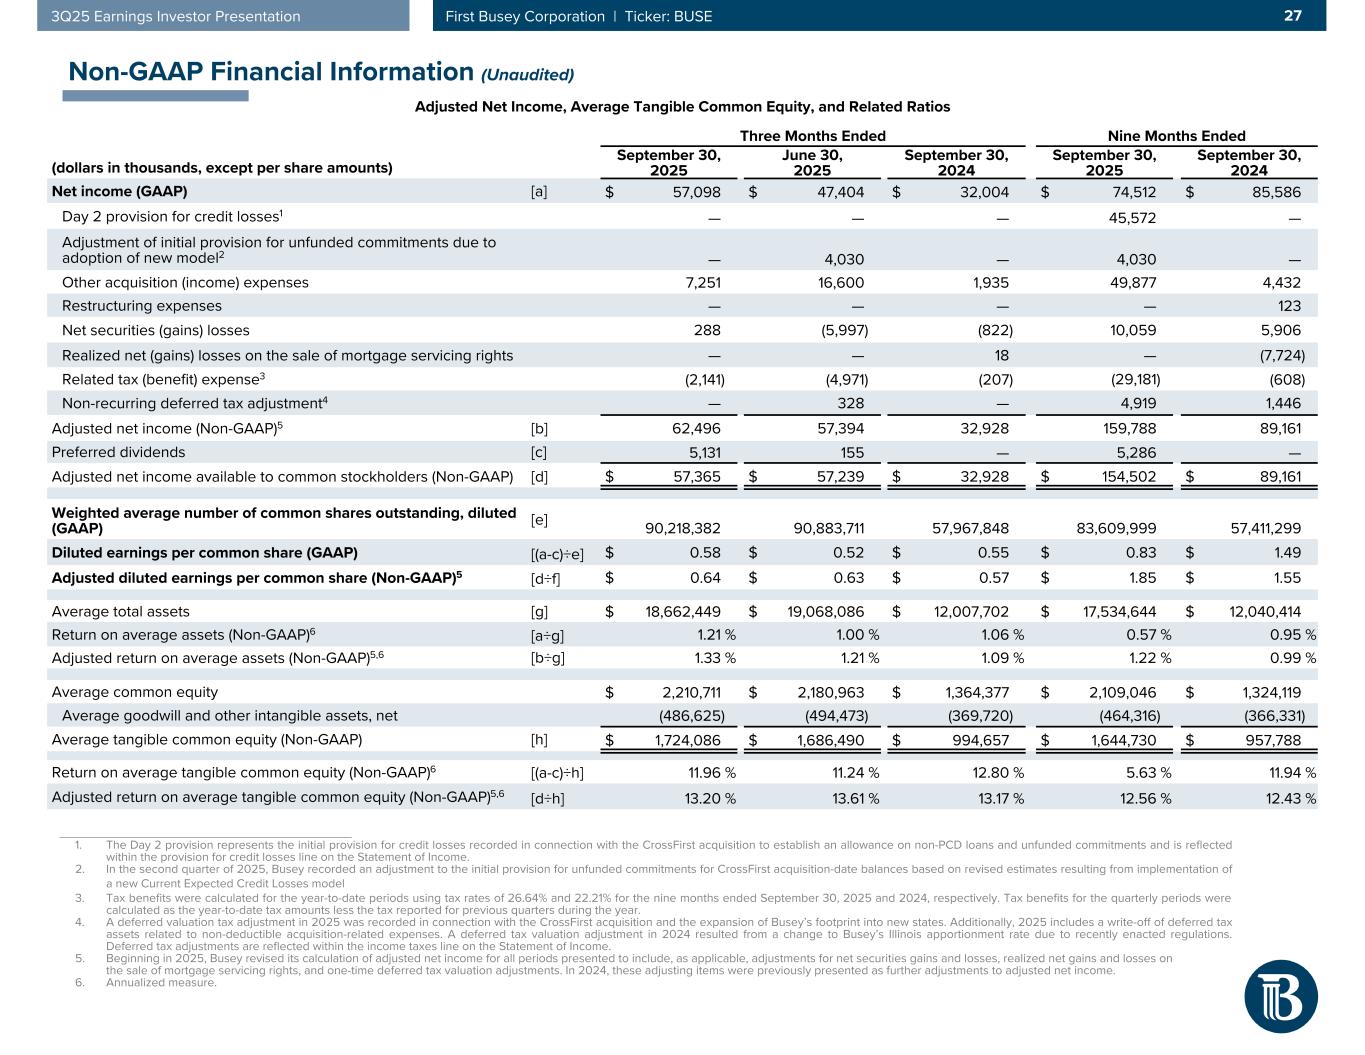
Adjusted net income available to common stockholders,(2) which excludes the impact of non-GAAP adjustments, was $57.4 million, or $0.64 per diluted common share, for the third quarter of 2025, compared to $57.2 million, or $0.63 per diluted common share, for the second quarter of 2025 and $32.9 million, or $0.57 per diluted common share, for the third quarter of 2024. Annualized adjusted return on average assets(2) and annualized adjusted return on average tangible common equity(2) were 1.33% and 13.20%, respectively, for the third quarter of 2025.
During the third quarter of 2025, dividends on preferred stock included the first dividend on Busey’s 8.25% Fixed-Rate Series B Non-Cumulative Perpetual Preferred Stock (“Series B Preferred Stock”). Based on the Certificate of Designation, dividends on the Series B Preferred Stock are calculated on the basis of a 360-day year of twelve 30-day months. This first dividend was calculated from the issuance date of May 20, 2025; therefore, it included additional days that resulted in additional dividends of $0.5 million in the third quarter, which is not expected to recur. Pre-Provision Net Revenue(2)
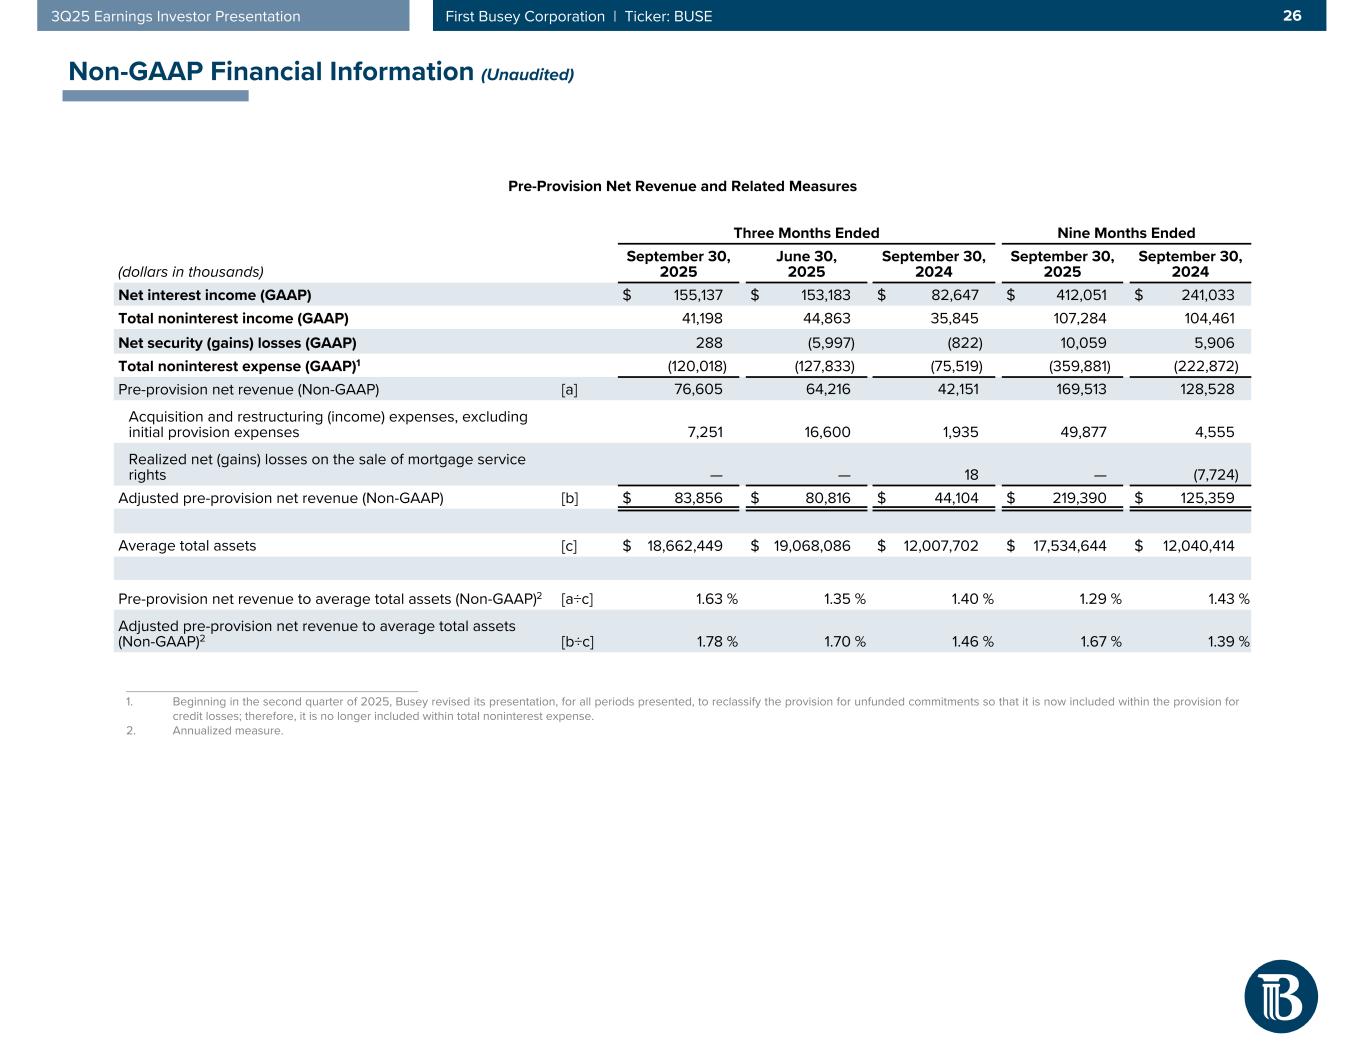
Pre-provision net revenue(2) was $76.6 million for the third quarter of 2025, compared to $64.2 million for the second quarter of 2025 and $42.2 million for the third quarter of 2024. Pre-provision net revenue to average assets(2) was 1.63% for the third quarter of 2025, compared to 1.35% for the second quarter of 2025, and 1.40% for the third quarter of 2024.
Adjusted pre-provision net revenue(2) was $83.9 million for the third quarter of 2025, compared to $80.8 million for the second quarter of 2025 and $44.1 million for the third quarter of 2024. Adjusted pre-provision net revenue to average assets(2) was 1.78% for the third quarter of 2025, compared to 1.70% for the second quarter of 2025 and 1.46% for the third quarter of 2024.
First Busey Corporation (BUSE) | 2025 Q3 — 4
Net Interest Income and Net Interest Margin(2)
Busey’s average balances, annualized yield rates, and net interest margins are presented in the tables below:
| | | | | | | | | | | | | | | | | | | | | | | | | | | | | | | | | | | | | | | | | | | | |
| | Three Months Ended |
| | September 30, 2025 | | June 30, 2025 | | September 30, 2024 |
| (dollars in thousands) | | Average
Balance | | | | Yield/
Rate4 | | Average
Balance | | | | Yield/
Rate4 | | Average
Balance | | | | Yield/
Rate4 |
Assets | | | | | | | | | | | | | | | | | | |
Interest-bearing bank deposits and federal funds sold | | $ | 489,730 | | | | | 4.45 | % | | $ | 711,629 | | | | | 4.21 | % | | $ | 389,005 | | | | | 5.21 | % |
Investment securities1 | | 2,963,467 | | | | | 3.24 | % | | 3,083,284 | | | | | 3.31 | % | | 2,666,269 | | | | | 2.71 | % |
Restricted bank stock | | 77,041 | | | | | 4.49 | % | | 58,354 | | | | | 3.73 | % | | 6,134 | | | | | 6.87 | % |
Loans held for sale | | 9,895 | | | | | 6.21 | % | | 6,899 | | | | | 5.93 | % | | 11,539 | | | | | 6.45 | % |
Portfolio loans1, 2 | | 13,732,229 | | | | | 6.20 | % | | 13,840,190 | | | | | 6.22 | % | | 7,869,798 | | | | | 5.63 | % |
Total interest-earning assets1 | | 17,272,362 | | | | | 5.63 | % | | 17,700,356 | | | | | 5.63 | % | | 10,942,745 | | | | | 4.91 | % |
Noninterest-earning assets | | 1,390,087 | | | | | | | 1,367,730 | | | | | | | 1,064,957 | | | | | |
Total assets | | $ | 18,662,449 | | | | | | | $ | 19,068,086 | | | | | | | $ | 12,007,702 | | | | | |
| | | | | | | | | | | | | | | | | | |
Liabilities and stockholders’ equity | | | | | | | | | | | | | | | | | | |
Interest-bearing transaction deposits | | $ | 3,256,326 | | | | | 1.97 | % | | $ | 3,188,993 | | | | | 1.92 | % | | $ | 2,485,443 | | | | | 1.88 | % |
Savings and money market deposits | | 6,199,404 | | | | | 2.84 | % | | 6,381,634 | | | | | 2.88 | % | | 3,294,396 | | | | | 2.44 | % |
Time deposits | | 2,545,749 | | | | | 3.75 | % | | 2,879,902 | | | | | 3.77 | % | | 1,517,082 | | | | | 3.86 | % |
Federal funds purchased and repurchase agreements | | 150,260 | | | | | 2.58 | % | | 141,978 | | | | | 2.50 | % | | 132,688 | | | | | 2.94 | % |
Borrowings3 | | 266,643 | | | | | 5.63 | % | | 392,508 | | | | | 5.34 | % | | 301,850 | | | | | 5.73 | % |
Total interest-bearing liabilities | | 12,418,382 | | | | | 2.86 | % | | 12,985,015 | | | | | 2.91 | % | | 7,731,459 | | | | | 2.67 | % |
Noninterest-bearing deposits | | 3,578,164 | | | | | | | 3,542,617 | | | | | | | 2,706,858 | | | | | |
Other liabilities | | 239,995 | | | | | | | 255,872 | | | | | | | 205,008 | | | | | |
Stockholders’ equity | | 2,425,908 | | | | | | | 2,284,582 | | | | | | | 1,364,377 | | | | | |
Total liabilities and stockholders’ equity | | $ | 18,662,449 | | | | | | | $ | 19,068,086 | | | | | | | $ | 12,007,702 | | | | | |
| | | | | | | | | | | | | | | | | | |
| | | | | | | | | | | | | | | | | | |
| | | | | | | | | | | | | | | | | | |
Net interest margin1, 5 | | | | | | 3.58 | % | | | | | | 3.49 | % | | | | | | 3.02 | % |
___________________________________________
1.On a tax-equivalent basis and assuming a federal income tax rate of 21.0%.
2.Non-accrual loans have been included in average portfolio loans.
3.Includes, as applicable, short-term borrowings, long-term borrowings, subordinated notes, and junior subordinated debt owed to unconsolidated trusts.
4.Annualized.
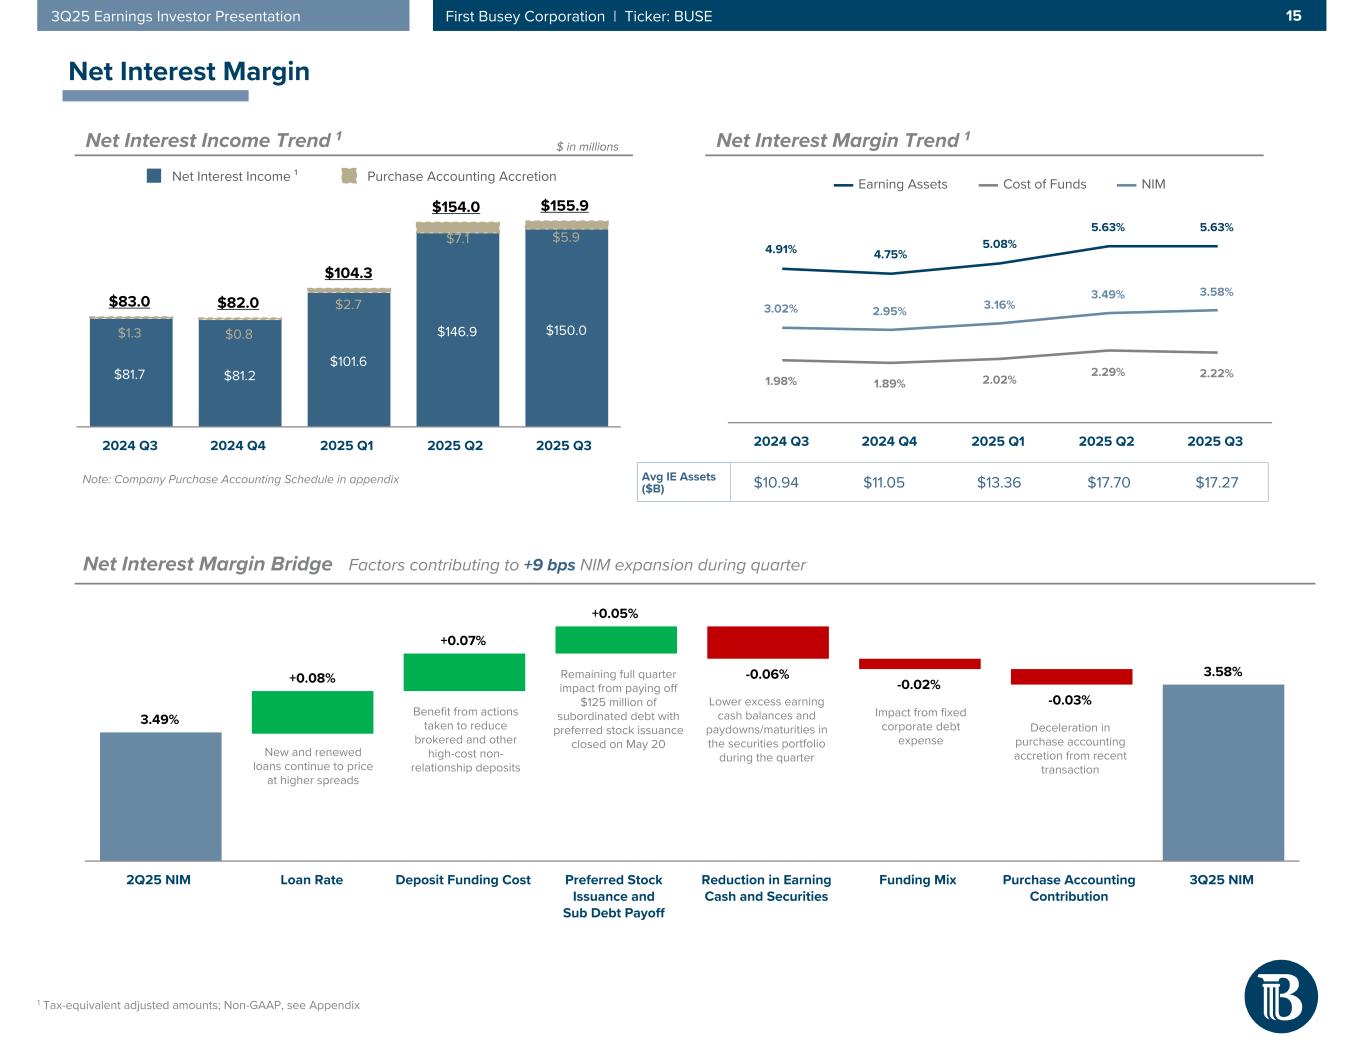
Components of the 9 basis point increase in net interest margin(2) during the third quarter of 2025 were as follows:
•New and renewed loans continued to price at higher spreads, contributing +8 basis points
•Reduced funding costs on deposits, as we benefited from actions taken to reduce high-cost, non-relationship deposits, contributed +7 basis points
•Remaining benefit from the May 20, 2025, issuance of preferred stock and the June 1, 2025, subordinated debt redemption contributed +5 basis points
•Reduced rates and volume on cash and securities portfolio contributed -6 basis points
•Reduced purchase accounting accretion contributed -3 basis points
•Impact of fixed borrowing expenses contributed -2 basis points
First Busey Corporation (BUSE) | 2025 Q3 — 5
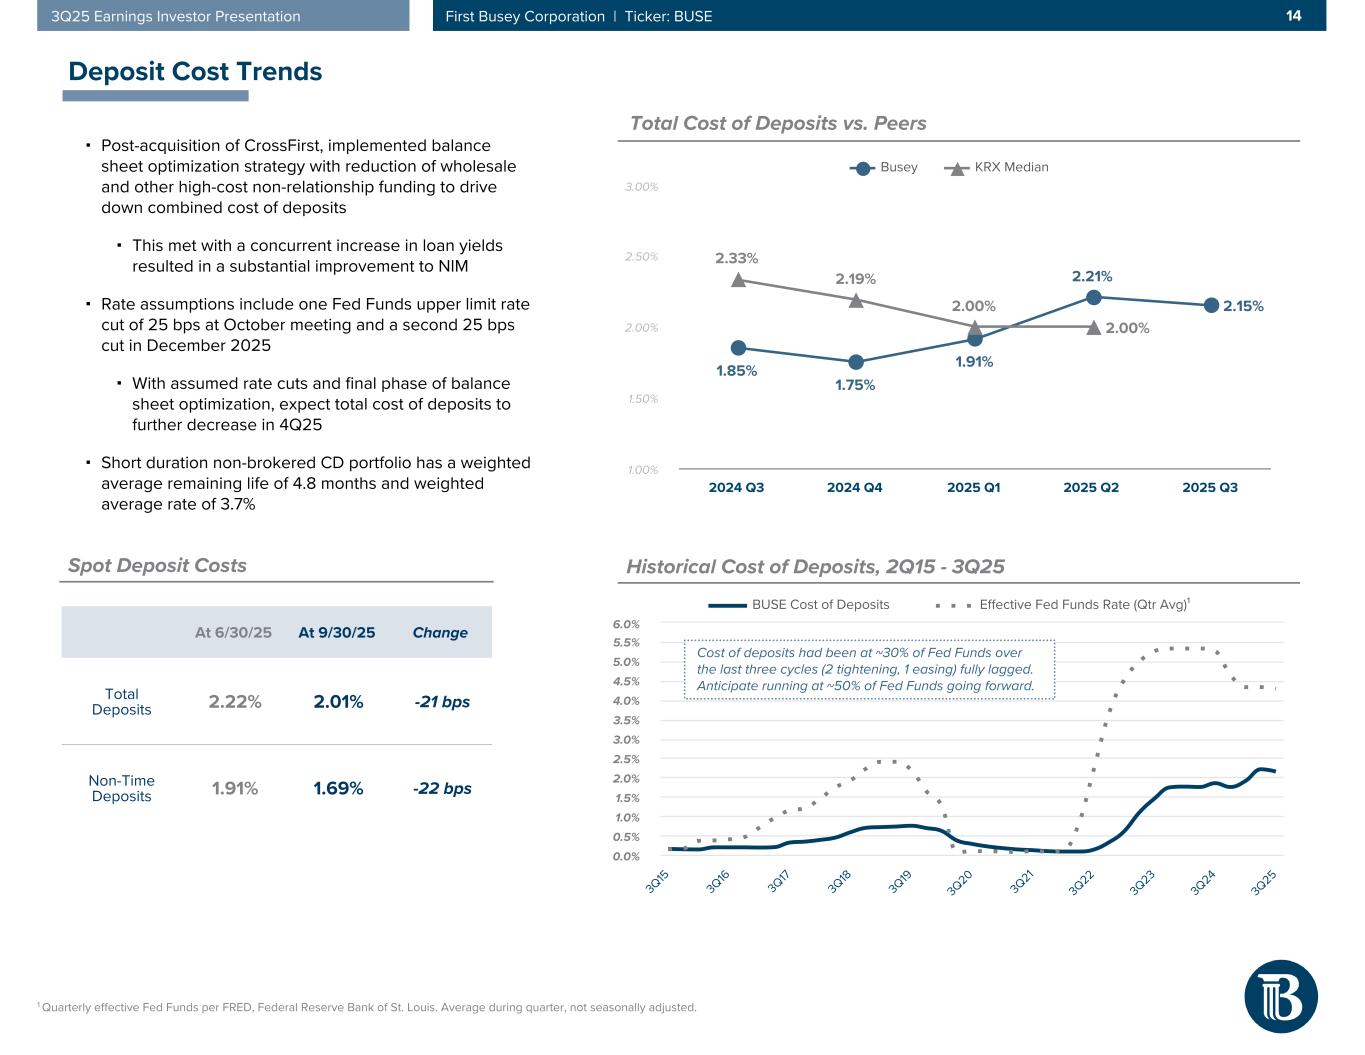
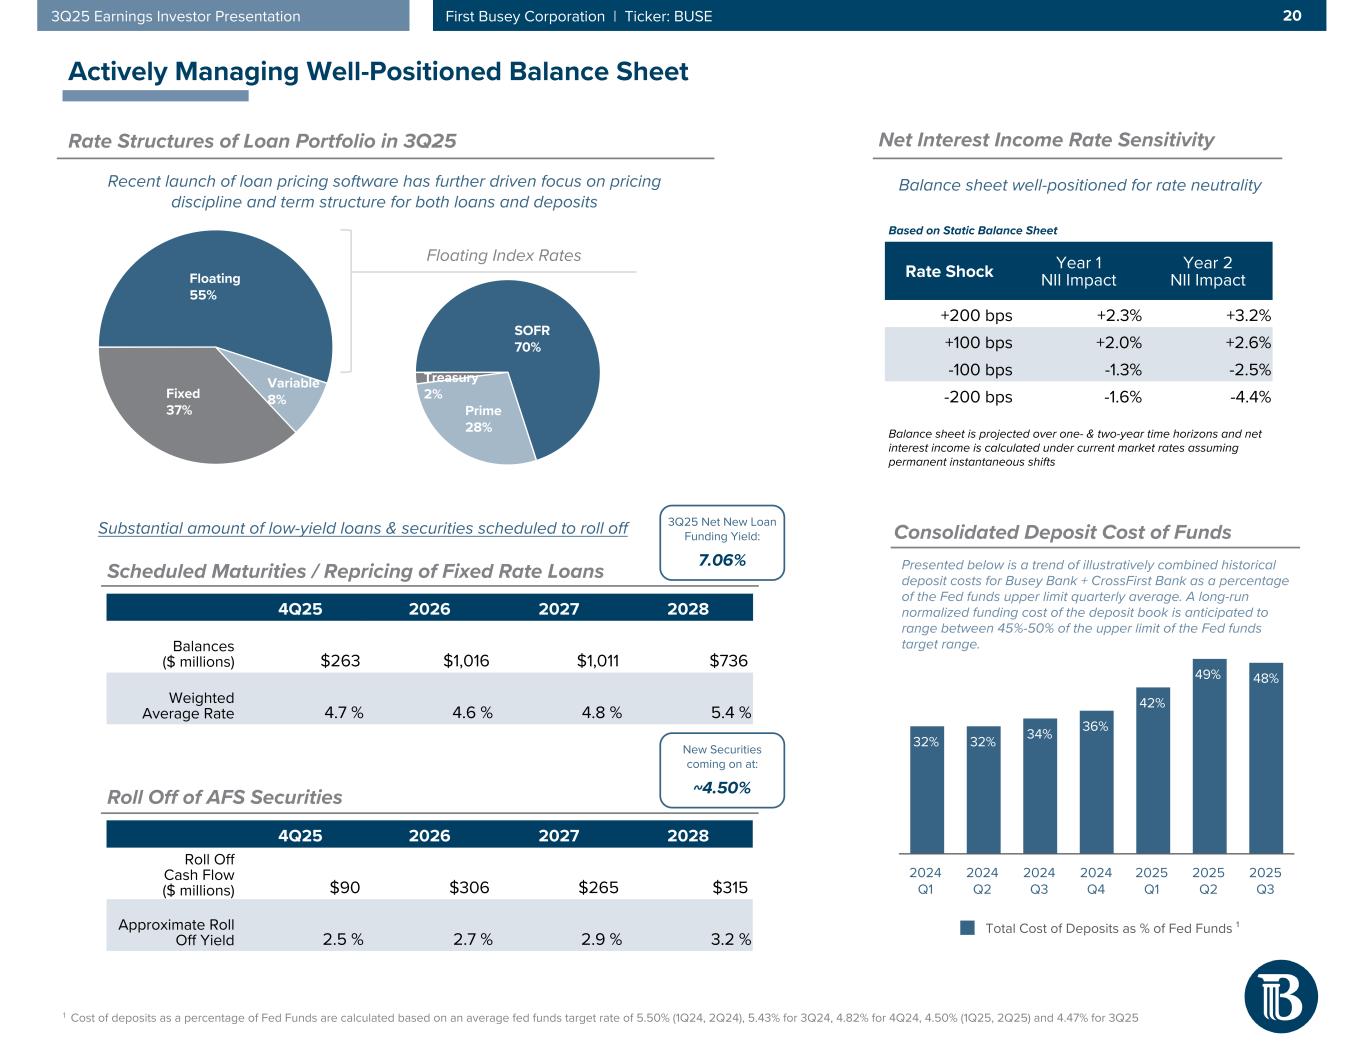
Based on our most recent Asset Liability Management Committee model, a -100 basis point parallel rate shock is expected to decrease net interest income by 1.3% (relative to a current base rate scenario) over the subsequent twelve-month period. Busey continues to evaluate and execute off-balance sheet hedging and balance sheet strategies as well as embedding rate protection in our asset originations to provide stabilization to net interest income in lower rate environments. Stability in core deposit balances as well as retail time deposit and savings specials have continued to provide sufficient funding flows to allow intentional runoff of brokered and high-cost, non-relationship funding with no incremental short-term borrowing during the quarter. This strategic targeted reduction of $794.6 million deposits bearing a weighted average cost of 4.45% included $228.2 million of brokered deposits. At September 30, 2025, the Bank had $125.4 million, or 0.8% of total deposits, of remaining brokered funding. Total deposit cost of funds decreased, as expected, from 2.21% during the second quarter of 2025 to 2.15% during the third quarter of 2025. At September 30, 2025, our spot rate on total deposits costs was 2.01%, compared to 2.22% at June 30, 2025.
Noninterest Income
| | | | | | | | | | | | | | | | | | | | | | | | | | | | | |
| Three Months Ended | | Nine Months Ended |
| (dollars in thousands) | September 30,
2025 | | June 30,
2025 | | September 30,
2024 | | September 30,
2025 | | September 30,
2024 |
NONINTEREST INCOME | | | | | | | | | |
Wealth management fees | $ | 17,184 | | | $ | 16,777 | | | $ | 15,378 | | | $ | 51,325 | | | $ | 46,844 | |
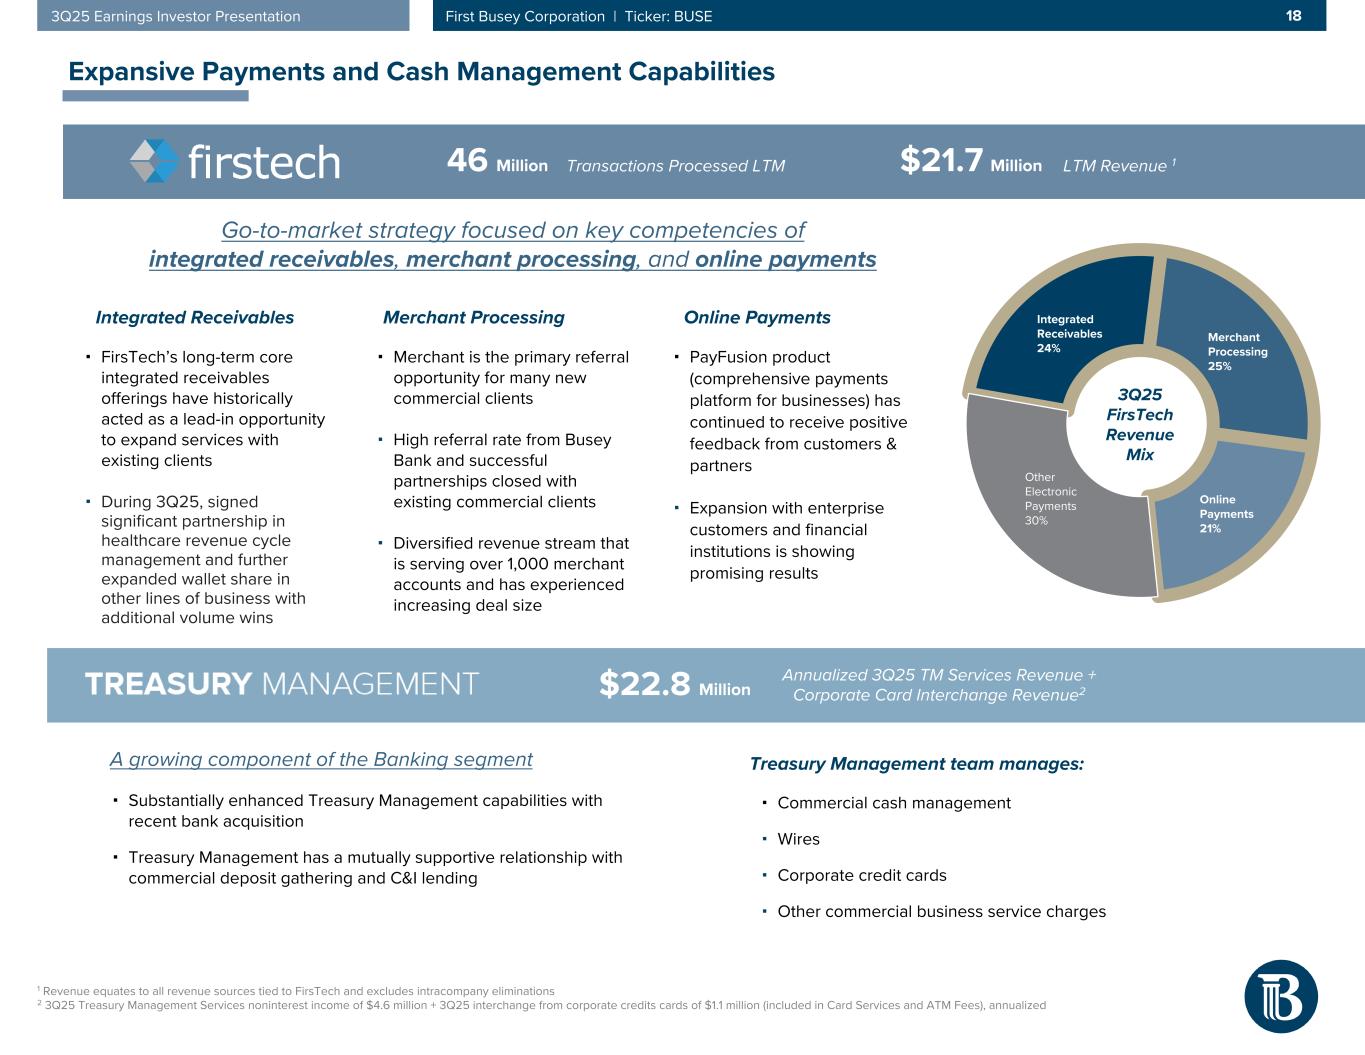
Payment technology solutions | 5,092 | | | 4,956 | | | 5,265 | | | 15,121 | | | 16,889 | |
Treasury management services | 4,598 | | | 4,981 | | | 2,201 | | | 12,596 | | | 6,247 | |
Card services and ATM fees | 4,799 | | | 4,880 | | | 3,557 | | | 13,388 | | | 9,947 | |
Other service charges on deposit accounts | 1,617 | | | 1,513 | | | 2,390 | | | 4,663 | | | 7,059 | |
Mortgage revenue | 657 | | | 776 | | | 355 | | | 1,762 | | | 1,579 | |
Income on bank owned life insurance | 1,623 | | | 1,745 | | | 1,189 | | | 4,814 | | | 4,050 | |
Realized net gains (losses) on the sale of mortgage servicing rights | — | | | — | | | (18) | | | — | | | 7,724 | |
Net securities gains (losses) | (288) | | | 5,997 | | | 822 | | | (10,059) | | | (5,906) | |
Other noninterest income | 5,916 | | | 3,238 | | | 4,706 | | | 13,674 | | | 10,028 | |
Total noninterest income | $ | 41,198 | | | $ | 44,863 | | | $ | 35,845 | | | $ | 107,284 | | | $ | 104,461 | |
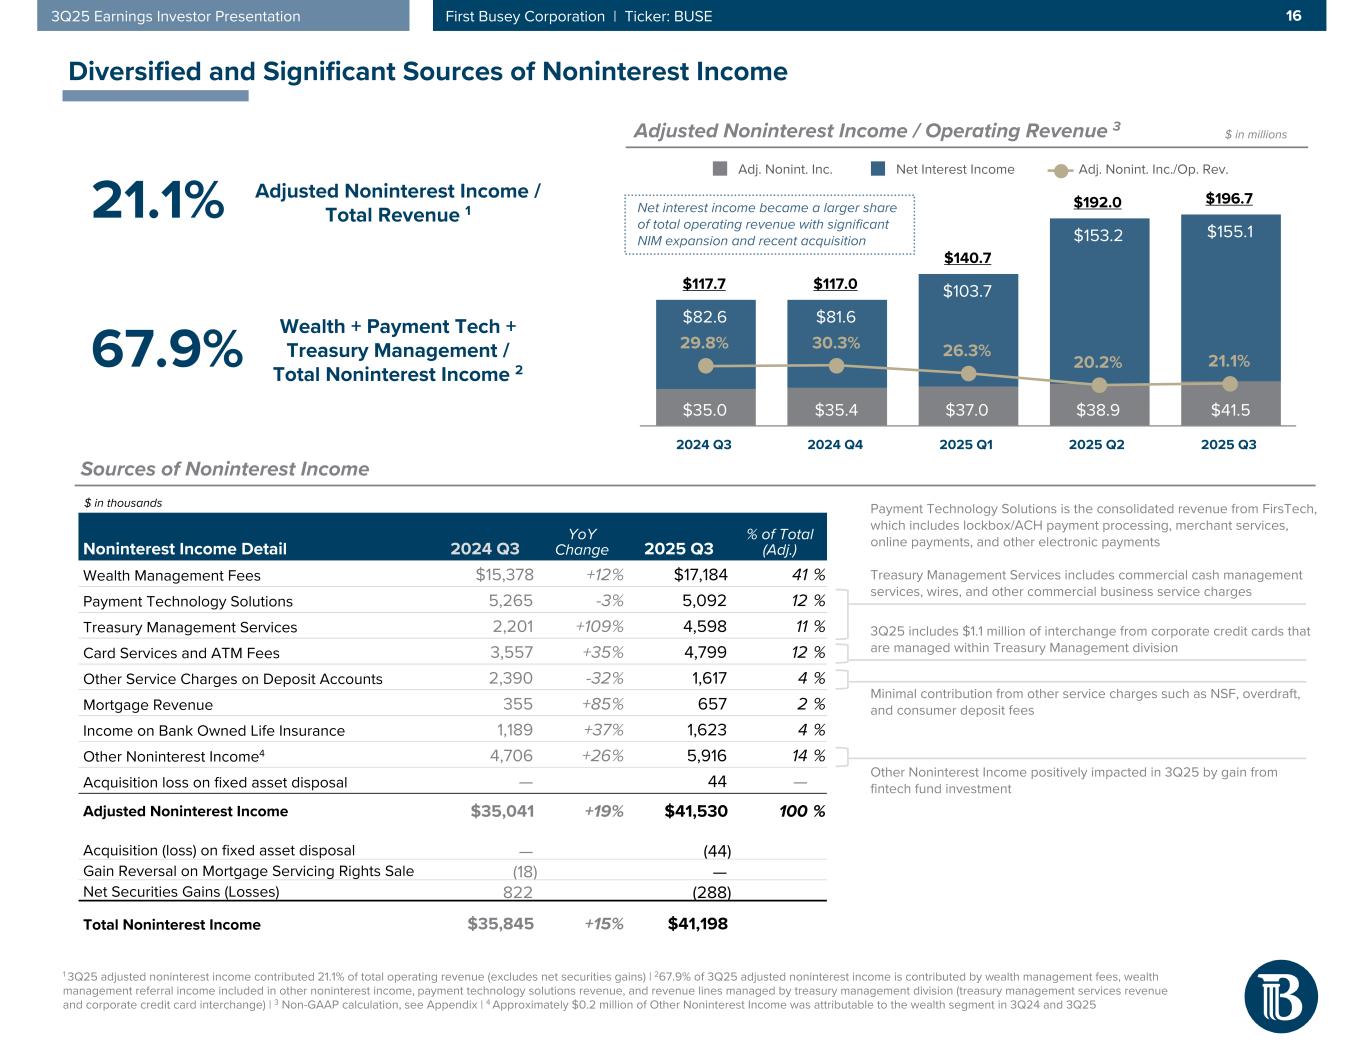
Total noninterest income decreased by 8.2% compared to the second quarter of 2025 primarily due to a decrease in gains on net securities, as Busey recorded a second quarter gain on its approximately 3% equity ownership of a financial institution that was the target of an announced acquisition at a significant market premium. Compared to the third quarter of 2024, total noninterest income increased by 14.9% as we benefit from the CrossFirst acquisition and extend services into new markets.
Busey continues to benefit from its diverse set of product offerings. Wealth management fees, wealth management referral fees included in other noninterest income, payment technology solutions, treasury management services, and corporate credit card interchange income contributed 67.9% of noninterest income excluding net securities gains and losses(2) for the third quarter of 2025.
Noteworthy changes in noninterest income during the quarter include:
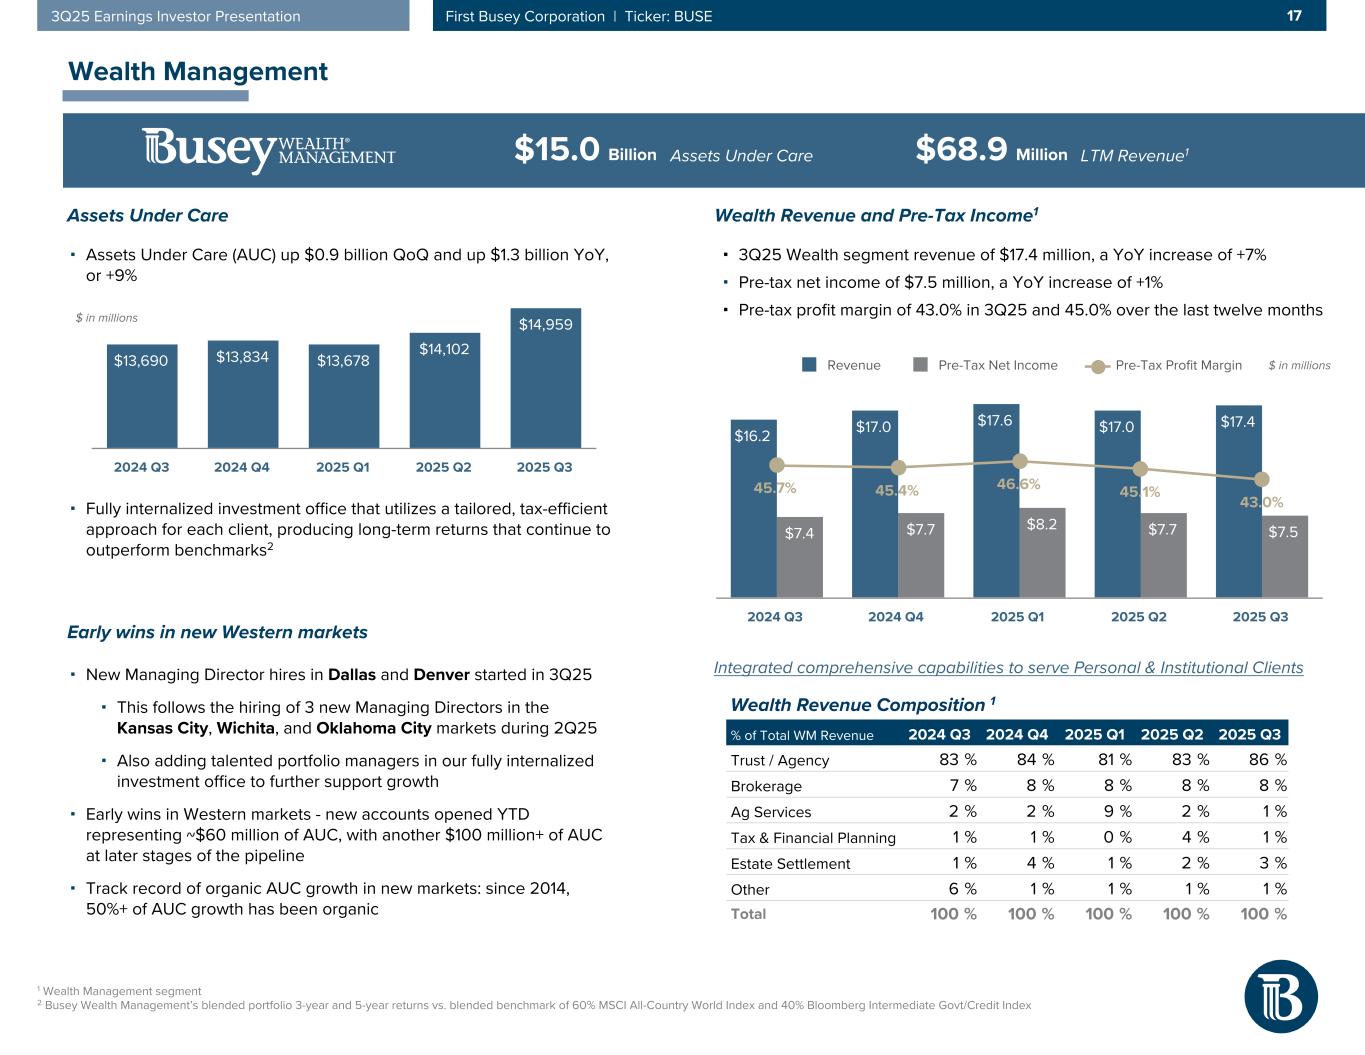
•Wealth management fees increased by 2.4% compared to the second quarter of 2025 primarily due to increases in trust and estate fees, partially offset by seasonally lower tax preparation fees. Busey’s Wealth Management division ended the third quarter of 2025 with $14.96 billion in assets under care, compared to $14.10 billion at the end of the second quarter of 2025 and $13.69 billion at the end of the third quarter of 2024. Our portfolio management team continues to focus on long-term returns and managing risk in the face of volatile markets and has outperformed its blended benchmark(4) over the last three and five years.
•Other noninterest income increased by $2.7 million, or 82.7%, compared to the second quarter of 2025, primarily due to gains on private equity investments and increased swap origination fee income.
First Busey Corporation (BUSE) | 2025 Q3 — 6
Operating Efficiency
| | | | | | | | | | | | | | | | | | | | | | | | | | | | | |
| Three Months Ended | | Nine Months Ended |
| (dollars in thousands) | September 30,
2025 | | June 30,
2025 | | September 30,
2024 | | September 30,
2025 | | September 30,
2024 |
NONINTEREST EXPENSE | | | | | | | | | |
Salaries, wages, and employee benefits | $ | 74,145 | | | $ | 78,360 | | | $ | 44,593 | | | $ | 220,068 | | | $ | 130,161 | |
Data processing | 9,714 | | | 14,021 | | | 6,910 | | | 33,310 | | | 20,560 | |
Net occupancy expense of premises | 7,982 | | | 7,832 | | | 4,633 | | | 21,613 | | | 13,943 | |
Furniture and equipment expenses | 2,143 | | | 2,409 | | | 1,647 | | | 6,296 | | | 5,155 | |
Professional fees | 2,931 | | | 2,874 | | | 3,118 | | | 15,316 | | | 7,866 | |
Amortization of intangible assets | 4,507 | | | 4,592 | | | 2,548 | | | 12,182 | | | 7,586 | |
Interchange expense | 1,336 | | | 1,297 | | | 1,352 | | | 3,976 | | | 4,696 | |
FDIC insurance | 3,151 | | | 2,424 | | | 1,413 | | | 7,742 | | | 4,273 | |
Other noninterest expense1 | 14,109 | | | 14,024 | | | 9,305 | | | 39,378 | | | 28,632 | |
Total noninterest expense1 | $ | 120,018 | | | $ | 127,833 | | | $ | 75,519 | | | $ | 359,881 | | | $ | 222,872 | |
___________________________________________
1.Beginning in the second quarter of 2025, Busey revised its presentation, for all periods presented, to reclassify the provision for unfunded commitments so that it is now included within the provision for credit losses; therefore, it is no longer included within other noninterest expense or total noninterest expense.
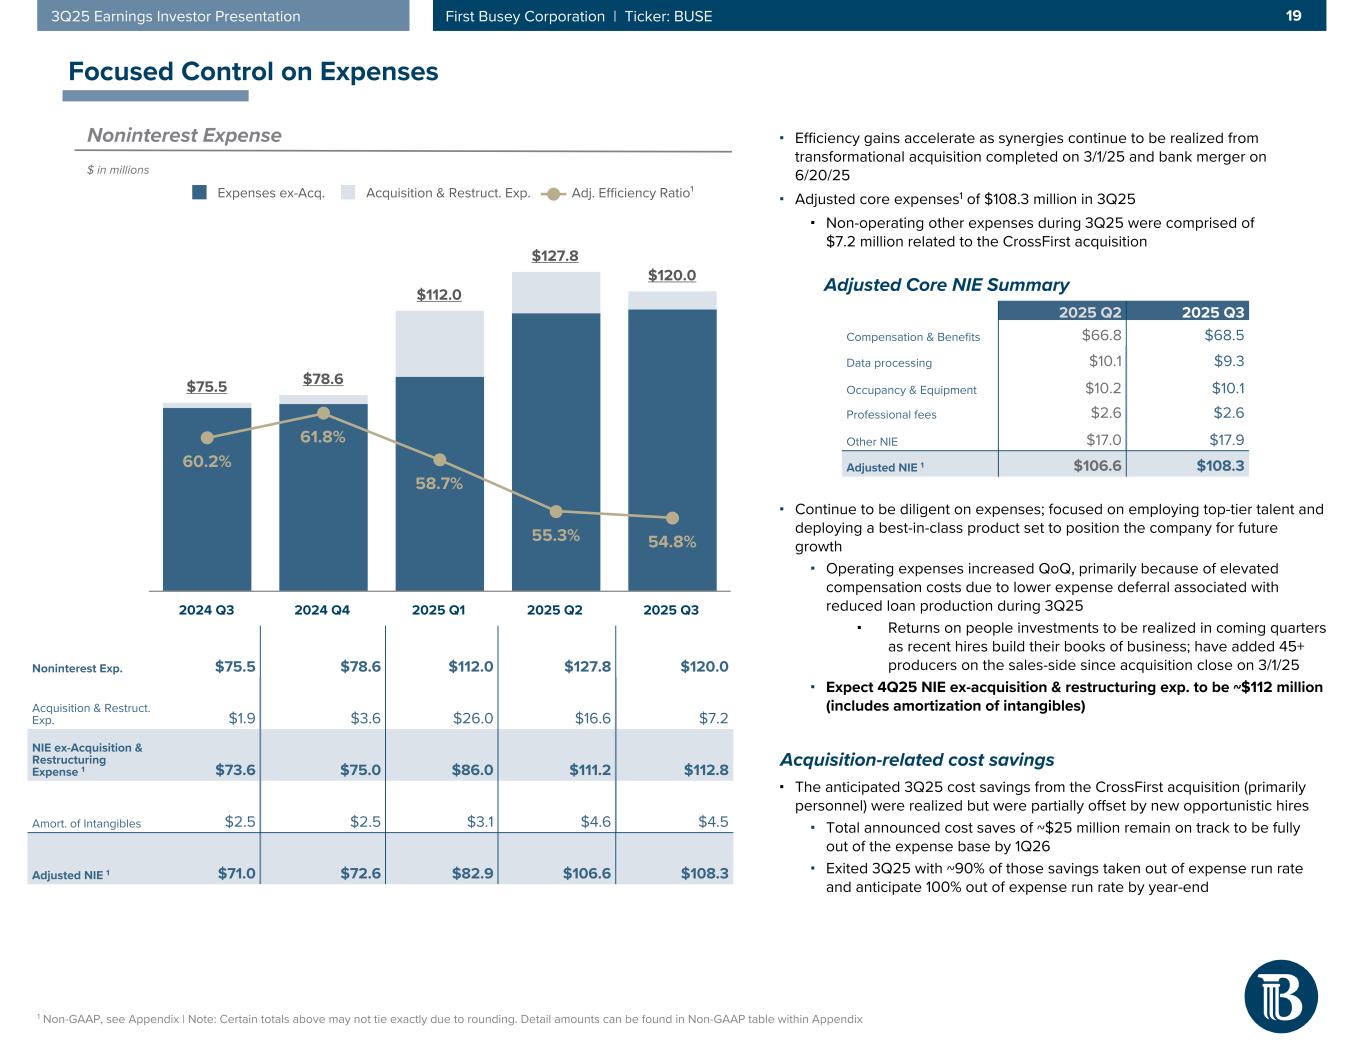
Total noninterest expense decreased by 6.1% compared to the second quarter of 2025 and increased by 58.9% compared to the third quarter of 2024. Compared to the prior year, growth in noninterest expense was primarily attributable to nonrecurring acquisition expenses related to the CrossFirst acquisition and increased expense associated with the combined organization and branch network. Annual pre-tax expense synergy estimates resulting from the CrossFirst acquisition remain on track at $25.0 million, and we expect 50% of the identified synergies to be realized in 2025 and 100% in 2026.
Adjusted noninterest expense,(2) which excludes acquisition and restructuring expenses and amortization of intangible assets, was $108.3 million in the third quarter of 2025, a 1.6% increase compared to $106.6 million in the second quarter of 2025 and a 52.5% increase compared to $71.0 million in the third quarter of 2024.
Noteworthy changes in noninterest expense during the quarter include:
•Salaries, wages, and employee benefits expenses declined by $4.2 million compared to the second quarter of 2025, with acquisition and restructuring expenses declining by $5.9 million. Compared to the third quarter of 2024, salaries, wages, and employee benefits expenses increased by $29.6 million, of which $5.5 million was attributable to increases in acquisition and restructuring expenses. In connection with the CrossFirst acquisition in March 2025 and the addition of 16 banking centers, Busey’s workforce expanded, with a net addition of 412 full-time equivalent associates over the past year.
•Data processing expense declined by $4.3 million compared to the second quarter of 2025, of which $3.5 million was attributable to decreases in acquisition and restructuring expenses. Additionally, synergies were realized resulting from the bank merger late in the second quarter. When compared with the third quarter of 2024 data processing expense increased by $2.8 million, of which $0.3 million was attributable to increases in acquisition and restructuring expenses. Busey has continued to make investments in technology enhancements and has also experienced inflation-driven price increases.
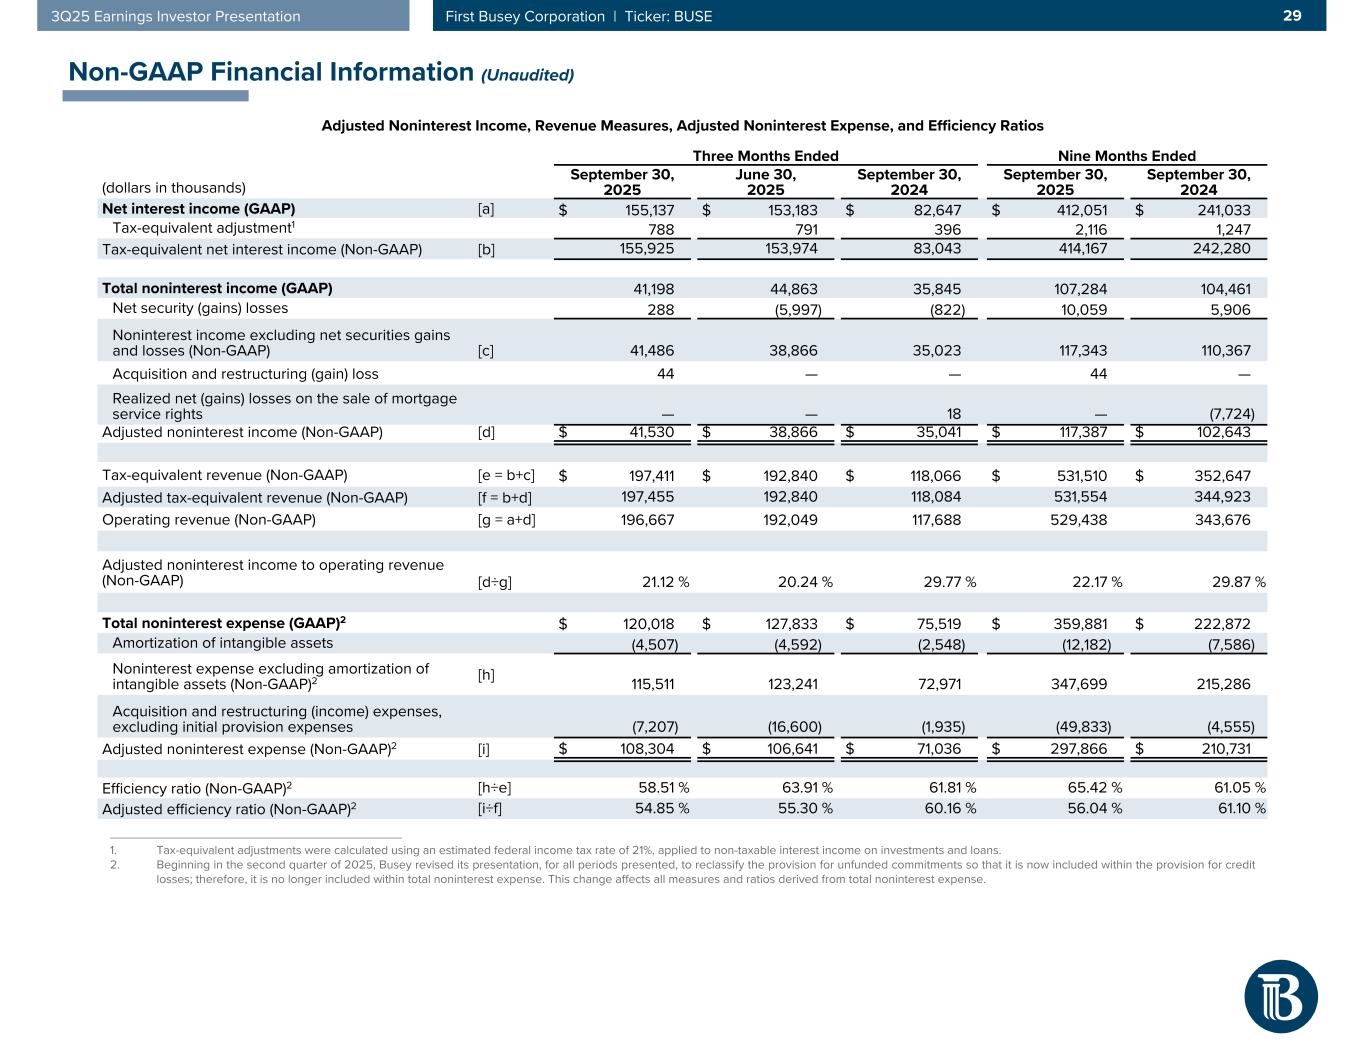
Busey’s efficiency ratio(2) was 58.5% for the third quarter of 2025, compared to 63.9% for the second quarter of 2025 and 61.8% for the third quarter of 2024. Our adjusted efficiency(2) ratio was 54.8% for the third quarter of 2025, compared to 55.3% for the second quarter of 2025, and 60.2% for the third quarter of 2024. As our business grows, Busey remains focused on prudently managing our expense base and operating efficiently.
First Busey Corporation (BUSE) | 2025 Q3 — 7
BALANCE SHEET STRENGTH
Busey’s financial strength is built on a long-term conservative operating approach. That focus has endured over time and will continue to guide us in the future.
| | | | | | | | | | | | | | | | | | | | | |
CONDENSED CONSOLIDATED BALANCE SHEETS (unaudited) |
| | | | | | | | | |
| As of |
| (dollars in thousands) | September 30,
2025 | | June 30,
2025 | | | | | | September 30,
2024 |
| ASSETS | | | | | | | | | |
| Cash and cash equivalents | $ | 385,474 | | | $ | 752,352 | | | | | | | $ | 553,709 | |
| Investment securities | 2,900,011 | | | 3,036,924 | | | | | | | 2,667,315 | |
| Loans held for sale | 8,943 | | | 10,497 | | | | | | | 11,523 | |
| Portfolio loans | 13,598,266 | | | 13,808,619 | | | | | | | 7,809,097 | |
| Allowance for credit losses | (174,181) | | | (183,334) | | | | | | | (84,981) | |
| Restricted bank stock | 77,006 | | | 77,112 | | | | | | | 6,000 | |
| Premises and equipment, net | 190,721 | | | 181,394 | | | | | | | 120,279 | |
| | | | | | | | | |
| Goodwill and other intangible assets, net | 485,203 | | | 488,181 | | | | | | | 368,249 | |
| Other assets | 717,185 | | | 746,995 | | | | | | | 535,648 | |
| Total assets | $ | 18,188,628 | | | $ | 18,918,740 | | | | | | | $ | 11,986,839 | |
| | | | | | | | | | |
| LIABILITIES & STOCKHOLDERS' EQUITY | | | | | | | | | |
| Liabilities | | | | | | | | | |
| Total deposits | $ | 15,070,162 | | | $ | 15,801,772 | | | | | | | $ | 9,943,241 | |
| Securities sold under agreements to repurchase | 147,152 | | | 158,030 | | | | | | | 128,429 | |
Borrowings | 272,971 | | | 266,913 | | | | | | | 302,236 | |
| | | | | | | | | |
| Other liabilities | 249,508 | | | 279,479 | | | | | | | 210,049 | |
| Total liabilities | 15,739,793 | | | 16,506,194 | | | | | | | 10,583,955 | |
| | | | | | | | | | |
| Stockholders' equity | | | | | | | | | |
| Retained earnings | 303,077 | | | 273,799 | | | | | | | 279,868 | |
| Accumulated other comprehensive income (loss) | (136,801) | | | (155,311) | | | | | | | (170,913) | |
Other stockholders' equity1 | 2,282,559 | | | 2,294,058 | | | | | | | 1,293,929 | |
| Total stockholders' equity | 2,448,835 | | | 2,412,546 | | | | | | | 1,402,884 | |
| Total liabilities & stockholders' equity | $ | 18,188,628 | | | $ | 18,918,740 | | | | | | | $ | 11,986,839 | |
| | | | | | | | | |
| | | | | | | | | |
| | | | | | | | | |
| | | | | | | | | |
| | | | | | | | | |
___________________________________________
1.Net balance of preferred stock ($0.001 par value), common stock ($0.001 par value), additional paid-in capital, and treasury stock.
Investment Securities
Busey’s investment securities were comprised of the following:
| | | | | | | | | | | | | | | | | | | | | | | | |
| | As of |
| (dollars in thousands) | | September 30,
2025 | | June 30,
2025 | | | | | | September 30,
2024 |
| INVESTMENT SECURITIES | | | | | | | | | | |
| Debt securities available for sale | | $ | 2,099,259 | | | $ | 2,217,788 | | | | | | | $ | 1,818,117 | |
| Debt securities held to maturity | | 784,821 | | | 802,965 | | | | | | | 838,883 | |
| Equity securities | | 15,931 | | | 16,171 | | | | | | | 10,315 | |
| Total investment securities | | $ | 2,900,011 | | | $ | 3,036,924 | | | | | | | $ | 2,667,315 | |
First Busey Corporation (BUSE) | 2025 Q3 — 8
Portfolio Loans
Busey’s loan portfolio was comprised of the following:
| | | | | | | | | | | | | | | | | | | | | | | | |
| | As of |
| (dollars in thousands) | | September 30,
2025 | | June 30,
2025 | | | | | | September 30,
2024 |
| PORTFOLIO LOANS | | | | | | | | | | |
| Commercial loans | | | | | | | | | | |
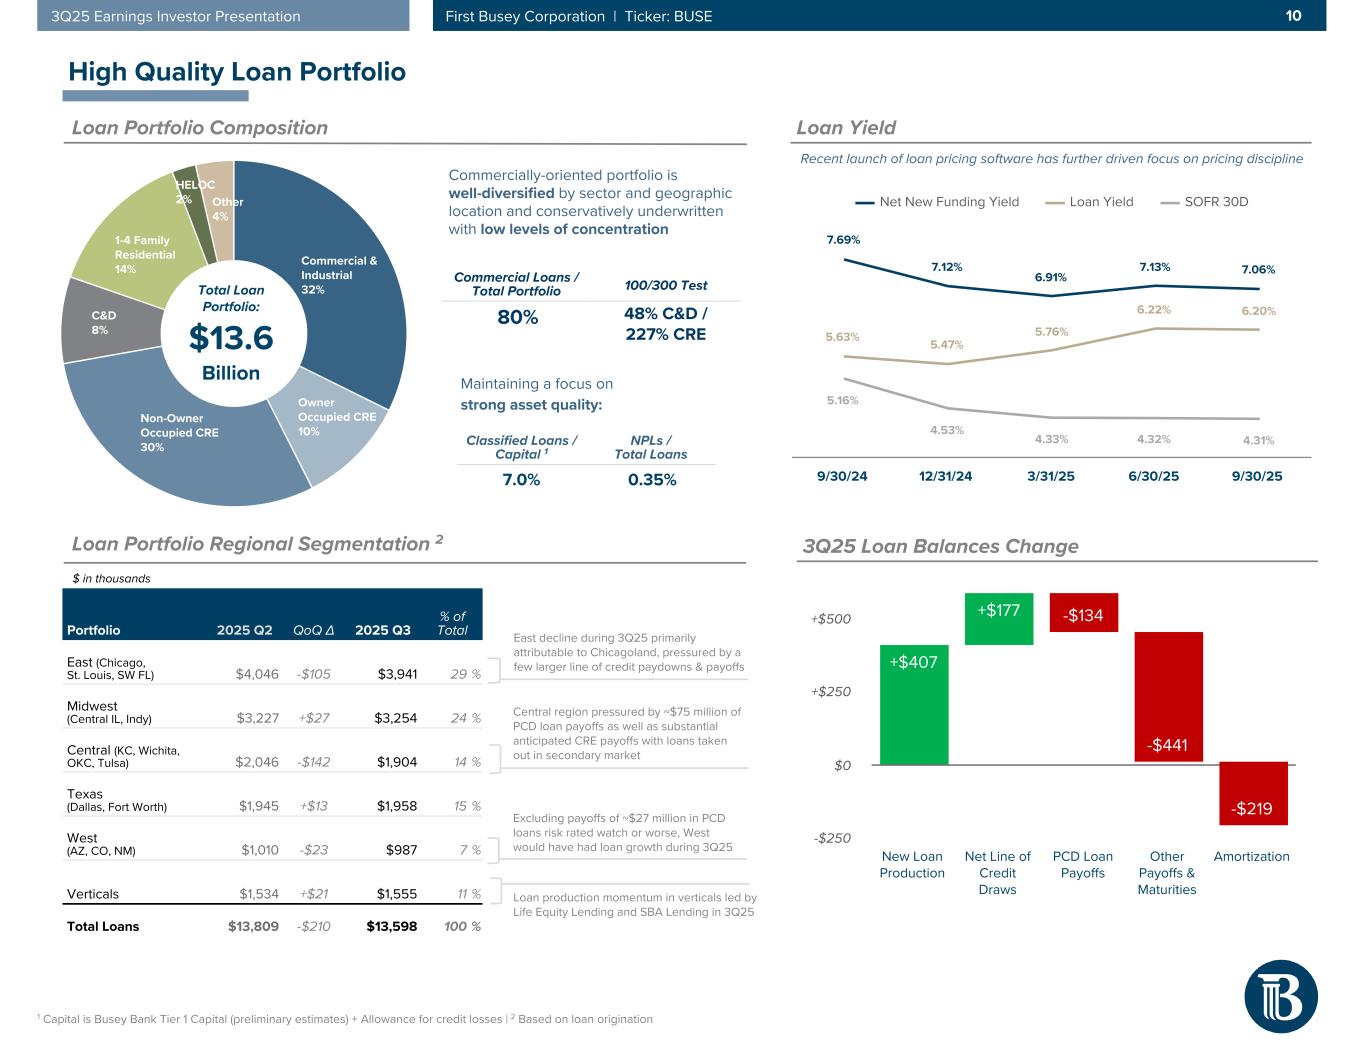
| C&I and other commercial | | $ | 4,395,871 | | | $ | 4,476,869 | | | | | | | $ | 1,877,497 | |
| CRE | | 5,424,095 | | | 5,569,759 | | | | | | | 3,355,807 | |
| Real estate construction | | 1,099,524 | | | 1,041,803 | | | | | | | 397,977 | |
| Total commercial loans | | 10,919,490 | | | 11,088,431 | | | | | | | 5,631,281 | |
| Retail loans | | | | | | | | | | |
| Retail real estate | | 2,196,246 | | | 2,228,959 | | | | | | | 1,708,771 | |
| Retail other | | 482,530 | | | 491,229 | | | | | | | 469,045 | |
| Total retail loans | | 2,678,776 | | | 2,720,188 | | | | | | | 2,177,816 | |
| Total portfolio loans | | $ | 13,598,266 | | | $ | 13,808,619 | | | | | | | $ | 7,809,097 | |
We remain steadfast in our conservative approach to underwriting and our disciplined approach to pricing. We experienced elevated payoffs during the quarter that outpaced new production momentum. We expect continued pressure, particularly from commercial real estate payoffs through the remainder of 2025.
First Busey Corporation (BUSE) | 2025 Q3 — 9
Asset Quality
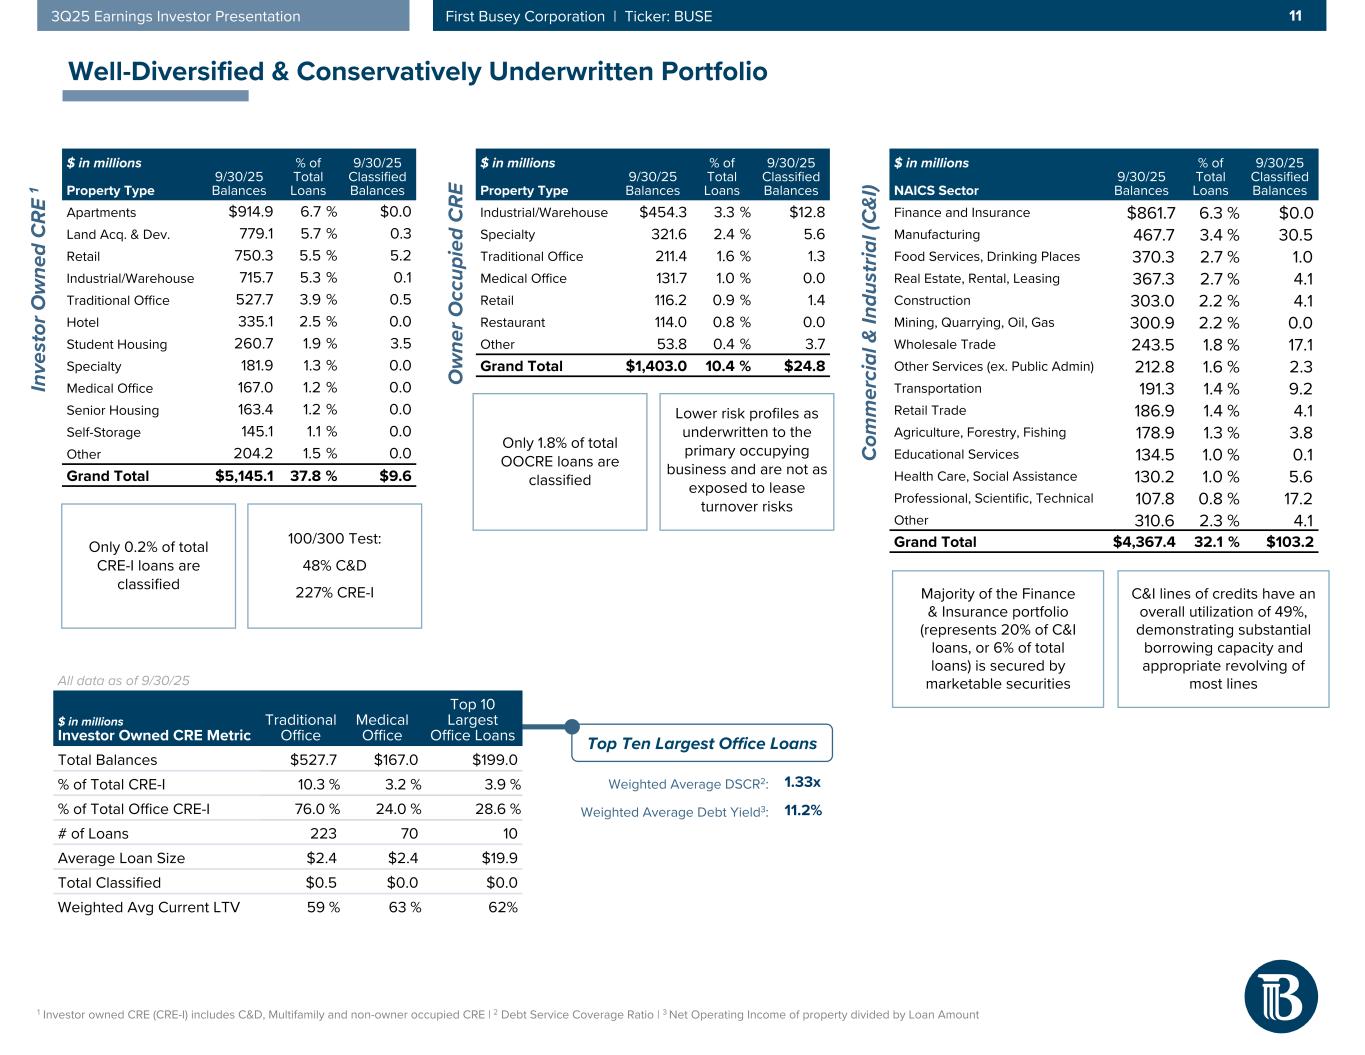
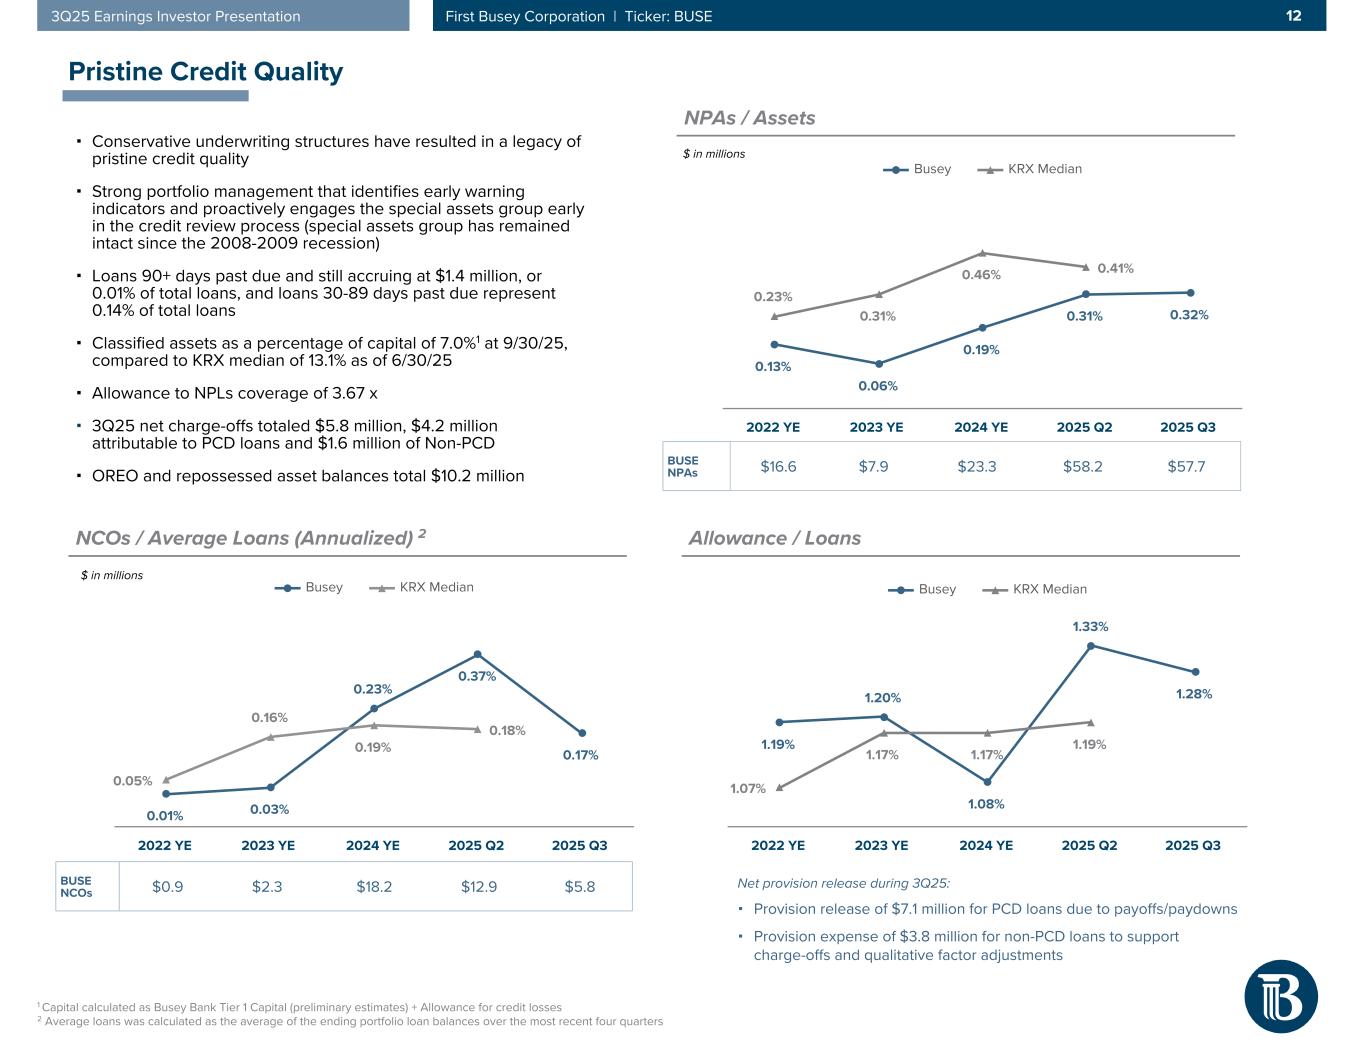
Asset quality continues to be strong. Busey Bank maintains a well-diversified loan portfolio and, as a matter of policy and practice, limits concentration exposure in any particular loan segment.
| | | | | | | | | | | | | | | | | | | | | |
|
| | | | | | | | | |
| As of |
| (dollars in thousands) | September 30,
2025 | | June 30,
2025 | | | | | | September 30,
2024 |
| Total assets | $ | 18,188,628 | | | $ | 18,918,740 | | | | | | | $ | 11,986,839 | |
| Portfolio loans | 13,598,266 | | | 13,808,619 | | | | | | | 7,809,097 | |
| Loans 30 – 89 days past due | 18,914 | | | 42,188 | | | | | | | 10,141 | |
| Non-performing loans: | | | | | | | | | |
| Non-accrual loans | 46,096 | | | 53,614 | | | | | | | 8,192 | |
| Loans 90+ days past due and still accruing | 1,418 | | | 941 | | | | | | | 25 | |
| Non-performing loans | 47,514 | | | 54,555 | | | | | | | 8,217 | |
| Other non-performing assets | 10,210 | | | 3,596 | | | | | | | 64 | |
| Non-performing assets | 57,724 | | | 58,151 | | | | | | | 8,281 | |
| Substandard (excludes 90+ days past due) | 103,329 | | | 117,580 | | | | | | | 80,704 | |
| Classified assets | $ | 161,053 | | | $ | 175,731 | | | | | | | $ | 88,985 | |
| | | | | | | | | | |
| Allowance for credit losses | $ | 174,181 | | | $ | 183,334 | | | | | | | $ | 84,981 | |
| | | | | | | | | | |
| RATIOS | | | | | | | | | |
| Non-performing loans to portfolio loans | 0.35 | % | | 0.40 | % | | | | | | 0.11 | % |
| Non-performing assets to total assets | 0.32 | % | | 0.31 | % | | | | | | 0.07 | % |
| Non-performing assets to portfolio loans and other non-performing assets | 0.42 | % | | 0.42 | % | | | | | | 0.11 | % |
| Allowance for credit losses to portfolio loans | 1.28 | % | | 1.33 | % | | | | | | 1.09 | % |
| Coverage ratio of the allowance for credit losses to non-performing loans | 3.67 x | | 3.36 x | | | | | | 10.34 x |
Classified assets to Bank Tier 1 capital1 and reserves | 7.03 | % | | 7.70 | % | | | | | | 5.89 | % |
___________________________________________
1.Capital amounts for the third quarter of 2025 are not yet finalized and are subject to change.
Non-performing assets decreased by $0.4 million compared to June 30, 2025, and increased by $49.4 million compared to September 30, 2024, with the increase compared to the prior year due primarily to the loans purchased with credit deterioration (“PCD”) assumed in the CrossFirst acquisition. Non-performing assets represented 0.32% of total assets as of September 30, 2025, a 1 basis point increase from June 30, 2025, and a 25 basis point increase from September 30, 2024.
Classified assets decreased by $14.7 million compared to June 30, 2025, and increased by $72.1 million compared to September 30, 2024, with the increase compared to the prior year due primarily to the PCD loans assumed in the CrossFirst acquisition.
The allowance for credit losses was $174.2 million as of September 30, 2025, representing 1.28% of total portfolio loans outstanding, and providing coverage of 3.67 times our non-performing loans balance.
First Busey Corporation (BUSE) | 2025 Q3 — 10
Busey’s net charge-offs and provision for credit losses were as follows:
| | | | | | | | | | | | | | | | | | | | | | | | | | | | | |
|
| | | | | | | | | |
| Three Months Ended | | Nine Months Ended |
| (dollars in thousands) | September 30,
2025 | | June 30,
2025 | | September 30,
2024 | | September 30,
2025 | | September 30,
2024 |
Net charge-offs | $ | 5,848 | | | $ | 12,881 | | | $ | 247 | | | $ | 50,158 | | | $ | 15,319 | |
| | | | | | | | | |
Provision for loan losses1 | $ | (3,305) | | | $ | 1,005 | | | $ | 2 | | | $ | 40,152 | | | $ | 7,317 | |
Provision for unfunded commitments2 | 2,320 | | | 4,695 | | | 407 | | | 10,156 | | | (640) | |
Provision for credit losses3 | $ | (985) | | | $ | 5,700 | | | $ | 409 | | | $ | 50,308 | | | $ | 6,677 | |
| | | | | | | | | |
| | | | | | | | | |
| | | | | | | | | |
| | | | | | | | | |
___________________________________________
1.Amounts reported as provision for loan losses for periods ending prior to June 30, 2025, were previously reported as provision for credit losses. The nine months ended September 30, 2025, included $42.4 million to establish an initial allowance for loan losses for loans purchased without credit deterioration (“non-PCD” loans) following the close of the CrossFirst acquisition.
2.The three months ended June 30, 2025, included a $4.0 million adjustment to the initial provision for unfunded commitments resulting from the adoption of a new CECL model. Including the adjustment recorded in the second quarter, the nine months ended September 30, 2025, included a total of $7.2 million to establish an initial allowance for unfunded commitments following the close of the CrossFirst acquisition.
3.Beginning in the second quarter of 2025, Busey revised its presentation, for all periods presented, to reclassify the provision for unfunded commitments so that it is now included within the provision for credit losses.
Net charge-offs decreased by $7.0 million when compared to the second quarter of 2025, and increased by $5.6 million when compared with the third quarter of 2024. Net charge-offs during the nine months ended September 30, 2025, included $35.5 million related to PCD loans acquired from CrossFirst Bank, which were fully reserved at acquisition and did not require recording additional provision expense.
The $3.3 million provision reversal for loan losses recorded in the third quarter of 2025 included a provision release of $7.1 million for PCD loans due to payoffs/paydowns and a provision expense of $3.8 million for non-PCD loans to support charge-offs and qualitative factor adjustments.
Deposits
Busey’s deposits were comprised of the following:
| | | | | | | | | | | | | | | | | | | | | | | | |
| | As of |
| (dollars in thousands) | | September 30,
2025 | | June 30,
2025 | | | | | | September 30,
2024 |
| DEPOSITS | | | | | | | | | | |
| Noninterest-bearing deposits | | $ | 3,554,936 | | | $ | 3,590,363 | | | | | | | $ | 2,683,543 | |
| Interest-bearing transaction deposits | | 3,171,255 | | | 3,216,601 | | | | | | | 2,455,217 | |
| Savings deposits and money market deposits | | 5,910,183 | | | 6,362,352 | | | | | | | 3,284,556 | |
| Time deposits | | 2,433,788 | | | 2,632,456 | | | | | | | 1,519,925 | |
| Total deposits | | $ | 15,070,162 | | | $ | 15,801,772 | | | | | | | $ | 9,943,241 | |
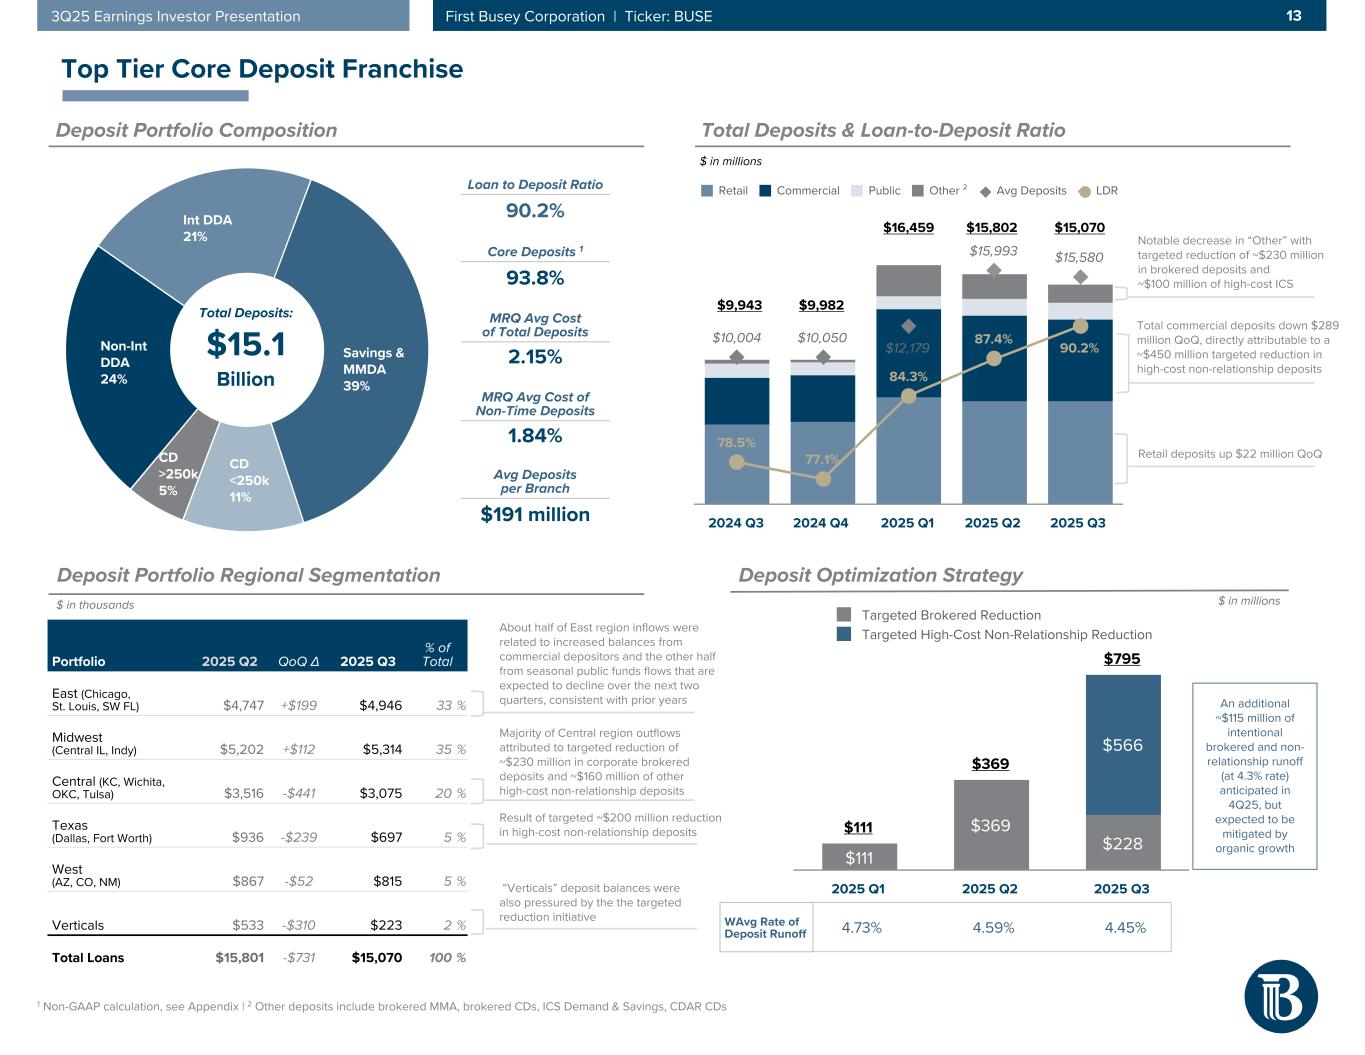
In the third quarter of 2025, Busey executed a strategic targeted reduction of high-cost, non-relationship deposits, resulting in the intentional runoff of $794.6 million of deposits, including $228.2 million of brokered deposits, bearing a weighted average cost of 4.45%. Excluding this targeted runoff, deposits grew by $63.0 million during the third quarter of 2025.
Core deposits(2) accounted for 93.8% of total deposits as of September 30, 2025. The quality of our core deposit franchise is a critical value driver of our institution. We estimated that 35% of our deposits were uninsured and uncollateralized(5) as of September 30, 2025, and we have ample on- and off-balance sheet liquidity to manage deposit fluctuations and the liquidity needs of our customers.
We have executed various deposit campaigns to attract term funding and savings accounts at a lower rate than our marginal cost of funds. New certificate of deposit production in the third quarter of 2025 had a weighted average term of 7.6 months at a rate of 3.79%, which was 50 basis points below our average marginal wholesale equivalent-term funding cost during the quarter.
First Busey Corporation (BUSE) | 2025 Q3 — 11
Borrowings
Busey’s borrowings were comprised of the following:
| | | | | | | | | | | | | | | | | | | | | |
| As of |
| (dollars in thousands) | September 30,
2025 | | June 30,
2025 | | | | | | September 30,
2024 |
| BORROWINGS | | | | | | | | | |
| | | | | | | | | |
| Long-term borrowings | $ | 92,431 | | | $ | 86,557 | | | | | | | $ | — | |
| | | | | | | | | |
| Subordinated notes, net of unamortized issuance costs | 103,283 | | | 103,169 | | | | | | | 227,482 | |
| Junior subordinated debt owed to unconsolidated trusts | 77,257 | | | 77,187 | | | | | | | 74,754 | |
| Total borrowings | $ | 272,971 | | | $ | 266,913 | | | | | | | $ | 302,236 | |
Total borrowings increased by 2.3% when compared to the second quarter of 2025, and decreased by 9.7% when compared with the third quarter of 2024. Busey had no short-term borrowings as of September 30, 2025, June 30, 2025, or September 30, 2024.
Subsequent to quarter end, on October 24, 2025, Busey issued a conditional notice of full redemption of its $4.0 million 5.25% Subordinated Note maturing December 4, 2030, which was acquired on April 1, 2024, in connection with the acquisition of Merchants and Manufacturers Bank Corporation. The redemption of the Subordinated Note is subject to and conditioned upon regulatory approval from the Board of Governors of the Federal Reserve System. Assuming the requisite approvals are retained, the Subordinated Note will be redeemed on its optional redemption date of December 4, 2025.
Liquidity
As of September 30, 2025, Busey’s available sources of on- and off-balance sheet liquidity(6) totaled $7.85 billion. Furthermore, Busey’s balance sheet liquidity profile continues to be aided by the cash flows expected from Busey’s relatively short-duration securities portfolio. Those cash flows were approximately $170.3 million in the third quarter of 2025. Cash flows from maturing securities within our portfolio are expected to be approximately $90.5 million for the fourth quarter of 2025, with a current book yield of 2.53%, and approximately $305.9 million for 2026, with a current book yield of 2.66%.
Capital Strength
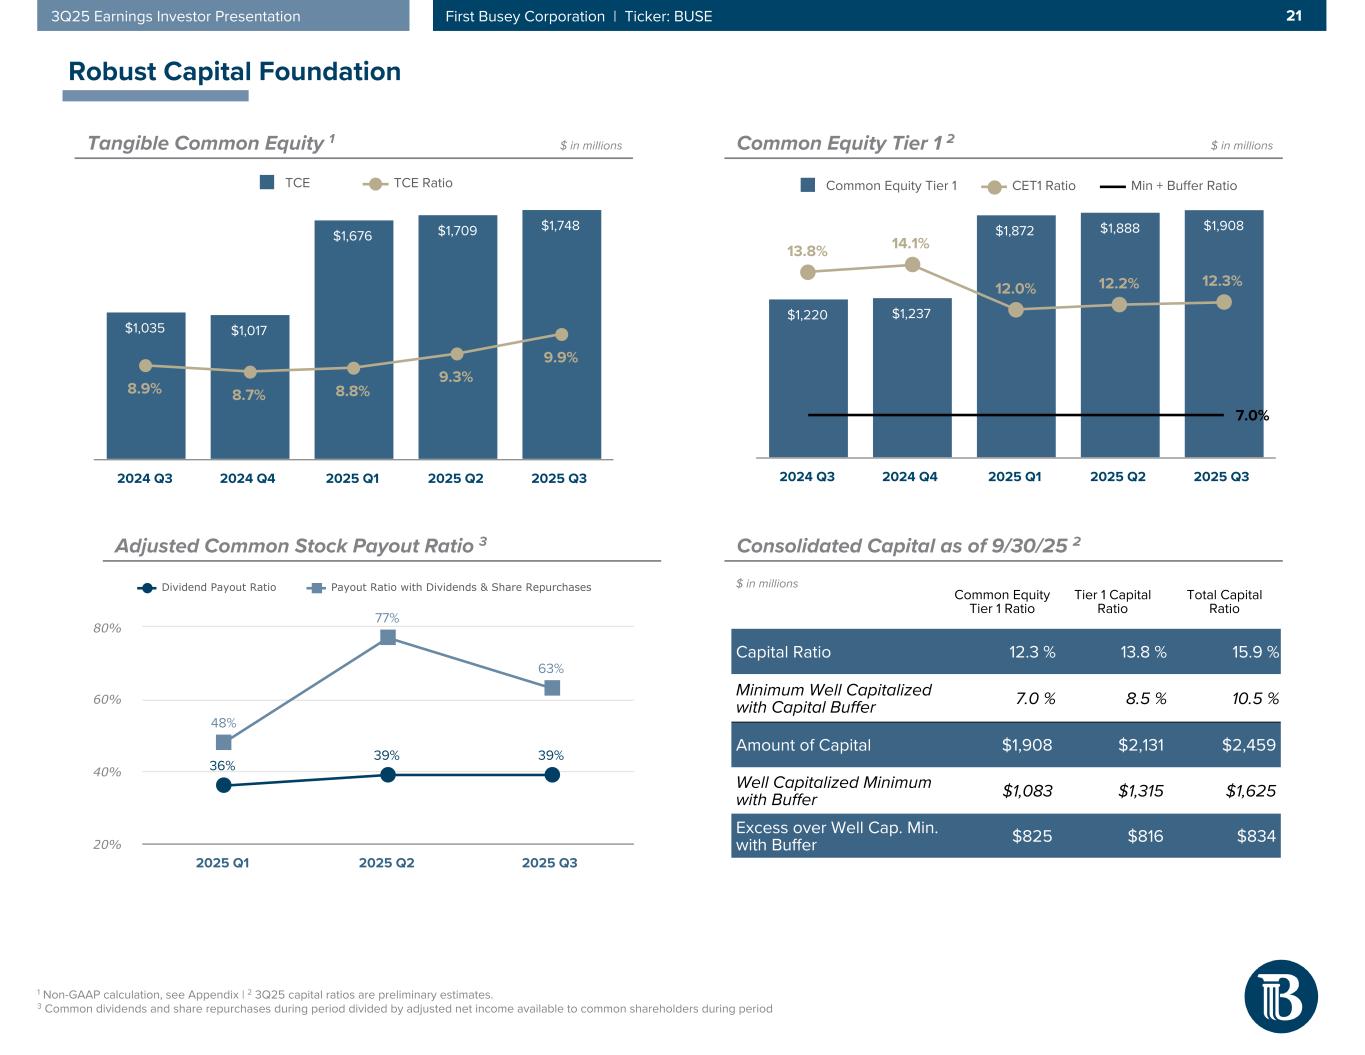
The strength of our balance sheet is also reflected in our capital foundation. Our capital ratios remain strong, and as of September 30, 2025, our estimated regulatory capital ratios(3) continued to provide a buffer of more than $810 million above levels required in order to refrain from restrictions on dividends, equity repurchases, and discretionary bonus payments. The following table presents Busey’s capital estimates(3) and tangible equity position:
| | | | | | | | | | | | | | | | | | | | | |
| As of |
| (dollars in thousands, except per share amounts) | September 30,
2025 | | June 30,
2025 | | | | | | September 30,
2024 |
Common equity Tier 1 capital to risk weighted assets1 | 12.33 | % | | 12.22 | % | | | | | | 13.78 | % |
| | | | | | | | | |
Total capital to risk weighted assets1 | 15.89 | % | | 15.75 | % | | | | | | 18.19 | % |
| | | | | | | | | |
Tangible common equity2 | $ | 1,748,435 | | | $ | 1,709,168 | | | | | | | $ | 1,034,635 | |
Tangible common equity to tangible assets2 | 9.88 | % | | 9.27 | % | | | | | | 8.90 | % |
Tangible book value per common share2 | $ | 19.69 | | | $ | 19.18 | | | | | | | $ | 18.19 | |
___________________________________________
1.Capital amounts and ratios as of September 30, 2025, are not yet finalized and are subject to change.
First Busey Corporation (BUSE) | 2025 Q3 — 12
Dividends
Busey's strong capital levels, coupled with its earnings, have allowed the Company to provide a steady return to its stockholders through dividends. During the third quarter of 2025, Busey paid dividends of $0.25 per share on its common stock, $20.00 per share on its Series A Non-Cumulative Perpetual Preferred Stock, which was issued in connection with the CrossFirst acquisition, and $0.578646 per depositary share, each representing a 1/40th interest in a share of Busey’s 8.25% Fixed-Rate Series B Non-Cumulative Perpetual Preferred Stock.
Share Repurchases
During the third quarter of 2025, under its stock repurchase plan, Busey purchased 580,000 shares of its common stock at a weighted average price of $23.36 per share for a total of $13.5 million. As of September 30, 2025, Busey had 2,107,275 shares remaining available for repurchase under the plan.
THIRD QUARTER EARNINGS INVESTOR PRESENTATION
For additional information on Busey’s financial condition and operating results, please refer to our Q3 2025 Earnings Investor Presentation furnished via Form 8‑K on October 28, 2025, in connection with this earnings release.
CORPORATE PROFILE
As of September 30, 2025, First Busey Corporation (Nasdaq: BUSE) was an $18.19 billion financial holding company headquartered in Leawood, Kansas.
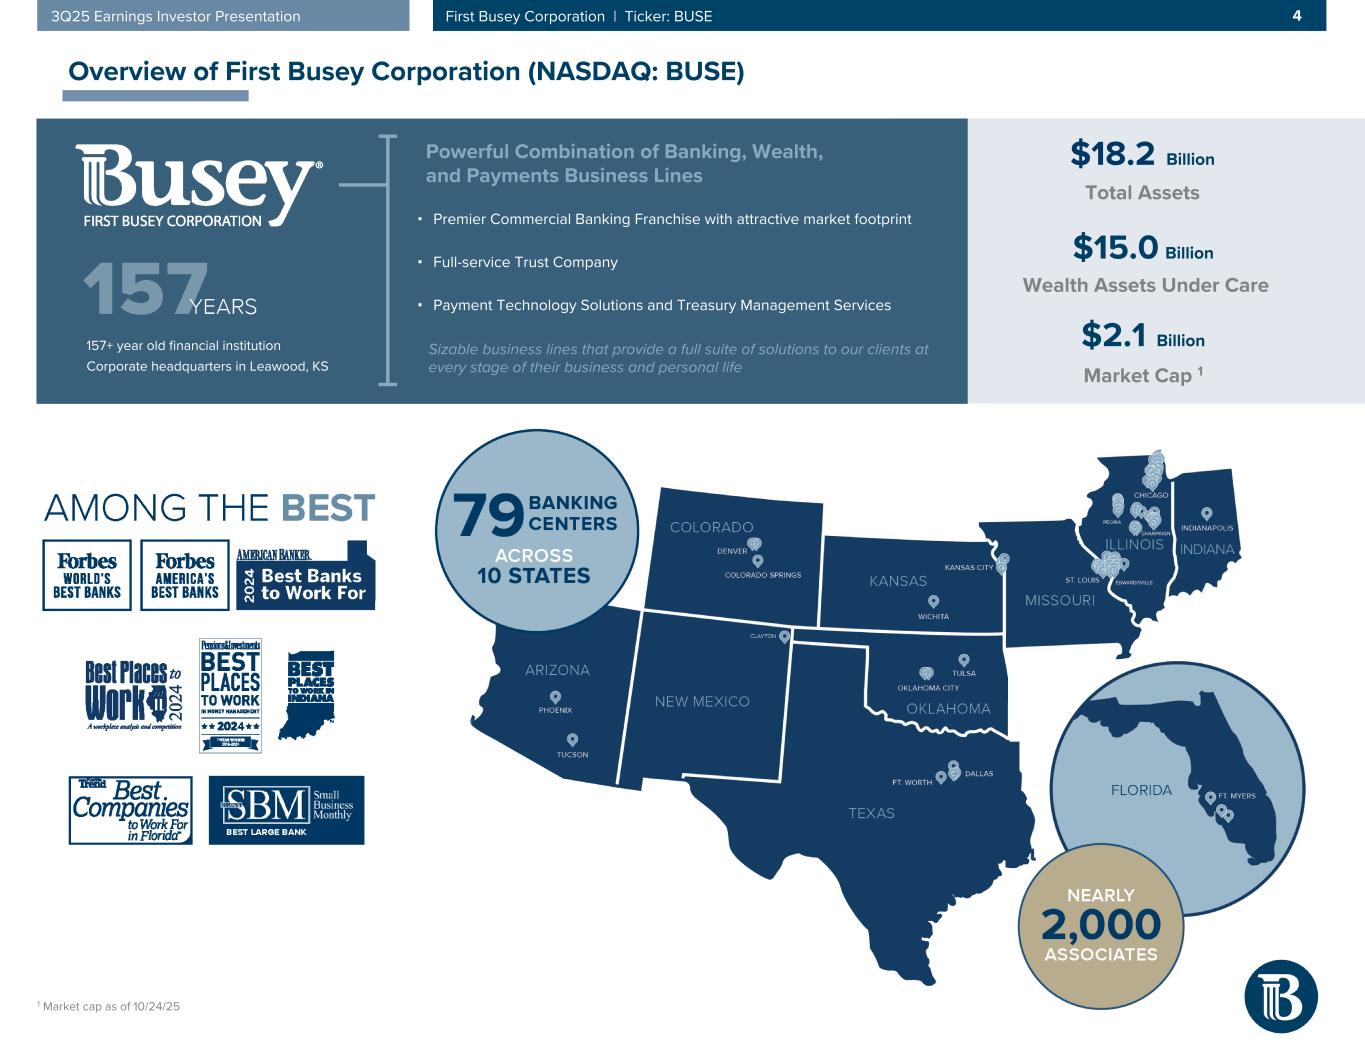
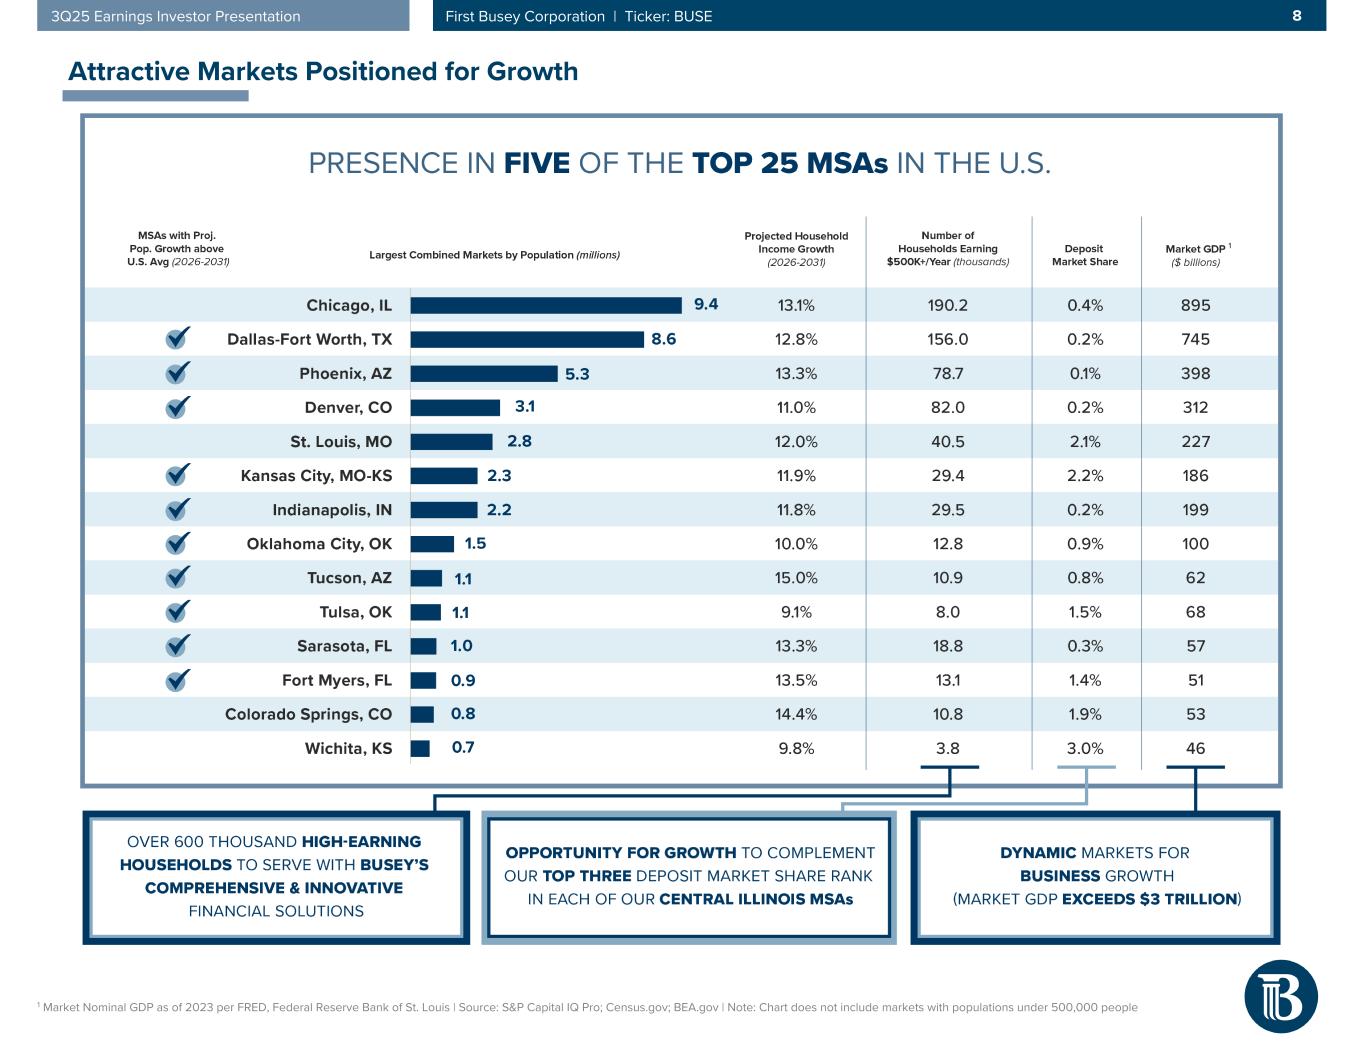
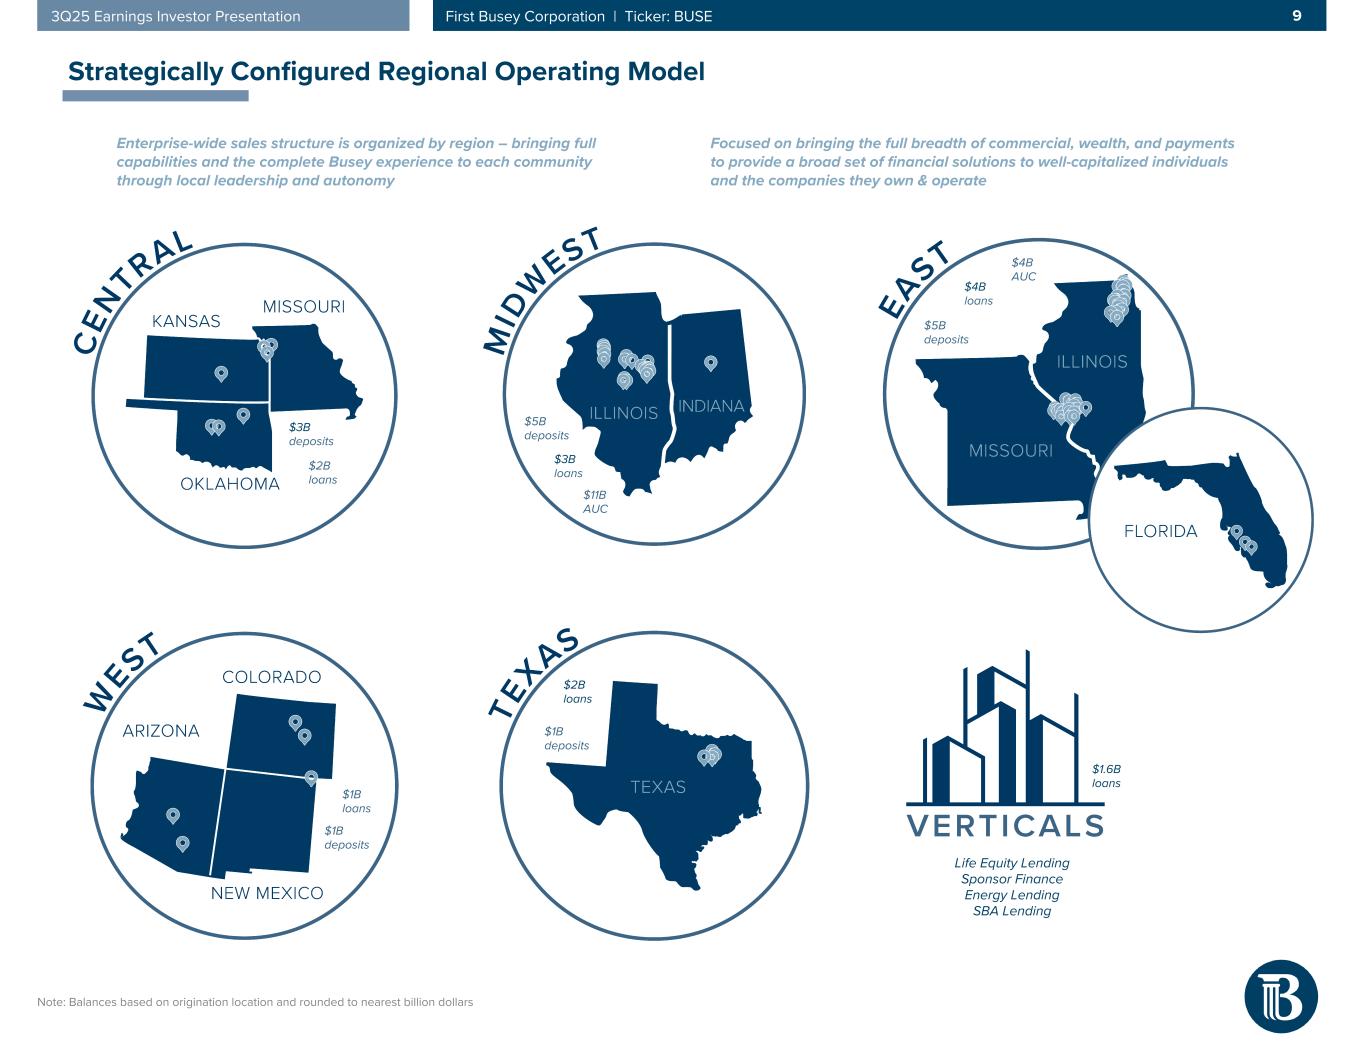
Busey Bank, a wholly-owned bank subsidiary of First Busey Corporation headquartered in Champaign, Illinois, had total assets of $18.14 billion as of September 30, 2025. Busey Bank currently has 79 banking centers, with 21 in central Illinois markets, 17 in suburban Chicago markets, 20 in the St. Louis Metropolitan Statistical Area, four in the Dallas-Fort Worth Metropolitan Statistical Area, three in the Kansas City Metropolitan Statistical Area, three in southwest Florida, three in Oklahoma, three in Colorado, two in Arizona, one in Indianapolis, Indiana, one in Wichita, Kansas, and one in Clayton, New Mexico. More information about Busey Bank can be found at busey.com.
Through Busey’s Wealth Management division, the Company provides a full range of asset management, investment, brokerage, fiduciary, philanthropic advisory, tax preparation, and farm management services to individuals, businesses, and foundations. Assets under care totaled $14.96 billion as of September 30, 2025. More information about Busey’s Wealth Management services can be found at busey.com/wealth-management.
Busey Bank’s wholly-owned subsidiary, FirsTech, Inc. (“FirsTech”) specializes in the evolving financial technology needs of small and medium-sized businesses, highly regulated enterprise industries, and financial institutions. FirsTech provides comprehensive and innovative payment technology solutions, including online, mobile, and voice-recognition bill payments; money and data movement; merchant services; direct debit services; lockbox remittance processing for payments made by mail; and walk-in payments at retail agents. Additionally, FirsTech simplifies client workflows through integrations enabling support with billing, reconciliation, bill reminders, and treasury services. More information about FirsTech can be found at firstechpayments.com.
For the fourth consecutive year, Busey was named among Forbes’ 2025’s America’s Best Banks. In 2025, Forbes also recognized Busey as a Best-in-State Bank, based on rankings of customer service, quality of financial advice, fee structures, ease of digital services, accessing help at branch locations and the degree of trust inspired. Busey was also named among the 2024 Best Banks to Work For by American Banker and the 2024 Best Places to Work in Money Management by Pensions and Investments. We are honored to be consistently recognized as an outstanding financial services organization with an engaged culture of integrity and commitment to community development.
First Busey Corporation (BUSE) | 2025 Q3 — 13
NON-GAAP FINANCIAL INFORMATION
This earnings release contains certain financial information determined by methods other than GAAP. Management uses these non-GAAP measures, together with the related GAAP measures, in analysis of Busey’s performance and in making business decisions, as well as for comparison to Busey’s peers. Busey believes the adjusted measures are useful for investors and management to understand the effects of certain non-core and non-recurring items and provide additional perspective on Busey’s performance over time.
The following tables present reconciliations between these non-GAAP measures and what management believes to be the most directly comparable GAAP financial measures.
These non-GAAP disclosures have inherent limitations and are not audited. They should not be considered in isolation or as a substitute for operating results reported in accordance with GAAP, nor are they necessarily comparable to non-GAAP performance measures that may be presented by other companies. Tax effected numbers included in these non-GAAP disclosures are based on estimated statutory rates, estimated federal income tax rates, or effective tax rates, as noted with the tables below.
First Busey Corporation (BUSE) | 2025 Q3 — 14
RECONCILIATION OF NON-GAAP FINANCIAL MEASURES (Unaudited)
| | | | | | | | | | | | | | | | | | | | | | | | | | | | | | | | |
| Pre-Provision Net Revenue and Related Measures |
| | | | | | | | | | |
| | Three Months Ended | | Nine Months Ended |
| (dollars in thousands) | | September 30,
2025 | | June 30,
2025 | | September 30,
2024 | | September 30,
2025 | | September 30,
2024 |
Net interest income (GAAP) | | $ | 155,137 | | | $ | 153,183 | | | $ | 82,647 | | | $ | 412,051 | | | $ | 241,033 | |
Total noninterest income (GAAP) | | 41,198 | | | 44,863 | | | 35,845 | | | 107,284 | | | 104,461 | |
Net security (gains) losses (GAAP) | | 288 | | | (5,997) | | | (822) | | | 10,059 | | | 5,906 | |
Total noninterest expense (GAAP)1 | | (120,018) | | | (127,833) | | | (75,519) | | | (359,881) | | | (222,872) | |
Pre-provision net revenue (Non-GAAP) | [a] | 76,605 | | | 64,216 | | | 42,151 | | | 169,513 | | | 128,528 | |
Acquisition and restructuring (income) expenses, excluding initial provision expenses | | 7,251 | | | 16,600 | | | 1,935 | | | 49,877 | | | 4,555 | |
| | | | | | | | | | |
| | | | | | | | | | |
Realized net (gains) losses on the sale of mortgage service rights | | — | | | — | | | 18 | | | — | | | (7,724) | |
Adjusted pre-provision net revenue (Non-GAAP) | [b] | $ | 83,856 | | | $ | 80,816 | | | $ | 44,104 | | | $ | 219,390 | | | $ | 125,359 | |
| | | | | | | | | | | |
| Average total assets | [c] | $ | 18,662,449 | | | $ | 19,068,086 | | | $ | 12,007,702 | | | $ | 17,534,644 | | | $ | 12,040,414 | |
| | | | | | | | | | | |
Pre-provision net revenue to average total assets (Non-GAAP)2 | [a÷c] | 1.63 | % | | 1.35 | % | | 1.40 | % | | 1.29 | % | | 1.43 | % |
Adjusted pre-provision net revenue to average total assets (Non-GAAP)2 | [b÷c] | 1.78 | % | | 1.70 | % | | 1.46 | % | | 1.67 | % | | 1.39 | % |
___________________________________________
1.Beginning in the second quarter of 2025, Busey revised its presentation, for all periods presented, to reclassify the provision for unfunded commitments so that it is now included within the provision for credit losses; therefore, it is no longer included within total noninterest expense.
2.Annualized measure.
First Busey Corporation (BUSE) | 2025 Q3 — 15
RECONCILIATION OF NON-GAAP FINANCIAL MEASURES (Unaudited)
| | | | | | | | | | | | | | | | | | | | | | | | | | | | | | | | |
| Adjusted Net Income, Average Tangible Common Equity, and Related Ratios |
| | | | | | | | | | |
| | Three Months Ended | | Nine Months Ended |
| (dollars in thousands, except per share amounts) | | September 30,
2025 | | June 30,
2025 | | September 30,
2024 | | September 30,
2025 | | September 30,
2024 |
| Net income (GAAP) | [a] | $ | 57,098 | | | $ | 47,404 | | | $ | 32,004 | | | $ | 74,512 | | | $ | 85,586 | |
Day 2 provision for credit losses1 | | — | | | — | | | — | | | 45,572 | | | — | |
Adjustment of initial provision for unfunded commitments due to adoption of new model2 | | — | | | 4,030 | | | — | | | 4,030 | | | — | |
| Other acquisition (income) expenses | | 7,251 | | | 16,600 | | | 1,935 | | | 49,877 | | | 4,432 | |
| Restructuring expenses | | — | | | — | | | — | | | — | | | 123 | |
| Net securities (gains) losses | | 288 | | | (5,997) | | | (822) | | | 10,059 | | | 5,906 | |
| Realized net (gains) losses on the sale of mortgage servicing rights | | — | | | — | | | 18 | | | — | | | (7,724) | |
Related tax (benefit) expense3 | | (2,141) | | | (4,971) | | | (207) | | | (29,181) | | | (608) | |
Non-recurring deferred tax adjustment4 | | — | | | 328 | | | — | | | 4,919 | | | 1,446 | |
Adjusted net income (Non-GAAP)5 | [b] | 62,496 | | | 57,394 | | | 32,928 | | | 159,788 | | | 89,161 | |
| Preferred dividends | [c] | 5,131 | | | 155 | | | — | | | 5,286 | | | — | |
| Adjusted net income available to common stockholders (Non-GAAP) | [d] | $ | 57,365 | | | $ | 57,239 | | | $ | 32,928 | | | $ | 154,502 | | | $ | 89,161 | |
| | | | | | | | | | |
| Weighted average number of common shares outstanding, diluted (GAAP) | [e] | 90,218,382 | | | 90,883,711 | | | 57,967,848 | | | 83,609,999 | | | 57,411,299 | |
| Diluted earnings per common share (GAAP) | [(a-c)÷e] | $ | 0.58 | | | $ | 0.52 | | | $ | 0.55 | | | $ | 0.83 | | | $ | 1.49 | |
| | | | | | | | | | |
| | | | | | | | | | |
Adjusted diluted earnings per common share (Non-GAAP)5 | [d÷e] | $ | 0.64 | | | $ | 0.63 | | | $ | 0.57 | | | $ | 1.85 | | | $ | 1.55 | |
| | | | | | | | | | | |
| Average total assets | [f] | $ | 18,662,449 | | | $ | 19,068,086 | | | $ | 12,007,702 | | | $ | 17,534,644 | | | $ | 12,040,414 | |
Return on average assets (Non-GAAP)6 | [a÷f] | 1.21 | % | | 1.00 | % | | 1.06 | % | | 0.57 | % | | 0.95 | % |
Adjusted return on average assets (Non-GAAP)5,6 | [b÷f] | 1.33 | % | | 1.21 | % | | 1.09 | % | | 1.22 | % | | 0.99 | % |
| | | | | | | | | | | |
| Average common equity | | $ | 2,210,711 | | | $ | 2,180,963 | | | $ | 1,364,377 | | | $ | 2,109,046 | | | $ | 1,324,119 | |
| Average goodwill and other intangible assets, net | | (486,625) | | | (494,473) | | | (369,720) | | | (464,316) | | | (366,331) | |
| Average tangible common equity (Non-GAAP) | [g] | $ | 1,724,086 | | | $ | 1,686,490 | | | $ | 994,657 | | | $ | 1,644,730 | | | $ | 957,788 | |
| | | | | | | | | | | |
Return on average tangible common equity (Non-GAAP)6 | [(a-c)÷g] | 11.96 | % | | 11.24 | % | | 12.80 | % | | 5.63 | % | | 11.94 | % |
Adjusted return on average tangible common equity (Non-GAAP)5,6 | [d÷g] | 13.20 | % | | 13.61 | % | | 13.17 | % | | 12.56 | % | | 12.43 | % |
___________________________________________
1.The Day 2 provision represents the initial provision for credit losses recorded in connection with the CrossFirst acquisition to establish an allowance on non-PCD loans and unfunded commitments and is reflected within the provision for credit losses line on the Statement of Income.
2.In the second quarter of 2025, Busey recorded an adjustment to the initial provision for unfunded commitments for CrossFirst acquisition-date balances based on revised estimates resulting from implementation of a new Current Expected Credit Losses model.
3.Tax benefits were calculated for the year-to-date periods using tax rates of 26.64% and 22.21% for the nine months ended September 30, 2025 and 2024, respectively. Tax benefits for the quarterly periods were calculated as the year-to-date tax amounts less the tax reported for previous quarters during the year.
4.A deferred valuation tax adjustment in 2025 was recorded in connection with the CrossFirst acquisition and the expansion of Busey’s footprint into new states. Additionally, 2025 includes a write-off of deferred tax assets related to non-deductible compensation and acquisition-related expenses. A deferred tax valuation adjustment in 2024 resulted from a change to Busey’s Illinois apportionment rate due to recently enacted regulations. Deferred tax adjustments are reflected within the income taxes line on the Statement of Income.
5.Beginning in 2025, Busey revised its calculation of adjusted net income for all periods presented to include, as applicable, adjustments for net securities gains and losses, realized net gains and losses on the sale of mortgage servicing rights, and one-time deferred tax valuation adjustments. In 2024, these adjusting items were presented as further adjustments to adjusted net income.
6.Annualized measure.
First Busey Corporation (BUSE) | 2025 Q3 — 16
RECONCILIATION OF NON-GAAP FINANCIAL MEASURES (Unaudited)
| | | | | | | | | | | | | | | | | | | | | | | | | | | | | | | | |
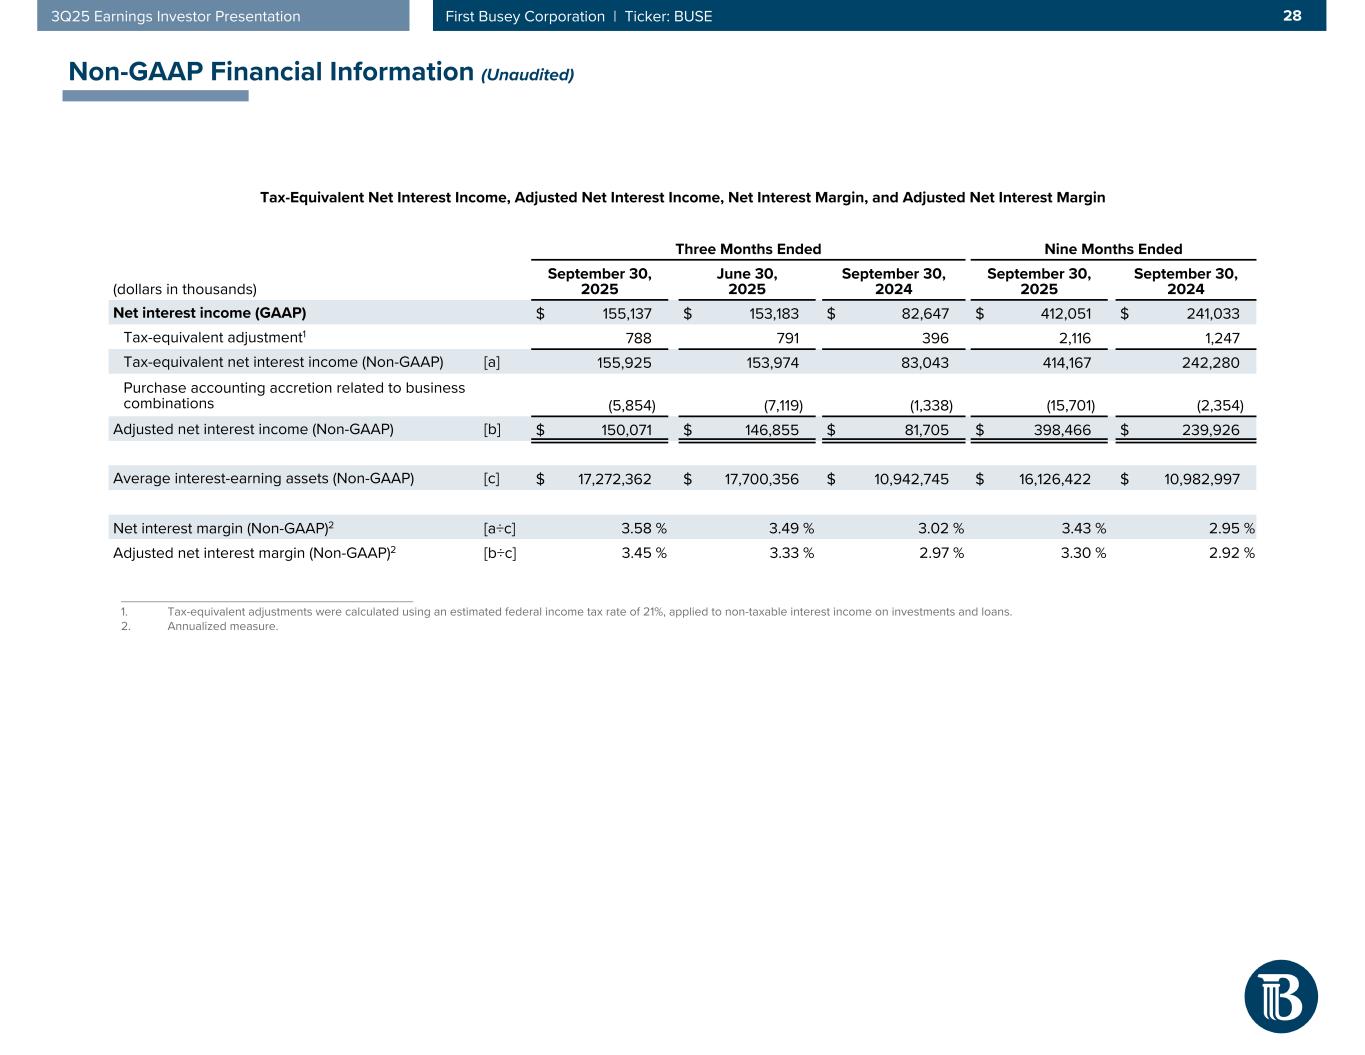
| Tax-Equivalent Net Interest Income, Adjusted Net Interest Income, Net Interest Margin, and Adjusted Net Interest Margin |
| | | | | | | | | | |
| | Three Months Ended | | Nine Months Ended |
| (dollars in thousands) | | September 30,
2025 | | June 30,
2025 | | September 30,
2024 | | September 30,
2025 | | September 30,
2024 |
| Net interest income (GAAP) | | $ | 155,137 | | | $ | 153,183 | | | $ | 82,647 | | | $ | 412,051 | | | $ | 241,033 | |
Tax-equivalent adjustment1 | | 788 | | | 791 | | | 396 | | | 2,116 | | | 1,247 | |
| Tax-equivalent net interest income (Non-GAAP) | [a] | 155,925 | | | 153,974 | | | 83,043 | | | 414,167 | | | 242,280 | |
| Purchase accounting accretion related to business combinations | | (5,854) | | | (7,119) | | | (1,338) | | | (15,701) | | | (2,354) | |
| Adjusted net interest income (Non-GAAP) | [b] | $ | 150,071 | | | $ | 146,855 | | | $ | 81,705 | | | $ | 398,466 | | | $ | 239,926 | |
| | | | | | | | | | | |
| Average interest-earning assets (Non-GAAP) | [c] | $ | 17,272,362 | | | $ | 17,700,356 | | | $ | 10,942,745 | | | $ | 16,126,422 | | | $ | 10,982,997 | |
| | | | | | | | | | | |
Net interest margin (Non-GAAP)2 | [a÷c] | 3.58 | % | | 3.49 | % | | 3.02 | % | | 3.43 | % | | 2.95 | % |
Adjusted net interest margin (Non-GAAP)2 | [b÷c] | 3.45 | % | | 3.33 | % | | 2.97 | % | | 3.30 | % | | 2.92 | % |
___________________________________________
1.Tax-equivalent adjustments were calculated using an estimated federal income tax rate of 21%, applied to non-taxable interest income on investments and loans.
2.Annualized measure.
First Busey Corporation (BUSE) | 2025 Q3 — 17
RECONCILIATION OF NON-GAAP FINANCIAL MEASURES (Unaudited)
| | | | | | | | | | | | | | | | | | | | | | | | | | | | | | | | |
| Adjusted Noninterest Income, Revenue Measures, Adjusted Noninterest Expense, and Efficiency Ratios |
| | | | | | | | | | |
| | Three Months Ended | | Nine Months Ended |
| (dollars in thousands) | | September 30,
2025 | | June 30,
2025 | | September 30,
2024 | | September 30,
2025 | | September 30,
2024 |
| Net interest income (GAAP) | [a] | $ | 155,137 | | | $ | 153,183 | | | $ | 82,647 | | | $ | 412,051 | | | $ | 241,033 | |
Tax-equivalent adjustment1 | | 788 | | | 791 | | | 396 | | | 2,116 | | | 1,247 | |
| Tax-equivalent net interest income (Non-GAAP) | [b] | 155,925 | | | 153,974 | | | 83,043 | | | 414,167 | | | 242,280 | |
| | | | | | | | | | | |
| Total noninterest income (GAAP) | | 41,198 | | | 44,863 | | | 35,845 | | | 107,284 | | | 104,461 | |
| Net security (gains) losses | | 288 | | | (5,997) | | | (822) | | | 10,059 | | | 5,906 | |
| Noninterest income excluding net securities gains and losses (Non-GAAP) | [c] | 41,486 | | | 38,866 | | | 35,023 | | | 117,343 | | | 110,367 | |
| Acquisition and restructuring (gain) loss | | 44 | | | — | | | — | | | 44 | | | — | |
| Realized net (gains) losses on the sale of mortgage service rights | | — | | | — | | | 18 | | | — | | | (7,724) | |
| Adjusted noninterest income (Non-GAAP) | [d] | $ | 41,530 | | | $ | 38,866 | | | $ | 35,041 | | | $ | 117,387 | | | $ | 102,643 | |
| | | | | | | | | | | |
| Tax-equivalent revenue (Non-GAAP) | [e = b+c] | $ | 197,411 | | | $ | 192,840 | | | $ | 118,066 | | | $ | 531,510 | | | $ | 352,647 | |
| Adjusted tax-equivalent revenue (Non-GAAP) | [f = b+d] | 197,455 | | | 192,840 | | | 118,084 | | | 531,554 | | | 344,923 | |
| Operating revenue (Non-GAAP) | [g = a+d] | 196,667 | | | 192,049 | | | 117,688 | | | 529,438 | | | 343,676 | |
| | | | | | | | | | | |
| Adjusted noninterest income to operating revenue (Non-GAAP) | [d÷g] | 21.12 | % | | 20.24 | % | | 29.77 | % | | 22.17 | % | | 29.87 | % |
| | | | | | | | | | | |
Total noninterest expense (GAAP)2 | | $ | 120,018 | | | $ | 127,833 | | | $ | 75,519 | | | $ | 359,881 | | | $ | 222,872 | |
Amortization of intangible assets | | (4,507) | | | (4,592) | | | (2,548) | | | (12,182) | | | (7,586) | |
Noninterest expense excluding amortization of intangible assets (Non-GAAP)2 | [h] | 115,511 | | | 123,241 | | | 72,971 | | | 347,699 | | | 215,286 | |
Acquisition and restructuring (income) expenses, excluding initial provision expenses | | (7,207) | | | (16,600) | | | (1,935) | | | (49,833) | | | (4,555) | |
| | | | | | | | | | |
| | | | | | | | | | |
Adjusted noninterest expense (Non-GAAP)2 | [i] | $ | 108,304 | | | $ | 106,641 | | | $ | 71,036 | | | $ | 297,866 | | | $ | 210,731 | |
| | | | | | | | | | | |
Efficiency ratio (Non-GAAP)2 | [h÷e] | 58.51 | % | | 63.91 | % | | 61.81 | % | | 65.42 | % | | 61.05 | % |
Adjusted efficiency ratio (Non-GAAP)2 | [i÷f] | 54.85 | % | | 55.30 | % | | 60.16 | % | | 56.04 | % | | 61.10 | % |
| | | | | | | | | | |
| | | | | | | | | | |
| | | | | | | | | | |
___________________________________________
1.Tax-equivalent adjustments were calculated using an estimated federal income tax rate of 21%, applied to non-taxable interest income on investments and loans.
2.Beginning in the second quarter of 2025, Busey revised its presentation, for all periods presented, to reclassify the provision for unfunded commitments so that it is now included within the provision for credit losses; therefore, it is no longer included within total noninterest expense. This change affects all measures and ratios derived from total noninterest expense.
First Busey Corporation (BUSE) | 2025 Q3 — 18
RECONCILIATION OF NON-GAAP FINANCIAL MEASURES (Unaudited)
| | | | | | | | | | | | | | | | | | | | | | | | |
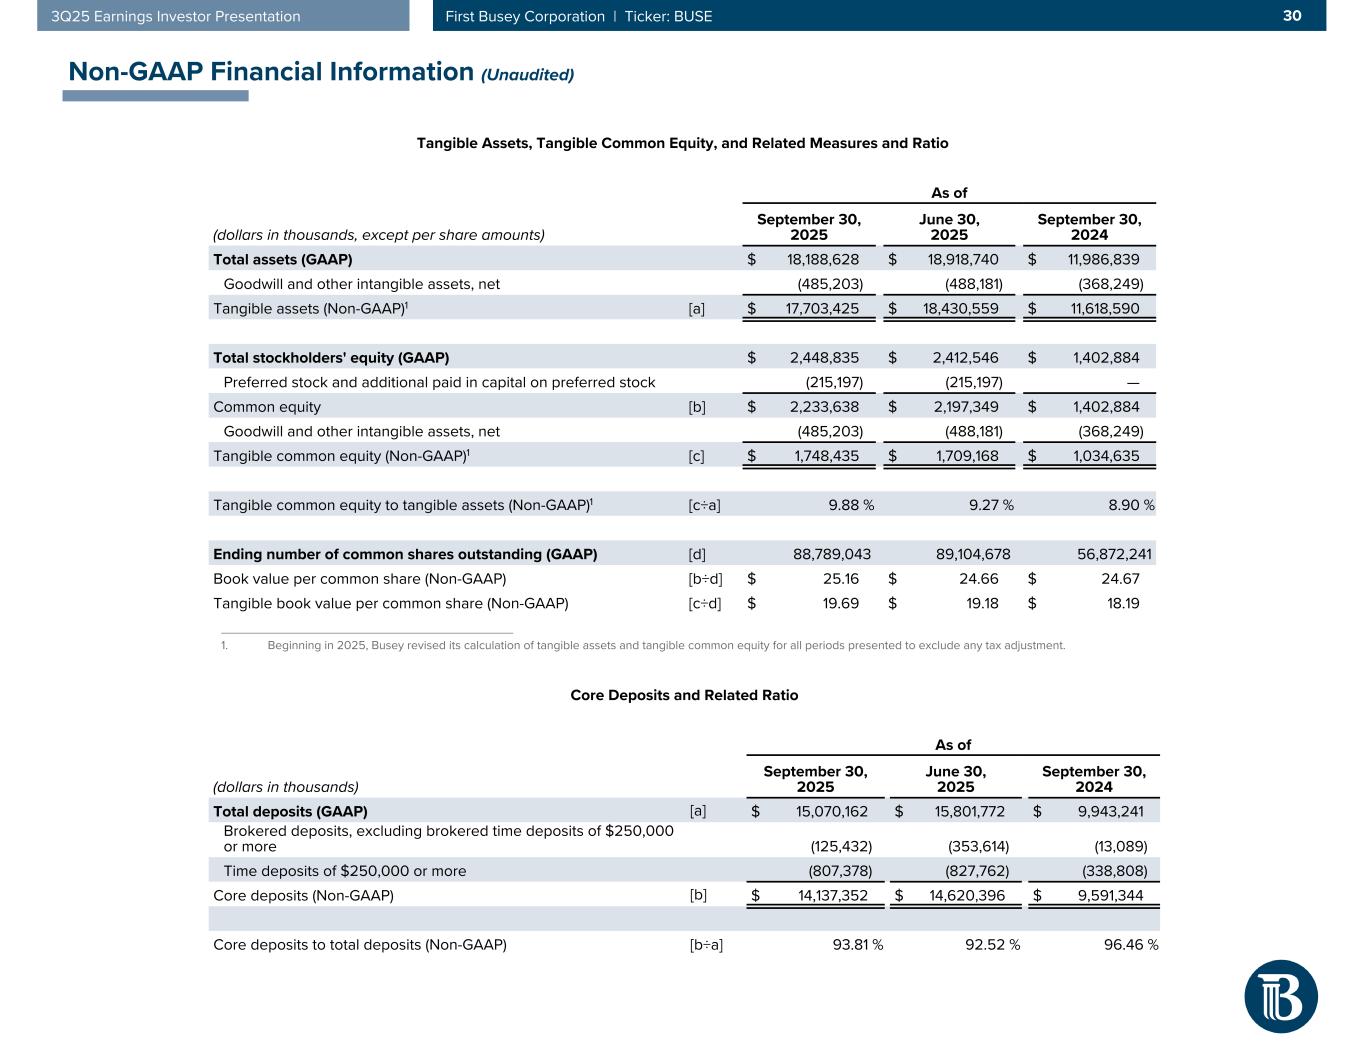
| Tangible Assets, Tangible Common Equity, and Related Measures and Ratio |
| | | | | | | | | | |
| | As of |
| (dollars in thousands, except per share amounts) | | September 30,
2025 | | June 30,
2025 | | | | | | September 30,
2024 |
| Total assets (GAAP) | | $ | 18,188,628 | | | $ | 18,918,740 | | | | | | | $ | 11,986,839 | |
| Goodwill and other intangible assets, net | | (485,203) | | | (488,181) | | | | | | | (368,249) | |
Tangible assets (Non-GAAP)1 | [a] | $ | 17,703,425 | | | $ | 18,430,559 | | | | | | | $ | 11,618,590 | |
| | | | | | | | | | |
| Total stockholders' equity (GAAP) | | $ | 2,448,835 | | | $ | 2,412,546 | | | | | | | $ | 1,402,884 | |
Preferred stock and additional paid in capital on preferred stock | | (215,197) | | | (215,197) | | | | | | | — | |
| Common equity | [b] | 2,233,638 | | | 2,197,349 | | | | | | | 1,402,884 | |
| Goodwill and other intangible assets, net | | (485,203) | | | (488,181) | | | | | | | (368,249) | |
Tangible common equity (Non-GAAP)1 | [c] | $ | 1,748,435 | | | $ | 1,709,168 | | | | | | | $ | 1,034,635 | |
| | | | | | | | | | |
Tangible common equity to tangible assets (Non-GAAP)1 | [c÷a] | 9.88 | % | | 9.27 | % | | | | | | 8.90 | % |
| | | | | | | | | | |
| Ending number of common shares outstanding (GAAP) | [d] | 88,789,043 | | | 89,104,678 | | | | | | | 56,872,241 | |
| Book value per common share (Non-GAAP) | [b÷d] | $ | 25.16 | | | $ | 24.66 | | | | | | | $ | 24.67 | |
| Tangible book value per common share (Non-GAAP) | [c÷d] | $ | 19.69 | | | $ | 19.18 | | | | | | | $ | 18.19 | |
___________________________________________
1.Beginning in 2025, Busey revised its calculation of tangible assets and tangible common equity for all periods presented to exclude any tax adjustment.
| | | | | | | | | | | | | | | | | | | | | | | | |
| Core Deposits and Related Ratio |
| | | | | | | | | | |
| | As of |
| (dollars in thousands) | | September 30,
2025 | | June 30,
2025 | | | | | | September 30,
2024 |
| Total deposits (GAAP) | [a] | $ | 15,070,162 | | | $ | 15,801,772 | | | | | | | $ | 9,943,241 | |
| Brokered deposits, excluding brokered time deposits of $250,000 or more | | (125,432) | | | (353,614) | | | | | | | (13,089) | |
| Time deposits of $250,000 or more | | (807,378) | | | (827,762) | | | | | | | (338,808) | |
| | | | | | | | | | |
| Core deposits (Non-GAAP) | [b] | $ | 14,137,352 | | | $ | 14,620,396 | | | | | | | $ | 9,591,344 | |
| | | | | | | | | | |
| Core deposits to total deposits (Non-GAAP) | [b÷a] | 93.81 | % | | 92.52 | % | | | | | | 96.46 | % |
First Busey Corporation (BUSE) | 2025 Q3 — 19
FORWARD-LOOKING STATEMENTS
This press release may contain “forward-looking statements” within the meaning of the Private Securities Litigation Reform Act of 1995 with respect to Busey’s financial condition, results of operations, plans, objectives, future performance, and business. Forward-looking statements, which may be based upon beliefs, expectations and assumptions of Busey’s management and on information currently available to management, are generally identifiable by the use of words such as “believe,” “expect,” “anticipate,” “plan,” “intend,” “estimate,” “may,” “will,” “would,” “could,” “should,” “position,” or other similar expressions. Additionally, all statements in this document, including forward-looking statements, speak only as of the date they are made, and Busey undertakes no obligation to update any statement in light of new information or future events.
A number of factors, many of which are beyond Busey’s ability to control or predict, could cause actual results to differ materially from those in any forward-looking statements. These factors include, among others, the following: (1) the strength of the local, state, national, and international economies and financial markets (including effects of a prolonged government shut-down, inflationary pressures, the threat or implementation of tariffs, trade wars, and changes to immigration policy); (2) changes in, and the interpretation and prioritization of, local, state, and federal laws, regulations, and governmental policies (including those concerning Busey's general business); (3) the economic impact of any future terrorist threats or attacks, widespread disease or pandemics, or other adverse external events that could cause economic deterioration or instability in credit markets (including Russia’s invasion of Ukraine and the conflict in the Middle East); (4) unexpected results of acquisitions, including the acquisition of CrossFirst, which may include the failure to realize the anticipated benefits of the acquisitions and the possibility that the transaction and integration costs may be greater than anticipated; (5) the imposition of tariffs or other governmental policies impacting the value of products produced by Busey's commercial borrowers; (6) new or revised accounting policies and practices as may be adopted by state and federal regulatory banking agencies, the Financial Accounting Standards Board, the Securities and Exchange Commission, or the Public Company Accounting Oversight Board; (7) changes in interest rates and prepayment rates of Busey’s assets (including the impact of sustained elevated interest rates); (8) increased competition in the financial services sector (including from non-bank competitors such as credit unions and fintech companies) and the inability to attract new customers; (9) technological changes implemented by us and other parties, including our third-party vendors, which may have unforeseen consequences to us and our customers, including the development and implementation of tools incorporating artificial intelligence; (10) the loss of key executives or associates, talent shortages, and employee turnover; (11) unexpected outcomes and costs of existing or new litigation, investigations, or other legal proceedings, inquiries, and regulatory actions involving Busey (including with respect to Busey’s Illinois franchise taxes); (12) fluctuations in the value of securities held in Busey’s securities portfolio, including as a result of changes in interest rates; (13) credit risk and risk from concentrations (by type of borrower, geographic area, collateral, and industry), within Busey's loan portfolio and large loans to certain borrowers (including commercial real estate loans); (14) the concentration of large deposits from certain clients who have balances above current Federal Deposit Insurance Corporation insurance limits and may withdraw deposits to diversify their exposure; (15) the level of non-performing assets on Busey’s balance sheets; (16) interruptions involving information technology and communications systems or third-party servicers; (17) breaches or failures of information security controls or cybersecurity-related incidents; (18) the economic impact on Busey and its customers of climate change, natural disasters, and exceptional weather occurrences such as tornadoes, hurricanes, floods, blizzards, and droughts; (19) the ability to successfully manage liquidity risk, which may increase dependence on non-core funding sources such as brokered deposits, and may negatively impact Busey's cost of funds; (20) the ability to maintain an adequate level of allowance for credit losses on loans; (21) the effectiveness of Busey’s risk management framework; and (22) the ability of Busey to manage the risks associated with the foregoing. These risks and uncertainties should be considered in evaluating forward-looking statements and undue reliance should not be placed on such statements.
Additional information concerning Busey and its business, including additional factors that could materially affect Busey’s financial results, is included in Busey’s filings with the Securities and Exchange Commission.
First Busey Corporation (BUSE) | 2025 Q3 — 20
END NOTES
| | | | | |
| (1) | Annualized measure. |
| (2) | Represents a non-GAAP financial measure. For a reconciliation to the most directly comparable financial measure calculated and presented in accordance with Generally Accepted Accounting Principles (“GAAP”), see "Non-GAAP Financial Information.” |
| (3) | Capital amounts and ratios as of September 30, 2025, are not yet finalized and are subject to change. |
| (4) | The blended benchmark consists of 60% MSCI All Country World Index and 40% Bloomberg Intermediate US Government/Credit Total Return Index. |
| |
| (5) | Estimated uninsured and uncollateralized deposits consist of account balances in excess of the $250,000 Federal Deposit Insurance Corporation insurance limit, less intercompany accounts, fully collateralized accounts (including preferred deposits), and pass-through accounts where clients have deposit insurance at the correspondent financial institution. |
| (6) | On- and off-balance sheet liquidity is comprised of cash and cash equivalents, debt securities excluding those pledged as collateral, brokered deposits, and Busey’s borrowing capacity through its revolving credit facility, the FHLB, the Federal Reserve Bank, and federal funds purchased lines. |
First Busey Corporation (BUSE) | 2025 Q3 — 21
First Busey Corporation
11440 Tomahawk Creek Parkway, Leawood, KS 66211
NASDAQ: BUSE
Busey 2025 | All Rights Reserved
Busey’s Financial Suite of Services
| | | | | | | | |
 Member FDIC Member FDIC | | busey.com |