bw-20211110
0001630805FALSE00016308052021-11-102021-11-100001630805us-gaap:CommonStockMember2021-11-102021-11-100001630805bw:SeniorNotes8125Due2026Member2021-11-102021-11-100001630805us-gaap:SeriesAPreferredStockMember2021-11-102021-11-10


UNITED STATES
SECURITIES AND EXCHANGE COMMISSION
Washington, D.C. 20549
FORM 8-K
CURRENT REPORT
Pursuant to Section 13 or 15 (d)
of the Securities Exchange Act of 1934
Date of Report (Date of earliest event reported): November 10, 2021
BABCOCK & WILCOX ENTERPRISES, INC.
(Exact name of registrant as specified in its charter)

Delaware001-3687647-2783641
(State or other jurisdiction of incorporation)(Commission File Number)(IRS Employer Identification No.)
1200 East Market Street
Suite 650
Akron,Ohio44305
(Address of Principal Executive Offices)(Zip Code)
Registrant’s Telephone Number, including Area Code: (330) 753-4511
Check the appropriate box below if the Form 8-K filing is intended to simultaneously satisfy the filing obligation of the registrant under any of the following provisions:

 Written communications pursuant to Rule 425 under the Securities Act (17 CFR 230.425)

Soliciting material pursuant to Rule 14a-12 under the Exchange Act (17 CFR 240.14a-12)

Pre-commencement communications pursuant to Rule 14d-2(b) under the Exchange Act (17 CFR 240.14d-2(b))

 Pre-commencement communications pursuant to Rule 13e-4(c) under the Exchange Act (17 CFR 240.13e-4(c))

Securities registered pursuant to Section 12(b) of the Act:
Title of Each ClassTrading SymbolName of Each Exchange on which Registered
Common stock, $0.01 par value per shareBWNew York Stock Exchange
8.125% Senior Notes due 2026BWSNNew York Stock Exchange
7.75% Series A Cumulative Perpetual Preferred StockBW PRANew York Stock Exchange
Indicate by check mark whether the registrant is an emerging growth company as defined in Rule 405 of the Securities Act of 1933 (17 CFR §230.405) or Rule 12b-2 of the Securities Exchange Act of 1934 (17 CFR §240.12b-2).
Emerging growth company
If an emerging growth company, indicate by check mark if the registrant has elected not to use the extended transition period for complying with any new or revised financial accounting standards provided pursuant to Section 13(a) of the Exchange Act. ¨


Item 2.02               Results of Operations and Financial Condition

On November 10, 2021, the Company issued a press release announcing our financial results for the third quarter ended September 30, 2021. A copy of the press release is attached as Exhibit 99.1, and the information contained in Exhibit 99.1 is incorporated by reference.  

The information furnished pursuant to this Item 2.02, including Exhibit 99.1, shall not be deemed to be “filed” for the purposes of Section 18 of the Securities Exchange Act of 1934, as amended (the “Exchange Act”), or otherwise subject to the liabilities of that section, nor shall such information be deemed incorporated by reference in any filing under the Securities Act of 1933, as amended (the “Securities Act”), or the Exchange Act, except as shall be expressly set forth by specific reference in such filing.

Item 7.01 Regulation FD Disclosure.

On November 10, 2021, the Company posted an investor presentation on the investor relations section of its website at babcock.com. A copy of the presentation is attached as Exhibit 99.2, and the information contained in Exhibit 99.2 is incorporated herein by reference.

The information furnished pursuant to this Item 7.01, including Exhibit 99.2, shall not be deemed “filed” for purposes of Section 18 of the Exchange Act or incorporated by reference in any filing under the Securities Act or the Exchange Act, except as shall be expressly set forth by specific reference in such filing.

Item 9.01.    Financial Statements and Exhibits

(d) Exhibits

Exhibit No.Description
Press Release dated November 10, 2021.
Investor Presentation
104Cover Page Interactive Data File (formatted as Inline XBRL and contained in Exhibit 101)


2


Signatures

Pursuant to the requirements of the Securities Exchange Act of 1934, the registrant has duly caused this report to be signed on its behalf by the undersigned thereunto duly authorized.
BABCOCK & WILCOX ENTERPRISES, INC.
November 10, 2021
By:
/s/ Louis Salamone
Louis Salamone
Executive Vice President, Chief Financial Officer and Chief Accounting Officer
(Principal Accounting Officer and Duly Authorized Representative)

3
bwlogoname4clra02a.jpg
Exhibit 99.1
News Release

Babcock & Wilcox Enterprises Reports Third Quarter 2021 Results
Strong Third Quarter with Accelerating Bookings Entering Fourth Quarter

Q3 2021 Highlights:
- Revenues of $160.0 million
- Net income of $13.6 million
- Earnings per share of $0.12
- Consolidated adjusted EBITDA of $18.7 million
- New bookings of $194 million in third quarter 2021; anticipated fourth quarter 2021 bookings of $250 million to $300 million and full-year 2021 bookings at the highest level of annual bookings since 2017
- 2022 adjusted EBITDA target raised to $110 million to $120 million1


(AKRON, Ohio – November 10, 2021) – Babcock & Wilcox Enterprises, Inc. ("B&W" or the "Company") (NYSE: BW) announced results for the third quarter of 2021.

"Our better-than-anticipated results in the third quarter of 2021, combined with recent and anticipated bookings, have positioned us for a robust fourth quarter and an even stronger 2022," said Kenneth Young, B&W's Chairman and Chief Executive Officer. "Despite the continued adverse effects of COVID-19 on our customers and global supply chain challenges, we are doing what we said we'd do--booking Renewable waste-to-energy projects, growing our Environmental business, investing in our ClimateBrightTM decarbonization platform and expanding our clean energy offerings through strategic acquisitions."

"During the third quarter, we booked two renewable new-build projects, including a $35 million contract to supply waste-to-energy technologies for new-build facilities in Greenland and a $38 million technology award for new-build waste-to-energy facilities in East Asia, and we've made significant progress toward booking another two or three renewable new-build projects in 2021," Young continued. "In addition, our ongoing international expansion helped drive the award of two environmental emissions contracts in the Asia-Pacific region during the third quarter, while interest in our decarbonization technologies is expanding, as demonstrated by our recent agreement to jointly develop an innovative biomass-to-hydrogen clean energy project in Australia utilizing our BrightLoopTM hydrogen production technology."

"We also further expanded our clean and renewable energy businesses by announcing two acquisitions in the third quarter," Young added. "We closed the acquisition of a controlling stake in a leading solar installation and services firm, Fosler Construction Company Inc., at the end of September, and we're excited about the substantial opportunities we see for solar installation and construction services in the U.S. and the support we can provide to further accelerate Fosler's growth. We also signed an agreement to acquire VODA A/S in Denmark, which in conjunction with our existing aftermarket services business, will form B&W Renewable Service to create a platform for our expanding renewable service business in Europe. We are continuing to explore additional acquisition opportunities in both emerging technologies and mature markets and aggressively pursuing opportunities to further increase shareholder value."


"Our continued pursuit of an overall pipeline of more than $6.5 billion of identified project opportunities through 2024 has led to accelerating bookings momentum with bookings of approximately $90 million in October 2021 alone. Additionally, for the full-year 2021, we are anticipating the highest level of annual bookings since 2017 and we expect to end the year with significantly higher backlog compared to the end of 2020. More than 60% of our pipeline is related to Renewable and Environmental opportunities, which will directly reflect the performance of our long-term strategy," Young stated. "Based on current expectations, including the impact of the COVID-19 Delta variant on our customers and our supply chain disruptions, we are targeting at least $70 million of adjusted EBITDA for full year 2021, which represents a significant operational improvement compared to 2020. We are also raising our 2022 adjusted EBITDA target to $110 million to $120 million as we anticipate the continued momentum of our ongoing growth strategies, strong backlog, accelerating bookings, and acquisition strategy1."

Q3 2021 Financial Summary

Consolidated revenues in the third quarter of 2021 were $160.0 million, a 20.7% improvement compared to the third quarter of 2020, primarily due to a higher level of activity in our project business within our Thermal segment as well as increased volume and higher overall project activity in our Environmental segment partially offset by the effects of project timing in our Renewable segment. Revenues in all segments were adversely impacted by COVID-19 as customers delayed projects and travel restrictions limited the ability of the Company's workforce to visit job sites. GAAP operating income in the third quarter of 2021 was $14.8 million, compared to operating income of $14.1 million in the third quarter of 2020. This increase was primarily due to the revenue increase discussed above; operating income in the prior-year quarter included the recognition of a non-recurring insurance loss recovery of $26.0 million under an October 10, 2020 settlement agreement with an insurer in connection with five of the six historical European B&W Renewable EPC loss contracts. Adjusted EBITDA was $18.7 million compared to $0.8 million in the third quarter of 2020, excluding the non-recurring insurance loss recovery of $26.0 million in the third quarter of 2020 as described above. New bookings in the third quarter of 2021 were $194 million. Backlog at September 30, 2021 was $540 million inclusive of a $21 million de-booking related to a 2016 construction booking in the Thermal segment. All amounts referred to in this release are on a continuing operations basis, unless otherwise noted. Reconciliations of net income, the most directly comparable GAAP measure, to adjusted EBITDA, and to adjusted gross profit for the Company's segments, are provided in the exhibits to this release.

Babcock & Wilcox Renewable segment revenues were $38.0 million for the third quarter of 2021, compared to $39.1 million in the third quarter of 2020. The reduction in revenue is primarily due to the completion of large service and licensing projects in the third quarter of 2020 compared to current volume in the third quarter of 2021. Adjusted EBITDA in the quarter was $11.4 million compared to negative $2.4 million in the third quarter of 2020, excluding the non-recurring insurance loss recovery of $26.0 million recognized in third quarter of 2020 under an October 10, 2020 settlement agreement with an insurer in connection with five of the six European B&W Renewable EPC loss contracts. Adjusted gross profit was $17.4 million in the third quarter of 2021, compared to $6.1 million in the prior-year period, excluding the third quarter 2020 non-recurring loss recovery.

Babcock & Wilcox Environmental segment revenues were $38.2 million in the third quarter of 2021, an increase of 51.4% compared to $25.3 million in the third quarter of 2020. The increase was primarily driven by increased volume in our Allen-Sherman-Hoff project business as well as higher overall project activity in the current quarter as compared to the prior-year period which was impacted by the postponement of new projects as a result of COVID-19. Adjusted EBITDA was $3.5 million, compared to
1 The most comparable GAAP financial measure is not available without unreasonable effort.

bwfootera23a.jpg


$2.2 million in the same period last year, primarily driven by the higher volume partially offset by an increase in allocated cost for shared resources. Adjusted gross profit was $7.9 million in the third quarter of 2021, compared to $6.9 million in the prior-year period.


Babcock & Wilcox Thermal segment revenues were $83.8 million in the third quarter of 2021, an increase of 19.7% compared to $70.0 million in the prior-year period, primarily due to a higher level of activity in our project business than in the prior-year period which was negatively impacted by COVID-19. Adjusted EBITDA in the third quarter of 2021 was $9.2 million, an increase of 26.3% compared to $7.3 million in last year's quarter, primarily due to the increase in volume, partially offset by the effects of product mix and an increase in shared resources due to higher volume; adjusted EBITDA margin was 11.0% in the quarter compared to 10.4% in the same period last year. Adjusted gross profit in the third quarter of 2021 improved to $21.3 million, compared to $20.6 million in the prior-year period, primarily due to the increase in revenue offset partially by less favorable product mix and an increase in allocated cost for shared resources due to higher volume.


Acquisitions

On September 30, 2021, the Company acquired a 60% controlling ownership stake in Illinois-based solar energy contractor Fosler Construction Company Inc. ("Fosler Construction"). Fosler Construction provides commercial, industrial and utility-scale solar services and owns two community solar projects in Illinois being developed under the Illinois Solar for All program. Fosler Construction, founded in 1998 and employing approximately 120 people, has a track record of successfully completing solar projects profitably with union labor and aligning its model with a growing number of renewable project incentives in the U.S. Fosler Construction is well-positioned to capitalize on the high-growth solar market in the U.S. and the acquisition aligns with the Company's growth strategy for its clean and renewable energy businesses. Fosler Construction will be reported as part of the B&W Renewable segment, and will operate under the name Fosler Solar, a Babcock & Wilcox company.

In addition, on September 28, 2021, the Company announced that it had signed a definitive agreement to acquire VODA A/S, a leading multi-brand aftermarket parts and service provider for the waste-to-energy and biomass-to-energy markets based in Vejen, Denmark. The Company plans to combine VODA A/S with its aftermarket services business to serve as B&W's platform for its renewable service business in Europe. The transaction is targeted to close by the end of the year, following the satisfaction of customary closing conditions, including regulatory review in Denmark which is currently ongoing.


COVID-19 Impact

The global COVID-19 pandemic has disrupted business operations including global supply chains, trade, commerce, financial and credit markets, and daily life throughout the world. The Company's business has been, and continues to be, adversely impacted by the measures taken and restrictions imposed in the countries in which it operates and by local governments and others to control the spread of this virus. These measures and restrictions have varied widely and have been subject to significant changes from time to time depending on the changes in the severity of the virus in these countries and localities. These restrictions, including travel and curtailment of other activity, negatively impact the Company's ability to conduct business.

The COVID-19 pandemic has also disrupted global supply chains including the manufacturing, supply, distribution, transportation and delivery of the Company's products. The Company could also see
bwfootera23a.jpg


significant disruptions of the operations of logistics, service providers, delays in shipments and negative impacts to pricing of certain products. Disruptions and delays in the Company's supply chains as a result of the COVID-19 pandemic could adversely impact the ability to meet customers’ demands. Lastly, the prioritization of shipments of certain products as a result of the pandemic could cause delays in the shipment or delivery of the Company's products. Such disruptions could result in reduced sales.

The volatility and variability of the virus has limited the Company's ability to forecast the impact of the virus on its customers and its business. The continuing resurgence of COVID-19, including new strains such as the Delta variant, has resulted in the reimposition of certain restrictions and may lead to other restrictions being implemented in response to efforts to reduce the spread of the virus. These varying and changing events have caused many of the projects the Company had anticipated would begin in 2020 to be delayed into the second half of 2021 and beyond. Many customers and projects require B&W's employees to travel to customer and project worksites. Certain customers and significant projects are located in areas where travel restrictions have been imposed, certain customers have closed or reduced on-site activities, and timelines for completion of certain projects have, as noted above, been extended into the fourth quarter of 2021 and beyond. Additionally, out of concern for the Company's employees, even where restrictions permit employees to return to its offices and worksites, the Company has incurred additional costs to protect its employees as well as advising those who are uncomfortable returning to worksites due to the pandemic that they are not required to do so for an indefinite period of time. The resulting uncertainty concerning, among other things, the spread and economic impact of the virus has also caused significant volatility and, at times, illiquidity in global equity and credit markets. The full extent of the COVID-19 impact on the Company's operational and financial performance will depend on future developments, including the ultimate duration and spread of the pandemic and related actions taken by the U.S. government, state and local government officials, and international governments to prevent disease spread, as well as the availability and effectiveness of COVID-19 vaccinations in the U.S. and abroad, all of which are uncertain, out of the Company's control, and cannot be predicted.


Liquidity and Balance Sheet

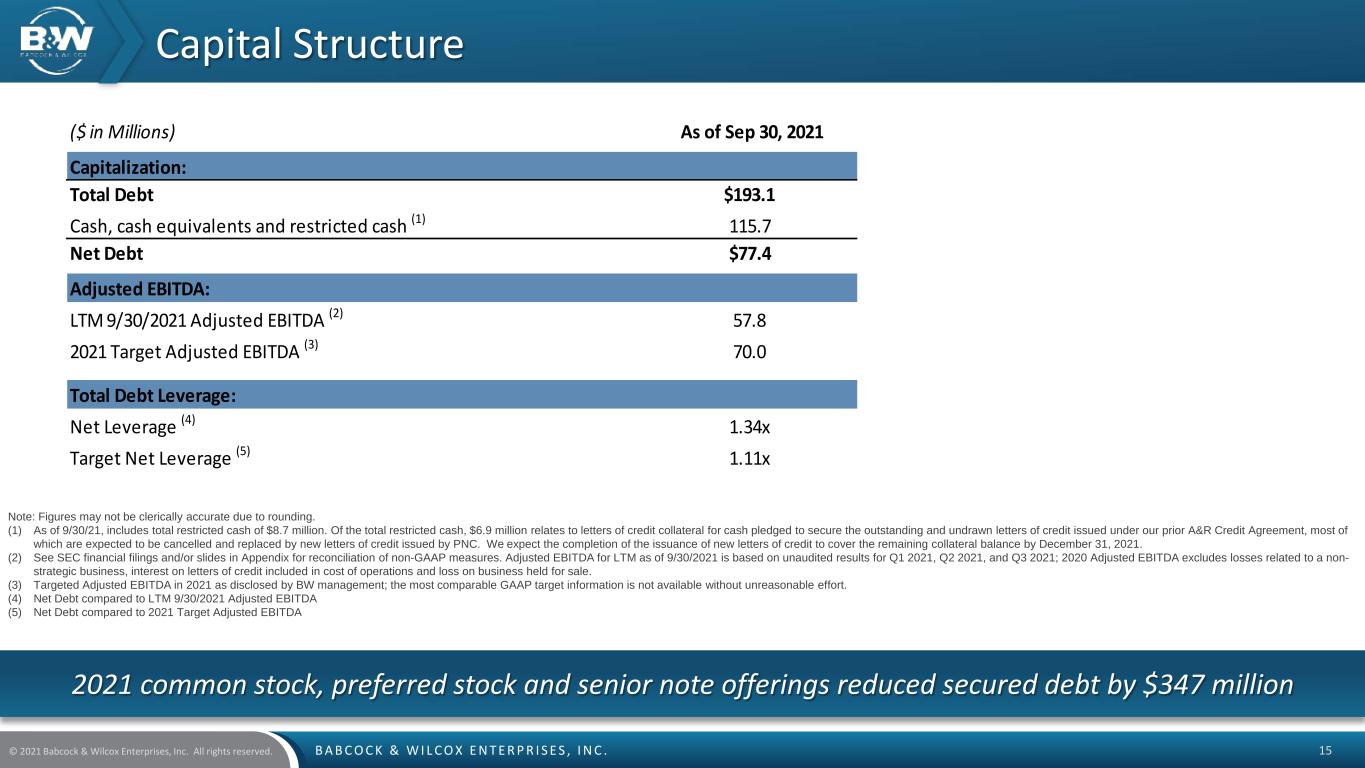
At September 30, 2021, the Company had total gross debt of $193.1 million and a cash, cash equivalents and restricted cash balance of $115.7 million inclusive of net proceeds under the Company's "at-the-market" ("ATM") sales agreements through September 30, 2021 and after cash paid for the Fosler Construction acquisition.


Conclusion of Previously Disclosed SEC Investigation

On October 20, 2021, the Company received a letter from the staff of the Division of Enforcement of the Atlanta Regional Office of the U.S. Securities and Exchange Commission (“Commission”) confirming that the staff has concluded its investigation of the Company that the Company has previously disclosed in its SEC filings and that it does not intend to recommend to the Commission that an enforcement action be brought against the Company.


Earnings Call Information

B&W plans to host a conference call and webcast on Wednesday, November 10, 2021 at 5 p.m. ET to discuss the Company’s third quarter 2021 results. The listen-only audio of the conference call will be broadcast live via the Internet on B&W’s Investor Relations site. The dial-in number for participants in the U.S. is (844) 200-6205; the dial-in number for participants in Canada is (833) 950-0062; the dial-in
bwfootera23a.jpg


number for participants in all other locations is (929) 526-1599. The conference ID for all participants is 860282. A replay of this conference call will remain accessible in the investor relations section of the Company's website for a limited time.


Non-GAAP Financial Measures

The Company uses non-GAAP financial measures internally to evaluate its performance and in making financial and operational decisions. When viewed in conjunction with GAAP results and the accompanying reconciliation, the Company believes that its presentation of these measures provides investors with greater transparency and a greater understanding of factors affecting its financial condition and results of operations than GAAP measures alone. As previously disclosed, the Company changed its reportable segments in 2020 and has recast prior period results to account for this change. Additionally, the Company redefined its definition of adjusted EBITDA to eliminate the effects of certain items including the loss from a non-strategic business, interest on letters of credit included in cost of operations and loss on business held for sale. Prior period results have been revised to conform with the revised definition and present separate reconciling items in our reconciliation.

This release presents adjusted gross profit for each business segment and adjusted EBITDA, which are non-GAAP financial measures. Adjusted EBITDA on a consolidated basis is defined as the sum of the adjusted EBITDA for each of the segments, further adjusted for corporate allocations and research and development costs. At a segment level, the adjusted EBITDA presented is consistent with the way the Company's chief operating decision maker reviews the results of operations and makes strategic decisions about the business and is calculated as earnings before interest, tax, depreciation and amortization adjusted for items such as gains or losses on asset sales, net pension benefits, restructuring costs, impairments, gains and losses on debt extinguishment, costs related to financial consulting, research and development costs and other costs that may not be directly controllable by segment management and are not allocated to the segment. The Company presented consolidated Adjusted EBITDA because it believes it is useful to investors to help facilitate comparisons of the ongoing, operating performance before corporate overhead and other expenses not attributable to the operating performance of the Company's revenue generating segments. This release also presents certain targets for our adjusted EBITDA in the future; these targets are not intended as guidance regarding how the Company believes the business will perform. The Company is unable to reconcile these targets to their GAAP counterparts without unreasonable effort and expense due to the aspirational nature of these targets.

This release also presents adjusted gross profit by segment. The Company believes that adjusted gross profit by segment is useful to investors to help facilitate comparisons of the ongoing, operating performance of the segments by excluding expenses related to, among other things, activities related to the spin-off, activities related to various restructuring activities the Company has undertaken, corporate overhead (such as SG&A expenses and research and development costs) and certain non-cash expenses such as intangible amortization and goodwill impairments that are not allocated by segment.


Forward-Looking Statements

This press release contains forward-looking statements within the meaning of the Private Securities Litigation Reform Act of 1995. All statements other than statements of historical or current fact included in the release are forward-looking statements. You should not place undue reliance on these statements. These forward-looking statements are based on management’s current expectations and involve a
bwfootera23a.jpg


number of risks and uncertainties, including, among other things, the impact of COVID-19 on the Company, the capital markets and global economic climate generally; the Company's ability to integrate acquired businesses and the impact of those acquired businesses on the Company's cash flows, results of operations and financial condition, including the Company's acquisition of Fosler Construction Company Inc; the Company’s recognition of any asset impairments as a result of any decline in the value of its assets or efforts to dispose of any assets in the future; the Company’s ability to obtain and maintain sufficient financing to provide liquidity to meet its business objectives, surety bonds, letters of credit and similar financing; the Company’s ability to comply with the requirements of, and to service the indebtedness under, our debt facility agreements; our ability to pay dividends on our 7.75% Series A Cumulative Perpetual Preferred Stock, the highly competitive nature of the Company’s businesses and ability to win work, including identified project opportunities in the pipeline; general economic and business conditions, including changes in interest rates and currency exchange rates; cancellations of and adjustments to backlog and the resulting impact from using backlog as an indicator of future earnings; the Company’s ability to perform contracts on time and on budget, in accordance with the schedules and terms established by the applicable contracts with customers; failure by third-party subcontractors, partners or suppliers to perform their obligations on time and as specified; the Company’s ability to successfully resolve claims by vendors for goods and services provided and claims by customers for items under warranty; the Company’s ability to realize anticipated savings and operational benefits from its restructuring plans, and other cost-savings initiatives; the Company’s ability to successfully address productivity and schedule issues in its B&W Renewable, B&W Environmental and B&W Thermal segments; the Company’s ability to successfully partner with third parties to win and execute contracts within its B&W Renewable, B&W Environmental and B&W Thermal segments; changes in the Company’s effective tax rate and tax positions, including any limitation on its ability to use its net operating loss carryforwards and other tax assets; the Company’s ability to successfully manage research and development projects and costs, including its efforts to successfully develop and commercialize new technologies and products; the operating risks normally incident to its lines of business, including professional liability, product liability, warranty and other claims against the Company; difficulties the Company may encounter in obtaining regulatory or other necessary permits or approvals; changes in actuarial assumptions and market fluctuations that affect its net pension liabilities and income; the Company’s ability to successfully compete with current and future competitors; the Company’s ability to negotiate and maintain good relationships with labor unions; changes in pension and medical expenses associated with its retirement benefit programs; social, political, competitive and economic situations in foreign countries where it does business or seeks new business; and the other factors specified and set forth under "Risk Factors" in the Company’s periodic reports filed with the Securities and Exchange Commission, including the Company’s most recent annual report on Form 10-K and its quarterly reports on Form 10-Q for the quarters ended March 31, 2021, June 30, 2021, and September 30, 2021.

These forward-looking statements are made based upon detailed assumptions and reflect management’s current expectations and beliefs. While the Company believes that these assumptions underlying the forward-looking statements are reasonable, the Company cautions that it is very difficult to predict the impact of known factors, and it is impossible for the Company to anticipate all factors that could affect actual results. The forward-looking statements included herein are made only as of the date hereof. The Company undertakes no obligation to publicly update or revise any forward-looking statement as a result of new information, future events, or otherwise, except as required by law.


About B&W Enterprises
Headquartered in Akron, Ohio, Babcock & Wilcox Enterprises is a global leader in energy and environmental technologies and services for the power and industrial markets. Follow B&W on LinkedIn and learn more at www.babcock.com.      

bwfootera23a.jpg


# # #
Investor Contact:Media Contact:
Megan WilsonRyan Cornell
Vice President, Corporate Development & Investor Relations
Public Relations
Babcock & Wilcox EnterprisesBabcock & Wilcox Enterprises
704.625.4944 | [email protected]
330.860.1345 | [email protected]

bwfootera23a.jpg


Exhibit 1
Babcock & Wilcox Enterprises, Inc.
Condensed Consolidated Statements of Operations(1)
(In millions, except per share amounts)
Three months ended September 30,Nine months ended September 30,
2021202020212020
Revenues$160.0 $132.5 $531.1 $416.5 
Costs and expenses:
Cost of operations114.6 75.2 404.8 292.7 
Selling, general and administrative expenses38.2 35.7 112.4 107.9 
Advisory fees and settlement costs1.8 3.8 9.7 10.1 
Restructuring activities4.6 2.4 8.0 6.7 
Research and development (benefit) costs(0.2)1.4 1.0 3.9 
Gain on asset disposals, net (13.8)— (15.8)(0.9)
Total costs and expenses145.2 118.4 520.0 420.4 
Operating income (loss)14.8 14.1 11.1 (3.9)
Other income (expense):
Interest expense(8.3)(12.2)(30.6)(49.8)
Interest income0.1 0.2 0.4 0.4 
Gain (loss) on debt extinguishment— — 6.5 (6.2)
Loss on sale of business— — (2.2)(0.1)
Benefit plans, net9.9 7.3 24.9 22.3 
Foreign exchange(1.7)25.0 (1.1)22.7 
Other – net(0.8)(0.3)(1.0)(3.1)
Total other income (expense)(0.8)20.0 (3.1)(13.7)
Income (loss) before income tax expense13.9 34.1 8.0 (17.6)
Income tax expense (benefit)0.3 (0.5)6.7 (0.5)
Income (loss) from continuing operations13.6 34.6 1.3 (17.1)
Income from discontinued operations, net of tax— — — 1.8 
Net income (loss)13.6 34.6 1.3 (15.3)
Net (income) loss attributable to non-controlling interest— 0.2 — 0.4 
Net income (loss) attributable to stockholders13.6 34.7 1.3 (14.9)
Less: Dividend on Series A preferred stock3.7 — 5.4 — 
Net income (loss) attributable to stockholders of common stock$10.0 $34.7 $(4.1)$(14.9)
Basic earnings (loss) per share
Continuing operations$0.12 $0.70 $(0.05)$(0.35)
Discontinued operations— — — 0.04 
Basic earnings (loss) per share$0.12 $0.70 $(0.05)$(0.31)
Diluted earnings (loss) per share
Continuing operations$0.11 $0.69 $(0.05)$(0.35)
Discontinued operations— — — 0.04 
Diluted earnings (loss) per share$0.11 $0.69 $(0.05)$(0.31)
Shares used in the computation of earnings (loss) per share:
Basic86.0 49.5 81.1 47.6 
Diluted 87.0 50.1 81.1 47.6 
(1) Figures may not be clerically accurate due to rounding
bwfootera23a.jpg


Exhibit 2
Babcock & Wilcox Enterprises, Inc.
Condensed Consolidated Balance Sheets(1)
(In millions, except per share amount)September 30, 2021December 31, 2020
Cash, cash equivalents and restricted cash$115.7 $67.4 
Accounts receivable – trade, net129.9 128.3 
Accounts receivable – other36.9 35.4 
Contracts in progress68.3 59.3 
Inventories73.0 67.2 
Other current assets22.9 26.4 
Current assets held for sale— 4.7 
Total current assets446.8 388.8 
Net property, plant and equipment, and finance lease109.9 85.1 
Goodwill90.5 47.4 
Intangible assets37.5 23.9 
Right-of-use assets9.8 10.8 
Other assets34.8 24.7 
Non-current assets held for sale— 11.2 
Total assets$729.4 $591.8 
Accounts payable$85.9 $73.5 
Accrued employee benefits15.7 13.9 
Advance billings on contracts44.4 64.0 
Accrued warranty expense15.2 25.4 
Financing lease liabilities3.3 0.9 
Operating lease liabilities3.7 4.0 
Other accrued liabilities52.0 80.9 
Loans payable10.1 — 
Current liabilities held for sale— 8.3 
Total current liabilities230.3 270.8 
Senior notes181.2 — 
Long term loans payable1.8 — 
Last out term loans— 183.3 
Revolving credit facilities— 164.3 
Pension and other accumulated postretirement benefit liabilities205.1 252.3 
Non-current finance lease liabilities52.5 29.7 
Non-current operating lease liabilities6.3 7.0 
Other non-current liabilities31.8 22.6 
Total liabilities709.0 930.1 
Commitments and contingencies
Stockholders' equity (deficit):
Preferred stock, par value $0.01 per share, authorized shares of 20,000; issued and outstanding shares of 7,599 and 0 at September 30, 2021 and December 30, 2020, respectively0.1 — 
Common stock, par value $0.01 per share, authorized shares of 500,000; issued and outstanding shares of 86,244 and 54,452 at September 30, 2021 and December 31, 2020, respectively 5.1 4.8 
Capital in excess of par value1,516.4 1,164.4 
Treasury stock at cost, 1,512 and 718 shares at September 30, 2021 and December 31, 2020, respectively(110.9)(106.0)
Accumulated deficit(1,354.3)(1,350.2)
Accumulated other comprehensive loss(59.1)(52.4)
Stockholders' deficit attributable to shareholders(2.8)(339.4)
Non-controlling interest23.2 1.1 
Total stockholders' equity (deficit)20.4 (338.3)
Total liabilities and stockholders' equity (deficit)$729.4 $591.8 
(1) Figures may not be clerically accurate due to rounding.
bwfootera23a.jpg


Exhibit 3
Babcock & Wilcox Enterprises, Inc.
Condensed Consolidated Statements of Cash Flows(1)
(In millions)Nine months ended September 30,
20212020
Cash flows from operating activities:
Net income (loss)$1.3 $(15.3)
Adjustments to reconcile net loss to net cash used in operating activities:
Depreciation and amortization of long-lived assets12.7 12.3 
Amortization of deferred financing costs and debt discount7.2 16.0 
Amortization of guaranty fee1.4 0.7 
Non-cash operating lease expense3.2 3.6 
Loss on sale of business2.2 0.1 
(Gain) loss on debt extinguishment(6.5)6.2 
Gain on asset disposals(15.8)(0.9)
Provision for (benefit from) deferred income taxes, including valuation allowances2.6 (0.8)
Mark to market, prior service cost amortization for pension and postretirement plans(1.7)(0.7)
Stock-based compensation, net of associated income taxes6.6 3.3 
Equitized non-cash interest expense— 8.0 
Foreign exchange 1.1 (22.7)
Changes in assets and liabilities:
Accounts receivable1.5 28.6 
Accrued insurance receivable— (26.0)
Contracts in progress (9.4)21.6 
Advance billings on contracts(20.6)(23.2)
Inventories(4.7)(4.9)
Income taxes(4.2)(4.8)
Accounts payable7.4 (33.5)
Accrued and other current liabilities(44.8)13.8 
Accrued contract loss(0.3)(5.3)
Pension liabilities, accrued postretirement benefits and employee benefits(47.1)(25.9)
Other, net0.1 (17.6)
Net cash used in operating activities(107.8)(67.3)
Cash flows from investing activities:
Purchase of property, plant and equipment(4.2)(2.3)
Acquisition of business(27.2)— 
Proceeds from sale of business and assets, net23.8 8.8 
Purchases of available-for-sale securities(9.6)(19.1)
Sales and maturities of available-for-sale securities11.4 14.6 
Net cash (used in) from investing activities(5.9)2.0 
bwfootera23a.jpg


(In millions)Nine months ended September 30,
20212020
Cash flows from financing activities:
Issuance of senior notes, net151.2 — 
Borrowings on loan payable3.5 — 
Borrowings under last out term loans— 60.0 
Repayments under last out term loans(75.4)— 
Borrowings under U.S. revolving credit facility14.5 126.3 
Repayments of U.S. revolving credit facility(178.8)(123.4)
Issuance of preferred stock, net111.9 — 
Payment of preferred stock dividends(5.4)— 
Shares of common stock returned to treasury stock(4.9)(0.3)
Issuance of common stock, net160.9 — 
Debt issuance costs(16.7)(10.3)
Other, net(1.6)0.1 
Net cash from financing activities159.2 52.4 
Effects of exchange rate changes on cash2.8 4.4 
Net increase (decrease) in cash, cash equivalents and restricted cash48.3 (8.6)
Cash, cash equivalents and restricted cash, beginning of period67.4 56.9 
Cash, cash equivalents and restricted cash, end of period$115.7 $48.4 

(1) Figures may not be clerically accurate due to rounding.
bwfootera23a.jpg


Exhibit 4
Babcock & Wilcox Enterprises, Inc.
Segment Information(1)
(In millions)
SEGMENT RESULTSThree months ended September 30,Nine months ended September 30,
2021202020212020
REVENUES:
Babcock & Wilcox Renewable$38.0 $39.1 $105.2 $118.6 
Babcock & Wilcox Environmental 38.2 25.3 97.8 76.4 
Babcock & Wilcox Thermal83.8 70.0 328.4 223.9 
Other(0.1)(1.8)(0.3)(2.4)
$160.0 $132.5 $531.1 $416.5 
ADJUSTED EBITDA:(2)
Babcock & Wilcox Renewable(3)
$11.4 $23.6 $15.0 $22.0 
Babcock & Wilcox Environmental3.5 2.2 7.3 1.4 
Babcock & Wilcox Thermal9.2 7.3 32.1 22.9 
Corporate(5.9)(4.9)(11.5)(12.9)
Research and development benefit (costs)0.5 (1.4)(0.6)(3.9)
$18.7 $26.8 $42.3 $29.5 
AMORTIZATION EXPENSE:
Babcock & Wilcox Renewable (4)
$0.3 $0.1 $0.6 $0.5 
Babcock & Wilcox Environmental0.8 0.8 2.4 2.3 
Babcock & Wilcox Thermal (5)
1.0 0.4 2.3 1.3 
$2.0 $1.4 $5.3 $4.1 
DEPRECIATION EXPENSE:
Babcock & Wilcox Renewable$0.7 $0.7 $2.2 $2.3 
Babcock & Wilcox Environmental0.4 0.4 1.2 1.4 
Babcock & Wilcox Thermal1.2 1.5 4.0 4.5 
Corporate— — — — 
$2.3 $2.7 $7.4 $8.2 
As of September 30,
BACKLOG:20212020
Babcock & Wilcox Renewable (6)
$313 $196 
Babcock & Wilcox Environmental101 107 
Babcock & Wilcox Thermal130 208 
Other/Eliminations(4)(2)
$540 $509 

(1) Figures may not be clerically accurate due to rounding.
(2) Adjusted EBITDA for the three and nine months ended September 30, 2020, excludes losses related to a non-strategic business and interest on letters of credit included in cost of operations that were previously included in Adjusted EBITDA and total $0.9 million and $0.2 million, respectively, and $1.2 million and $0.6 million, respectively.
(3) Adjusted EBITDA for the three and nine months ended September 30, 2020 includes $26 million loss recoveries related to claims in connection with multiple Renewable EPC loss contracts.
(4) Amortization expense in the Babcock & Wilcox Renewable segment include $0.3 million and $0.6 million in finance lease amortization for the three and nine months ended September 30, 2021, respectively. Amortization expense in the Babcock & Wilcox Renewable segment include $0.1 million and $0.3 million in finance lease amortization for the three and nine months ended September 30, 2020, respectively.
(5) Amortization expense in the Babcock & Wilcox Thermal segment include $0.9 million and $2.2 million in finance lease amortization for the three and nine months ended September 30, 2021, respectively. Amortization expense in the Babcock & Wilcox Thermal segment include $0.4 million and $1.2 million in finance lease amortization for the three and nine months ended September 30, 2020, respectively.
(6)    Babcock & Wilcox Renewable backlog at September 30, 2021, includes $152.8 million related to long-term operation and maintenance contracts for renewable energy plants, with remaining durations extending until 2034. Generally, such contracts have a duration of 10-20 years and include options to extend.
bwfootera23a.jpg


Exhibit 5
Babcock & Wilcox Enterprises, Inc.
Reconciliation of Adjusted EBITDA(3)
(In millions)
Three months ended September 30,Nine months ended September 30,
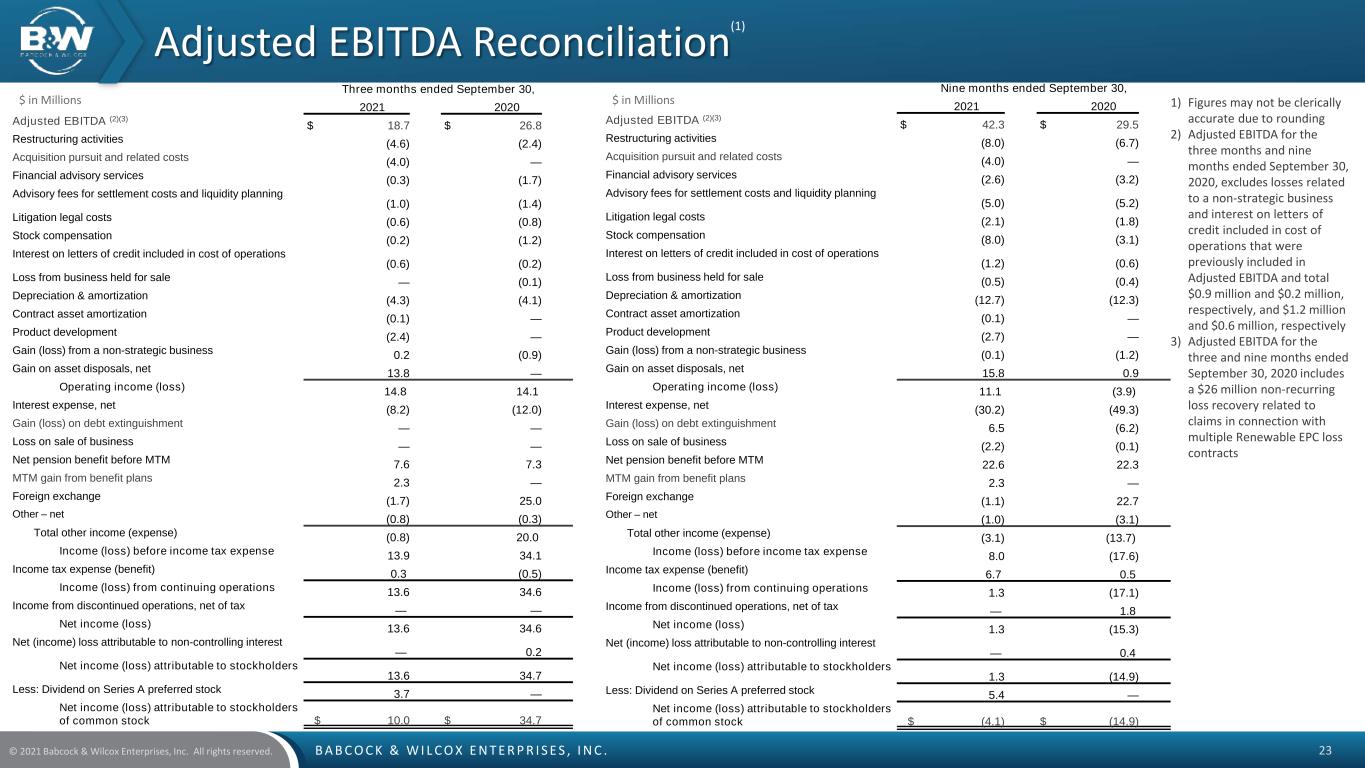
2021202020212020
Adjusted EBITDA (1)
B&W Renewable segment (2)
$11.4 $23.6 $15.0 $22.0 
B&W Environmental segment3.5 2.2 7.3 1.4 
B&W Thermal segment9.2 7.3 32.1 22.9 
Corporate(5.9)(4.9)(11.5)(12.9)
Research and development benefit (costs)0.5 (1.4)(0.6)(3.9)
18.7 26.8 42.3 29.5 
Restructuring activities (4.6)(2.4)(8.0)(6.7)
Acquisition pursuit and related costs(4.0)— (4.0)— 
Financial advisory services (0.3)(1.7)(2.6)(3.2)
Advisory fees for settlement costs and liquidity planning(1.0)(1.4)(5.0)(5.2)
Litigation legal costs(0.6)(0.8)(2.1)(1.8)
Stock compensation(0.2)(1.2)(8.0)(3.1)
Interest on letters of credit included in cost of operations(0.6)(0.2)(1.2)(0.6)
Loss from business held for sale— (0.1)(0.5)(0.4)
Depreciation & amortization(4.3)(4.1)(12.7)(12.3)
Contract asset amortization(0.1)— (0.1)— 
Product development
(2.4)— (2.7)— 
Gain (loss) from a non-strategic business0.2 (0.9)(0.1)(1.2)
Gain on asset disposals, net13.8 — 15.8 0.9 
Operating income (loss)14.8 14.1 11.1 (3.9)
Interest expense, net(8.2)(12.0)(30.2)(49.3)
Gain (loss) on debt extinguishment— — 6.5 (6.2)
Loss on sale of business— — (2.2)(0.1)
Net pension benefit before MTM7.6 7.3 22.6 22.3 
MTM gain from benefit plans2.3 — 2.3 — 
Foreign exchange(1.7)25.0 (1.1)22.7 
Other – net(0.8)(0.3)(1.0)(3.1)
Total other income (expense)(0.8)20.0 (3.1)(13.7)
Income (loss) before income tax expense13.9 34.1 8.0 (17.6)
Income tax expense (benefit)0.3 (0.5)6.7 (0.5)
Income (loss) from continuing operations13.6 34.6 1.3 (17.1)
Income from discontinued operations, net of tax— — — 1.8 
Net income (loss)13.6 34.6 1.3 (15.3)
Net (income) loss attributable to non-controlling interest— 0.2 — 0.4 
Net income (loss) attributable to stockholders13.6 34.7 1.3 (14.9)
Less: Dividend on Series A preferred stock3.7 — 5.4 — 
Net income (loss) attributable to stockholders of common stock$10.0 $34.7 $(4.1)$(14.9)
bwfootera23a.jpg


(1) Adjusted EBITDA for the three and nine months ended September 30, 2020, excludes losses related to a non-strategic business and interest on letters of credit included in cost of operations that were previously included in Adjusted EBITDA and total $0.9 million and $0.2 million, respectively, and $1.2 million and $0.6 million, respectively.
(2) Adjusted EBITDA for the three and nine months ended September 30, 2020 includes $26 million loss recoveries related to claims in connection with multiple Renewable EPC loss contracts.
(3) Figures may not be clerically accurate due to rounding.

bwfootera23a.jpg


Exhibit 6
Babcock & Wilcox Enterprises, Inc.
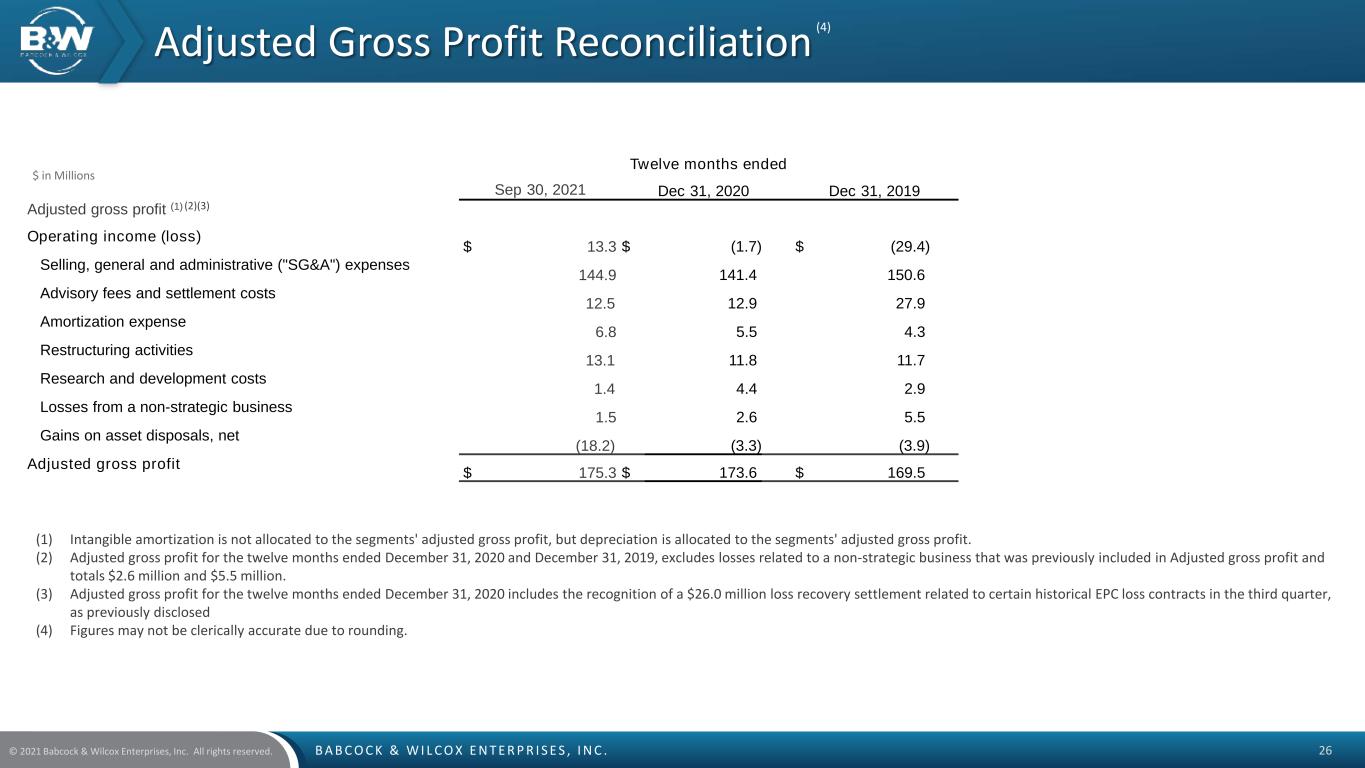
Reconciliation of Adjusted Gross Profit(3)
(In millions)
Three months ended September 30,Nine months ended September 30,
2021202020212020
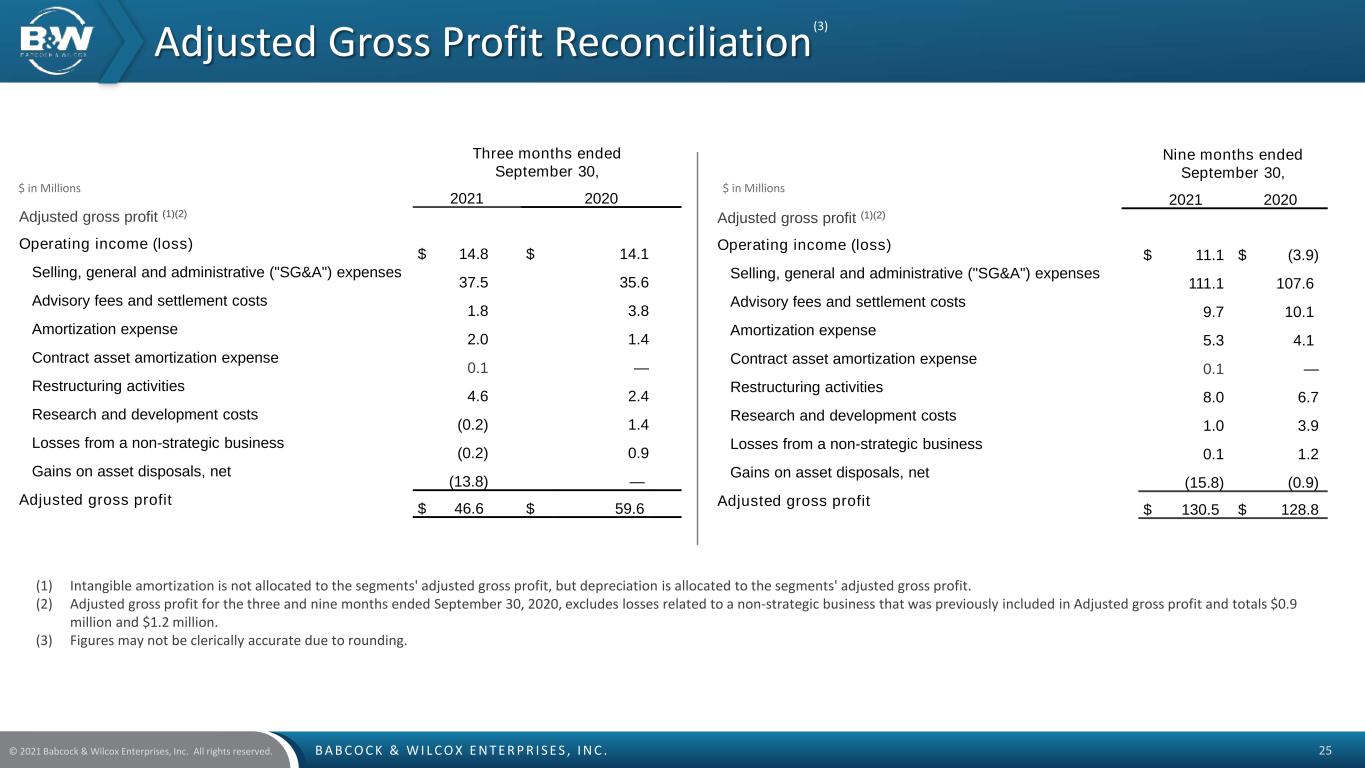
Adjusted gross profit (1)(2)
Operating income (loss)$14.8 $14.1 $11.1 $(3.9)
Selling, general and administrative ("SG&A") expenses37.5 35.6 111.1 107.6 
Advisory fees and settlement costs 1.8 3.8 9.7 10.1 
Amortization expense2.0 1.4 5.3 4.1 
Contract asset amortization expense0.1 — 0.1 — 
Restructuring activities4.6 2.4 8.0 6.7 
Research and development costs(0.2)1.4 1.0 3.9 
Losses from a non-strategic business(0.2)0.9 0.1 1.2 
Gain on asset disposals, net(13.8)— (15.8)(0.9)
Adjusted gross profit$46.6 $59.6 $130.5 $128.8 

Adjusted gross profit by segment is as follows:
Three months ended September 30,Nine months ended September 30,
2021202020212020
Adjusted gross profit (1)(2)
B&W Renewable segment$17.4 $32.1 $34.1 $48.4 
B&W Environmental segment7.9 6.9 20.5 16.6 
B&W Thermal segment21.3 20.6 75.9 63.8 
Adjusted gross profit$46.6 $59.6 $130.5 $128.8 

(1) Amortization is not allocated to the segments' adjusted gross profit, but depreciation is allocated to the segments' adjusted gross profit.
(2) Adjusted gross profit for the three and nine months ended September 30, 2020, excludes losses related to a non-strategic business that was previously included in Adjusted gross profit and totals $0.9 million and $1.2 million, respectively.
(3) Figures may not be clerically accurate due to rounding.
bwfootera23a.jpg
B A B C O C K & W I L C O X E N T E R P R I S E S , I N C .© 2021 Babcock & Wilcox Enterprises, Inc. All rights reserved. 1 Investor Presentation November 10, 2021


B A B C O C K & W I L C O X E N T E R P R I S E S , I N C .© 2021 Babcock & Wilcox Enterprises, Inc. All rights reserved. 2 B&W Enterprises cautions that this presentation contains forward-looking statements, including, without limitation, statements relating to adjusted EBITDA and sales targets, expectations regarding future growth, expansion and profitability, as well as statements about B&W’s future pipeline of new projects and business within its Renewable, Environmental and Thermal operating segments and their impact on future shareholder value. These forward-looking statements are based on management’s current expectations and involve a number of risks and uncertainties, including, among other things, the impact of COVID-19 on us and the capital markets and global economic climate generally; our ability to integrate acquired businesses and the impact of those acquired businesses on our cash flows, results of operations and financial condition, including our acquisition of Fosler Construction Company Inc; our recognition of any asset impairments as a result of any decline in the value of our assets or our efforts to dispose of any assets in the future; our ability to obtain and maintain sufficient financing to provide liquidity to meet our business objectives, surety bonds, letters of credit and similar financing; our ability to comply with the requirements of, and to service the indebtedness under, our debt facility agreements; our ability to pay dividends on our 7.75% Series A Cumulative Perpetual Preferred Stock, the highly competitive nature of our businesses and our ability to win work, including identified project opportunities in our pipeline; general economic and business conditions, including changes in interest rates and currency exchange rates; cancellations of and adjustments to backlog and the resulting impact from using backlog as an indicator of future earnings; our ability to perform contracts on time and on budget, in accordance with the schedules and terms established by the applicable contracts with customers; failure by third-party subcontractors, partners or suppliers to perform their obligations on time and as specified; our ability to successfully resolve claims by vendors for goods and services provided and claims by customers for items under warranty; our ability to realize anticipated savings and operational benefits from our restructuring plans, and other cost-savings initiatives; our ability to successfully address productivity and schedule issues in our B&W Renewable, B&W Environmental and B&W Thermal segments; our ability to successfully partner with third parties to win and execute contracts within our B&W Renewable, B&W Environmental and B&W Thermal segments; changes in our effective tax rate and tax positions, including any limitation on our ability to use our net operating loss carryforwards and other tax assets; our ability to successfully manage research and development projects and costs, including our efforts to successfully develop and commercialize new technologies and products; the operating risks normally incident to our lines of business, including professional liability, product liability, warranty and other claims against us; changes in, or our failure or inability to comply with, laws and government regulations; actual or anticipated changes in governmental regulation, including trade and tariff policies; difficulties we may encounter in obtaining regulatory or other necessary permits or approvals; changes in, and liabilities relating to, existing or future environmental regulatory matters; changes in actuarial assumptions and market fluctuations that affect our net pension liabilities and income; the Company’s ability to successfully compete with current and future competitors; the Company’s ability to negotiate and maintain good relationships with labor unions; changes in pension and medical expenses associated with its retirement benefit programs; social, political, competitive and economic situations in foreign countries where it does business or seeks new business; and the other factors specified and set forth under "Risk Factors" in our periodic reports filed with the Securities and Exchange Commission, including, without limitation, the risks described in the Company's Annual Report on Form 10-K for the year ended December 31, 2020 and Quarterly Report on Form 10-Q for the quarters ended March 31, 2021, June 30, 2021, and September 30, 2021 under the captions "Risk Factors" and "Management's Discussion and Analysis of Financial Condition and Results of Operations" (as applicable). These factors should be considered carefully, and B&W Enterprises cautions not to place undue reliance on these forward-looking statements, which speak only as of the date of this presentation, and undertakes no obligation to update or revise any forward-looking statement, except to the extent required by applicable law. Non-GAAP Financial Measures This presentation contains information regarding our adjusted EBITDA (including calculated on a pro forma basis to show the effect of certain changes in our operations and strategic focus going forward) and adjusted gross profit, which are non GAAP financial measures. Adjusted EBITDA on a consolidated basis is defined as the sum of the adjusted EBITDA for each of the segments, plus allocations to corporate and research and development costs. At a segment level, adjusted EBITDA is consistent with the way our chief operating decision maker reviews the results of operations and makes strategic decisions about the business and is calculated as earnings before interest, tax, depreciation and amortization adjusted for items such as gains or losses on asset sales, net pension benefits, restructuring costs, impairments, gains and losses on debt extinguishment, costs related to financial consulting, research and development costs and other costs that may not be directly controllable by segment management and are not allocated to the segment. We present consolidated Adjusted EBITDA because we believe it is useful to investors to help facilitate comparisons of our ongoing, operating performance before corporate overhead and other expenses not attributable to the operating performance of our revenue generating segments. In this presentation, we also present certain targets for our adjusted EBITDA in the future; these targets are not intended as guidance regarding how we believe the business will perform. We are unable to reconcile these targets to their GAAP counterparts without unreasonable effort and expense due to the aspirational nature of these targets. This presentation also presents adjusted gross profit. We believe that adjusted gross profit by segment is useful to investors to help facilitate comparisons of the ongoing, operating performance by excluding expenses related to, among other things, activities related to the spin off, activities related to various restructuring activities we have undertaken, corporate overhead (such as SG&A expenses and research and development costs) and certain non-cash expenses such as intangible amortization and goodwill impairments. Safe Harbor Statement


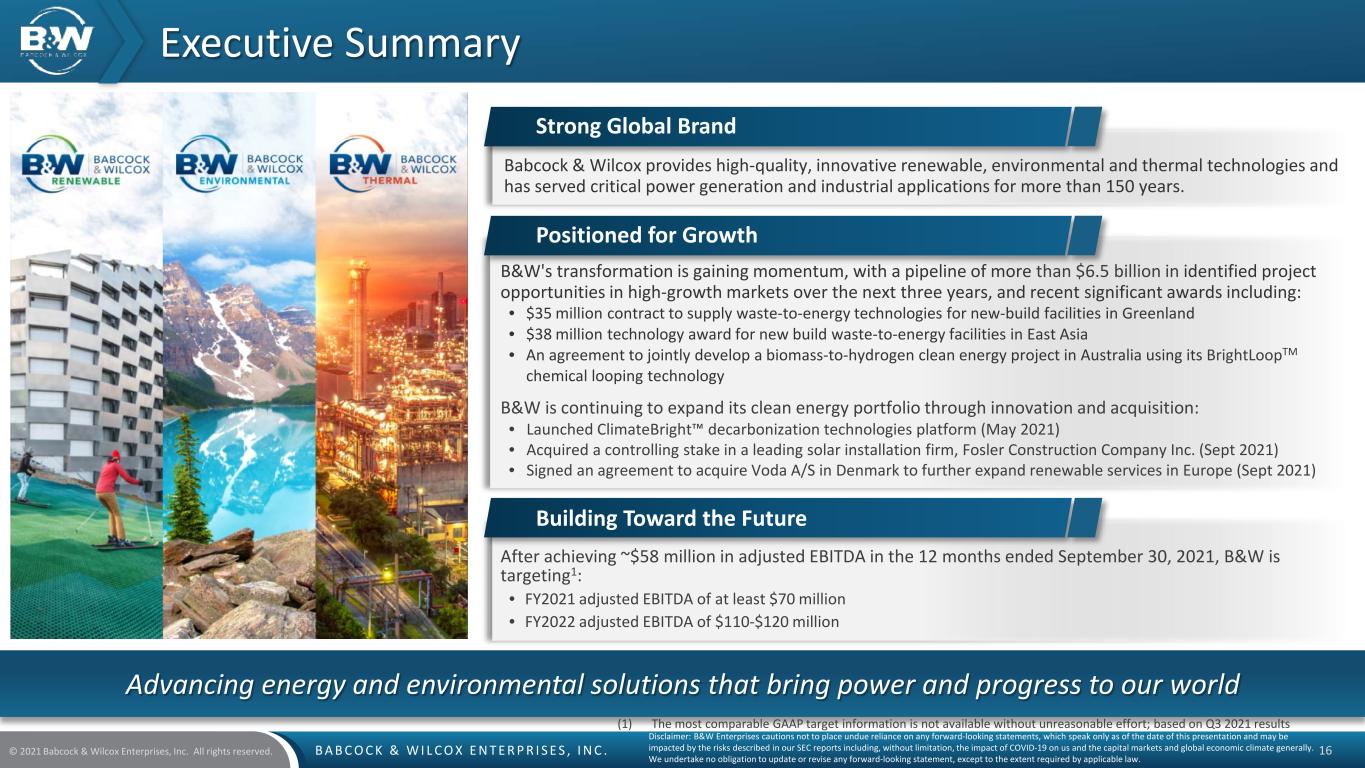
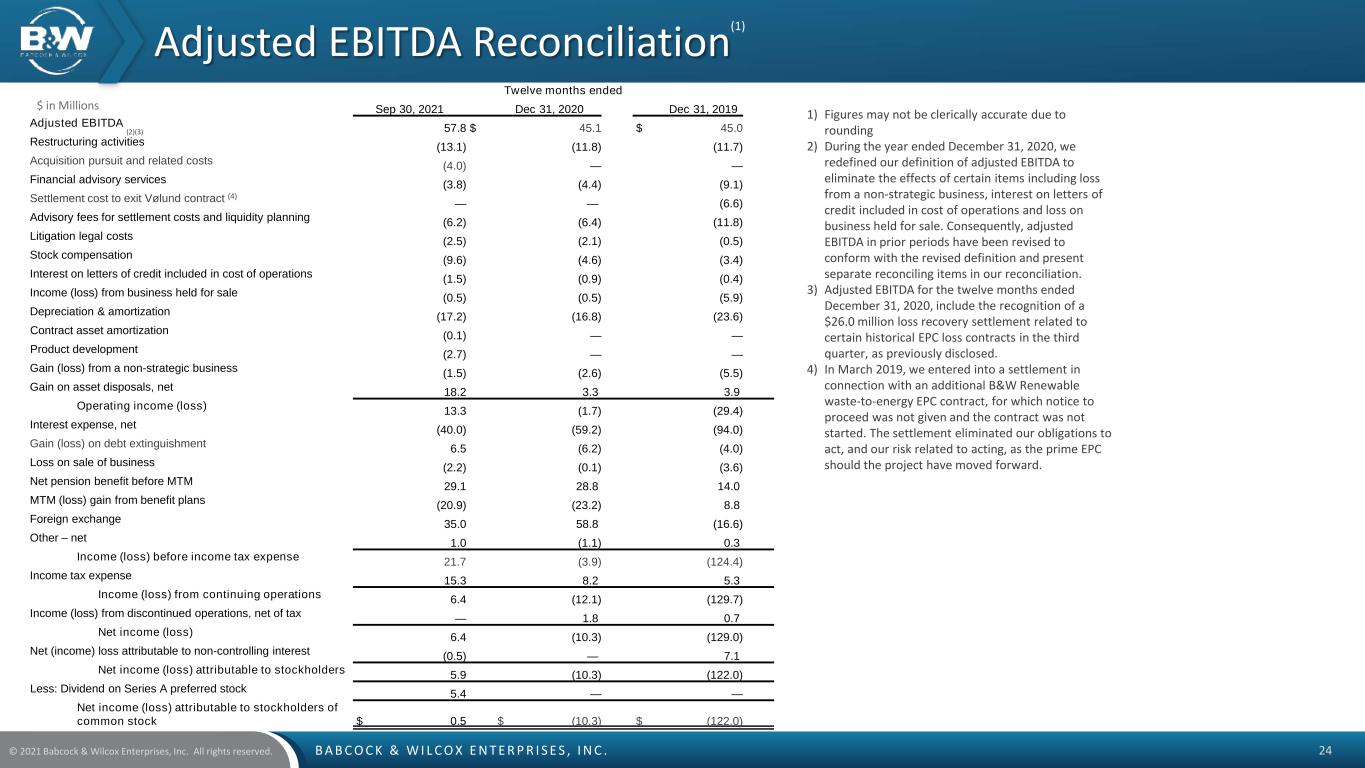
B A B C O C K & W I L C O X E N T E R P R I S E S , I N C .© 2021 Babcock & Wilcox Enterprises, Inc. All rights reserved. 3 Executive Summary B&W's transformation is gaining momentum, with a pipeline of more than $6.5 billion in identified project opportunities in high-growth markets over the next three years, and recent significant awards including: • $35 million contract to supply waste-to-energy technologies for new-build facilities in Greenland • $38 million technology award for new build waste-to-energy facilities in East Asia • An agreement to jointly develop a biomass-to-hydrogen clean energy project in Australia using its BrightLoopTM chemical looping technology B&W is continuing to expand its clean energy portfolio through innovation and acquisition: • Launched ClimateBright™ decarbonization technologies platform (May 2021) • Acquired a controlling stake in a leading solar installation firm, Fosler Construction Company Inc. (Sept 2021) • Signed an agreement to acquire Voda A/S in Denmark to further expand renewable services in Europe (Sept 2021) Babcock & Wilcox provides high-quality, innovative renewable, environmental and thermal technologies and has served critical power generation and industrial applications for more than 150 years. Disclaimer: B&W Enterprises cautions not to place undue reliance on any forward-looking statements, which speak only as of the date of this presentation and may be impacted by the risks described in our SEC reports including, without limitation, the impact of COVID-19 on us and the capital markets and global economic climate generally. We undertake no obligation to update or revise any forward-looking statement, except to the extent required by applicable law. Advancing energy and environmental solutions that bring power and progress to our world Strong Global Brand After achieving ~$58 million in adjusted EBITDA in the 12 months ended September 30, 2021, B&W is targeting1: • FY2021 adjusted EBITDA of at least $70 million • FY2022 adjusted EBITDA of $110-$120 million Positioned for Growth Building Toward the Future (1) The most comparable GAAP target information is not available without unreasonable effort; based on Q3 2021 results


B A B C O C K & W I L C O X E N T E R P R I S E S , I N C .© 2021 Babcock & Wilcox Enterprises, Inc. All rights reserved. 4 The next generation Babcock & Wilcox is providing innovative environmental and renewable solutions, generating recurring revenues from a broad thermal installed base and expanding globally Next Generation B&W Global Brand Equity A Circular Economy For our economy and future generations, we continually develop ecologically sound ways of recycling resources, like biomass and waste, to create clean, renewable baseload power while reducing greenhouse gas emissions. The Clear Choice for Our Climate As an industry leader in providing advanced air emissions control and energy recovery equipment and technologies, our engineered solutions are designed to reduce the environmental impact of industrial processes. Efficient. Safe. Reliable. From the initial patent for the water-tube safety boiler to the world’s first supercritical boiler to technologies using the latest advanced steam cycles, our robust thermal energy designs deliver availability and long-term operation. B&W FOUNDATION DRIVES GROWTH STRATEGY Research & Innovation Vast Installed Base Advanced Technologies High-Growth End Markets


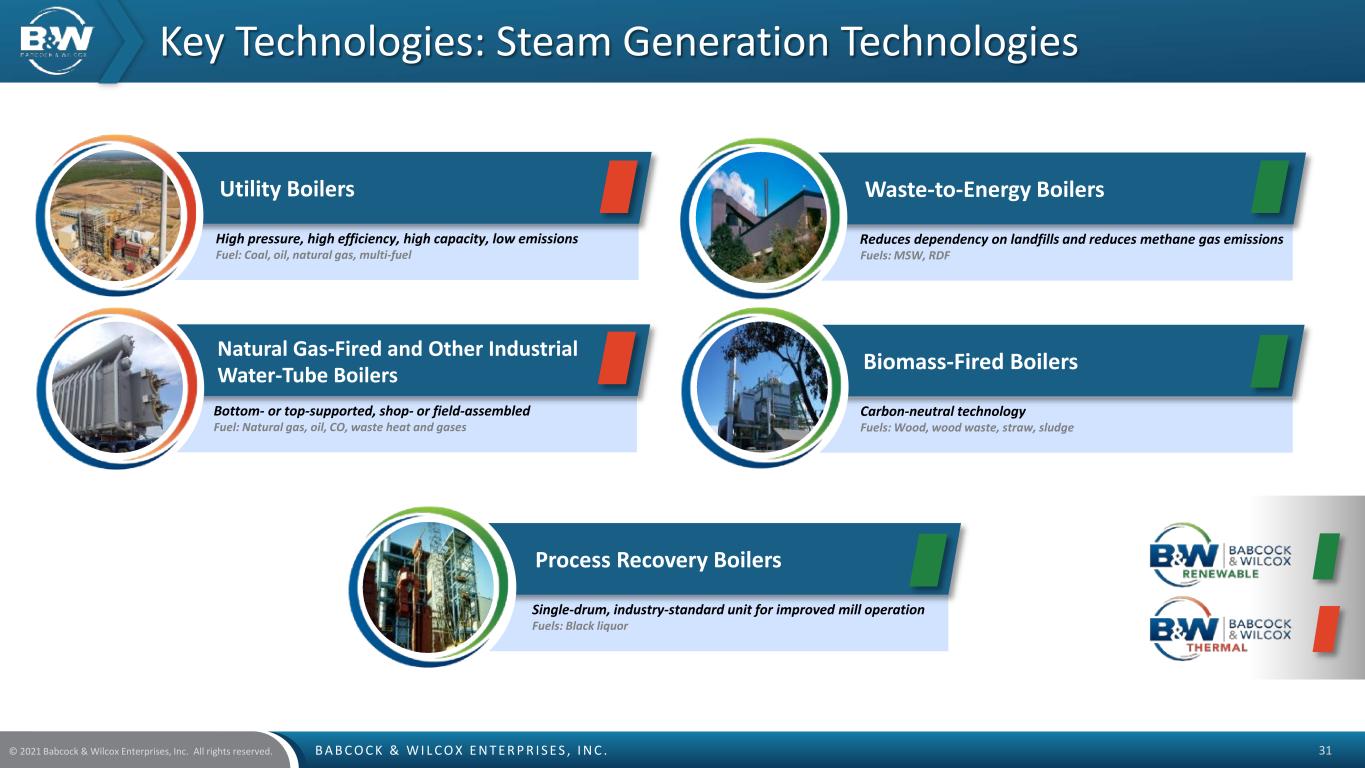
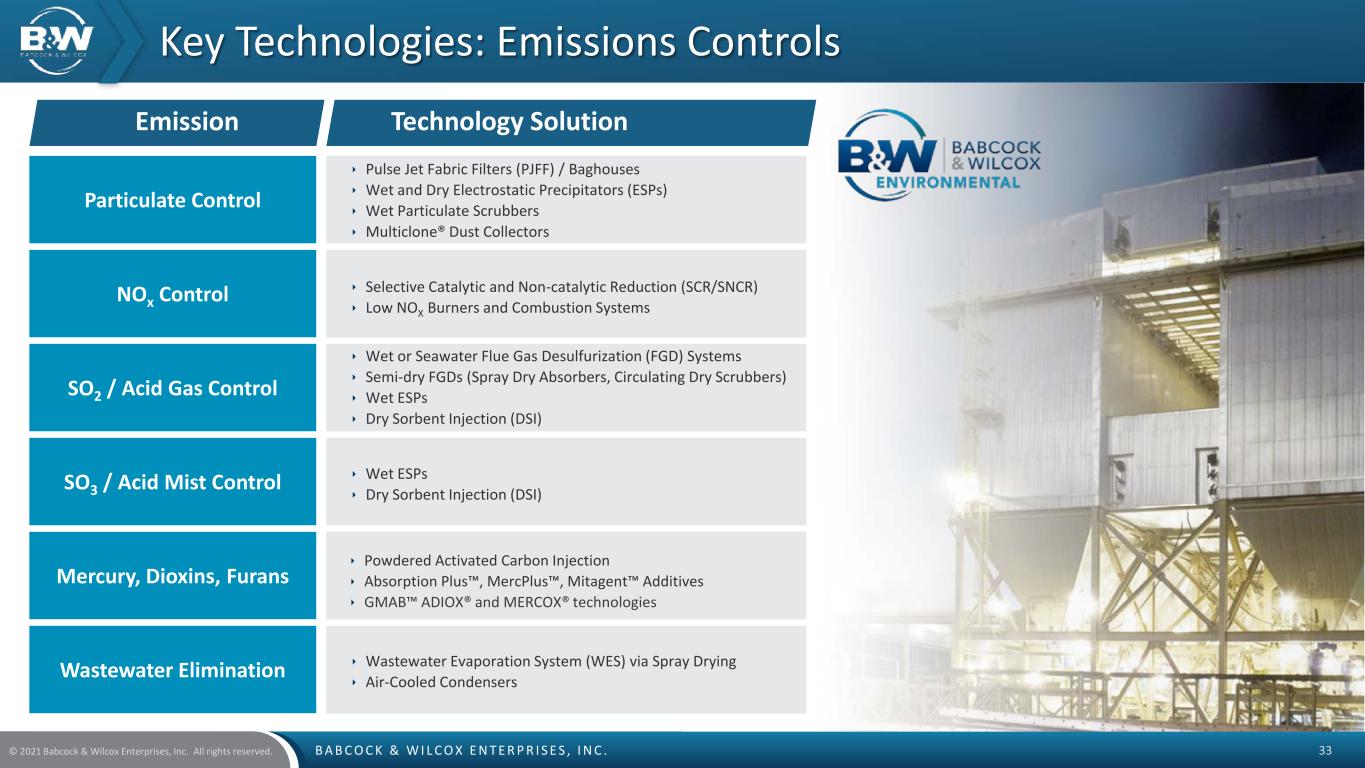
B A B C O C K & W I L C O X E N T E R P R I S E S , I N C .© 2021 Babcock & Wilcox Enterprises, Inc. All rights reserved. 5 Waste-to-energy and biomass-to-energy baseload power, chemical recovery boilers for pulp & paper, long-term energy storage, solar power installation & services Technologies for Renewable Power & Resource Recovery Emissions control, ash handling systems for bottom and fly ash, wet/dry/hybrid cooling systems, energy recovery, ClimateBrightTM decarbonization technologies Technologies for a Clean Environment Boilers, ancillary equipment and global aftermarket parts, service and upgrade offerings to effectively utilize a wide range of fuels for power or industrial applications Technologies for Efficient Steam Generation Delivering value to our customers through technology-driven products and services, with 600 active patents worldwide Continual product improvement and research and development to support future needs, including carbon capture What We Do ENVIRONMENTAL THERMAL RENEWABLE


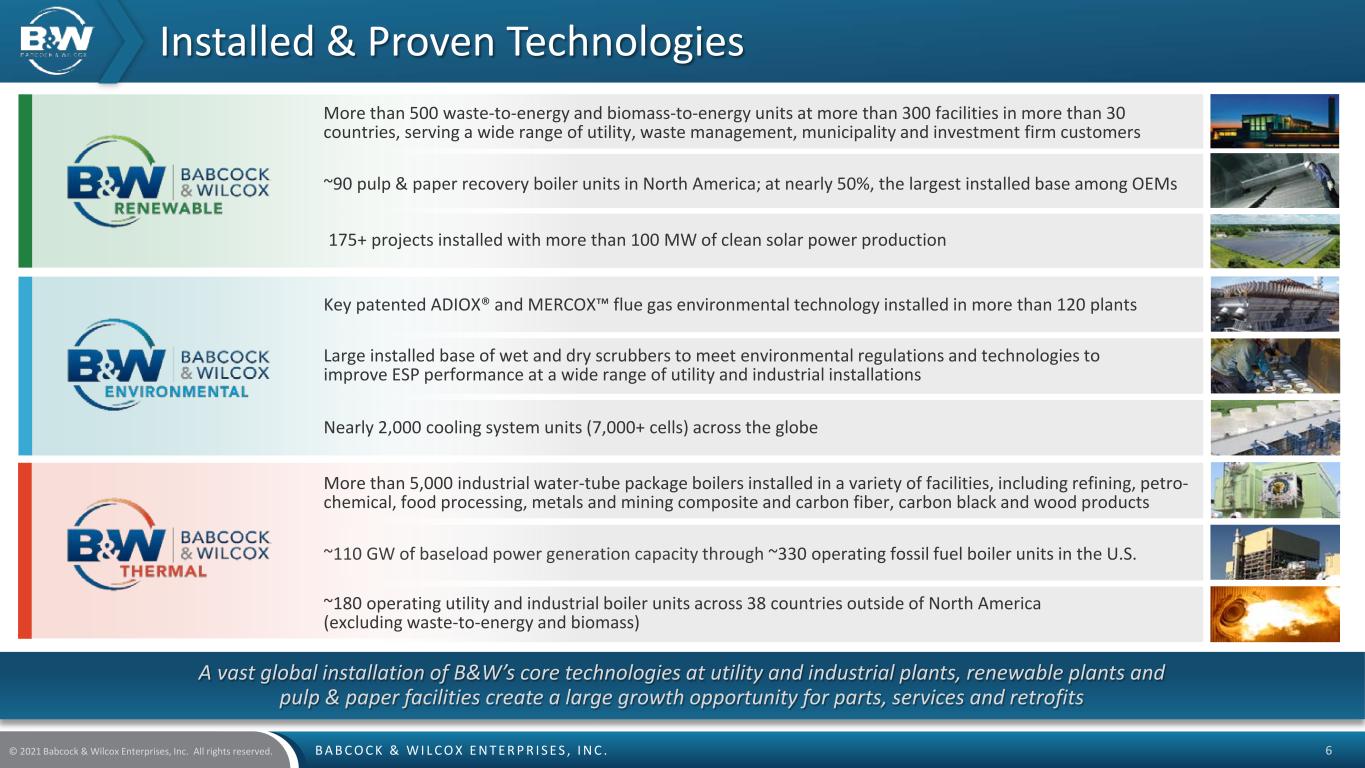
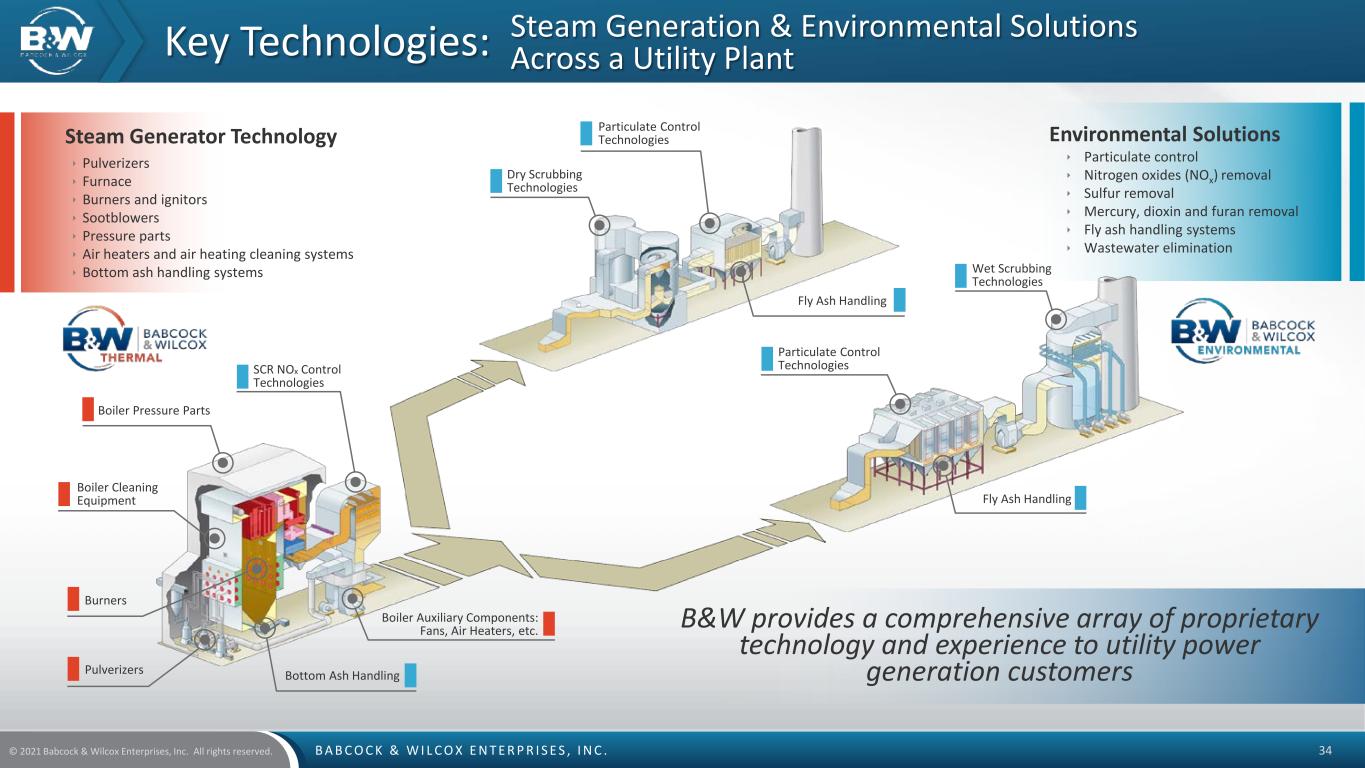
B A B C O C K & W I L C O X E N T E R P R I S E S , I N C .© 2021 Babcock & Wilcox Enterprises, Inc. All rights reserved. 6 A vast global installation of B&W’s core technologies at utility and industrial plants, renewable plants and pulp & paper facilities create a large growth opportunity for parts, services and retrofits Installed & Proven Technologies Nearly 2,000 cooling system units (7,000+ cells) across the globe ~110 GW of baseload power generation capacity through ~330 operating fossil fuel boiler units in the U.S. ~180 operating utility and industrial boiler units across 38 countries outside of North America (excluding waste-to-energy and biomass) More than 500 waste-to-energy and biomass-to-energy units at more than 300 facilities in more than 30 countries, serving a wide range of utility, waste management, municipality and investment firm customers Key patented ADIOX® and MERCOX™ flue gas environmental technology installed in more than 120 plants ~90 pulp & paper recovery boiler units in North America; at nearly 50%, the largest installed base among OEMs More than 5,000 industrial water-tube package boilers installed in a variety of facilities, including refining, petro- chemical, food processing, metals and mining composite and carbon fiber, carbon black and wood products Large installed base of wet and dry scrubbers to meet environmental regulations and technologies to improve ESP performance at a wide range of utility and industrial installations 175+ projects installed with more than 100 MW of clean solar power production


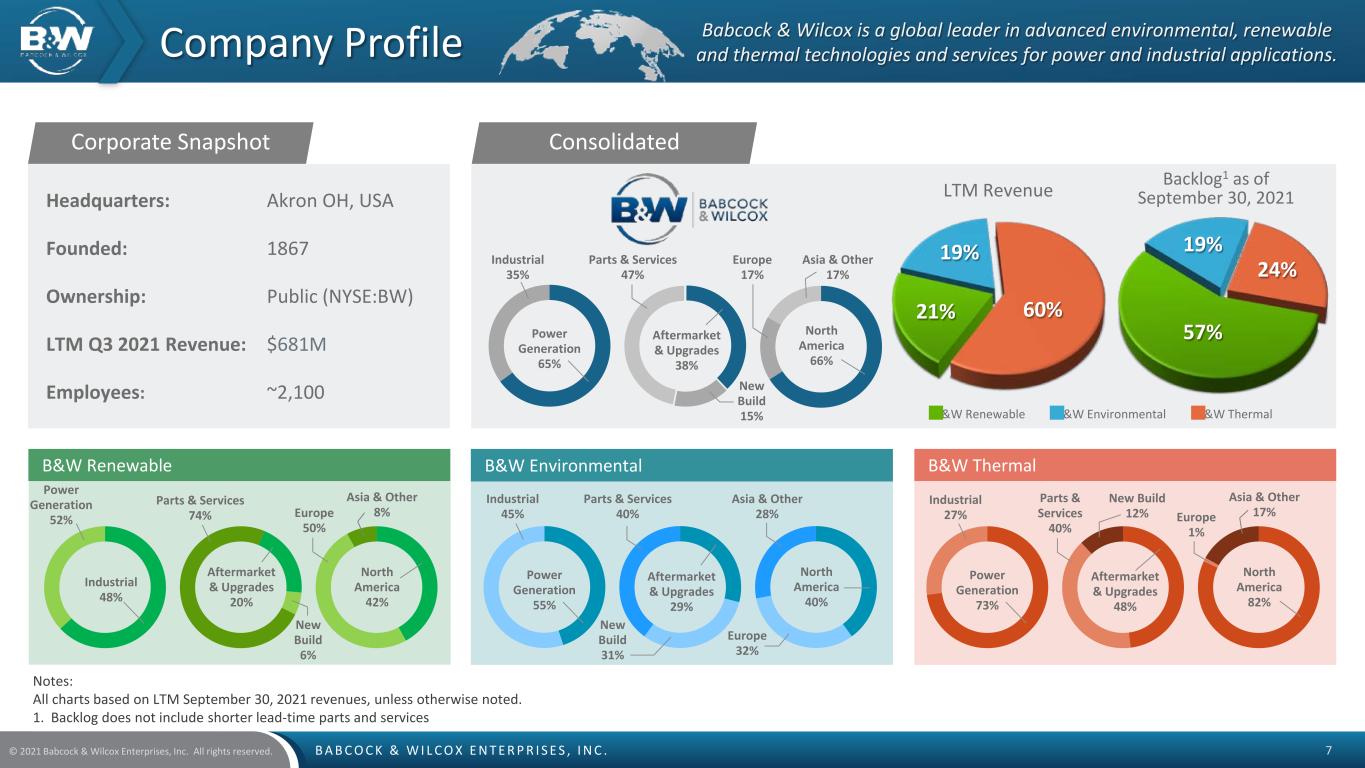
B A B C O C K & W I L C O X E N T E R P R I S E S , I N C .© 2021 Babcock & Wilcox Enterprises, Inc. All rights reserved. 7 Company Profile Babcock & Wilcox is a global leader in advanced environmental, renewable and thermal technologies and services for power and industrial applications. B&W Renewable Power Generation 52% Industrial 48% Aftermarket & Upgrades 20% Parts & Services 74% North America 42% Europe 50% Asia & Other 8% New Build 6% Industrial 35% Power Generation 65% Aftermarket & Upgrades 38% Parts & Services 47% North America 66% Europe 17% New Build 15% Asia & Other 17% Headquarters: Akron OH, USA Founded: 1867 Ownership: Public (NYSE:BW) LTM Q3 2021 Revenue: $681M Employees: ~2,100 Corporate Snapshot Notes: All charts based on LTM September 30, 2021 revenues, unless otherwise noted. 1. Backlog does not include shorter lead-time parts and services Consolidated B&W Thermal Industrial 27% Power Generation 73% Aftermarket & Upgrades 48% Parts & Services 40% North America 82% Europe 1% Asia & Other 17% New Build 12% B&W Environmental Industrial 45% Power Generation 55% Aftermarket & Upgrades 29% Parts & Services 40% North America 40% Europe 32% New Build 31% Asia & Other 28% 21% 19% 60% LTM Revenue Backlog1 as of September 30, 2021 $313M$101M $130M B&W Renewable B&W Environmental B&W Thermal 57% 19% 24%


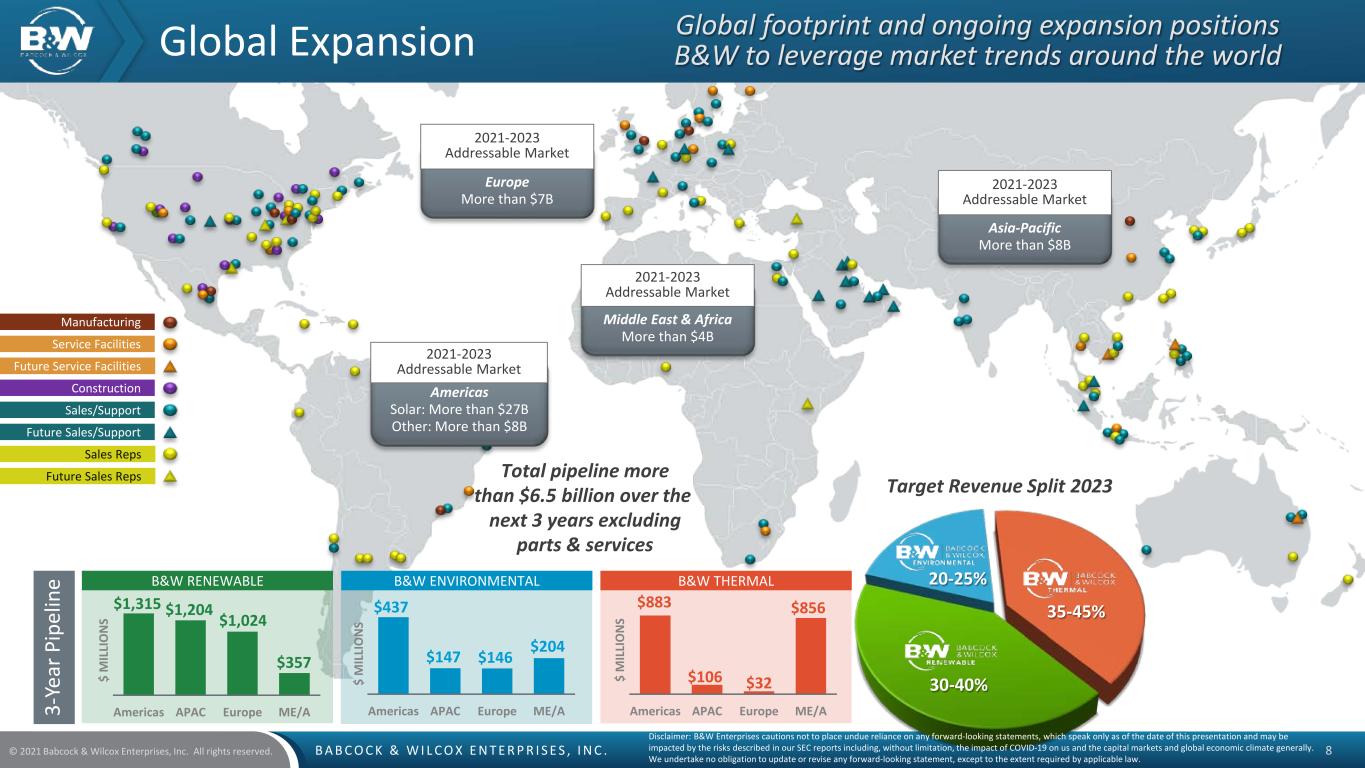
B A B C O C K & W I L C O X E N T E R P R I S E S , I N C .© 2021 Babcock & Wilcox Enterprises, Inc. All rights reserved. 8 30-40% 20-25% 35-45% Global Expansion Europe More than $7B 2021-2023 Addressable Market Americas Solar: More than $27B Other: More than $8B 2021-2023 Addressable Market Middle East & Africa More than $4B 2021-2023 Addressable Market Asia-Pacific More than $8B 2021-2023 Addressable Market Manufacturing Service Facilities Construction Sales/Support Future Sales/Support Sales Reps Future Sales Reps Future Service Facilities Americas APAC Europe ME/A $437 $147 $146 $204 $ M IL LI O N S Americas APAC Europe ME/A $1,315 $1,204 $1,024 $357 $ M IL LI O N S Americas APAC Europe ME/A $883 $106 $32 $856 $ M IL LI O N S B&W RENEWABLE B&W ENVIRONMENTAL B&W THERMAL 3- Ye ar P ip el in e Global footprint and ongoing expansion positions B&W to leverage market trends around the world Disclaimer: B&W Enterprises cautions not to place undue reliance on any forward-looking statements, which speak only as of the date of this presentation and may be impacted by the risks described in our SEC reports including, without limitation, the impact of COVID-19 on us and the capital markets and global economic climate generally. We undertake no obligation to update or revise any forward-looking statement, except to the extent required by applicable law. Total pipeline more than $6.5 billion over the next 3 years excluding parts & services Target Revenue Split 2023


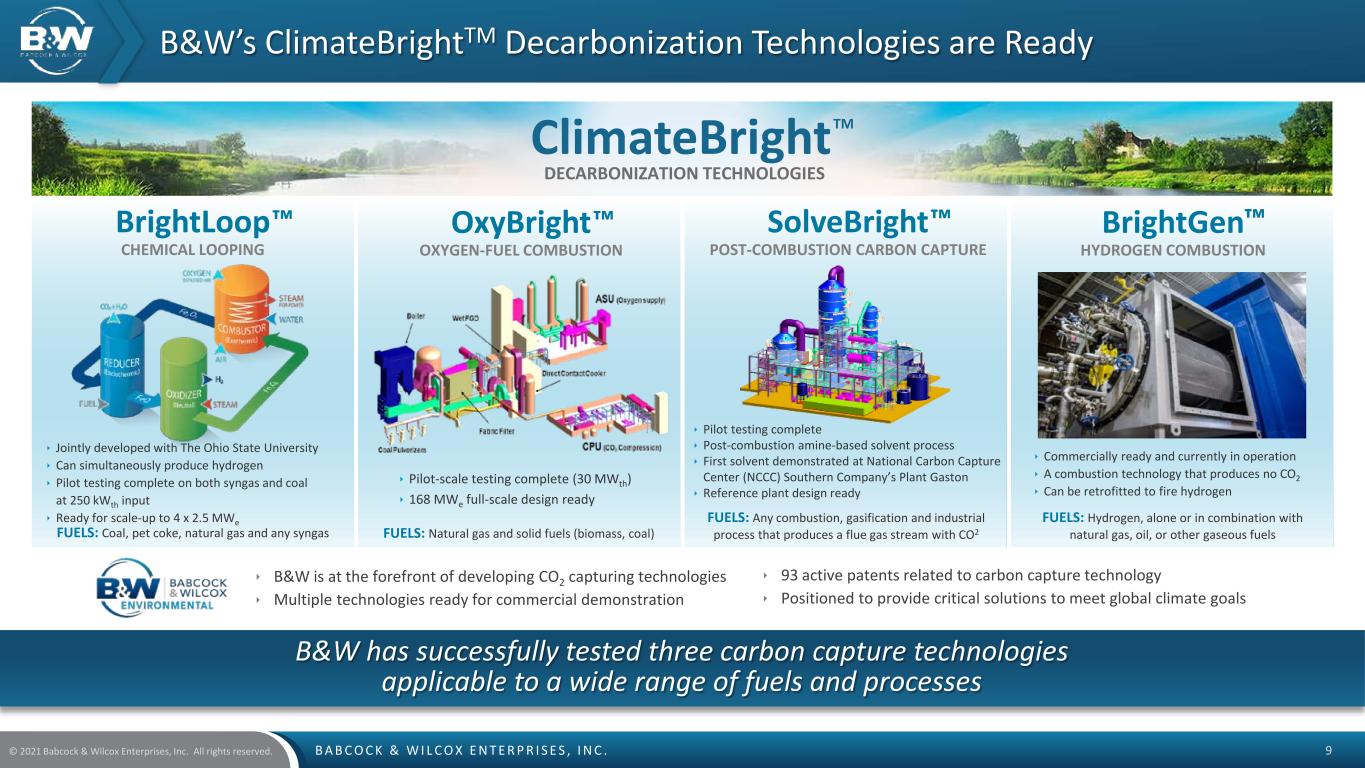
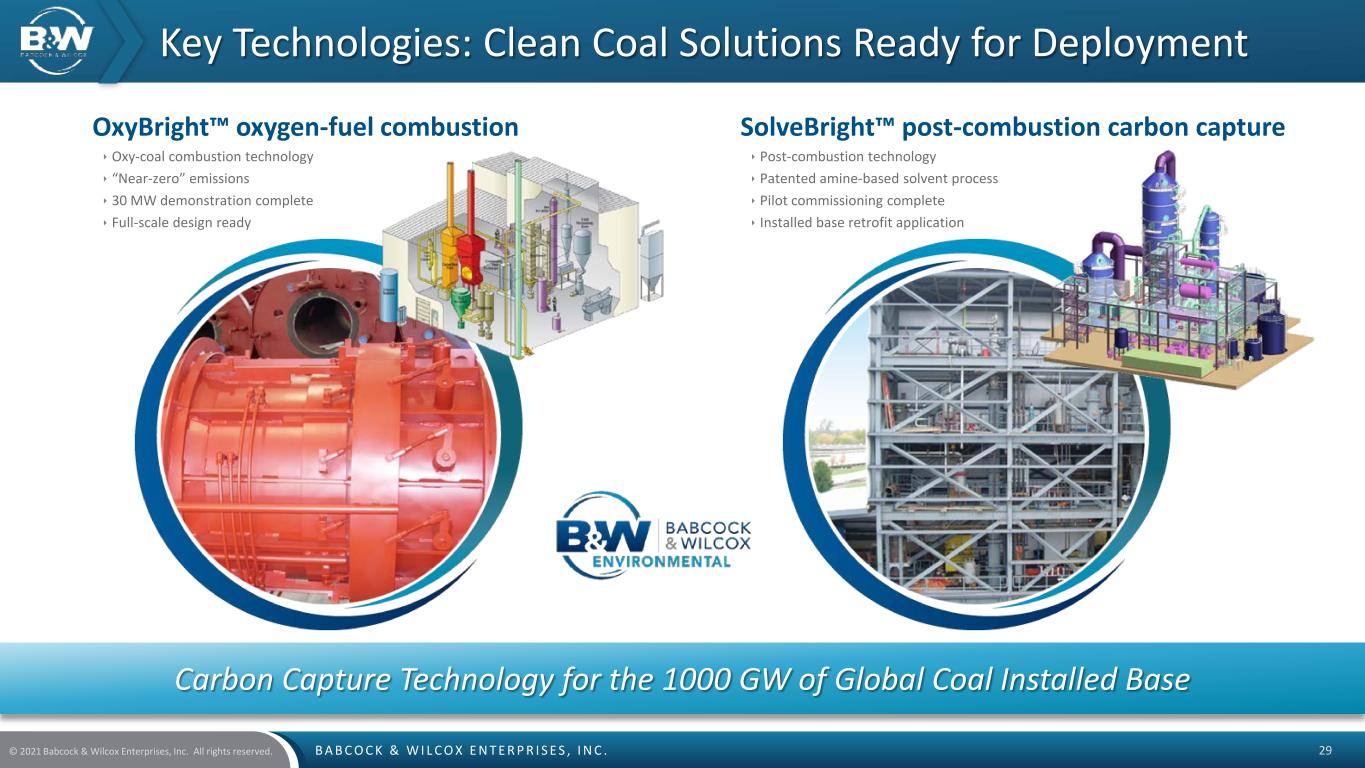
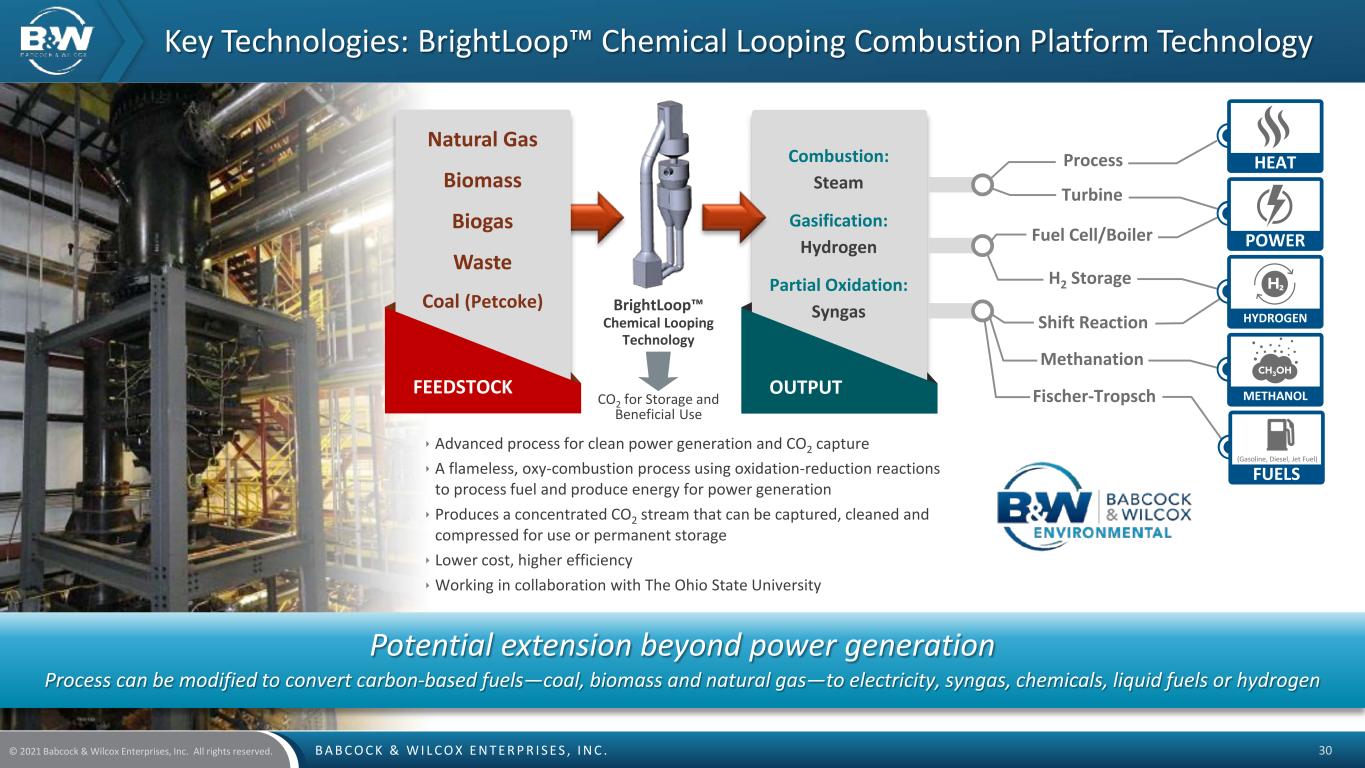
B A B C O C K & W I L C O X E N T E R P R I S E S , I N C .© 2021 Babcock & Wilcox Enterprises, Inc. All rights reserved. 9 B&W’s ClimateBrightTM Decarbonization Technologies are Ready B&W has successfully tested three carbon capture technologies applicable to a wide range of fuels and processes  Jointly developed with The Ohio State University  Can simultaneously produce hydrogen  Pilot testing complete on both syngas and coal at 250 kWth input  Ready for scale-up to 4 x 2.5 MWe  Pilot testing complete  Post-combustion amine-based solvent process  First solvent demonstrated at National Carbon Capture Center (NCCC) Southern Company’s Plant Gaston  Reference plant design ready  Pilot-scale testing complete (30 MWth)  168 MWe full-scale design ready  B&W is at the forefront of developing CO2 capturing technologies  Multiple technologies ready for commercial demonstration  93 active patents related to carbon capture technology  Positioned to provide critical solutions to meet global climate goals OxyBright OXYGEN-FUEL COMBUSTION ™BrightLoop CHEMICAL LOOPING ™ DECARBONIZATION TECHNOLOGIES SolveBright POST-COMBUSTION CARBON CAPTURE ™ FUELS: Coal, pet coke, natural gas and any syngas ClimateBrightTM BrightGen HYDROGEN COMBUSTION ™  Commercially ready and currently in operation  A combustion technology that produces no CO2  Can be retrofitted to fire hydrogen FUELS: Natural gas and solid fuels (biomass, coal) FUELS: Any combustion, gasification and industrial process that produces a flue gas stream with CO2 FUELS: Hydrogen, alone or in combination with natural gas, oil, or other gaseous fuels


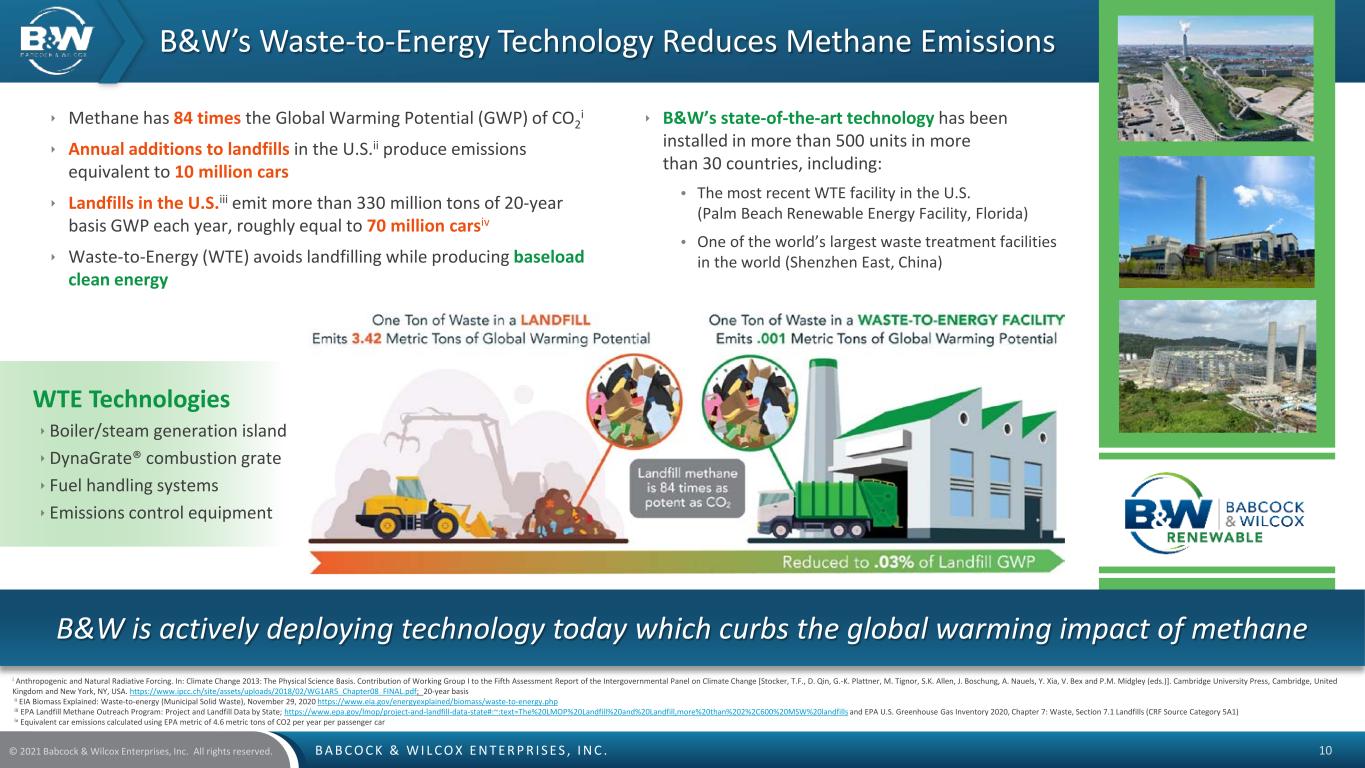
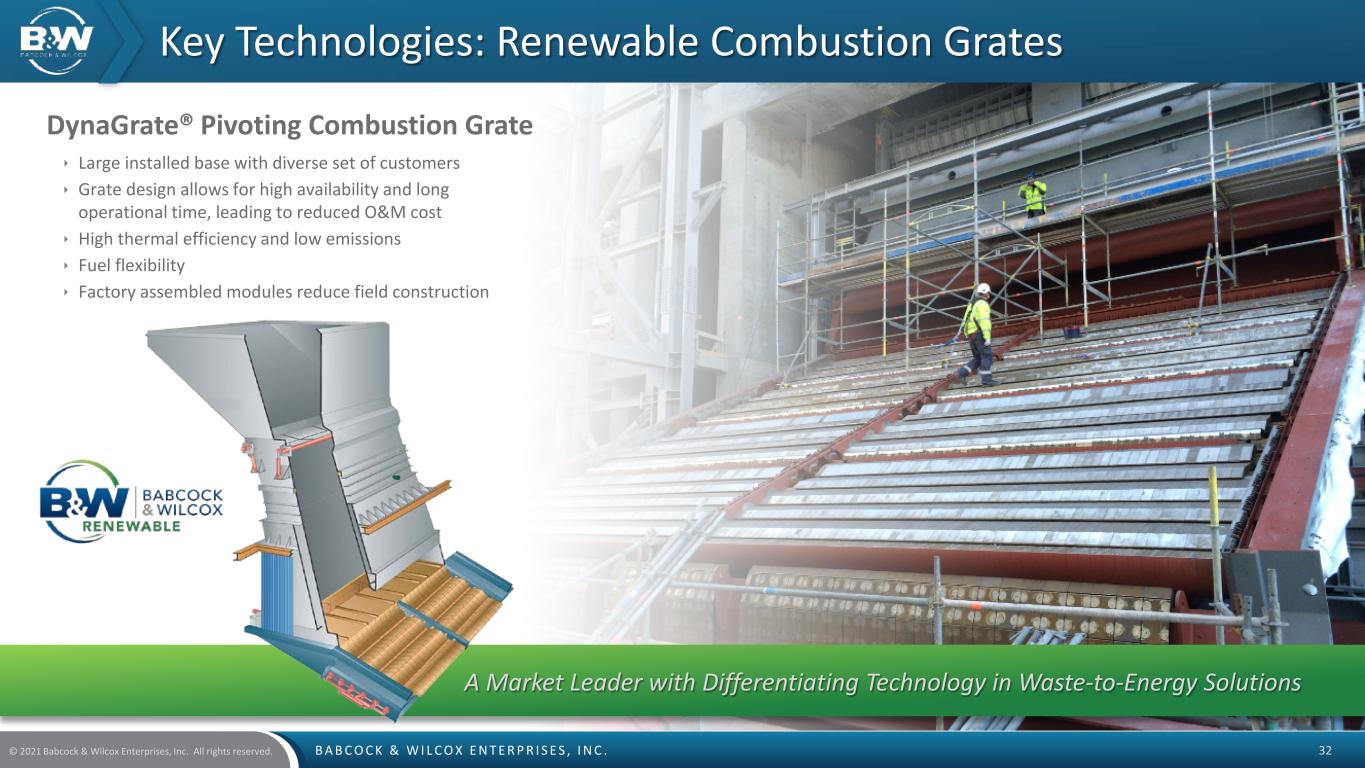
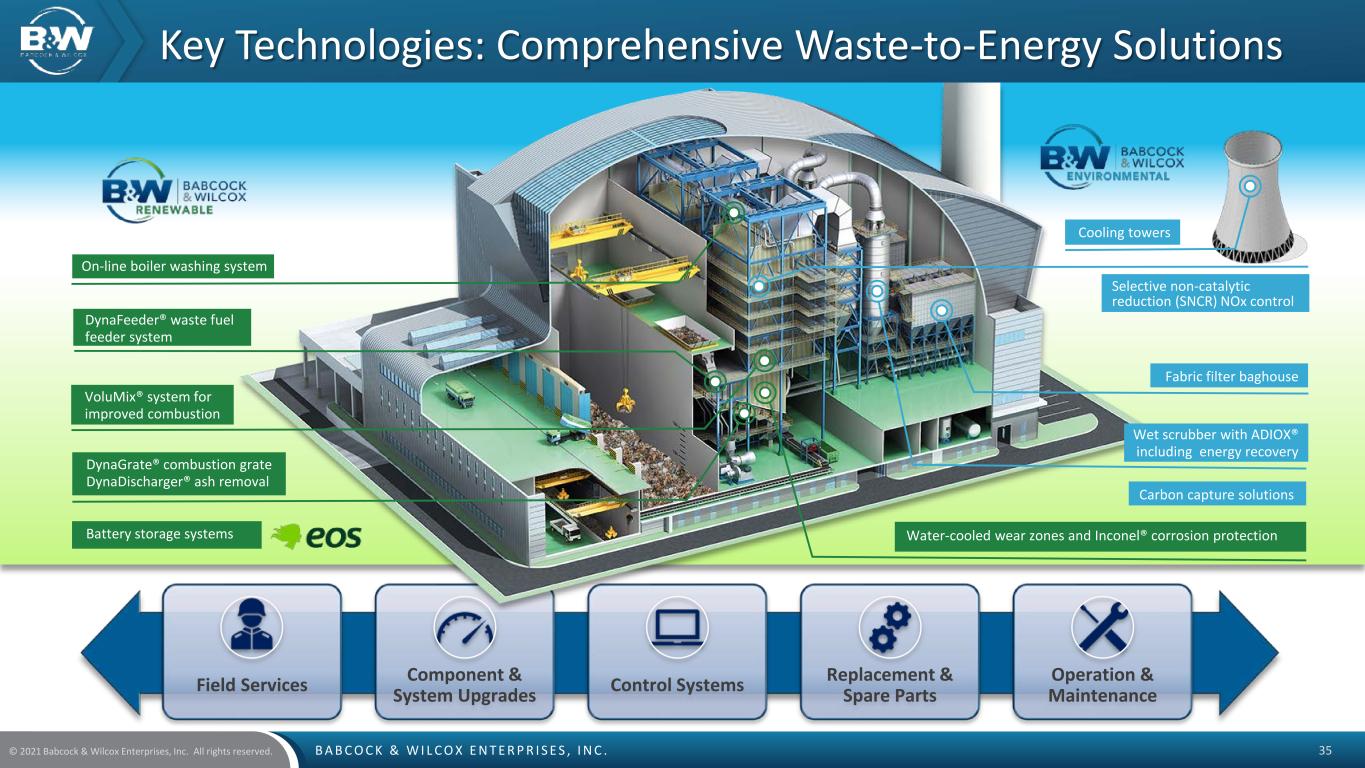
B A B C O C K & W I L C O X E N T E R P R I S E S , I N C .© 2021 Babcock & Wilcox Enterprises, Inc. All rights reserved. 10 B&W is actively deploying technology today which curbs the global warming impact of methane B&W’s Waste-to-Energy Technology Reduces Methane Emissions  Methane has 84 times the Global Warming Potential (GWP) of CO2 i  Annual additions to landfills in the U.S.ii produce emissions equivalent to 10 million cars  Landfills in the U.S.iii emit more than 330 million tons of 20-year basis GWP each year, roughly equal to 70 million carsiv  Waste-to-Energy (WTE) avoids landfilling while producing baseload clean energy WTE Technologies  Boiler/steam generation island DynaGrate® combustion grate  Fuel handling systems  Emissions control equipment  B&W’s state-of-the-art technology has been installed in more than 500 units in more than 30 countries, including: • The most recent WTE facility in the U.S. (Palm Beach Renewable Energy Facility, Florida) • One of the world’s largest waste treatment facilities in the world (Shenzhen East, China) i Anthropogenic and Natural Radiative Forcing. In: Climate Change 2013: The Physical Science Basis. Contribution of Working Group I to the Fifth Assessment Report of the Intergovernmental Panel on Climate Change [Stocker, T.F., D. Qin, G.-K. Plattner, M. Tignor, S.K. Allen, J. Boschung, A. Nauels, Y. Xia, V. Bex and P.M. Midgley (eds.)]. Cambridge University Press, Cambridge, United Kingdom and New York, NY, USA. https://www.ipcc.ch/site/assets/uploads/2018/02/WG1AR5_Chapter08_FINAL.pdf; 20-year basis ii EIA Biomass Explained: Waste-to-energy (Municipal Solid Waste), November 29, 2020 https://www.eia.gov/energyexplained/biomass/waste-to-energy.php iii EPA Landfill Methane Outreach Program: Project and Landfill Data by State; https://www.epa.gov/lmop/project-and-landfill-data-state#:~:text=The%20LMOP%20Landfill%20and%20Landfill,more%20than%202%2C600%20MSW%20landfills and EPA U.S. Greenhouse Gas Inventory 2020, Chapter 7: Waste, Section 7.1 Landfills (CRF Source Category 5A1) iv Equivalent car emissions calculated using EPA metric of 4.6 metric tons of CO2 per year per passenger car


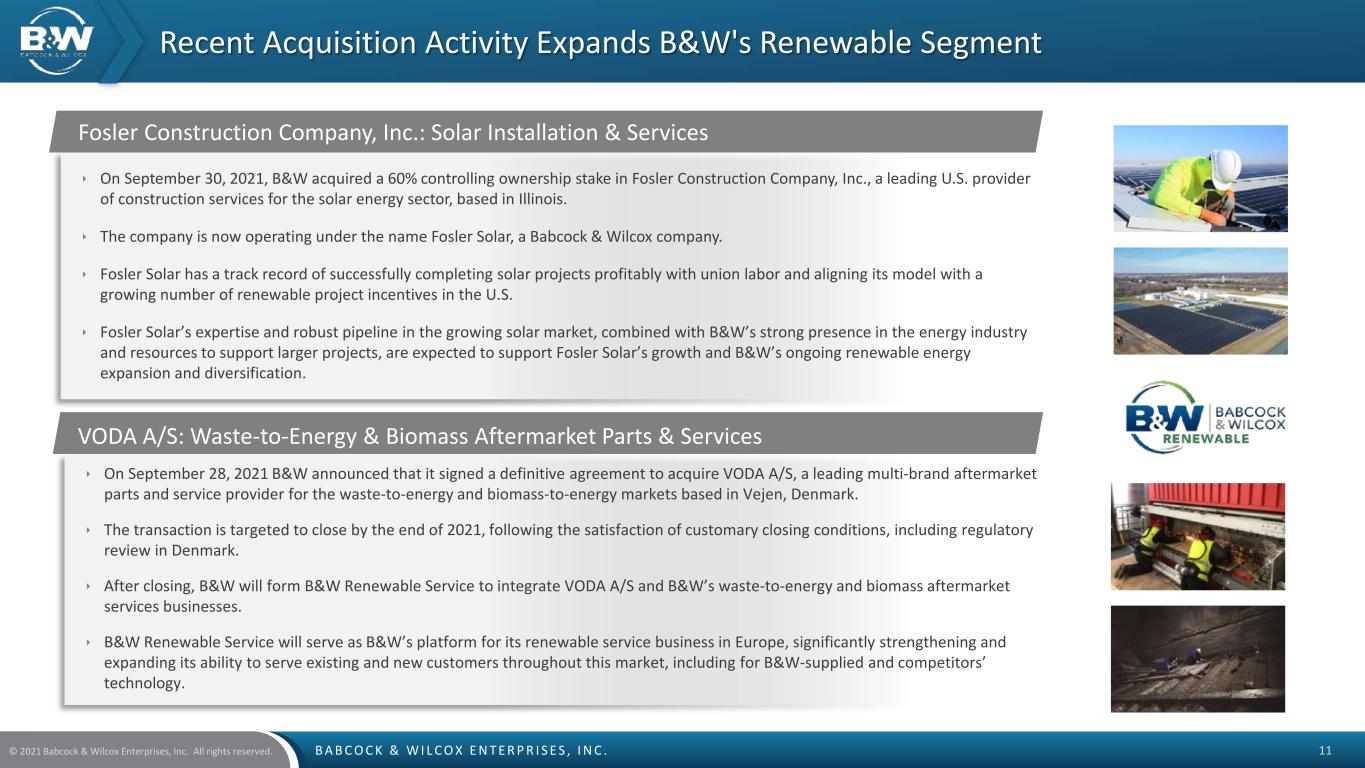
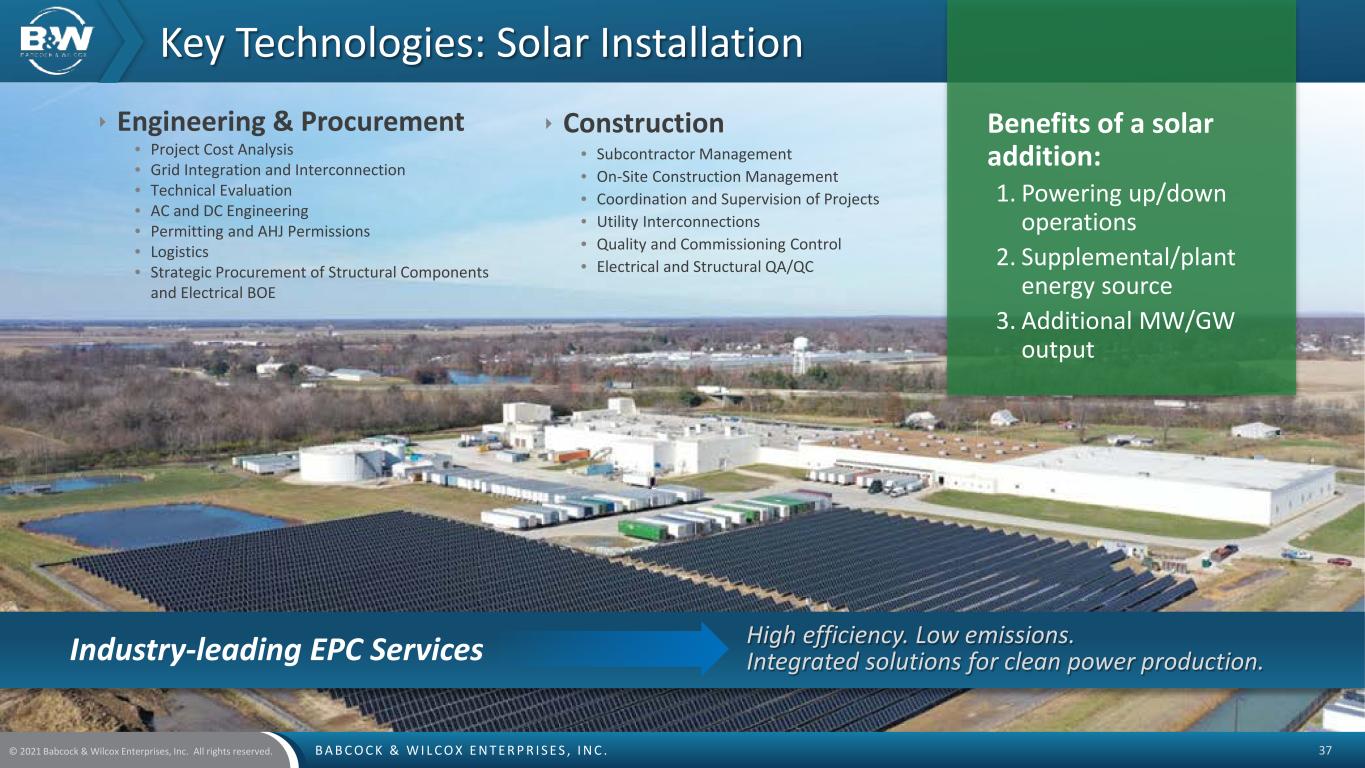
B A B C O C K & W I L C O X E N T E R P R I S E S , I N C .© 2021 Babcock & Wilcox Enterprises, Inc. All rights reserved. 11  On September 30, 2021, B&W acquired a 60% controlling ownership stake in Fosler Construction Company, Inc., a leading U.S. provider of construction services for the solar energy sector, based in Illinois.  The company is now operating under the name Fosler Solar, a Babcock & Wilcox company.  Fosler Solar has a track record of successfully completing solar projects profitably with union labor and aligning its model with a growing number of renewable project incentives in the U.S.  Fosler Solar’s expertise and robust pipeline in the growing solar market, combined with B&W’s strong presence in the energy industry and resources to support larger projects, are expected to support Fosler Solar’s growth and B&W’s ongoing renewable energy expansion and diversification. Recent Acquisition Activity Expands B&W's Renewable Segment  On September 28, 2021 B&W announced that it signed a definitive agreement to acquire VODA A/S, a leading multi-brand aftermarket parts and service provider for the waste-to-energy and biomass-to-energy markets based in Vejen, Denmark.  The transaction is targeted to close by the end of 2021, following the satisfaction of customary closing conditions, including regulatory review in Denmark.  After closing, B&W will form B&W Renewable Service to integrate VODA A/S and B&W’s waste-to-energy and biomass aftermarket services businesses.  B&W Renewable Service will serve as B&W’s platform for its renewable service business in Europe, significantly strengthening and expanding its ability to serve existing and new customers throughout this market, including for B&W-supplied and competitors’ technology. VODA A/S: Waste-to-Energy & Biomass Aftermarket Parts & Services Fosler Construction Company, Inc.: Solar Installation & Services


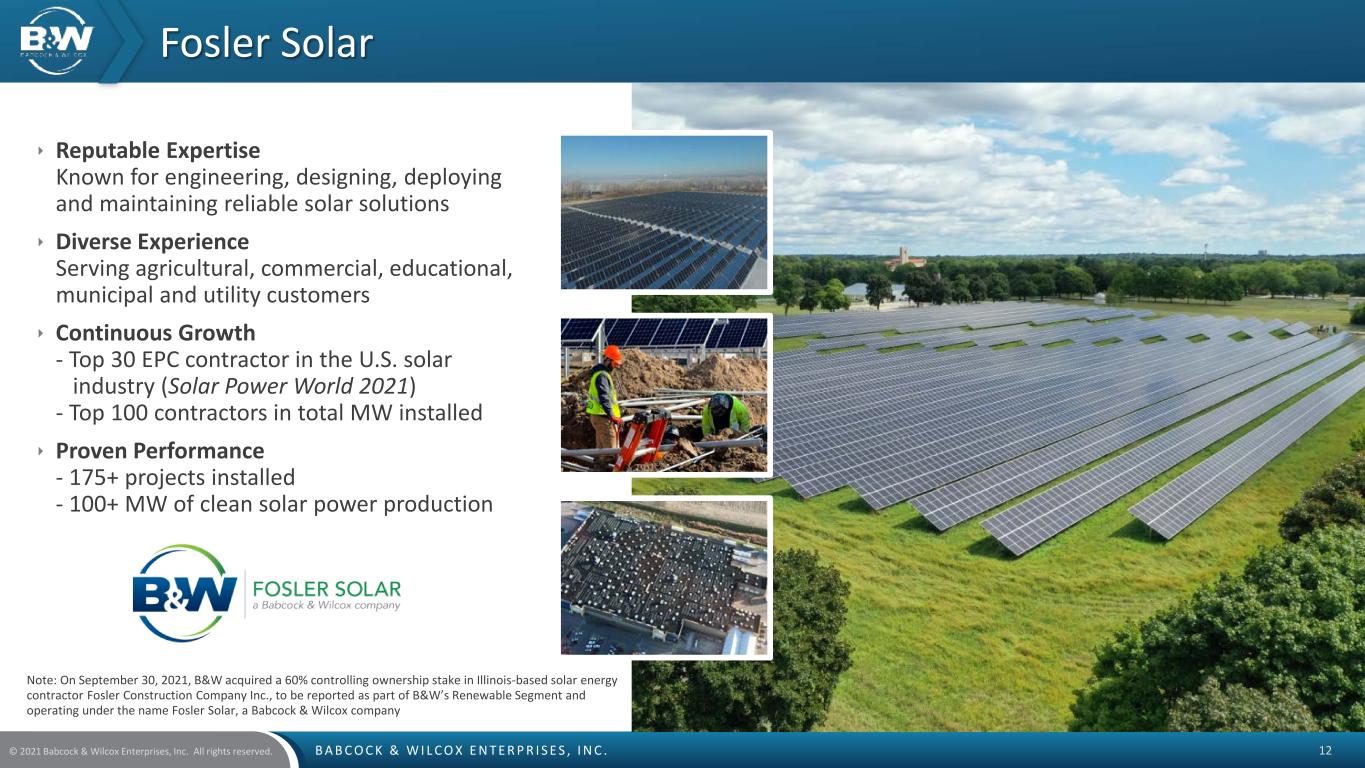
B A B C O C K & W I L C O X E N T E R P R I S E S , I N C .© 2021 Babcock & Wilcox Enterprises, Inc. All rights reserved. 12  Reputable Expertise Known for engineering, designing, deploying and maintaining reliable solar solutions  Diverse Experience Serving agricultural, commercial, educational, municipal and utility customers  Continuous Growth - Top 30 EPC contractor in the U.S. solar industry (Solar Power World 2021) - Top 100 contractors in total MW installed  Proven Performance - 175+ projects installed - 100+ MW of clean solar power production Fosler Solar Note: On September 30, 2021, B&W acquired a 60% controlling ownership stake in Illinois-based solar energy contractor Fosler Construction Company Inc., to be reported as part of B&W’s Renewable Segment and operating under the name Fosler Solar, a Babcock & Wilcox company


B A B C O C K & W I L C O X E N T E R P R I S E S , I N C .© 2021 Babcock & Wilcox Enterprises, Inc. All rights reserved. 13 Financial Information


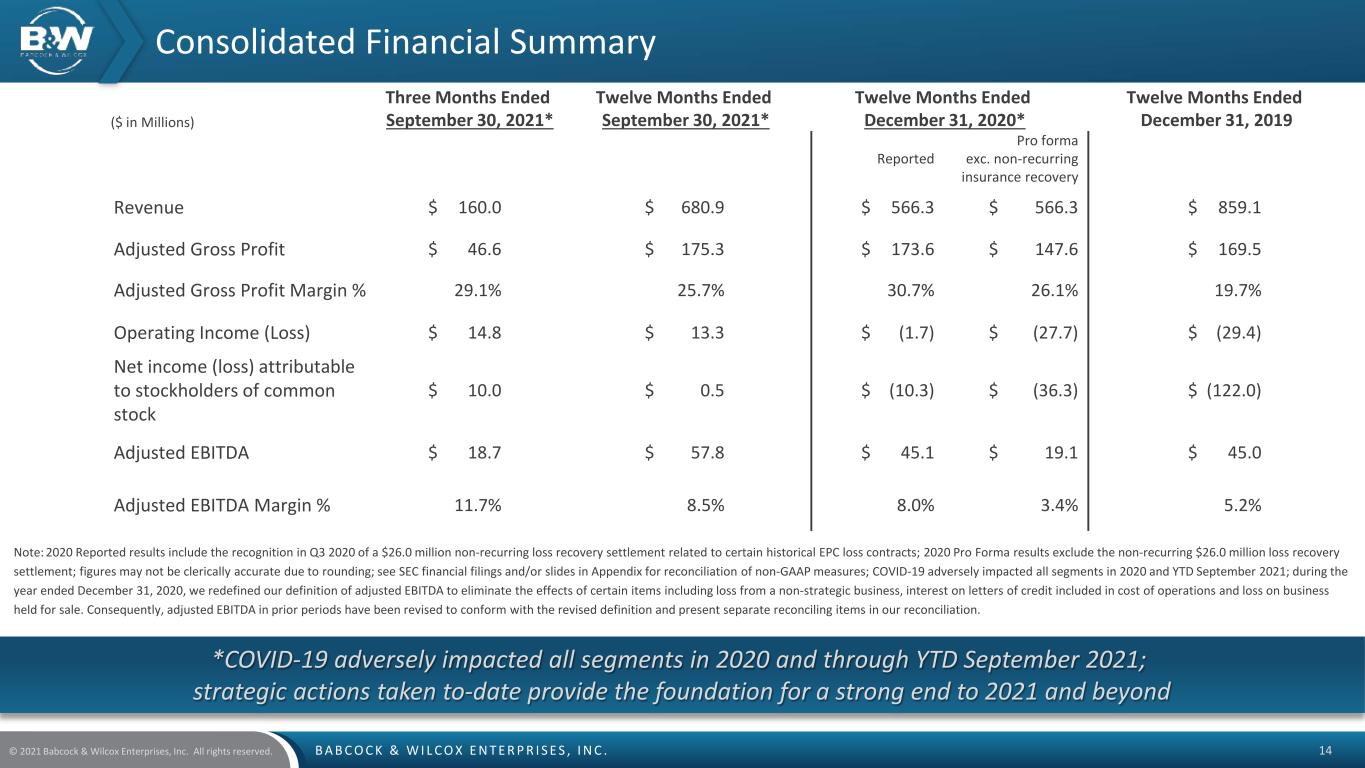
B A B C O C K & W I L C O X E N T E R P R I S E S , I N C .© 2021 Babcock & Wilcox Enterprises, Inc. All rights reserved. 14 *COVID-19 adversely impacted all segments in 2020 and through YTD September 2021; strategic actions taken to-date provide the foundation for a strong end to 2021 and beyond Consolidated Financial Summary Note: 2020 Reported results include the recognition in Q3 2020 of a $26.0 million non-recurring loss recovery settlement related to certain historical EPC loss contracts; 2020 Pro Forma results exclude the non-recurring $26.0 million loss recovery settlement; figures may not be clerically accurate due to rounding; see SEC financial filings and/or slides in Appendix for reconciliation of non-GAAP measures; COVID-19 adversely impacted all segments in 2020 and YTD September 2021; during the year ended December 31, 2020, we redefined our definition of adjusted EBITDA to eliminate the effects of certain items including loss from a non-strategic business, interest on letters of credit included in cost of operations and loss on business held for sale. Consequently, adjusted EBITDA in prior periods have been revised to conform with the revised definition and present separate reconciling items in our reconciliation. ($ in Millions) Three Months Ended September 30, 2021* Twelve Months Ended September 30, 2021* Twelve Months Ended December 31, 2020* Twelve Months Ended December 31, 2019 Reported Pro forma exc. non-recurring insurance recovery Revenue $ 160.0 $ 680.9 $ 566.3 $ 566.3 $ 859.1 Adjusted Gross Profit $ 46.6 $ 175.3 $ 173.6 $ 147.6 $ 169.5 Adjusted Gross Profit Margin % 29.1% 25.7% 30.7% 26.1% 19.7% Operating Income (Loss) $ 14.8 $ 13.3 $ (1.7) $ (27.7) $ (29.4) Net income (loss) attributable to stockholders of common stock $ 10.0 $ 0.5 $ (10.3) $ (36.3) $ (122.0) Adjusted EBITDA $ 18.7 $ 57.8 $ 45.1 $ 19.1 $ 45.0 Adjusted EBITDA Margin % 11.7% 8.5% 8.0% 3.4% 5.2%


B A B C O C K & W I L C O X E N T E R P R I S E S , I N C .© 2021 Babcock & Wilcox Enterprises, Inc. All rights reserved. 15 Capital Structure Note: Figures may not be clerically accurate due to rounding. (1) As of 9/30/21, includes total restricted cash of $8.7 million. Of the total restricted cash, $6.9 million relates to letters of credit collateral for cash pledged to secure the outstanding and undrawn letters of credit issued under our prior A&R Credit Agreement, most of which are expected to be cancelled and replaced by new letters of credit issued by PNC. We expect the completion of the issuance of new letters of credit to cover the remaining collateral balance by December 31, 2021. (2) See SEC financial filings and/or slides in Appendix for reconciliation of non-GAAP measures. Adjusted EBITDA for LTM as of 9/30/2021 is based on unaudited results for Q1 2021, Q2 2021, and Q3 2021; 2020 Adjusted EBITDA excludes losses related to a non- strategic business, interest on letters of credit included in cost of operations and loss on business held for sale. (3) Targeted Adjusted EBITDA in 2021 as disclosed by BW management; the most comparable GAAP target information is not available without unreasonable effort. (4) Net Debt compared to LTM 9/30/2021 Adjusted EBITDA (5) Net Debt compared to 2021 Target Adjusted EBITDA 2021 common stock, preferred stock and senior note offerings reduced secured debt by $347 million ($ in Millions) As of Sep 30, 2021 Capitalization: Total Debt $193.1 Cash, cash equivalents and restricted cash (1) 115.7 Net Debt $77.4 Adjusted EBITDA: LTM 9/30/2021 Adjusted EBITDA (2) 57.8 2021 Target Adjusted EBITDA (3) 70.0 Total Debt Leverage: Net Leverage (4) 1.34x Target Net Leverage (5) 1.11x

 
B A B C O C K & W I L C O X E N T E R P R I S E S , I N C .© 2021 Babcock & Wilcox Enterprises, Inc. All rights reserved. 16 Executive Summary B&W's transformation is gaining momentum, with a pipeline of more than $6.5 billion in identified project opportunities in high-growth markets over the next three years, and recent significant awards including: • $35 million contract to supply waste-to-energy technologies for new-build facilities in Greenland • $38 million technology award for new build waste-to-energy facilities in East Asia • An agreement to jointly develop a biomass-to-hydrogen clean energy project in Australia using its BrightLoopTM chemical looping technology B&W is continuing to expand its clean energy portfolio through innovation and acquisition: • Launched ClimateBright™ decarbonization technologies platform (May 2021) • Acquired a controlling stake in a leading solar installation firm, Fosler Construction Company Inc. (Sept 2021) • Signed an agreement to acquire Voda A/S in Denmark to further expand renewable services in Europe (Sept 2021) Babcock & Wilcox provides high-quality, innovative renewable, environmental and thermal technologies and has served critical power generation and industrial applications for more than 150 years. Disclaimer: B&W Enterprises cautions not to place undue reliance on any forward-looking statements, which speak only as of the date of this presentation and may be impacted by the risks described in our SEC reports including, without limitation, the impact of COVID-19 on us and the capital markets and global economic climate generally. We undertake no obligation to update or revise any forward-looking statement, except to the extent required by applicable law. Advancing energy and environmental solutions that bring power and progress to our world Strong Global Brand After achieving ~$58 million in adjusted EBITDA in the 12 months ended September 30, 2021, B&W is targeting1: • FY2021 adjusted EBITDA of at least $70 million • FY2022 adjusted EBITDA of $110-$120 million Positioned for Growth Building Toward the Future (1) The most comparable GAAP target information is not available without unreasonable effort; based on Q3 2021 results


B A B C O C K & W I L C O X E N T E R P R I S E S , I N C .© 2021 Babcock & Wilcox Enterprises, Inc. All rights reserved. 17 Appendix


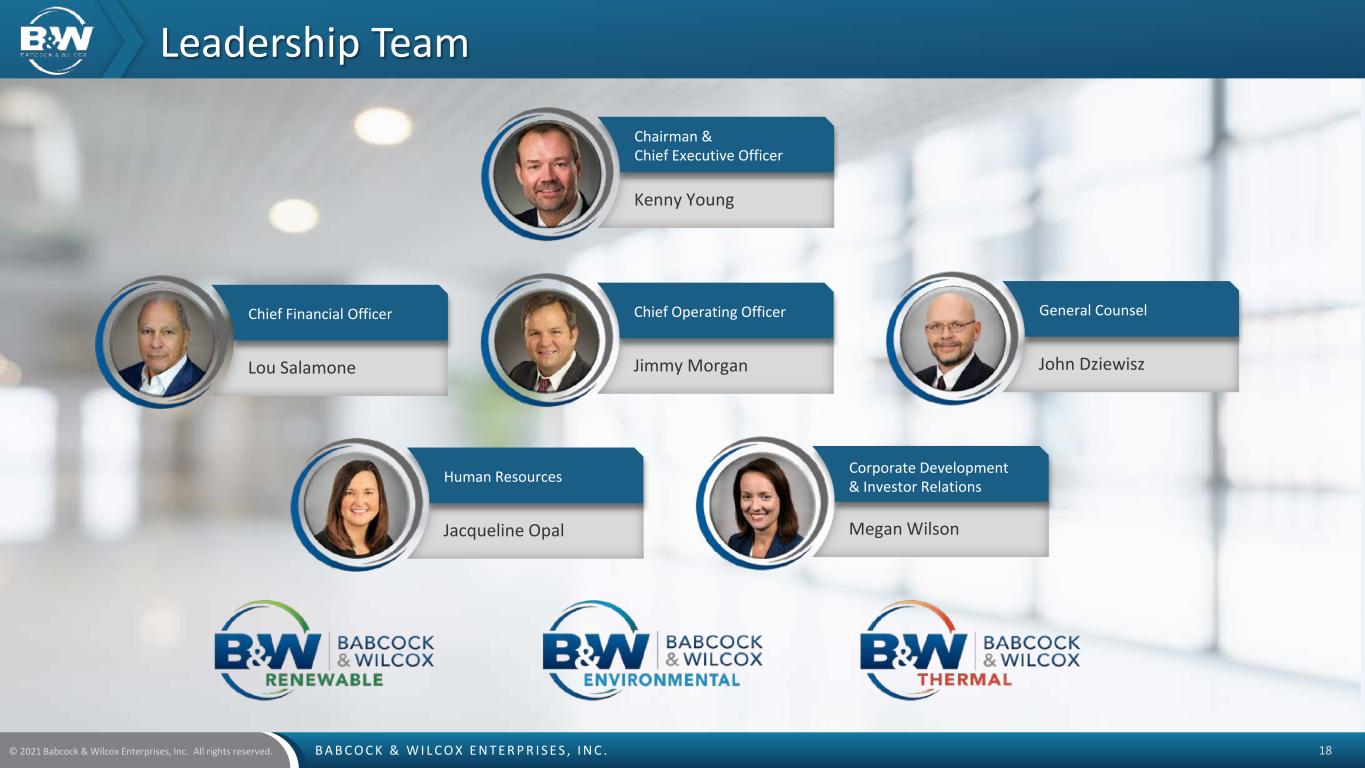
B A B C O C K & W I L C O X E N T E R P R I S E S , I N C .© 2021 Babcock & Wilcox Enterprises, Inc. All rights reserved. 18 Chief Financial Officer Lou Salamone Chief Operating Officer Jimmy Morgan General Counsel John Dziewisz Chairman & Chief Executive Officer Kenny Young Leadership Team Human Resources Jacqueline Opal Corporate Development & Investor Relations Megan Wilson


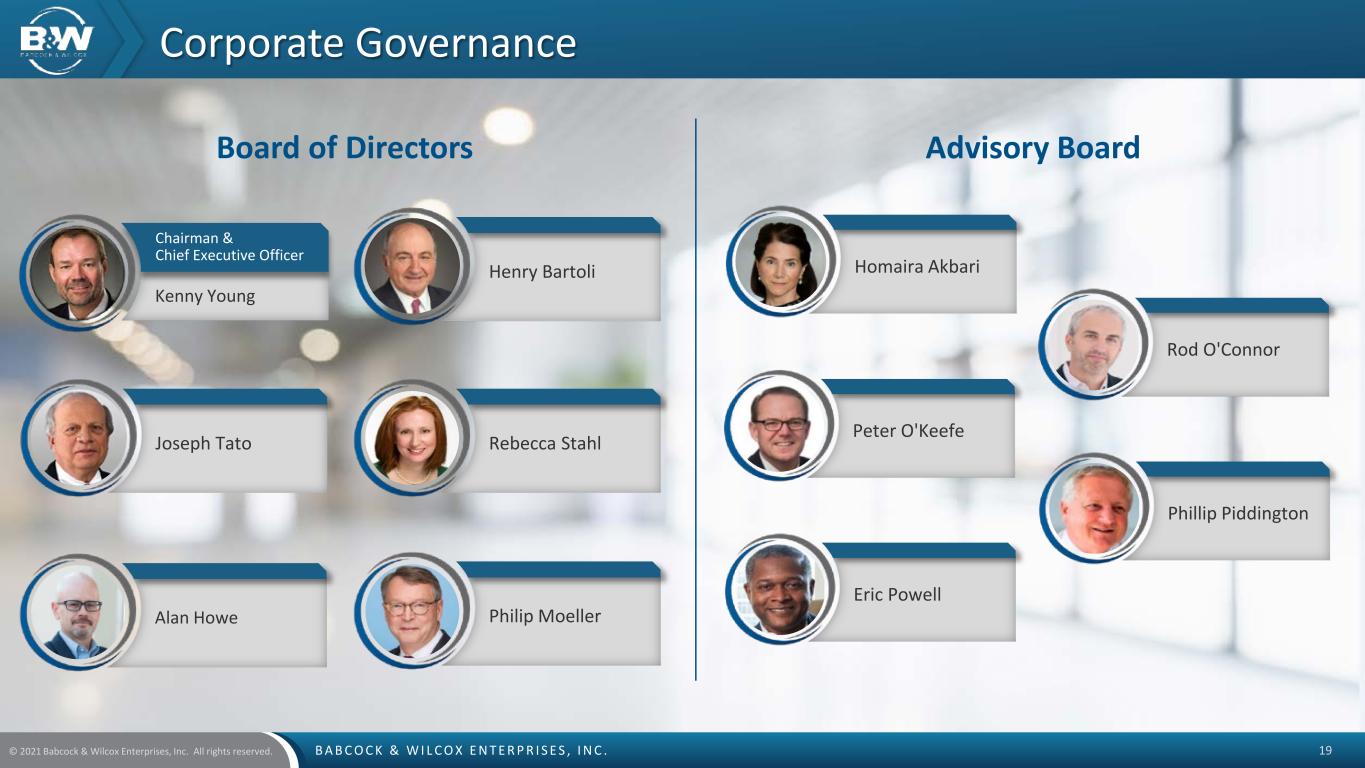
B A B C O C K & W I L C O X E N T E R P R I S E S , I N C .© 2021 Babcock & Wilcox Enterprises, Inc. All rights reserved. 19 Joseph Tato Philip MoellerAlan Howe Rebecca Stahl Corporate Governance Board of Directors Advisory Board Chairman & Chief Executive Officer Kenny Young Henry Bartoli Rod O'Connor Phillip Piddington Peter O'Keefe Eric Powell Homaira Akbari


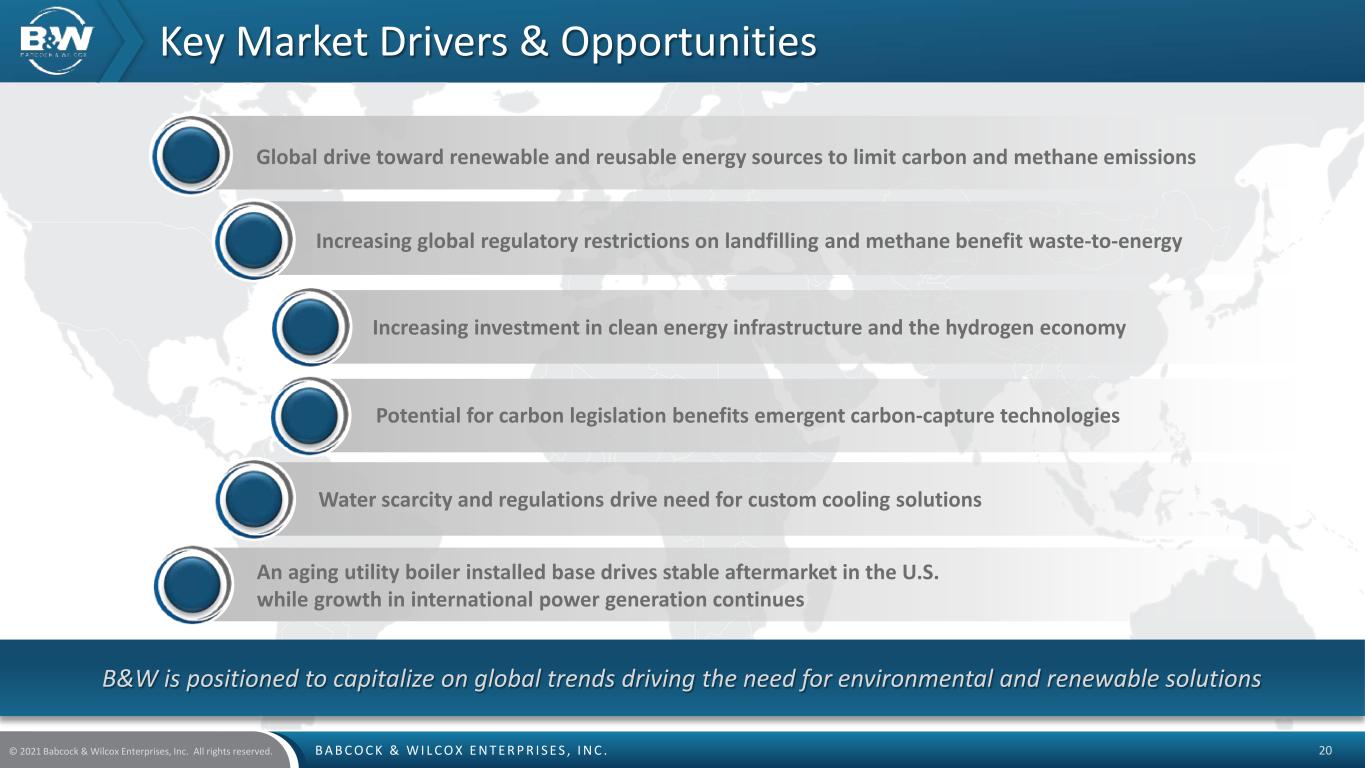
B A B C O C K & W I L C O X E N T E R P R I S E S , I N C .© 2021 Babcock & Wilcox Enterprises, Inc. All rights reserved. 20 B&W is positioned to capitalize on global trends driving the need for environmental and renewable solutions Key Market Drivers & Opportunities Potential for carbon legislation benefits emergent carbon-capture technologies Water scarcity and regulations drive need for custom cooling solutions An aging utility boiler installed base drives stable aftermarket in the U.S. while growth in international power generation continues Increasing investment in clean energy infrastructure and the hydrogen economy Increasing global regulatory restrictions on landfilling and methane benefit waste-to-energy Global drive toward renewable and reusable energy sources to limit carbon and methane emissions


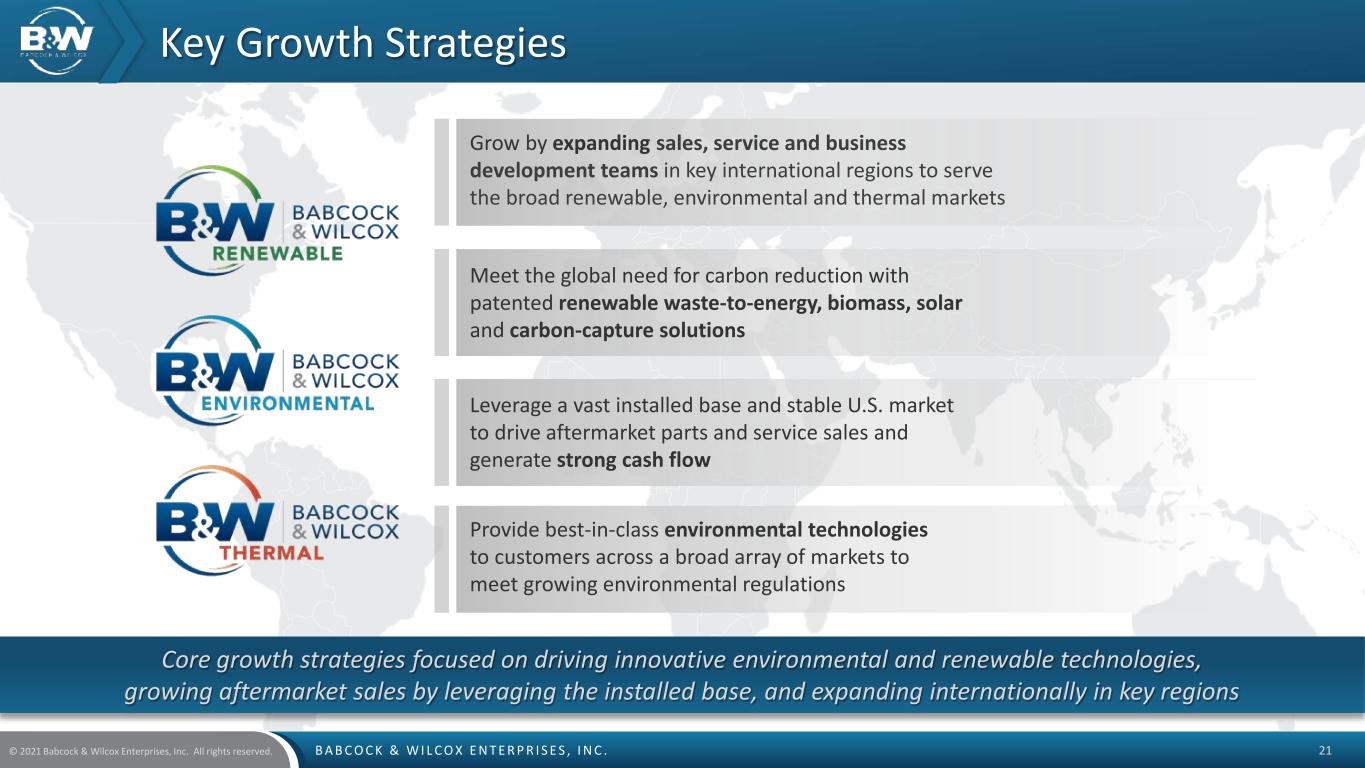
B A B C O C K & W I L C O X E N T E R P R I S E S , I N C .© 2021 Babcock & Wilcox Enterprises, Inc. All rights reserved. 21 Core growth strategies focused on driving innovative environmental and renewable technologies, growing aftermarket sales by leveraging the installed base, and expanding internationally in key regions Key Growth Strategies Leverage a vast installed base and stable U.S. market to drive aftermarket parts and service sales and generate strong cash flow Provide best-in-class environmental technologies to customers across a broad array of markets to meet growing environmental regulations Meet the global need for carbon reduction with patented renewable waste-to-energy, biomass, solar and carbon-capture solutions Grow by expanding sales, service and business development teams in key international regions to serve the broad renewable, environmental and thermal markets


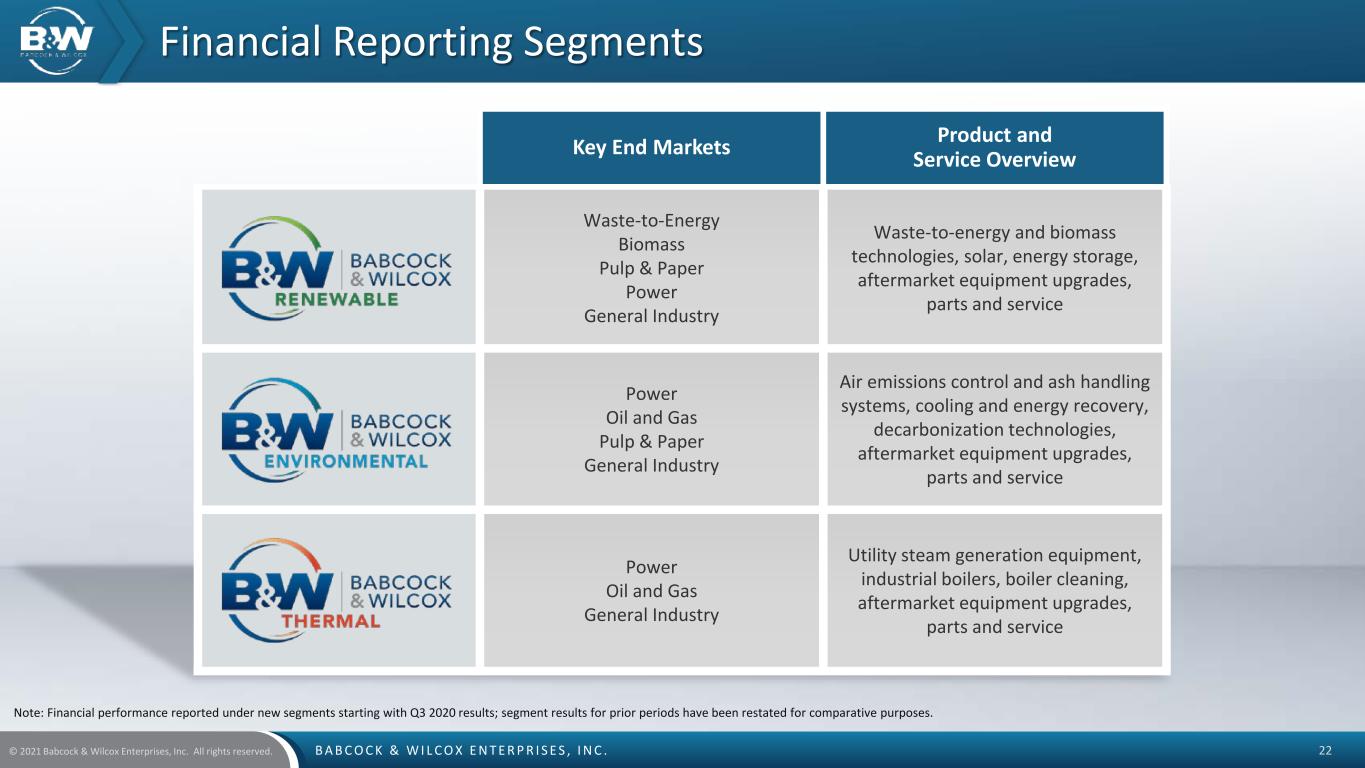
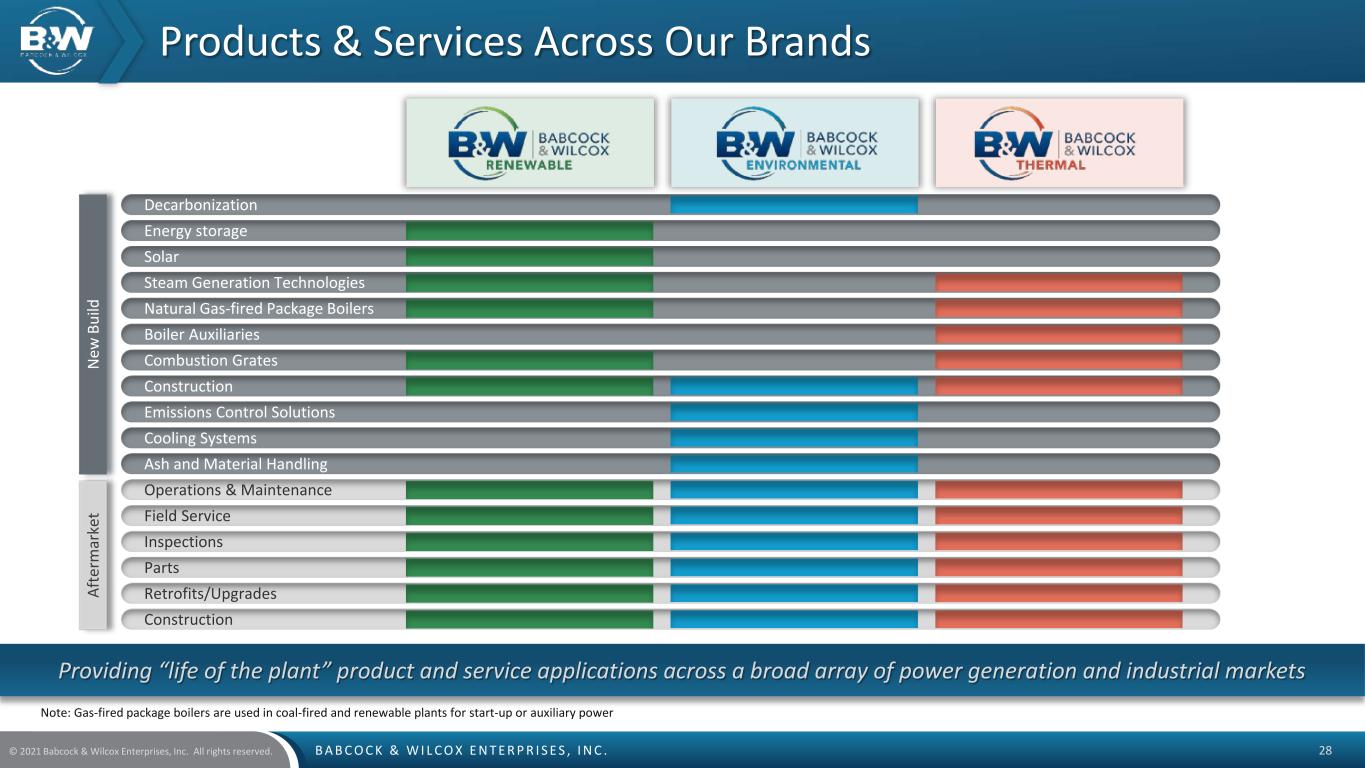
B A B C O C K & W I L C O X E N T E R P R I S E S , I N C .© 2021 Babcock & Wilcox Enterprises, Inc. All rights reserved. 22 Key End Markets Product and Service Overview Waste-to-Energy Biomass Pulp & Paper Power General Industry Waste-to-energy and biomass technologies, solar, energy storage, aftermarket equipment upgrades, parts and service Power Oil and Gas Pulp & Paper General Industry Air emissions control and ash handling systems, cooling and energy recovery, decarbonization technologies, aftermarket equipment upgrades, parts and service Power Oil and Gas General Industry Utility steam generation equipment, industrial boilers, boiler cleaning, aftermarket equipment upgrades, parts and service Financial Reporting Segments Note: Financial performance reported under new segments starting with Q3 2020 results; segment results for prior periods have been restated for comparative purposes.


B A B C O C K & W I L C O X E N T E R P R I S E S , I N C .© 2021 Babcock & Wilcox Enterprises, Inc. All rights reserved. 23 Three months ended September 30, 2021 2020 Adjusted EBITDA (2)(3) $ 18.7 $ 26.8 Restructuring activities (4.6) (2.4) Acquisition pursuit and related costs (4.0) — Financial advisory services (0.3) (1.7) Advisory fees for settlement costs and liquidity planning (1.0) (1.4) Litigation legal costs (0.6) (0.8) Stock compensation (0.2) (1.2) Interest on letters of credit included in cost of operations (0.6) (0.2) Loss from business held for sale — (0.1) Depreciation & amortization (4.3) (4.1) Contract asset amortization (0.1) — Product development (2.4) — Gain (loss) from a non-strategic business 0.2 (0.9) Gain on asset disposals, net 13.8 — Operating income (loss) 14.8 14.1 Interest expense, net (8.2) (12.0) Gain (loss) on debt extinguishment — — Loss on sale of business — — Net pension benefit before MTM 7.6 7.3 MTM gain from benefit plans 2.3 — Foreign exchange (1.7) 25.0 Other – net (0.8) (0.3) Total other income (expense) (0.8) 20.0 Income (loss) before income tax expense 13.9 34.1 Income tax expense (benefit) 0.3 (0.5) Income (loss) from continuing operations 13.6 34.6 Income from discontinued operations, net of tax — — Net income (loss) 13.6 34.6 Net (income) loss attributable to non-controlling interest — 0.2 Net income (loss) attributable to stockholders 13.6 34.7 Less: Dividend on Series A preferred stock 3.7 — Net income (loss) attributable to stockholders of common stock $ 10.0 $ 34.7 Adjusted EBITDA Reconciliation(1) $ in Millions Nine months ended September 30, 2021 2020 Adjusted EBITDA (2)(3) $ 42.3 $ 29.5 Restructuring activities (8.0) (6.7) Acquisition pursuit and related costs (4.0) — Financial advisory services (2.6) (3.2) Advisory fees for settlement costs and liquidity planning (5.0) (5.2) Litigation legal costs (2.1) (1.8) Stock compensation (8.0) (3.1) Interest on letters of credit included in cost of operations (1.2) (0.6) Loss from business held for sale (0.5) (0.4) Depreciation & amortization (12.7) (12.3) Contract asset amortization (0.1) — Product development (2.7) — Gain (loss) from a non-strategic business (0.1) (1.2) Gain on asset disposals, net 15.8 0.9 Operating income (loss) 11.1 (3.9) Interest expense, net (30.2) (49.3) Gain (loss) on debt extinguishment 6.5 (6.2) Loss on sale of business (2.2) (0.1) Net pension benefit before MTM 22.6 22.3 MTM gain from benefit plans 2.3 — Foreign exchange (1.1) 22.7 Other – net (1.0) (3.1) Total other income (expense) (3.1) (13.7) Income (loss) before income tax expense 8.0 (17.6) Income tax expense (benefit) 6.7 0.5 Income (loss) from continuing operations 1.3 (17.1) Income from discontinued operations, net of tax — 1.8 Net income (loss) 1.3 (15.3) Net (income) loss attributable to non-controlling interest — 0.4 Net income (loss) attributable to stockholders 1.3 (14.9) Less: Dividend on Series A preferred stock 5.4 — Net income (loss) attributable to stockholders of common stock $ (4.1) $ (14.9) 1) Figures may not be clerically accurate due to rounding 2) Adjusted EBITDA for the three months and nine months ended September 30, 2020, excludes losses related to a non-strategic business and interest on letters of credit included in cost of operations that were previously included in Adjusted EBITDA and total $0.9 million and $0.2 million, respectively, and $1.2 million and $0.6 million, respectively 3) Adjusted EBITDA for the three and nine months ended September 30, 2020 includes a $26 million non-recurring loss recovery related to claims in connection with multiple Renewable EPC loss contracts $ in Millions


B A B C O C K & W I L C O X E N T E R P R I S E S , I N C .© 2021 Babcock & Wilcox Enterprises, Inc. All rights reserved. 24 Twelve months ended Sep 30, 2021 Dec 31, 2020 Dec 31, 2019 Adjusted EBITDA 57.8 $ 45.1 $ 45.0 Restructuring activities (13.1) (11.8) (11.7) Acquisition pursuit and related costs (4.0) — — Financial advisory services (3.8) (4.4) (9.1) Settlement cost to exit Vølund contract (4) — — (6.6) Advisory fees for settlement costs and liquidity planning (6.2) (6.4) (11.8) Litigation legal costs (2.5) (2.1) (0.5) Stock compensation (9.6) (4.6) (3.4) Interest on letters of credit included in cost of operations (1.5) (0.9) (0.4) Income (loss) from business held for sale (0.5) (0.5) (5.9) Depreciation & amortization (17.2) (16.8) (23.6) Contract asset amortization (0.1) — — Product development (2.7) — — Gain (loss) from a non-strategic business (1.5) (2.6) (5.5) Gain on asset disposals, net 18.2 3.3 3.9 Operating income (loss) 13.3 (1.7) (29.4) Interest expense, net (40.0) (59.2) (94.0) Gain (loss) on debt extinguishment 6.5 (6.2) (4.0) Loss on sale of business (2.2) (0.1) (3.6) Net pension benefit before MTM 29.1 28.8 14.0 MTM (loss) gain from benefit plans (20.9) (23.2) 8.8 Foreign exchange 35.0 58.8 (16.6) Other – net 1.0 (1.1) 0.3 Income (loss) before income tax expense 21.7 (3.9) (124.4) Income tax expense 15.3 8.2 5.3 Income (loss) from continuing operations 6.4 (12.1) (129.7) Income (loss) from discontinued operations, net of tax — 1.8 0.7 Net income (loss) 6.4 (10.3) (129.0) Net (income) loss attributable to non-controlling interest (0.5) — 7.1 Net income (loss) attributable to stockholders 5.9 (10.3) (122.0) Less: Dividend on Series A preferred stock 5.4 — — Net income (loss) attributable to stockholders of common stock $ 0.5 $ (10.3) $ (122.0) 1) Figures may not be clerically accurate due to rounding 2) During the year ended December 31, 2020, we redefined our definition of adjusted EBITDA to eliminate the effects of certain items including loss from a non-strategic business, interest on letters of credit included in cost of operations and loss on business held for sale. Consequently, adjusted EBITDA in prior periods have been revised to conform with the revised definition and present separate reconciling items in our reconciliation. 3) Adjusted EBITDA for the twelve months ended December 31, 2020, include the recognition of a $26.0 million loss recovery settlement related to certain historical EPC loss contracts in the third quarter, as previously disclosed. 4) In March 2019, we entered into a settlement in connection with an additional B&W Renewable waste-to-energy EPC contract, for which notice to proceed was not given and the contract was not started. The settlement eliminated our obligations to act, and our risk related to acting, as the prime EPC should the project have moved forward. Adjusted EBITDA Reconciliation (2)(3) (1) $ in Millions


B A B C O C K & W I L C O X E N T E R P R I S E S , I N C .© 2021 Babcock & Wilcox Enterprises, Inc. All rights reserved. 25 Nine months ended September 30, 2021 2020 Adjusted gross profit (1)(2) Operating income (loss) $ 11.1 $ (3.9) Selling, general and administrative ("SG&A") expenses 111.1 107.6 Advisory fees and settlement costs 9.7 10.1 Amortization expense 5.3 4.1 Contract asset amortization expense 0.1 — Restructuring activities 8.0 6.7 Research and development costs 1.0 3.9 Losses from a non-strategic business 0.1 1.2 Gains on asset disposals, net (15.8) (0.9) Adjusted gross profit $ 130.5 $ 128.8 (1) Intangible amortization is not allocated to the segments' adjusted gross profit, but depreciation is allocated to the segments' adjusted gross profit. (2) Adjusted gross profit for the three and nine months ended September 30, 2020, excludes losses related to a non-strategic business that was previously included in Adjusted gross profit and totals $0.9 million and $1.2 million. (3) Figures may not be clerically accurate due to rounding. Adjusted Gross Profit Reconciliation $ in Millions (3) Three months ended September 30, 2021 2020 Adjusted gross profit (1)(2) Operating income (loss) $ 14.8 $ 14.1 Selling, general and administrative ("SG&A") expenses 37.5 35.6 Advisory fees and settlement costs 1.8 3.8 Amortization expense 2.0 1.4 Contract asset amortization expense 0.1 — Restructuring activities 4.6 2.4 Research and development costs (0.2) 1.4 Losses from a non-strategic business (0.2) 0.9 Gains on asset disposals, net (13.8) — Adjusted gross profit $ 46.6 $ 59.6 $ in Millions
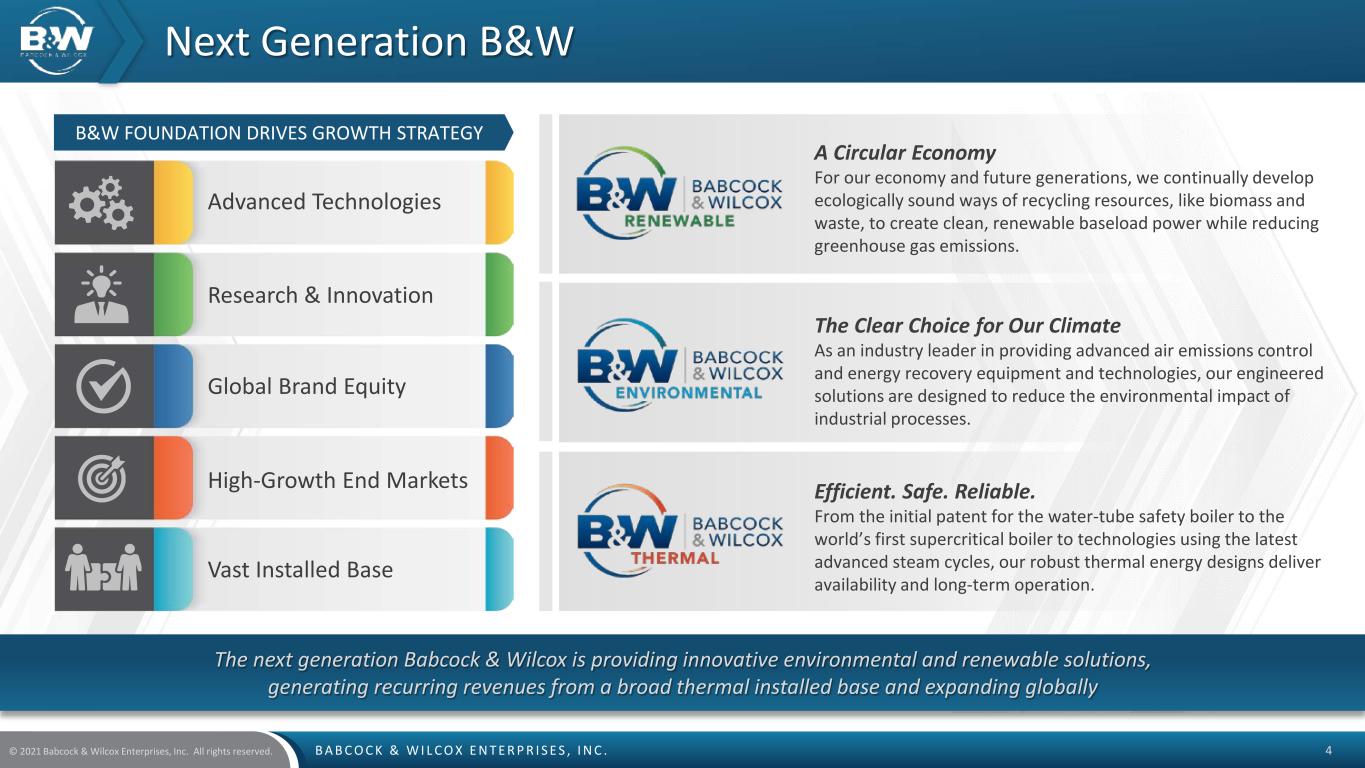

 
B A B C O C K & W I L C O X E N T E R P R I S E S , I N C .© 2021 Babcock & Wilcox Enterprises, Inc. All rights reserved. 26 (1) Intangible amortization is not allocated to the segments' adjusted gross profit, but depreciation is allocated to the segments' adjusted gross profit. (2) Adjusted gross profit for the twelve months ended December 31, 2020 and December 31, 2019, excludes losses related to a non-strategic business that was previously included in Adjusted gross profit and totals $2.6 million and $5.5 million. (3) Adjusted gross profit for the twelve months ended December 31, 2020 includes the recognition of a $26.0 million loss recovery settlement related to certain historical EPC loss contracts in the third quarter, as previously disclosed (4) Figures may not be clerically accurate due to rounding. Adjusted Gross Profit Reconciliation Twelve months ended Sep 30, 2021 Dec 31, 2020 Dec 31, 2019 Adjusted gross profit (1) Operating income (loss) $ 13.3 $ (1.7) $ (29.4) Selling, general and administrative ("SG&A") expenses 144.9 141.4 150.6 Advisory fees and settlement costs 12.5 12.9 27.9 Amortization expense 6.8 5.5 4.3 Restructuring activities 13.1 11.8 11.7 Research and development costs 1.4 4.4 2.9 Losses from a non-strategic business 1.5 2.6 5.5 Gains on asset disposals, net (18.2) (3.3) (3.9) Adjusted gross profit $ 175.3 $ 173.6 $ 169.5 (4) (2)(3) $ in Millions
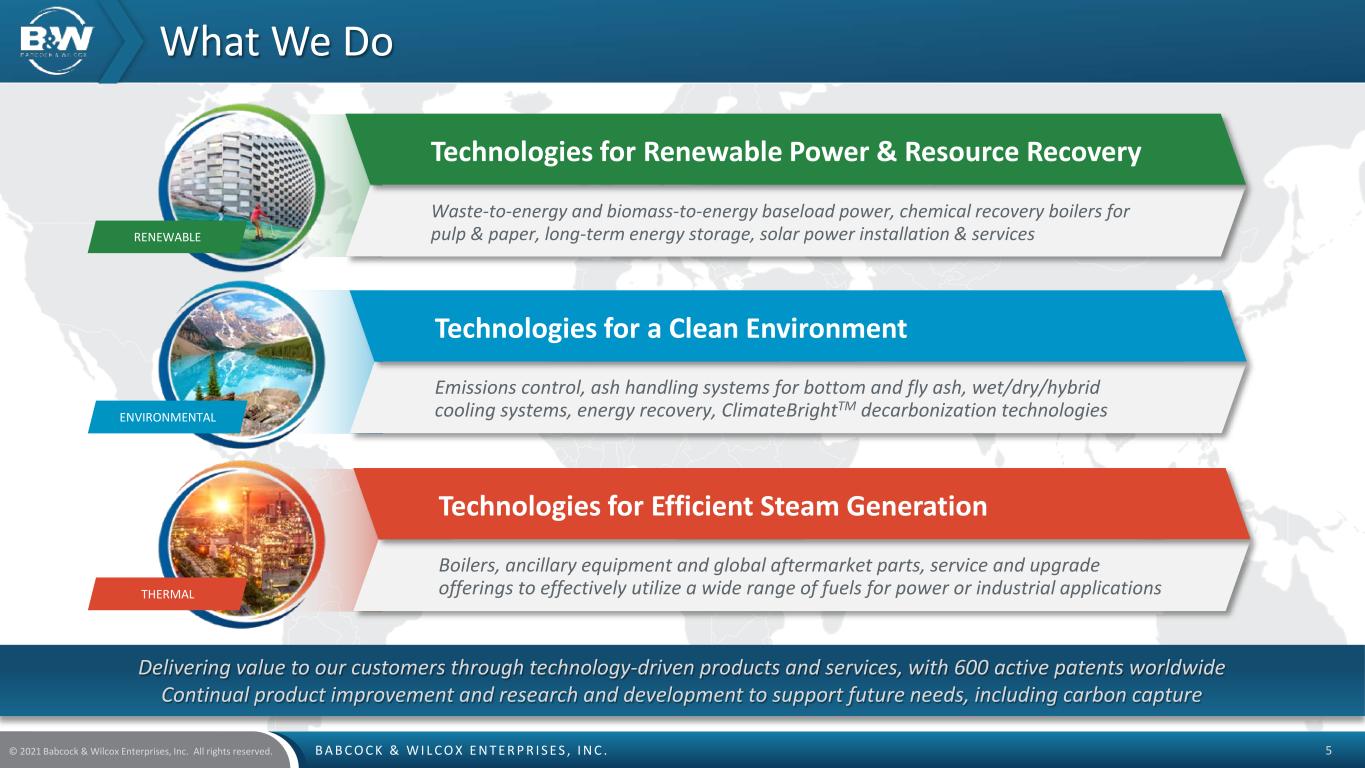

 
B A B C O C K & W I L C O X E N T E R P R I S E S , I N C .© 2021 Babcock & Wilcox Enterprises, Inc. All rights reserved. 27 Key Technologies
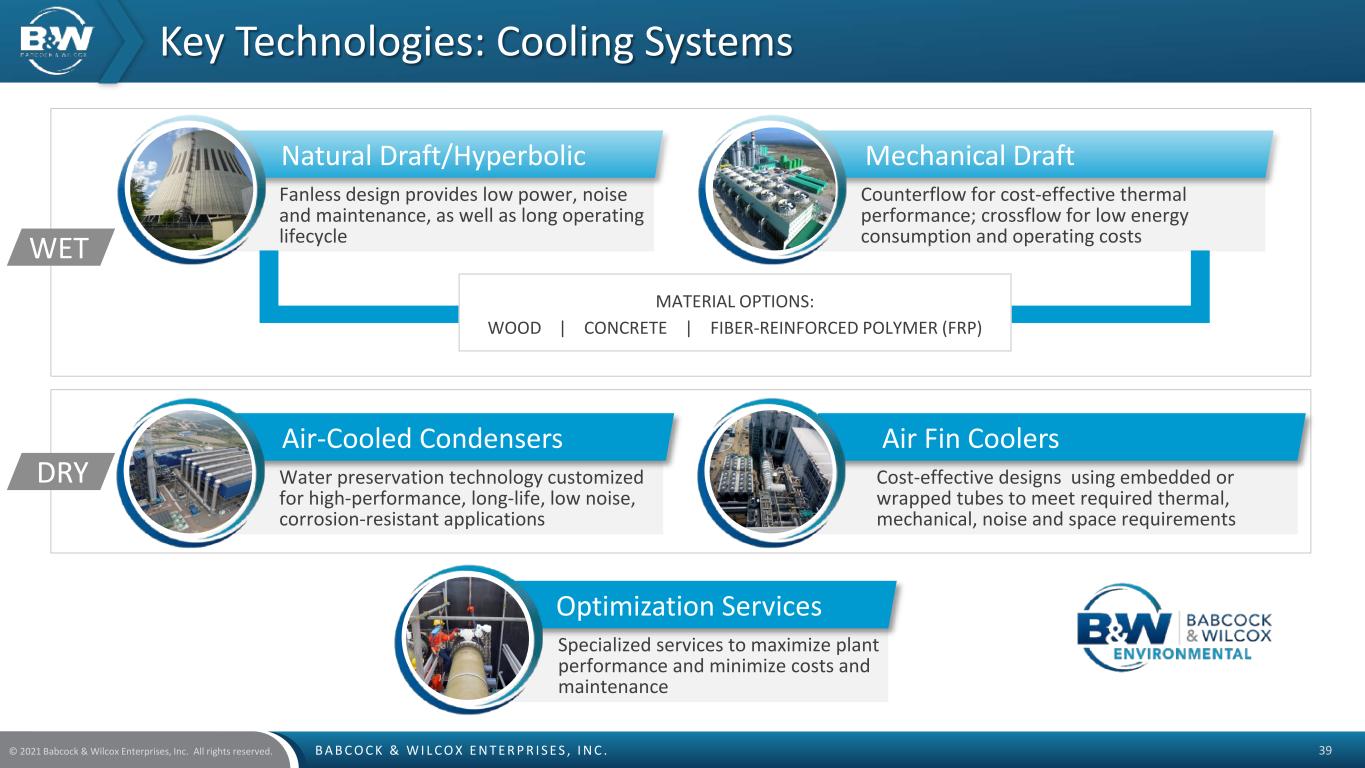

 
B A B C O C K & W I L C O X E N T E R P R I S E S , I N C .© 2021 Babcock & Wilcox Enterprises, Inc. All rights reserved. 28 Af te rm ar ke t N ew B ui ld Note: Gas-fired package boilers are used in coal-fired and renewable plants for start-up or auxiliary power Products & Services Across Our Brands Providing “life of the plant” product and service applications across a broad array of power generation and industrial markets Decarbonization Energy storage Solar Steam Generation Technologies Natural Gas-fired Package Boilers Boiler Auxiliaries Combustion Grates Construction Emissions Control Solutions Cooling Systems Ash and Material Handling Operations & Maintenance Field Service Inspections Parts Retrofits/Upgrades Construction


B A B C O C K & W I L C O X E N T E R P R I S E S , I N C .© 2021 Babcock & Wilcox Enterprises, Inc. All rights reserved. 29 Carbon Capture Technology for the 1000 GW of Global Coal Installed Base OxyBright™ oxygen-fuel combustion  Oxy-coal combustion technology  “Near-zero” emissions  30 MW demonstration complete  Full-scale design ready SolveBright™ post-combustion carbon capture  Post-combustion technology  Patented amine-based solvent process  Pilot commissioning complete  Installed base retrofit application Key Technologies: Clean Coal Solutions Ready for Deployment


B A B C O C K & W I L C O X E N T E R P R I S E S , I N C .© 2021 Babcock & Wilcox Enterprises, Inc. All rights reserved. 30 Key Technologies: BrightLoop™ Chemical Looping Combustion Platform Technology OUTPUT Combustion: Steam Gasification: Hydrogen Partial Oxidation: SyngasBrightLoop™ Chemical Looping Technology Natural Gas Biomass Biogas Waste Coal (Petcoke) FEEDSTOCK CO2 for Storage and Beneficial Use Potential extension beyond power generation Process can be modified to convert carbon-based fuels—coal, biomass and natural gas—to electricity, syngas, chemicals, liquid fuels or hydrogen  Advanced process for clean power generation and CO2 capture  A flameless, oxy-combustion process using oxidation-reduction reactions to process fuel and produce energy for power generation  Produces a concentrated CO2 stream that can be captured, cleaned and compressed for use or permanent storage  Lower cost, higher efficiency  Working in collaboration with The Ohio State University Turbine Fuel Cell/Boiler H2 Storage Shift Reaction Methanation Fischer-Tropsch POWER FUELS (Gasoline, Diesel, Jet Fuel) HYDROGEN METHANOL HEATProcess


B A B C O C K & W I L C O X E N T E R P R I S E S , I N C .© 2021 Babcock & Wilcox Enterprises, Inc. All rights reserved. 31 Reduces dependency on landfills and reduces methane gas emissions Fuels: MSW, RDF Waste-to-Energy Boilers Single-drum, industry-standard unit for improved mill operation Fuels: Black liquor Process Recovery Boilers High pressure, high efficiency, high capacity, low emissions Fuel: Coal, oil, natural gas, multi-fuel Utility Boilers Bottom- or top-supported, shop- or field-assembled Fuel: Natural gas, oil, CO, waste heat and gases Natural Gas-Fired and Other Industrial Water-Tube Boilers Carbon-neutral technology Fuels: Wood, wood waste, straw, sludge Biomass-Fired Boilers Key Technologies: Steam Generation Technologies


B A B C O C K & W I L C O X E N T E R P R I S E S , I N C .© 2021 Babcock & Wilcox Enterprises, Inc. All rights reserved. 32  Large installed base with diverse set of customers  Grate design allows for high availability and long operational time, leading to reduced O&M cost  High thermal efficiency and low emissions  Fuel flexibility  Factory assembled modules reduce field construction A Market Leader with Differentiating Technology in Waste-to-Energy Solutions DynaGrate® Pivoting Combustion Grate Key Technologies: Renewable Combustion Grates


B A B C O C K & W I L C O X E N T E R P R I S E S , I N C .© 2021 Babcock & Wilcox Enterprises, Inc. All rights reserved. 33 Emission Technology Solution Particulate Control  Pulse Jet Fabric Filters (PJFF) / Baghouses  Wet and Dry Electrostatic Precipitators (ESPs)  Wet Particulate Scrubbers  Multiclone® Dust Collectors  Selective Catalytic and Non-catalytic Reduction (SCR/SNCR)  Low NOX Burners and Combustion Systems NOx Control  Wet or Seawater Flue Gas Desulfurization (FGD) Systems  Semi-dry FGDs (Spray Dry Absorbers, Circulating Dry Scrubbers)  Wet ESPs  Dry Sorbent Injection (DSI) SO2 / Acid Gas Control  Wet ESPs  Dry Sorbent Injection (DSI)SO3 / Acid Mist Control  Powdered Activated Carbon Injection  Absorption Plus™, MercPlus™, Mitagent™ Additives  GMAB™ ADIOX® and MERCOX® technologies Mercury, Dioxins, Furans  Wastewater Evaporation System (WES) via Spray Drying  Air-Cooled CondensersWastewater Elimination Key Technologies: Emissions Controls


B A B C O C K & W I L C O X E N T E R P R I S E S , I N C .© 2021 Babcock & Wilcox Enterprises, Inc. All rights reserved. 34 Key Technologies: Steam Generation & Environmental Solutions Across a Utility Plant Steam Generator Technology  Pulverizers  Furnace  Burners and ignitors  Sootblowers  Pressure parts  Air heaters and air heating cleaning systems  Bottom ash handling systems B&W provides a comprehensive array of proprietary technology and experience to utility power generation customers Environmental Solutions  Particulate control  Nitrogen oxides (NOx) removal  Sulfur removal  Mercury, dioxin and furan removal  Fly ash handling systems  Wastewater elimination Dry Scrubbing Technologies Particulate Control Technologies Particulate Control Technologies Fly Ash Handling Wet Scrubbing Technologies Fly Ash Handling Bottom Ash Handling Boiler Auxiliary Components: Fans, Air Heaters, etc. Boiler Pressure Parts Boiler Cleaning Equipment Burners Pulverizers SCR NOx Control Technologies


B A B C O C K & W I L C O X E N T E R P R I S E S , I N C .© 2021 Babcock & Wilcox Enterprises, Inc. All rights reserved. 35 Field Services Component & System Upgrades Control Systems Replacement & Spare Parts Operation & Maintenance DynaGrate® combustion grate DynaDischarger® ash removal Water-cooled wear zones and Inconel® corrosion protection VoluMix® system for improved combustion Fabric filter baghouse Wet scrubber with ADIOX® including energy recovery On-line boiler washing system Selective non-catalytic reduction (SNCR) NOx control DynaFeeder® waste fuel feeder system Cooling towers Battery storage systems Carbon capture solutions Key Technologies: Comprehensive Waste-to-Energy Solutions


B A B C O C K & W I L C O X E N T E R P R I S E S , I N C .© 2021 Babcock & Wilcox Enterprises, Inc. All rights reserved. 36 An innovative solution to eliminate ash ponds Key Technologies: Submerged Grind Conveyor Ash Handling Designed to meet current and future U.S. regulatory requirements for ash handling with:  Lower equipment cost  Lower installation cost • Utilize existing hoppers and gate valves • No modification to hopper  Short outage required  Short lead time  Available redundancy under the boiler  Lower O&M costs


B A B C O C K & W I L C O X E N T E R P R I S E S , I N C .© 2021 Babcock & Wilcox Enterprises, Inc. All rights reserved. 37 Benefits of a solar addition: 1. Powering up/down operations 2. Supplemental/plant energy source 3. Additional MW/GW output Key Technologies: Solar Installation High efficiency. Low emissions. Integrated solutions for clean power production.  Engineering & Procurement • Project Cost Analysis • Grid Integration and Interconnection • Technical Evaluation • AC and DC Engineering • Permitting and AHJ Permissions • Logistics • Strategic Procurement of Structural Components and Electrical BOE Industry-leading EPC Services  Construction • Subcontractor Management • On-Site Construction Management • Coordination and Supervision of Projects • Utility Interconnections • Quality and Commissioning Control • Electrical and Structural QA/QC


B A B C O C K & W I L C O X E N T E R P R I S E S , I N C .© 2021 Babcock & Wilcox Enterprises, Inc. All rights reserved. 38 Key Technologies: Short and Long Duration Energy Storage Short and long duration energy storage smooths renewable energy peaks and bridges weather events NREL Enduring: (8-100 hours storage)  Electric heater (stores heat in sand)  Air Brayton Combined Cycle  B&W has a partnership with Eos Energy Storage, LLC to sell and service Eos’ innovative, patented Eos Znyth® zinc battery solution (3-12 hours storage) for industrial and utility- scale energy storage • B&W markets Eos’ battery storage solutions globally • B&W is exclusive preferred installer in U.S. and Canada  B&W offers Pressurized or Atmospheric Fluidized Bed technology for long duration energy storage  B&W also has an exclusive option to license NREL’s Enduring long duration energy storage technology


B A B C O C K & W I L C O X E N T E R P R I S E S , I N C .© 2021 Babcock & Wilcox Enterprises, Inc. All rights reserved. 39 Specialized services to maximize plant performance and minimize costs and maintenance Optimization Services Water preservation technology customized for high-performance, long-life, low noise, corrosion-resistant applications Air-Cooled Condensers Cost-effective designs using embedded or wrapped tubes to meet required thermal, mechanical, noise and space requirements Air Fin Coolers Counterflow for cost-effective thermal performance; crossflow for low energy consumption and operating costs Mechanical Draft Fanless design provides low power, noise and maintenance, as well as long operating lifecycle Natural Draft/Hyperbolic WET MATERIAL OPTIONS: WOOD | CONCRETE | FIBER-REINFORCED POLYMER (FRP) Key Technologies: Cooling Systems DRY


B A B C O C K & W I L C O X E N T E R P R I S E S , I N C .© 2021 Babcock & Wilcox Enterprises, Inc. All rights reserved. 40 Key Technologies: Global Parts & Service Upgrades & Retrofits Replacement Parts Optimization Systems Engineering Services Adding value through constructability: Safe execution of new installation, retrofits, system maintenance/repair, plant modifications Construction Evaluating options for improved performance: Expert people, tools and processes to measure, model, design, deliver, train and project manage Enhancing efficiency with proven technology: Diagnostic, monitoring, tuning and control systems for combustion, cleaning and cooling equipment Supplying components for system reliability: High-quality standard or custom-engineered pressure and non-pressure parts Maintaining/improving plant operation: Projects for extending the life of power, process and environmental equipment


B A B C O C K & W I L C O X E N T E R P R I S E S , I N C .© 2021 Babcock & Wilcox Enterprises, Inc. All rights reserved. 41