Exhibit 99.1 |
News Release |
Babcock & Wilcox Enterprises Reports Third Quarter 2020 Results
- Revenues of $132.5 million
- Net income of $34.7 million, a $91.7 million improvement
- Adjusted EBITDA of $25.6 million with adjusted EBITDA margin of 19.3%
- Diluted EPS improved to $0.69, compared to $(1.39)
- Quarterly bookings increased 106% compared to third quarter 2019, and increased 111% sequentially
- The above results include the recognition of a $26.0 million loss recovery settlement related to certain historical EPC loss contracts
(AKRON, Ohio – November 12, 2020) – Babcock & Wilcox Enterprises, Inc. ("B&W" or the "Company") (NYSE: BW) reported financial results for the third quarter ended September 30, 2020.
Management Commentary
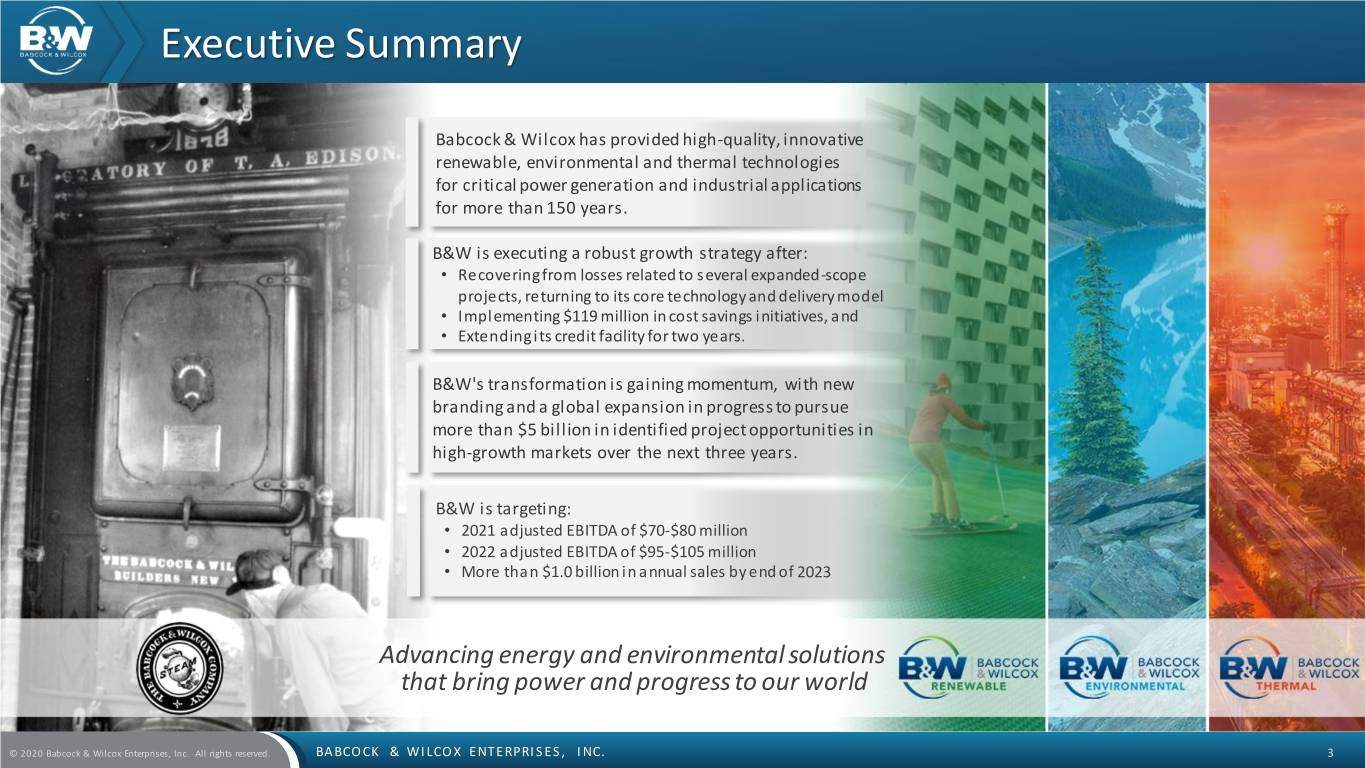
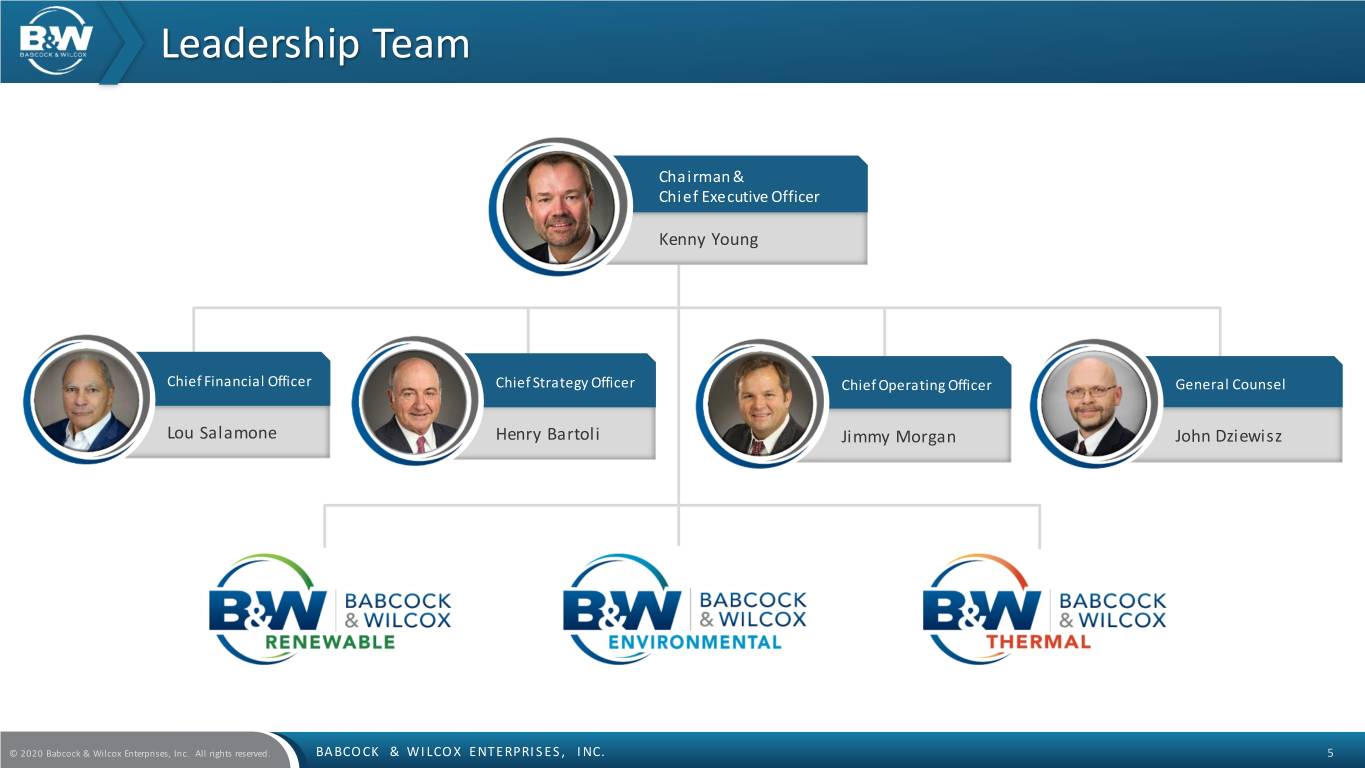
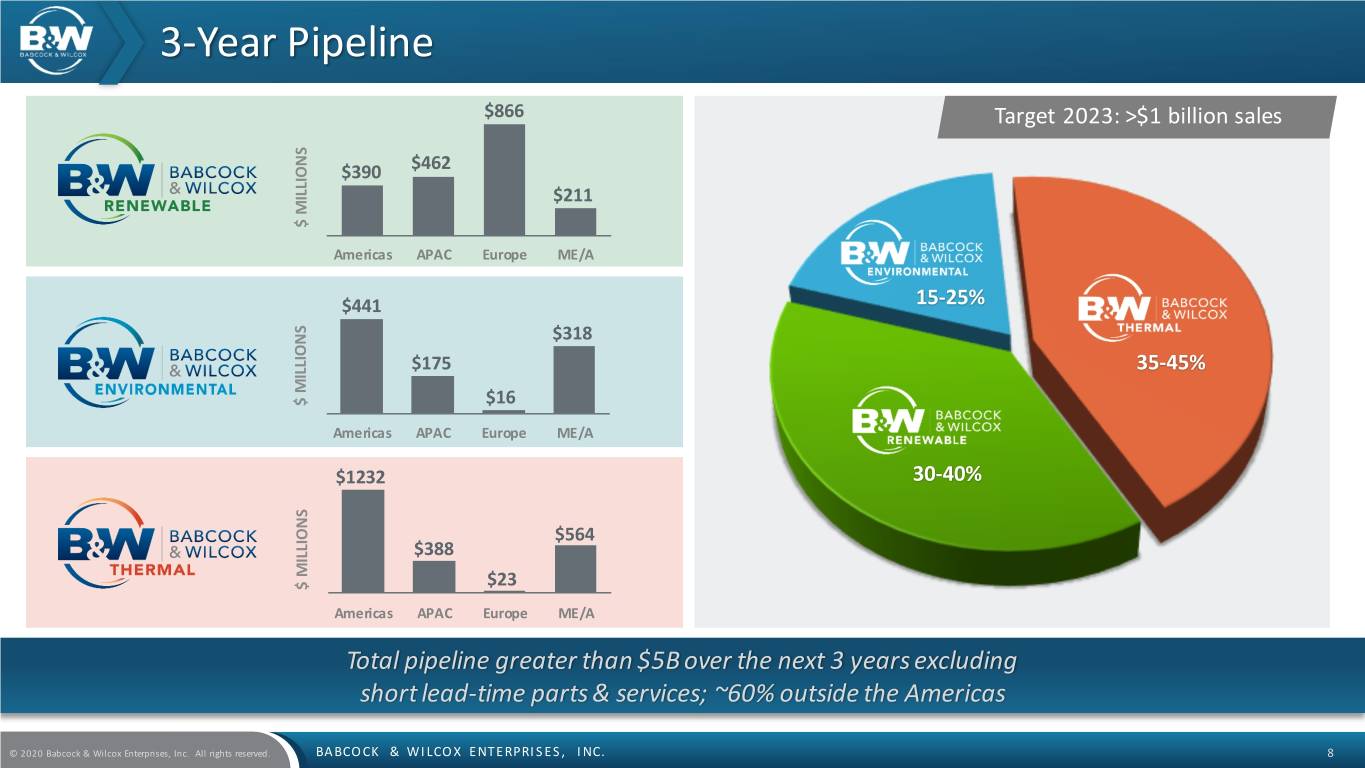
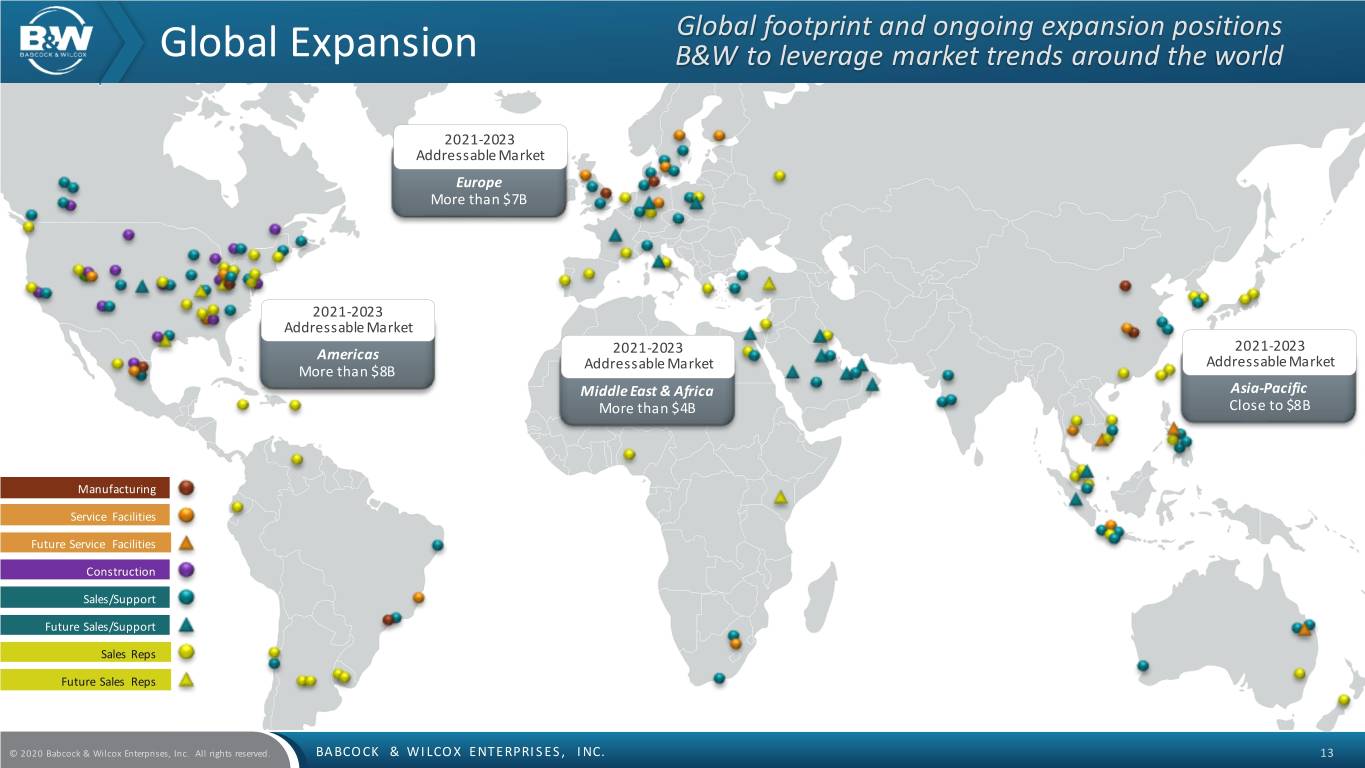
“Our third quarter results improved significantly, driven by a loss recovery from our historical European EPC loss projects, and reflecting the ongoing execution of our turnaround strategy," said Kenneth Young, B&W's CEO. "Despite the challenges presented by COVID-19 and its impact on revenues across our segments, adjusted EBITDA was roughly break-even for the quarter before the benefit of the loss recovery, demonstrating the benefits of our cost-savings initiatives. Our rebranding initiative announced in August, coupled with our reorganization and international expansion, is accelerating our growth and drove our bookings of $177 million in the quarter, an improvement of 106% compared to the third quarter of 2019. Our pipeline of over $5 billion of identified project opportunities that we expect to bid through 2023 continues to strengthen, and the expansion of our international presence is progressing as planned."
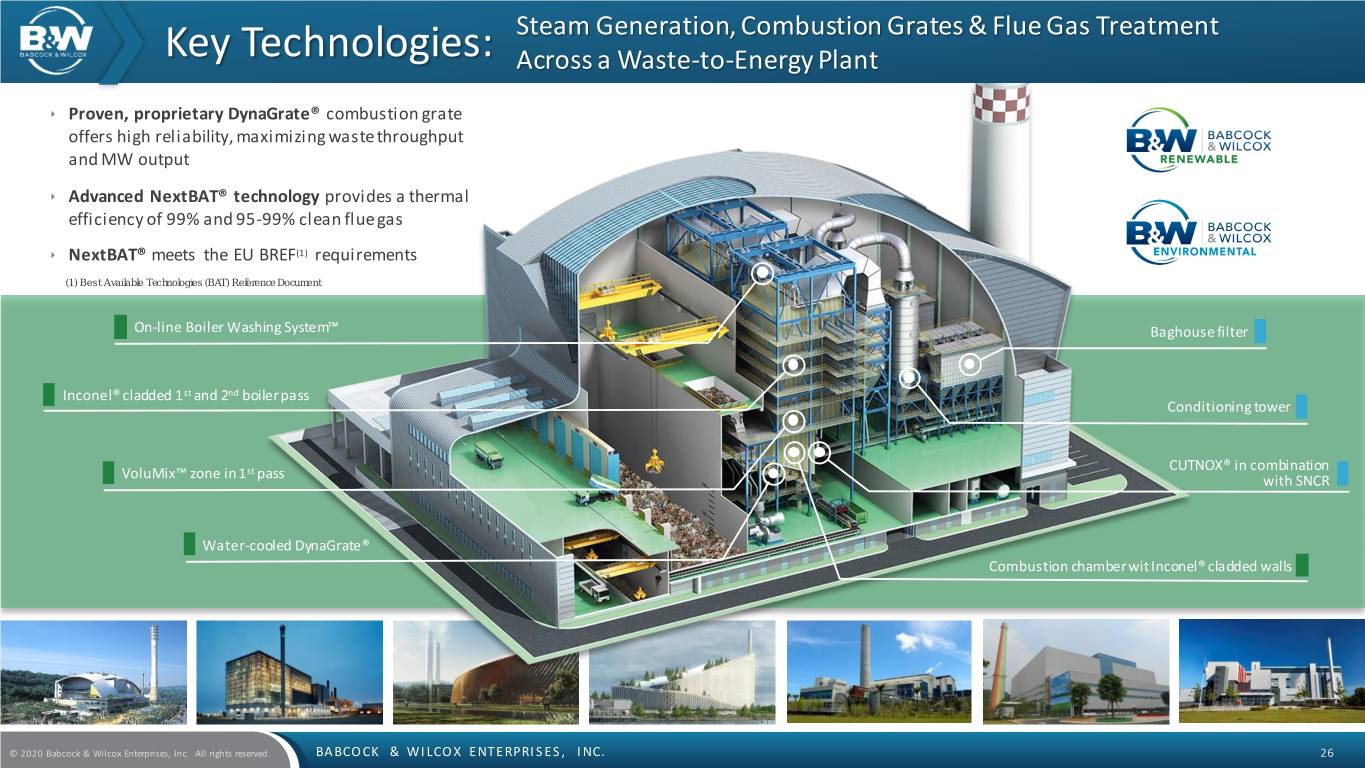
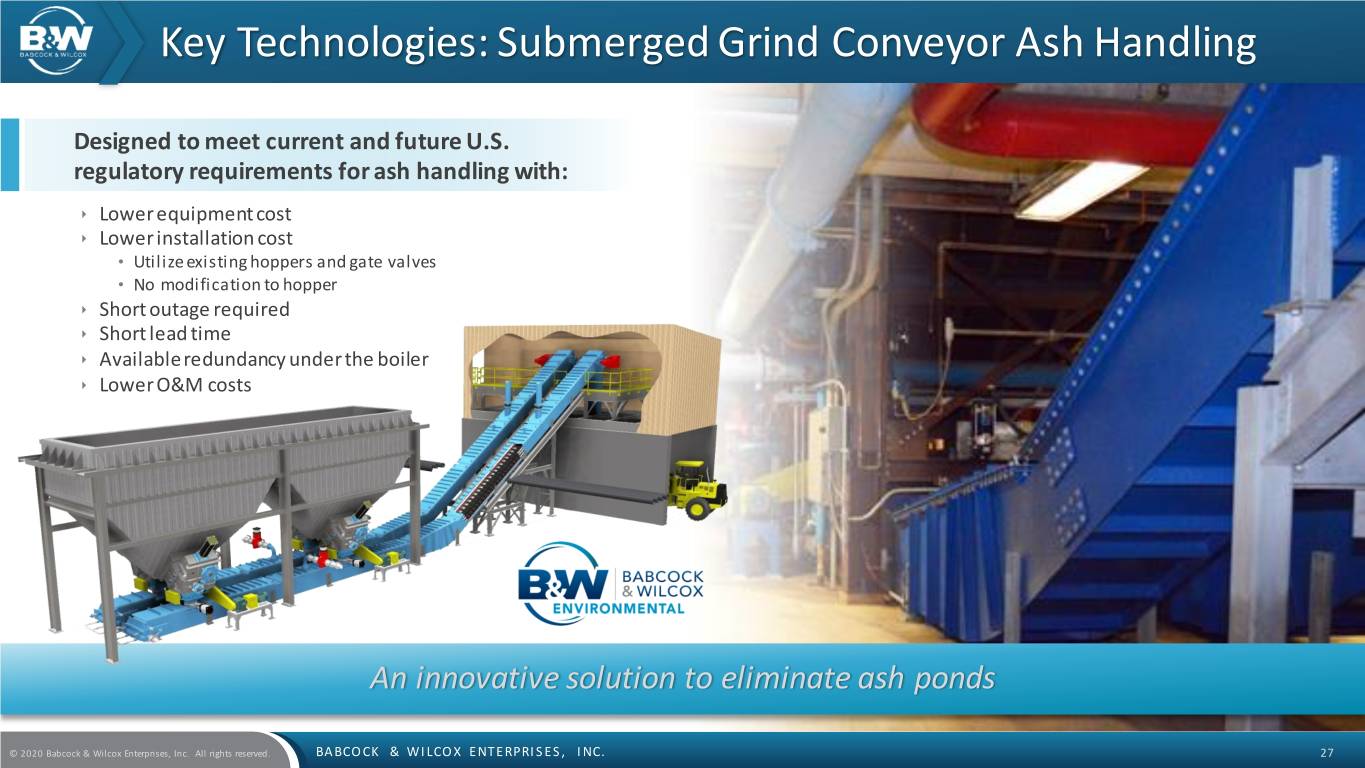
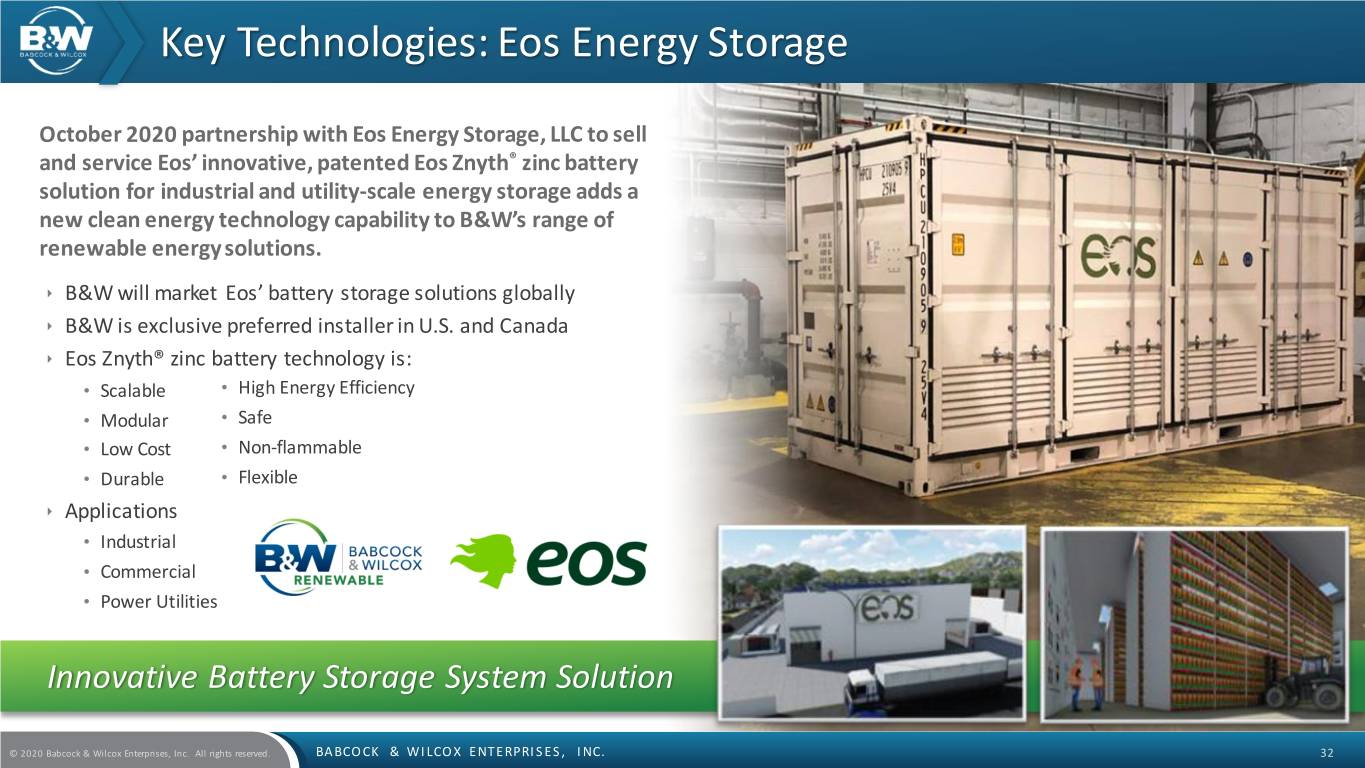
“While COVID-19 impacted all of our segments in the third quarter, a number of projects that were previously delayed or deferred due to the pandemic are restarting," Young added. "We continue meeting customer and market needs by providing technology solutions to help achieve a clean, sustainable energy and industrial infrastructure. This includes our broad suite of advanced renewable, environmental and thermal technologies, such as high-performance waste-to-energy systems, innovative submerged grind conveyor systems, and flexible natural gas-fired package boilers, as well as strategic partnerships to accelerate advanced energy storage solutions."
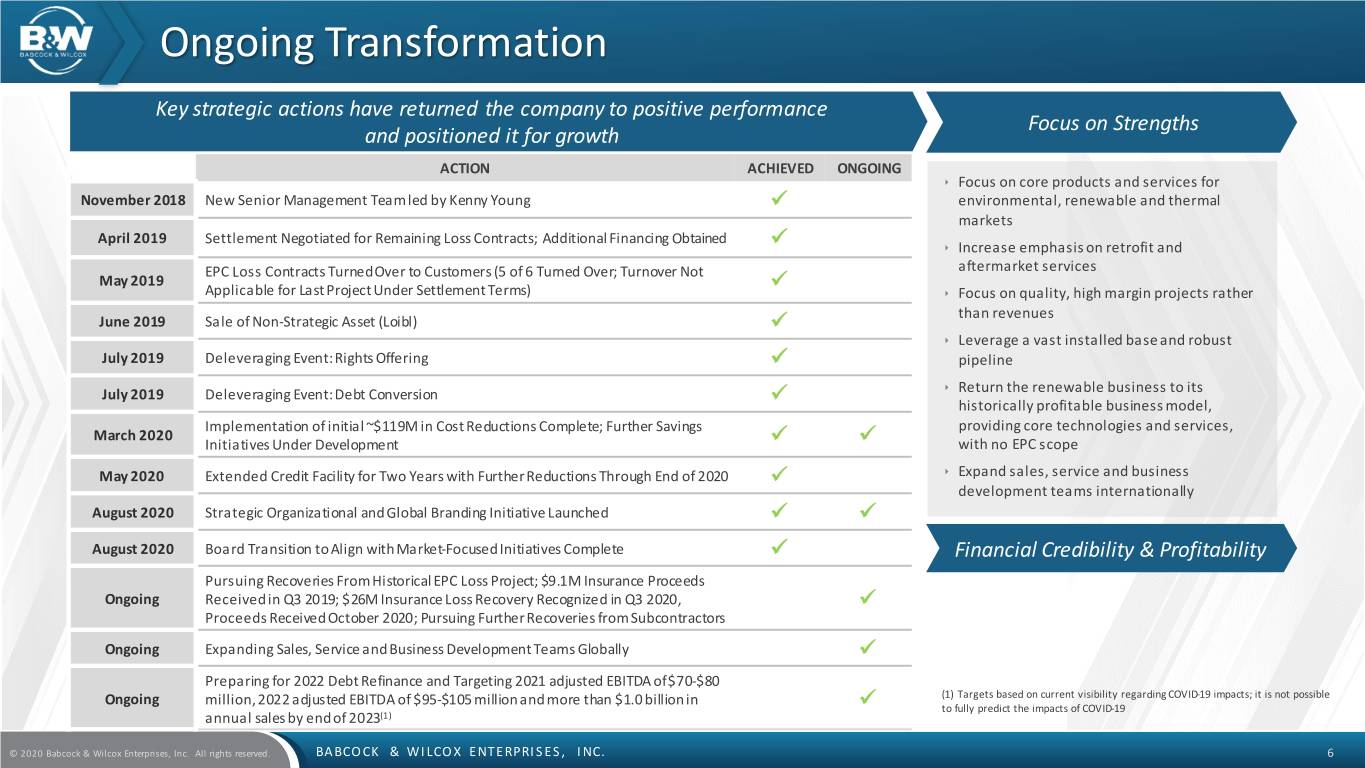
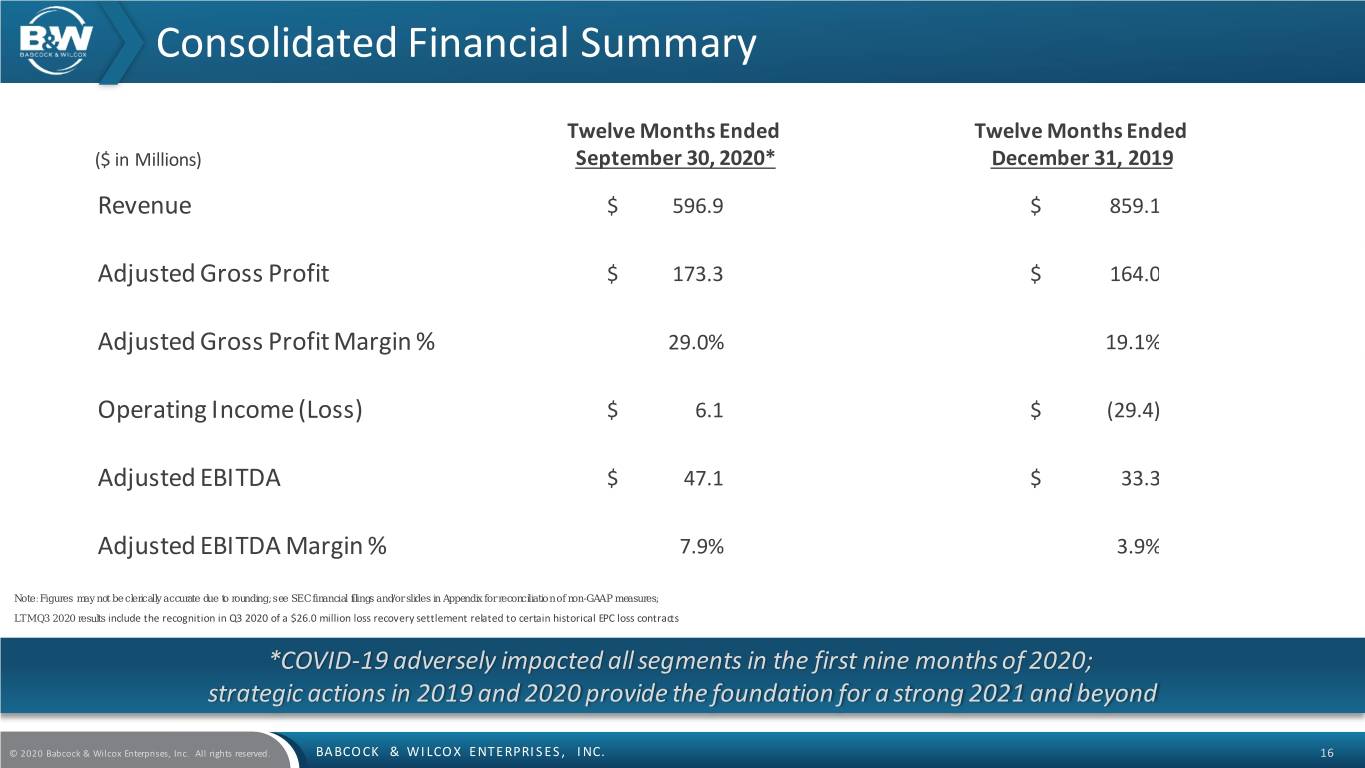
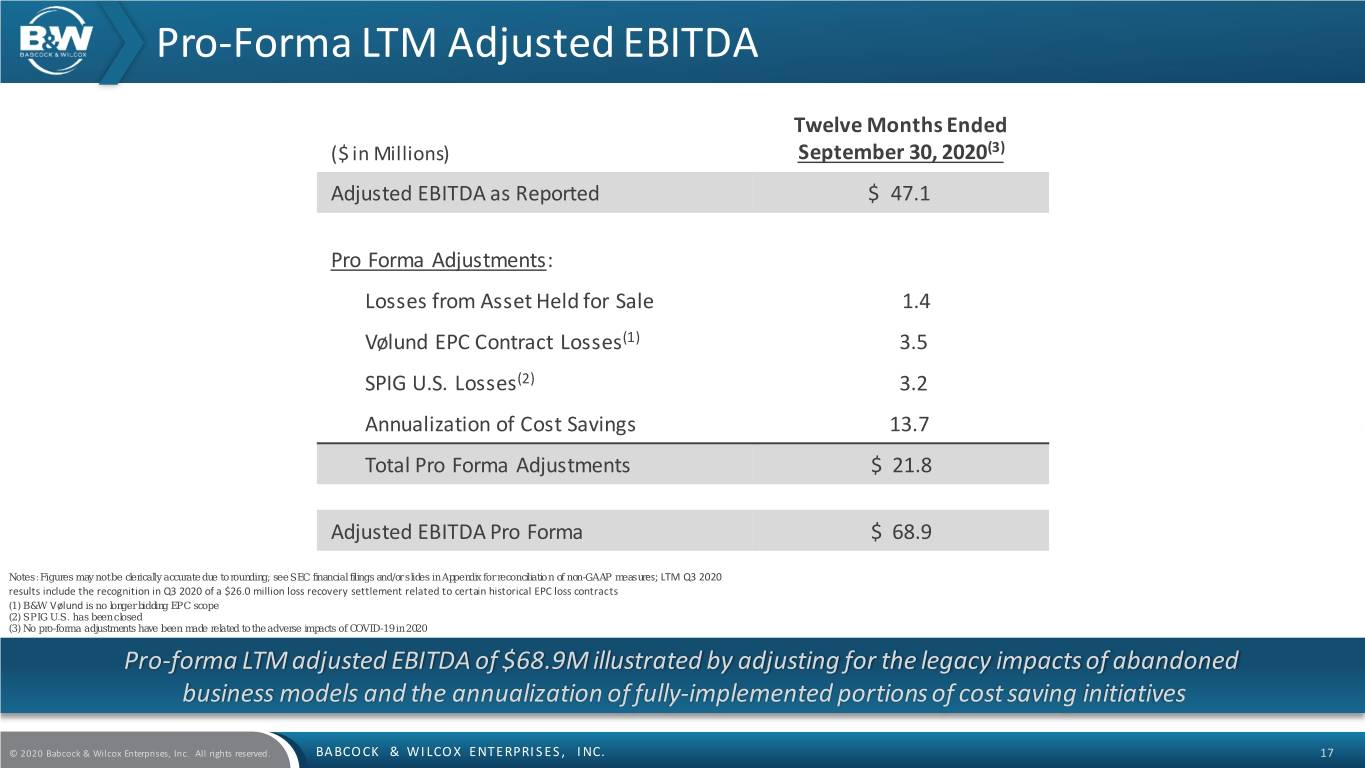
Louis Salamone, B&W's CFO, commented: "As an essential business, we continue to focus on supporting our customers and driving our growth strategy while continuing to manage our costs and cash flow through the global pandemic. While we can't fully predict the evolving impacts of COVID-19, based on the current strength of our bookings, pipeline and information from our customers, as well as current assumptions regarding the impacts of COVID-19 on our business, we continue to target between $70 million and $80 million of adjusted EBITDA in 2021."

New Segment Financial Reporting
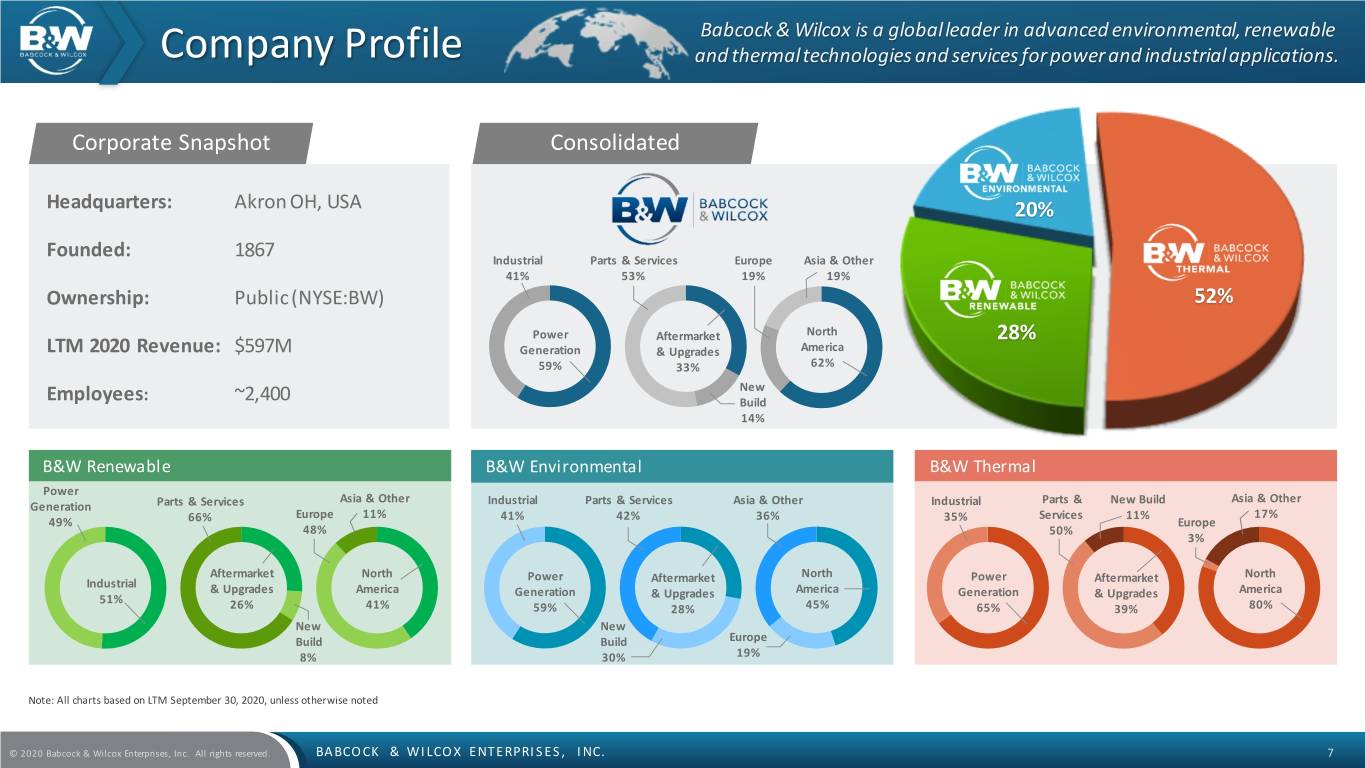
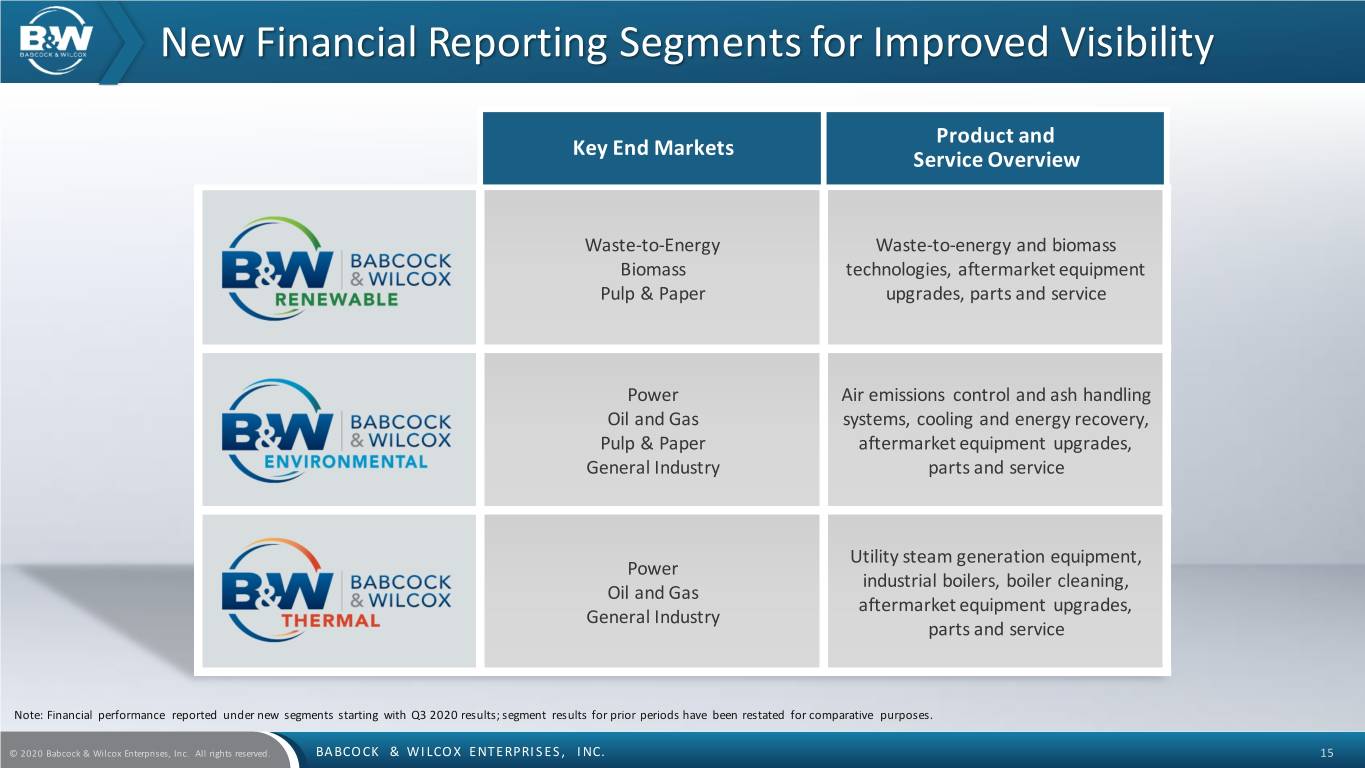
Beginning with the third quarter of 2020, B&W is reporting its financial results under three new reportable segments aligned with the Company's strategic, market-focused organizational and rebranding initiative announced this past August to accelerate growth and provide stakeholders with improved visibility into its renewable and environmental growth platforms. Segment results for prior periods have been restated for comparative purposes.
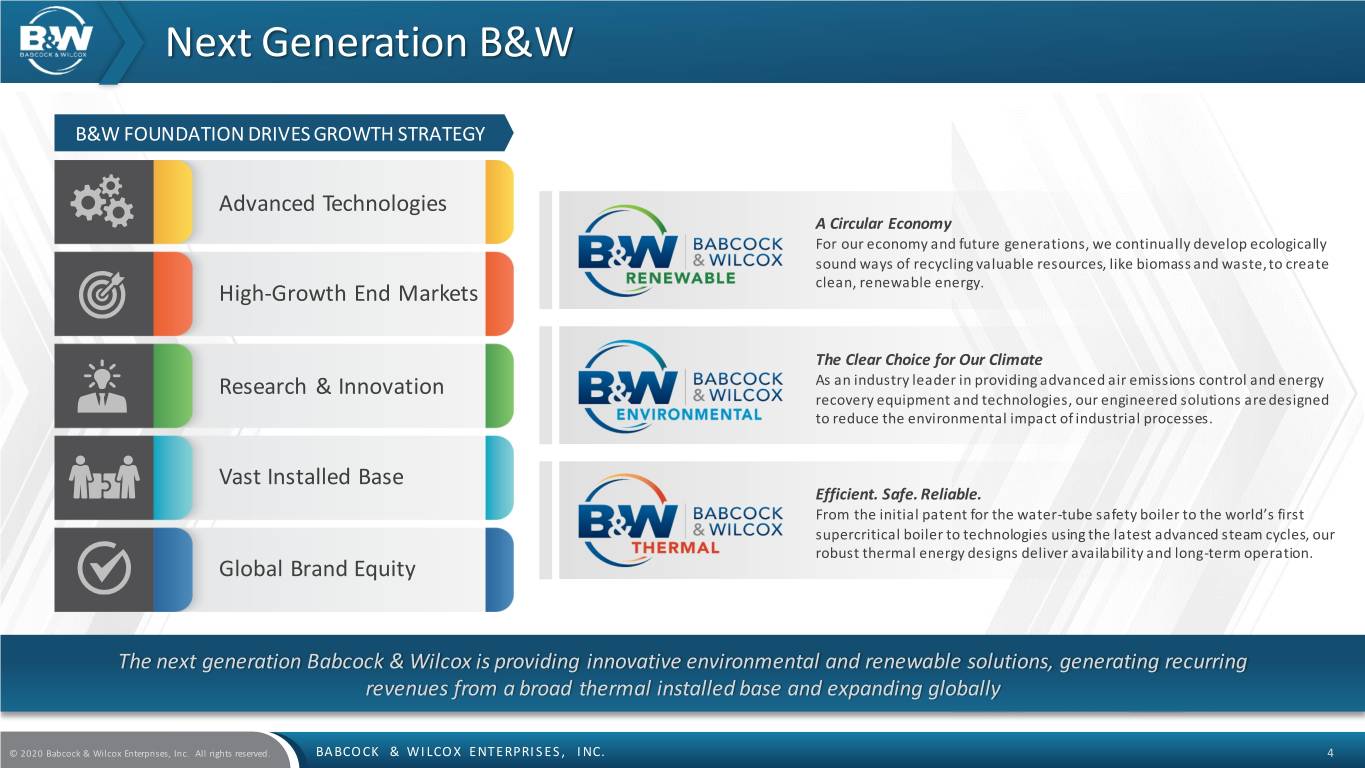
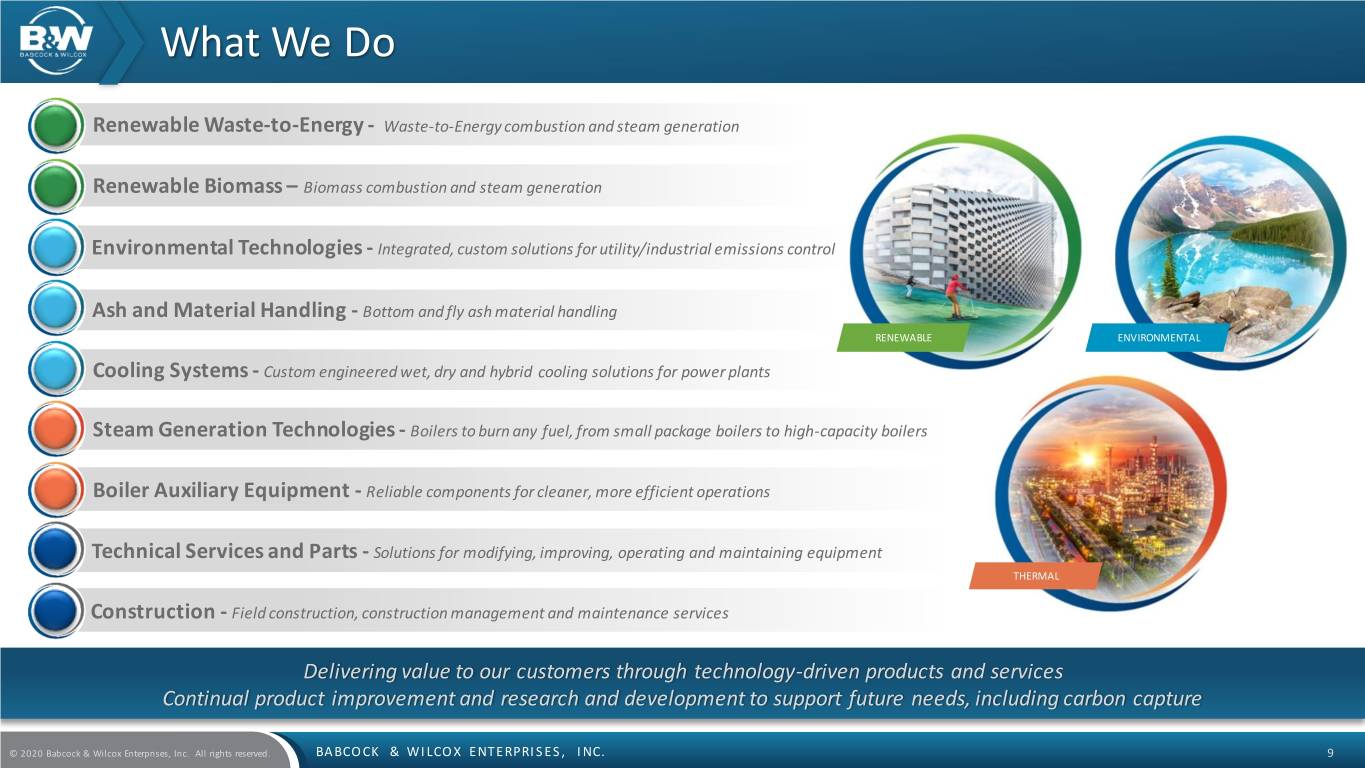
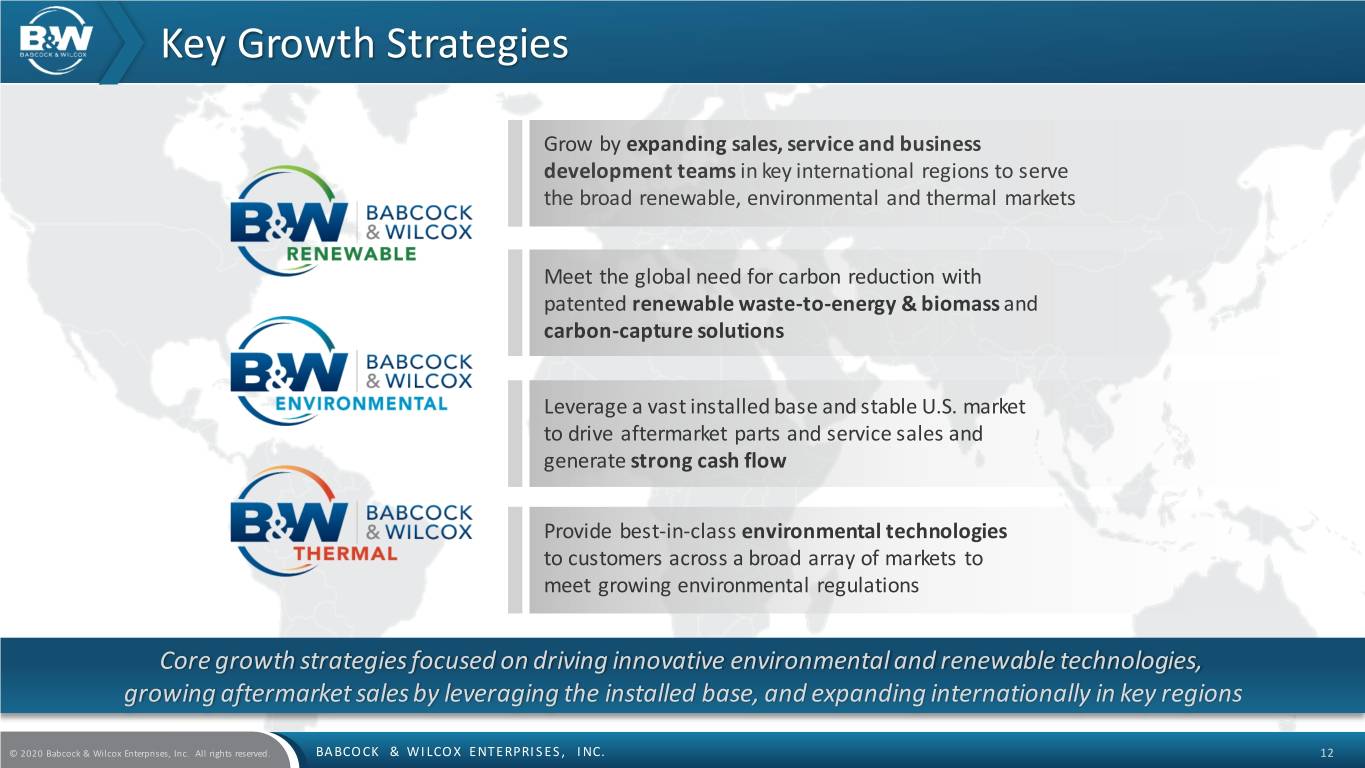
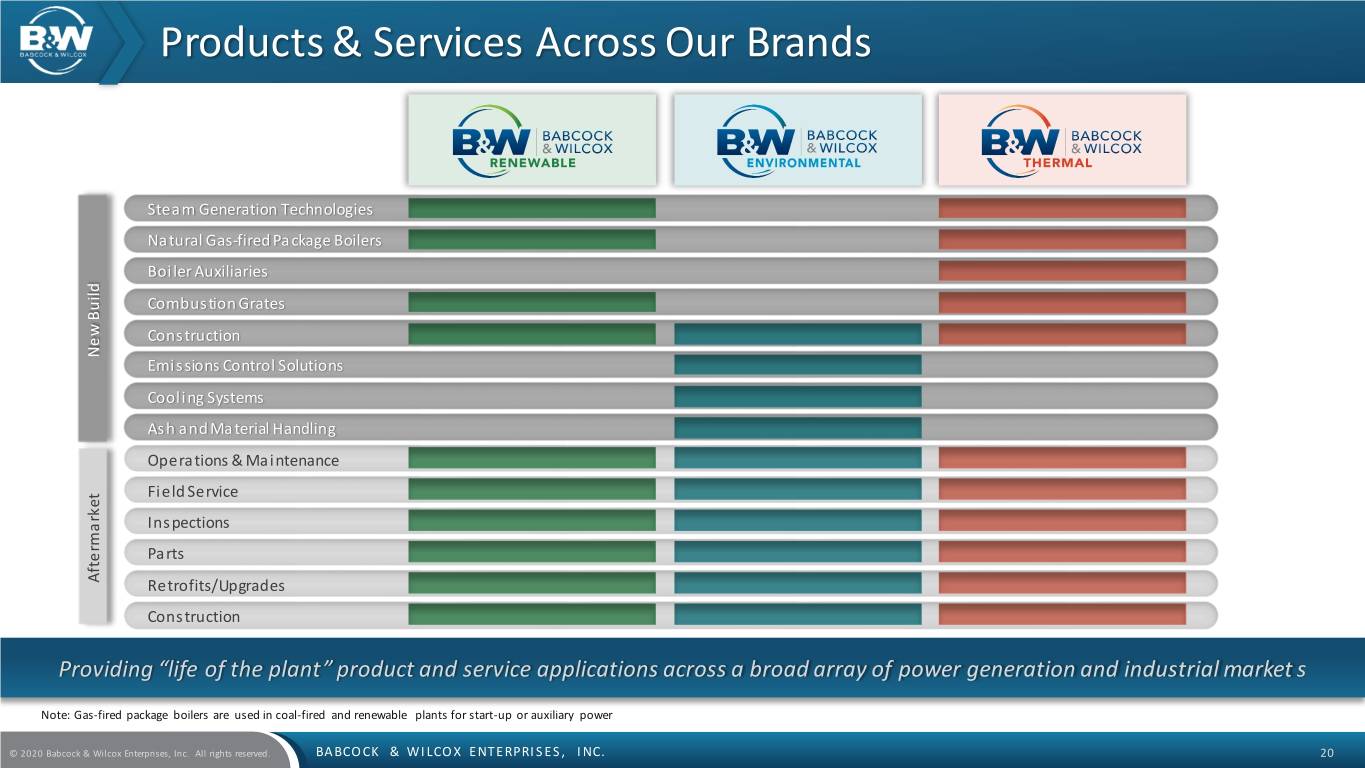
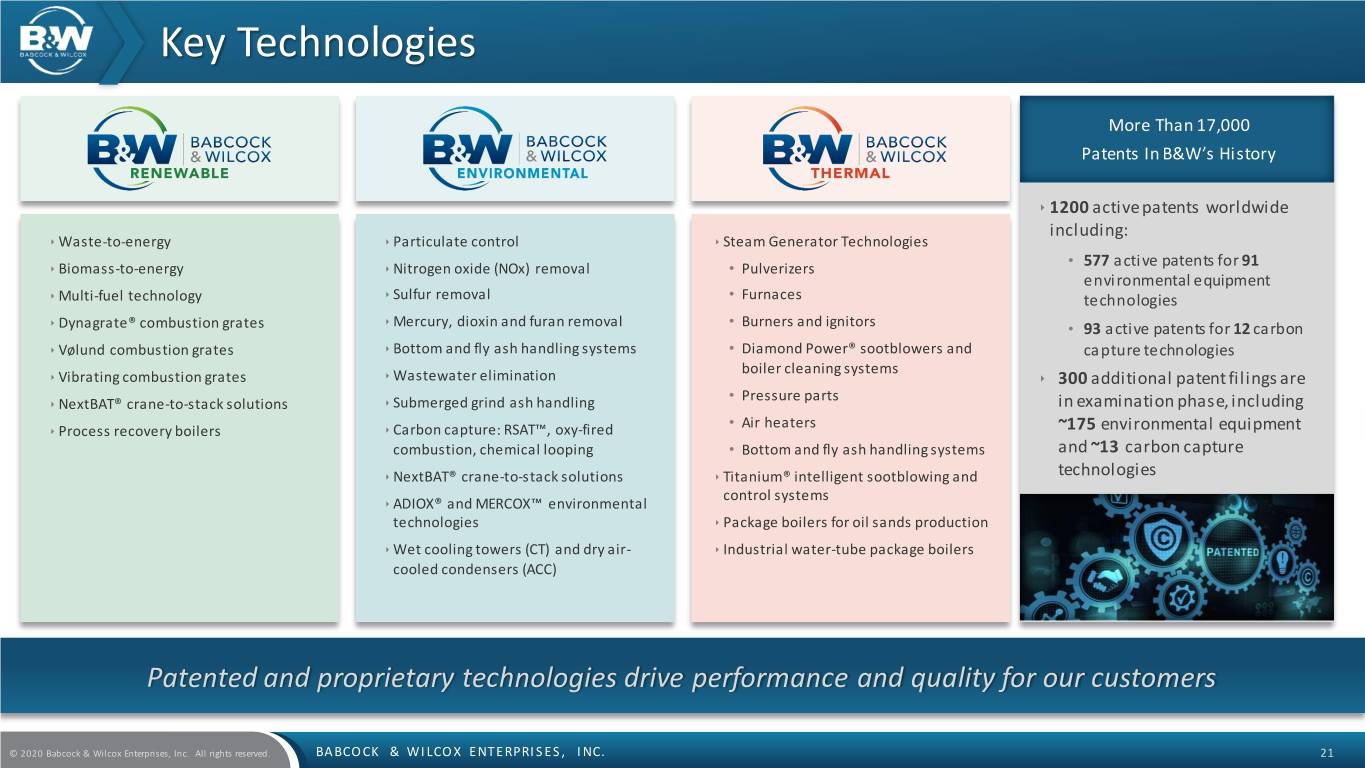
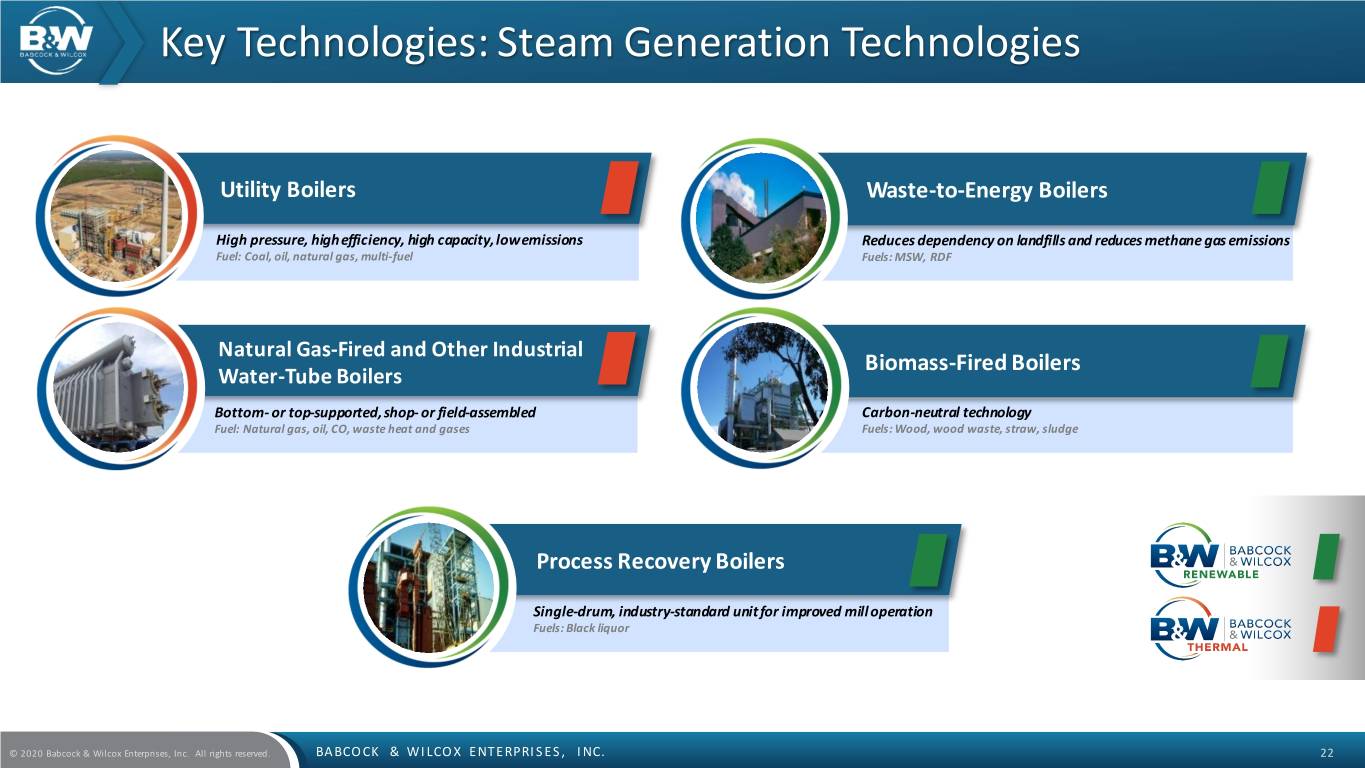
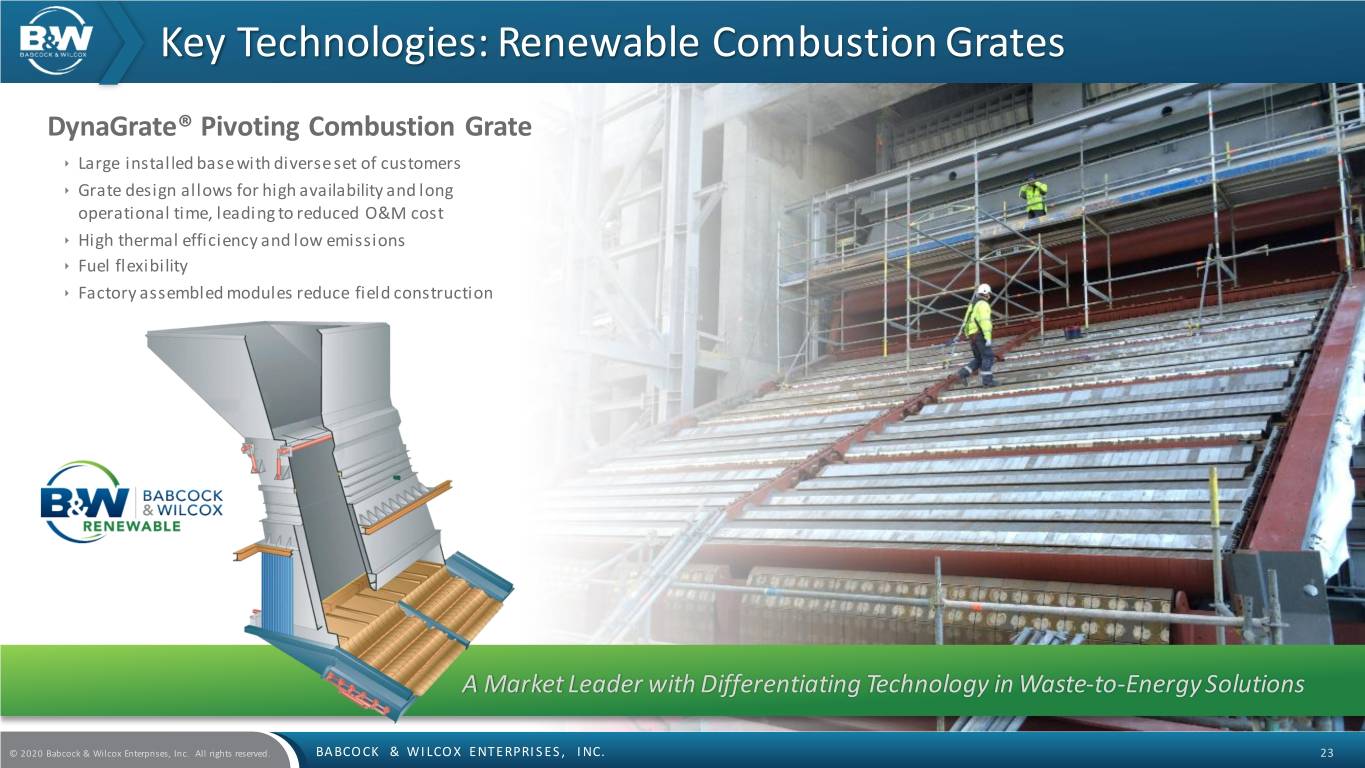
• | B&W Renewable segment: Cost-effective technologies for efficient and environmentally sustainable power and heat generation, including waste-to-energy, biomass energy and black liquor systems for the pulp and paper industry. The segment's leading technologies support a circular economy, diverting waste from landfills to use for power generation and replacing fossil fuels, while recovering metals and reducing emissions. |
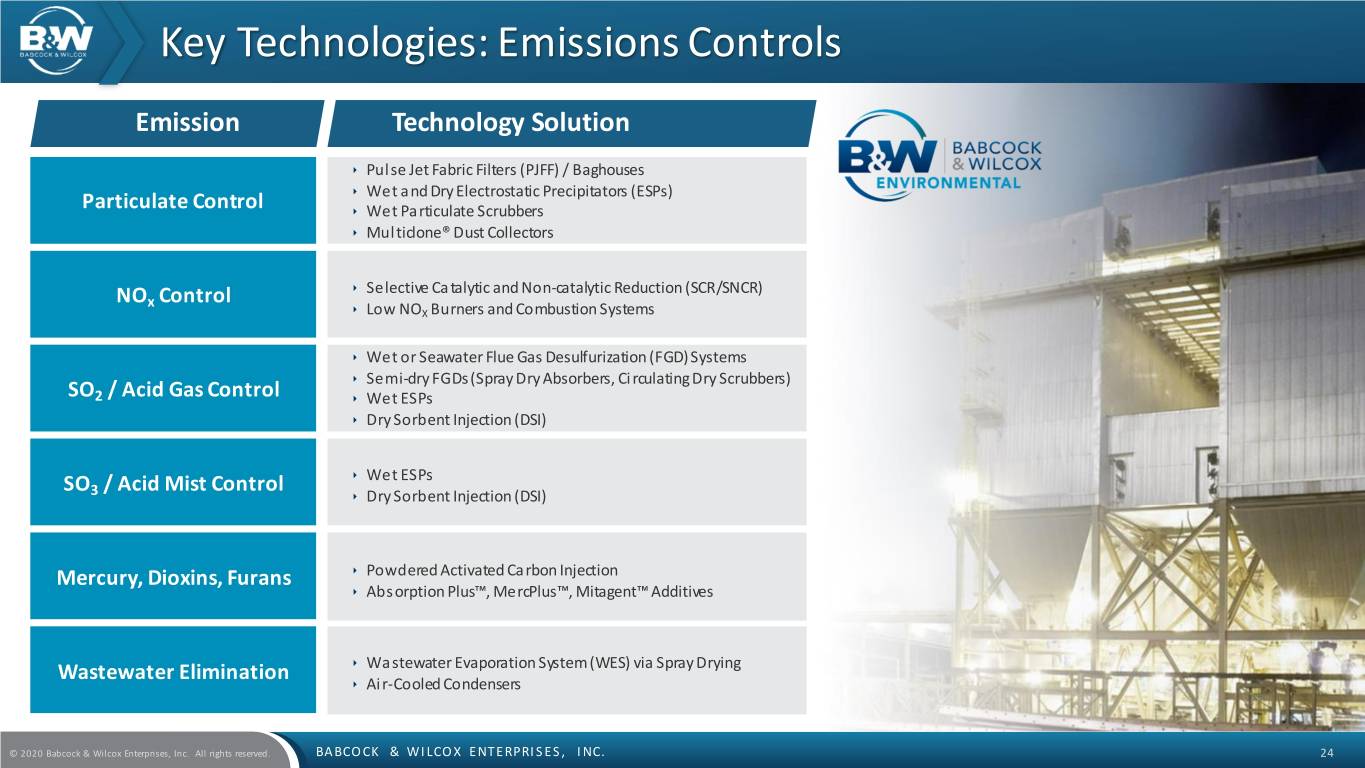
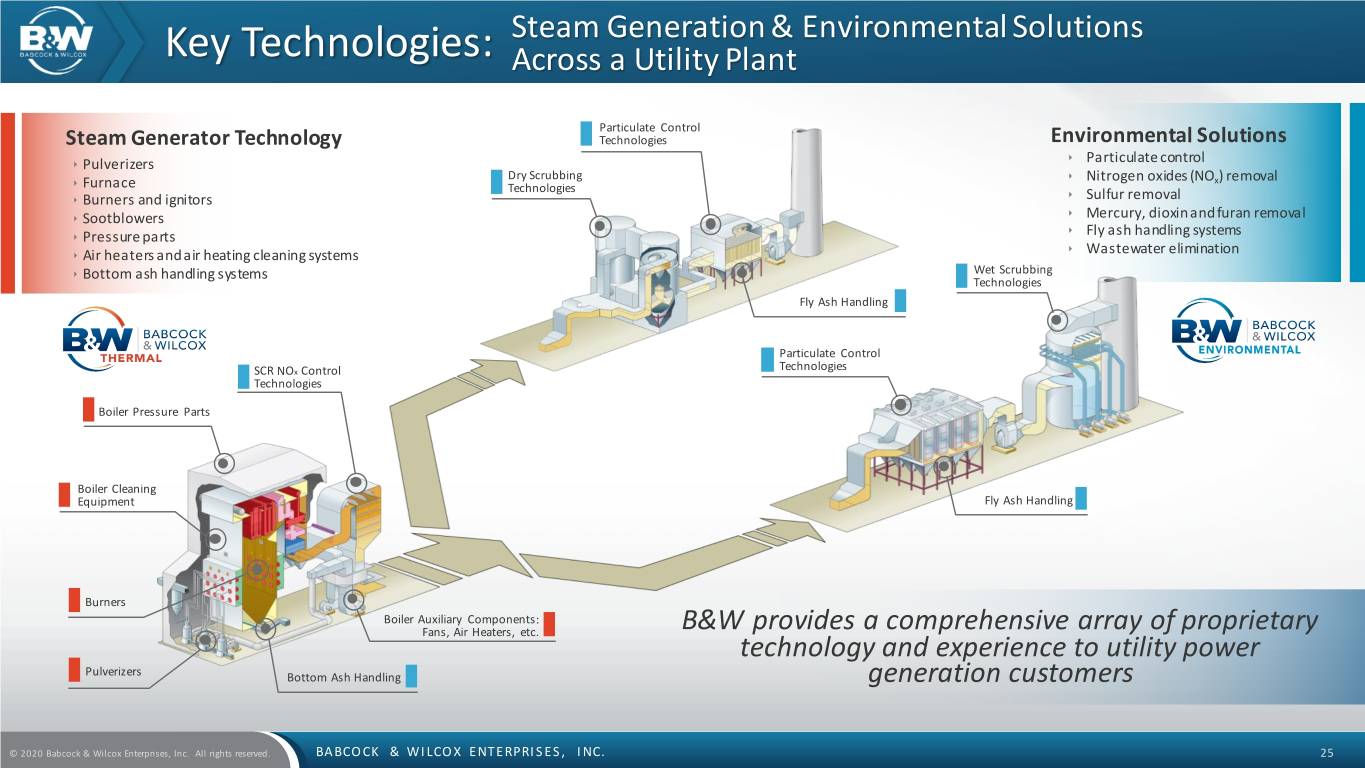
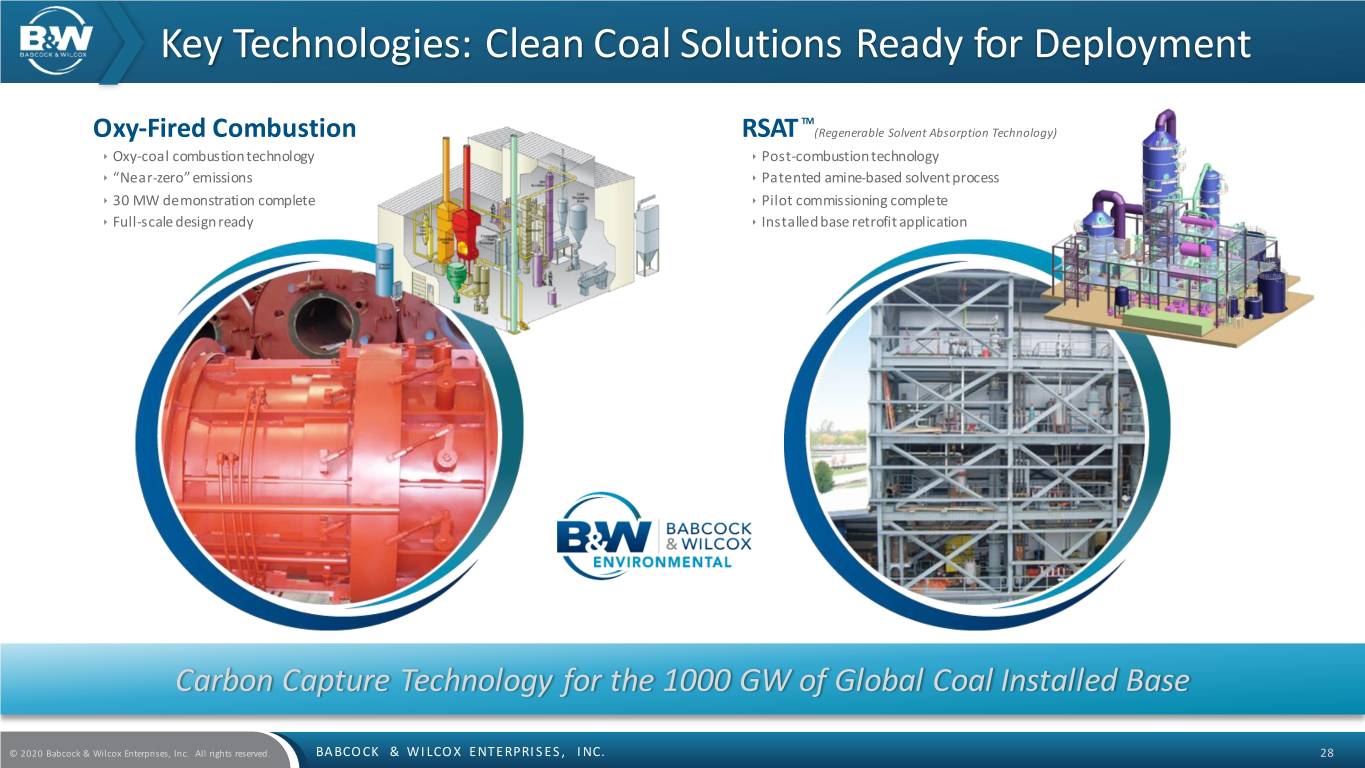
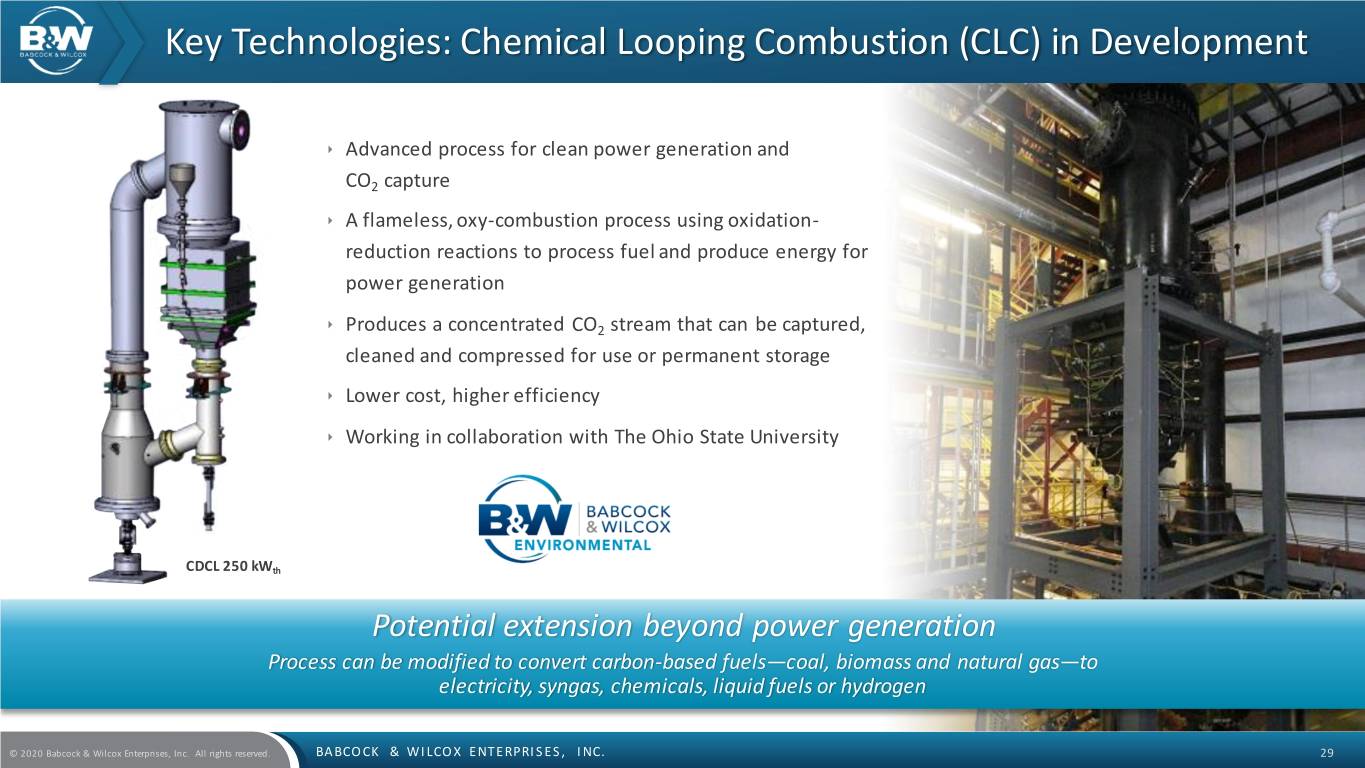
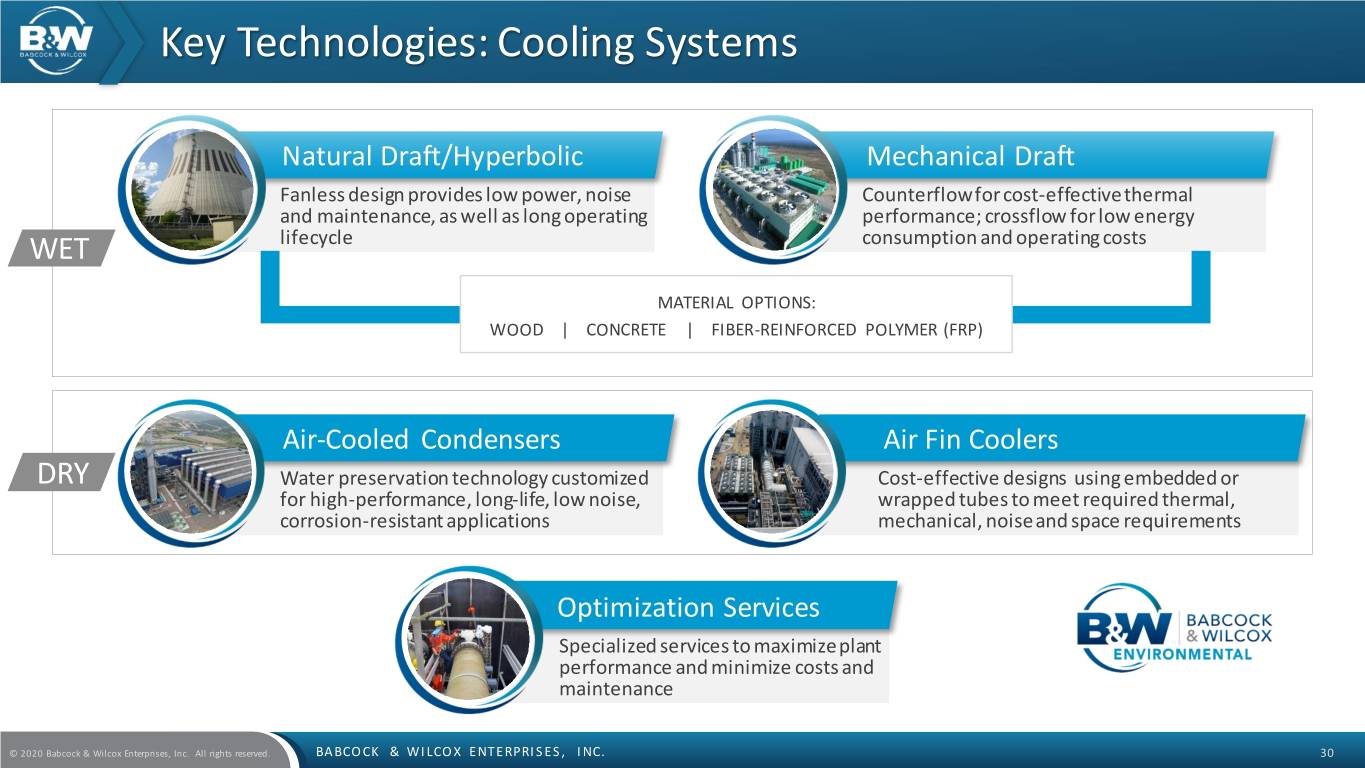
• | B&W Environmental segment: A full suite of best-in-class emissions control and environmental technology solutions for utility and industrial steam generation applications around the world. The segment's broad experience includes systems for cooling, ash handling, particulate control, nitrogen oxides and sulfur dioxides removal, chemical looping for carbon control, and mercury control. |
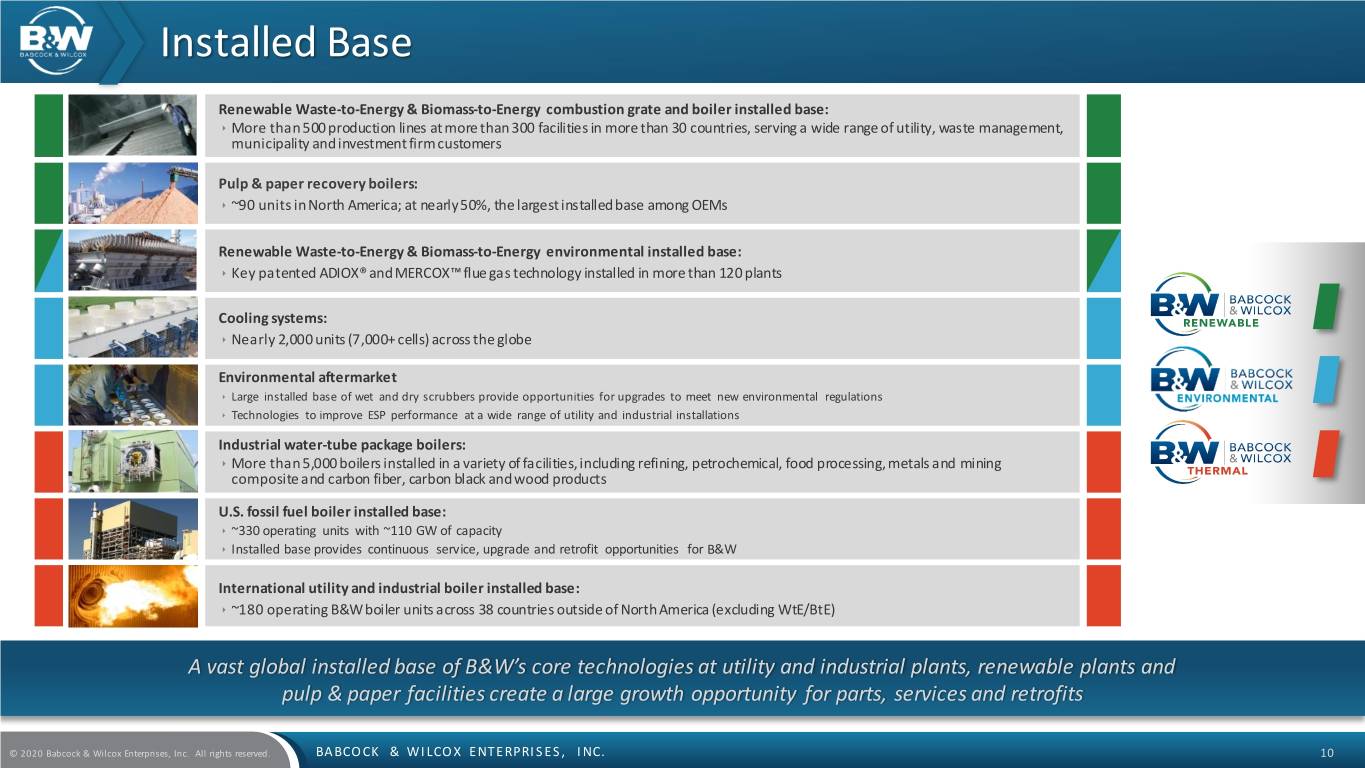
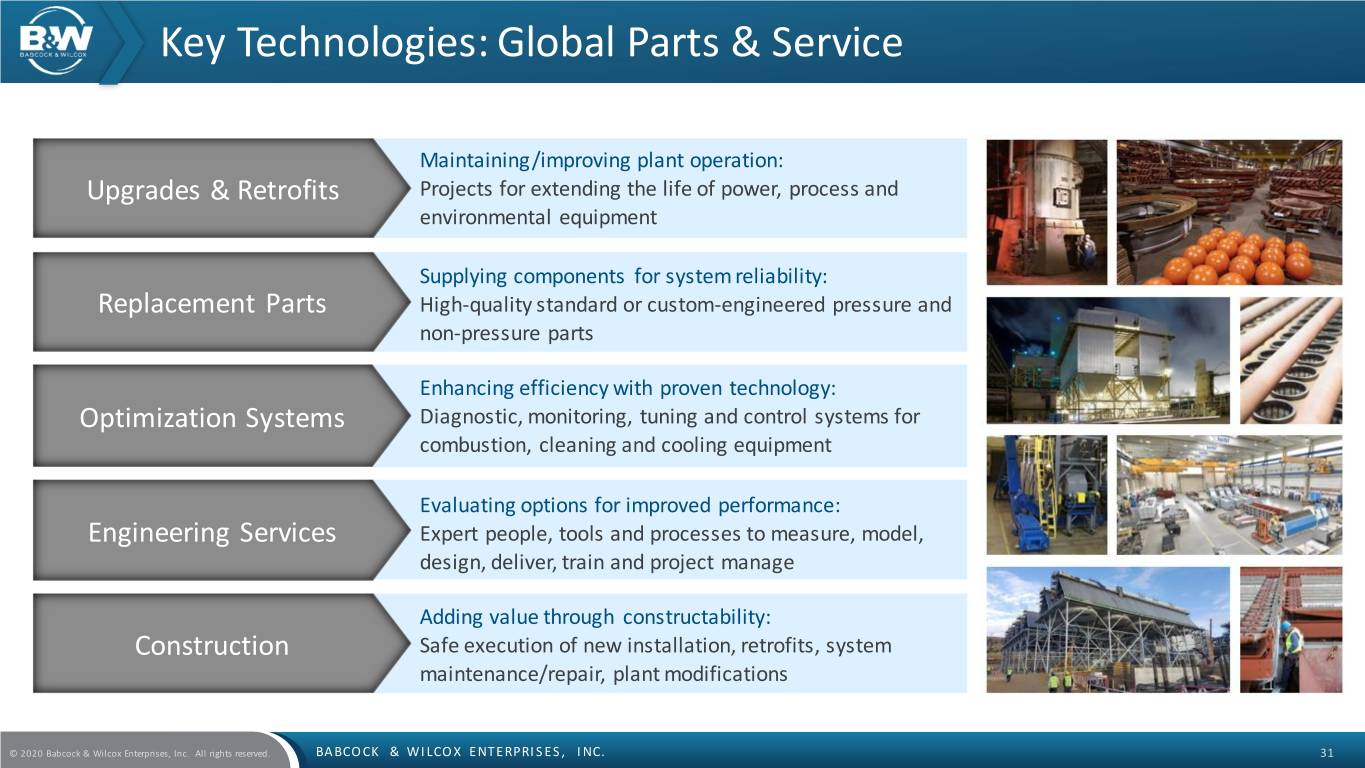
• | B&W Thermal segment: Steam generation equipment, aftermarket parts, construction, maintenance and field services for plants in the power generation, oil and gas, and industrial sectors. The segment has an extensive global base of installed equipment for utilities and general industrial applications including refining, petrochemical, food processing, metals and others. |
Results of Operations
Consolidated revenues in the third quarter of 2020 were $132.5 million compared to $198.6 million in the third quarter of 2019. The Company's focus on core technologies and profitability, combined with the adverse impacts of COVID-19, were the primary drivers of the revenue decline.
GAAP operating income in the third quarter of 2020 was $14.1 million, including the impact of a non-recurring loss recovery of $26.0 million recognized in the B&W Renewable segment under an October 10, 2020 settlement agreement with an insurer in connection with five of the six historical European EPC loss contracts, compared to an operating loss of $3.2 million in the third quarter of 2019. The increase was partially offset by lower volume in each of the segments and customer delays as a result of COVID-19, as well as restructuring and settlement costs and advisory fees of $6.2 million. GAAP net income was $34.7 million, a $91.7 million improvement compared to third quarter 2019, primarily driven by the non-recurring loss recovery and favorable foreign exchange effects, partially offset by lower interest expense. Adjusted EBITDA improved to $25.6 million compared to $10.1 million in the third quarter of 2019.
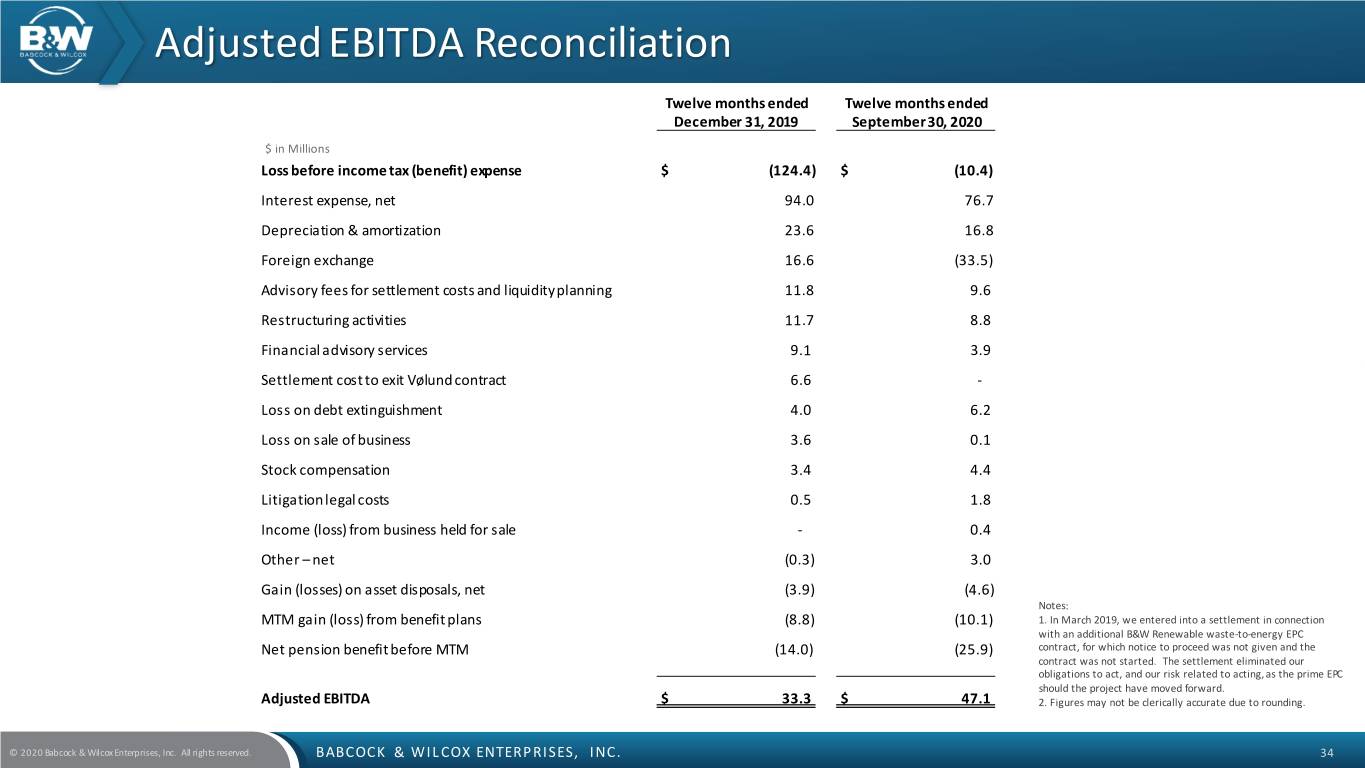
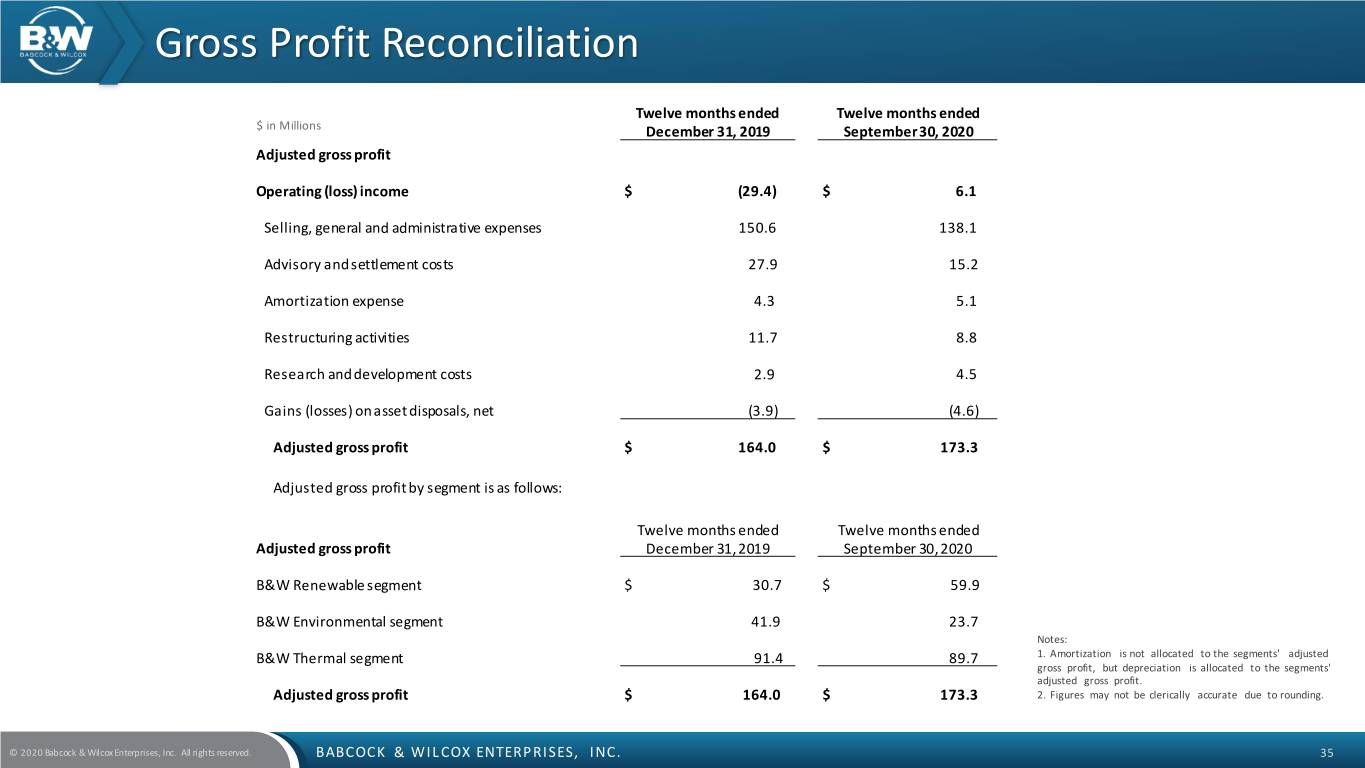
All amounts referred to in this release are on a continuing operations basis, unless otherwise noted. Reconciliations of operating income, the most directly comparable GAAP measure, to adjusted EBITDA, as well as to adjusted gross profit for the Company's segments, are provided in the exhibits to this release.
Babcock & Wilcox Renewable segment revenues were $39.1 million in the third quarter of 2020 compared to $51.3 million in the third quarter of 2019 due to new anticipated revenues being deferred due to COVID-19, as well as the advanced completion of activities on the historical EPC loss projects compared to the third quarter of 2019. Adjusted EBITDA in the third quarter of 2020 was $23.6 million compared to $(0.6) million in last year's quarter, primarily due to the aforementioned non-recurring loss
recovery of $26.0 million, partially offset by lower volume. The segment's adjusted gross profit was $32.1 million in the third quarter of 2020 compared to $6.6 million reported in the third quarter of 2019, primarily driven by the loss recovery, partially offset by lower volume.
Babcock & Wilcox Environmental segment revenues were $25.3 million in the third quarter of 2020 compared to $45.0 million in the third quarter of 2019. The decrease was primarily due to the completion of large construction projects in the prior year and the postponement of new projects by customers as a result of COVID-19. Adjusted EBITDA was $1.1 million compared to $1.8 million in the same period last year, driven primarily by the impact of COVID-19 and lower volume. Adjusted gross profit declined to $5.9 million in the third quarter of 2020, compared to $9.0 million in the prior-year period, primarily due to the decrease in revenue partially offset by favorable product mix. At September 30, 2020, the segment had two remaining significant loss contracts, previously reported as part of B&W SPIG's U.S. entity. The first was approximately 100% complete at the end of the third quarter of 2020 with only performance testing remaining, which is expected to be completed in the fourth quarter of 2020. The second was approximately 97% complete at the end of the third quarter of 2020 and is expected to be completed in the fourth quarter of 2020.
Babcock & Wilcox Thermal segment revenues were $70.0 million for the third quarter of 2020, compared to $108.2 million in the prior-year period. The decrease is attributable to the adverse impacts of COVID-19 resulting in customer delays and lower parts, construction, package boilers and international service orders. Adjusted EBITDA in the quarter declined to $7.3 million compared to $12.9 million in the third quarter last year, primarily due to the decrease in revenue volume. This was partially offset by the results of costs savings and restructuring initiatives. Adjusted EBITDA margin was 10.4% in the quarter as compared to 11.9% in the same period last year. Adjusted gross profit in the third quarter of 2020 was $20.6 million compared to $25.6 million in the prior-year period, consistent with the decrease in Adjusted EBITDA. Adjusted gross profit margin was 29.5% compared to 23.7% in the same period last year, primarily due to favorable product mix and the benefits of costs savings and restructuring initiatives.
Financing, Liquidity and Balance Sheet
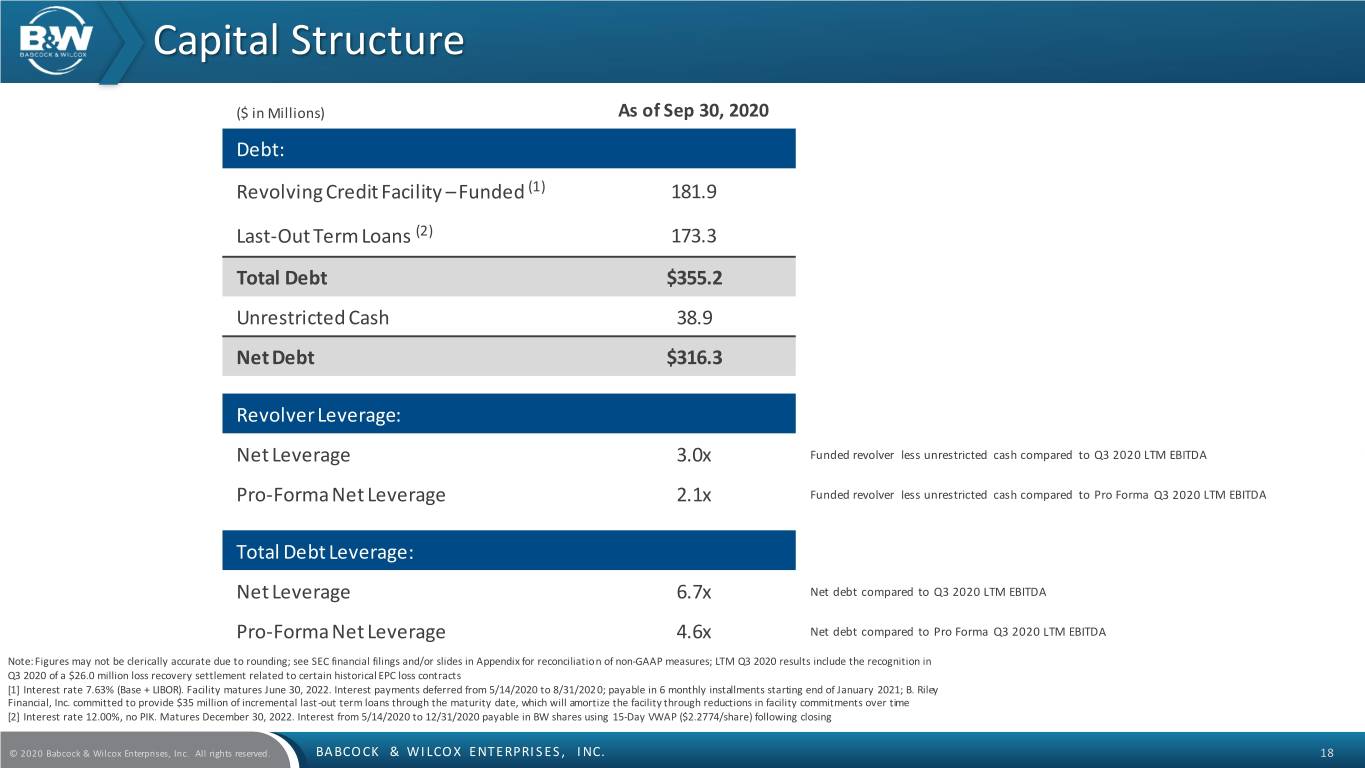
At September 30, 2020, the Company had cash and cash equivalents of $38.9 million and borrowing availability of $23.1 million.
On October 23, 2020, the Company received $26.0 million from an insurer through a previously disclosed loss recovery settlement. As required by the Company’s U.S. Revolving Credit Facility, 50% of the net proceeds, or approximately $8 million, of the settlement received by the Company was applied as a permanent reduction of the U.S. Revolving Credit Facility.
In addition, as previously disclosed, on October 30, 2020, the Company entered into an amendment of its Credit Agreement to provide, among other matters, that with respect to any prepayment event, the commitment reduction amount shall be only an amount equal to 50% of the net cash proceeds of such prepayment event, and also established, as required by the terms of the Credit Agreement, new financial covenants of interest coverage ratios and senior leverage ratios.
The Company is continuing to pursue cost recoveries from responsible subcontractors for the B&W Renewable segment's European EPC loss contracts. The Company also continues to evaluate additional opportunities for cost savings and potential dispositions as appropriate.
Earnings Call Information
B&W plans to host a conference call and webcast on Thursday, November 12, 2020 at 8:30 a.m. ET. to discuss the Company’s third quarter 2020 results. The listen-only audio of the conference call will be broadcast live via the Internet on B&W’s Investor Relations site. The dial-in number for participants in the U.S. is (833) 227-5843; the dial-in number for participants outside the U.S. is (647) 689-4070. The conference ID for all participants is 4193759. A replay of this conference call will remain accessible in the investor relations section of the Company's website for a limited time.
COVID-19 Impact
The global COVID-19 pandemic has disrupted business operations, trade, commerce, financial and credit markets, and daily life throughout the world. The Company's business has been, and continues to be, adversely impacted by the measures taken and restrictions imposed in the locations in which it operates by local governments and others to control the spread of this virus. These measures and restrictions have varied widely and have been subject to significant changes from time to time depending on the changes in the severity of the virus in these locations. These restrictions, including travel restrictions and curtailment of other activity, negatively impact the Company's ability to conduct business. Although some of these restrictions have been lifted or scaled back, a recent resurgence of COVID-19 has resulted in the reimposition of certain restrictions and may lead to other restrictions being implemented in response to efforts to reduce the spread of the virus. These varying and changing events have caused many of the projects the Company anticipated to begin in 2020 to be delayed to later in 2020 and others to be delayed further into 2021 and 2022. Many customers and projects require B&W's employees to travel to customer and project worksites. Certain customers and significant projects are located in areas where travel restrictions have been imposed, certain customers have closed or reduced on-site activities, and timelines for completion of certain projects have, as noted above, been extended into next year and beyond. Additionally, out of concern for the Company's employees, even where restrictions permit employees to return to Company offices and worksites, the Company has advised those who are uncomfortable returning to worksites due to the pandemic that they are not required to do so for an indefinite period of time. The resulting uncertainty concerning, among other things, the spread and economic impact of the virus has also caused significant volatility and, at times, illiquidity in global equity and credit markets. As part of the Company’s recent response to the impact of the COVID-19 pandemic on its business, the Company has taken a number of cash conservation and cost reduction measures. At the time of this release, it is impossible to predict the overall impact the pandemic will have on the Company's business, liquidity, capital resources or financial results. More detail can be found in the Company's Form 10-Q for the third quarter of 2020.
Non-GAAP Financial Measures
The Company uses non-GAAP financial measures internally to evaluate its performance and in making financial and operational decisions. When viewed in conjunction with GAAP results and the accompanying reconciliation, the Company believes that its presentation of these measures provides investors with greater transparency and a greater understanding of factors affecting our financial condition and results of operations than GAAP measures alone.
This release presents adjusted gross profit for each business segment and adjusted EBITDA, which are non-GAAP financial measures. Adjusted EBITDA on a consolidated basis is defined as the sum of the adjusted EBITDA for each of the segments, further adjusted for corporate allocations and research and development costs. At a segment level, the adjusted EBITDA presented is consistent with the way the Company's chief operating decision maker reviews the results of operations and makes strategic
decisions about the business and is calculated as earnings before interest, tax, depreciation and amortization adjusted for items such as gains or losses on asset sales, mark to market ("MTM") pension adjustments, restructuring and spin costs, impairments, losses on debt extinguishment, costs related to financial consulting required under the U.S. Revolving Credit Facility and other costs that may not be directly controllable by segment management and are not allocated to the segment. The Company presented consolidated Adjusted EBITDA because it believes it is useful to investors to help facilitate comparisons of the ongoing, operating performance before corporate overhead and other expenses not attributable to the operating performance of the Company's revenue generating segments. This release also presents certain targets for our adjusted EBITDA in the future; these targets are not intended as guidance regarding how the Company believes the business will perform. The Company is unable to reconcile these targets to their GAAP counterparts without unreasonable effort and expense due to the aspirational nature of these targets.
This release also presents adjusted gross profit by segment. The Company believes that adjusted gross profit by segment is useful to investors to help facilitate comparisons of the ongoing, operating performance of the segments by excluding expenses related to, among other things, activities related to the spin-off, activities related to various restructuring activities the Company has undertaken, corporate overhead (such as SG&A expenses and research and development costs) and certain non-cash expenses such as intangible amortization and goodwill impairments that are not allocated by segment.
Forward-Looking Statements
B&W Enterprises cautions that this release contains forward-looking statements, including, without limitation, statements relating to the application of the proceeds of the term loans under the Agreement, and management expectations regarding future growth and our ability to achieve sustained value for our shareholders. These forward-looking statements are based on management’s current expectations and involve a number of risks and uncertainties, including, among other things, the impact of COVID-19 on us and the capital markets and global economic climate generally; our recognition of any asset impairments as a result of any decline in the value of our assets or our efforts to dispose of any assets in the future; our ability to obtain and maintain sufficient financing to provide liquidity to meet our business objectives, surety bonds, letters of credit and similar financing; our ability to comply with the requirements of, and to service the indebtedness under, our credit agreement as amended and restated (the "A&R" Credit Agreement"); our ability to obtain waivers of required pension contributions; the highly competitive nature of our businesses and our ability to win work, including identified project opportunities in our pipeline; general economic and business conditions, including changes in interest rates and currency exchange rates; cancellations of and adjustments to backlog and the resulting impact from using backlog as an indicator of future earnings; our ability to perform contracts on time and on budget, in accordance with the schedules and terms established by the applicable contracts with customers; failure by third-party subcontractors, partners or suppliers to perform their obligations on time and as specified; our ability to successfully resolve claims by vendors for goods and services provided and claims by customers for items under warranty; our ability to realize anticipated savings and operational benefits from our restructuring plans, and other cost-savings initiatives; our ability to successfully address productivity and schedule issues in our B&W Renewable and B&W Environmental segments, including the ability to complete our B&W Renewable's European EPC projects and B&W Environmental's U.S. loss projects within the expected time frame and the estimated costs; our ability to successfully partner with third parties to win and execute contracts within our B&W Environmental and B&W Renewable segments; changes in our effective tax rate and tax positions, including any limitation on our ability to use our net operating loss carryforwards and other tax assets; our ability to maintain operational support for our information systems against service outages and data corruption, as well as protection against cyber-based network security breaches and theft of data; our ability to protect our intellectual property and renew licenses to use intellectual property of third parties; our use of the percentage-of-completion
method of accounting to recognize revenue over time; our ability to successfully manage research and development projects and costs, including our efforts to successfully develop and commercialize new technologies and products; the operating risks normally incident to our lines of business, including professional liability, product liability, warranty and other claims against us; changes in, or our failure or inability to comply with, laws and government regulations; actual or anticipated changes in governmental regulation, including trade and tariff policies; difficulties we may encounter in obtaining regulatory or other necessary permits or approvals; changes in, and liabilities relating to, existing or future environmental regulatory matters; changes in actuarial assumptions and market fluctuations that affect our net pension liabilities and income; potential violations of the Foreign Corrupt Practices Act; our ability to successfully compete with current and future competitors; the loss of key personnel and the continued availability of qualified personnel; our ability to negotiate and maintain good relationships with labor unions; changes in pension and medical expenses associated with our retirement benefit programs; social, political, competitive and economic situations in foreign countries where we do business or seek new business; the possibilities of war, other armed conflicts or terrorist attacks; the willingness of customers and suppliers to continue to do business with us on reasonable terms and conditions; our ability to successfully consummate strategic alternatives for non-core assets, if we determine to pursue them; and the other factors specified and set forth under "Risk Factors" in our periodic reports filed with the Securities and Exchange Commission, including our most recent annual report on Form 10-K and our quarterly report on Form 10-Q for the quarter ended September 30, 2020. The Company cautions not to place undue reliance on these forward-looking statements, which speak only as of the date of this report, and the Company undertakes no obligation to update or revise any forward-looking statement, except to the extent required by applicable law.
About B&W Enterprises
Headquartered in Akron, Ohio, Babcock & Wilcox Enterprises is a global leader in energy and environmental technologies and services for the power and industrial markets. Follow B&W on LinkedIn and learn more at www.babcock.com.
Headquartered in Akron, Ohio, Babcock & Wilcox Enterprises is a global leader in energy and environmental technologies and services for the power and industrial markets. Follow B&W on LinkedIn and learn more at www.babcock.com.
# # #
Investor Contact: | Media Contact: |
Megan Wilson | Ryan Cornell |
Vice President, Corporate Development & Investor Relations | Public Relations |
Babcock & Wilcox Enterprises | Babcock & Wilcox Enterprises |
704.625.4944 | [email protected] | 330.860.1345 | [email protected] |
Exhibit 1
Babcock & Wilcox Enterprises, Inc.
Condensed Consolidated Statements of Operations(1)
(In millions, except per share amounts)
Three months ended September 30, | Nine months ended September 30, | ||||||||||||
2020 | 2019 | 2020 | 2019 | ||||||||||
Revenues | $ | 132.5 | $ | 198.6 | $ | 416.5 | $ | 678.7 | |||||
Costs and expenses: | |||||||||||||
Cost of operations | 75.2 | 158.3 | 292.7 | 563.2 | |||||||||
Selling, general and administrative expenses | 35.7 | 36.0 | 107.9 | 120.4 | |||||||||
Advisory fees and settlement costs | 3.8 | 4.5 | 10.1 | 22.9 | |||||||||
Restructuring activities | 2.4 | 2.6 | 6.7 | 9.6 | |||||||||
Research and development costs | 1.4 | 0.8 | 3.9 | 2.3 | |||||||||
Gain on asset disposals, net | — | (0.3 | ) | (0.9 | ) | (0.2 | ) | ||||||
Total costs and expenses | 118.4 | 201.8 | 420.4 | 718.1 | |||||||||
Operating income (loss) | 14.1 | (3.2 | ) | (3.9 | ) | (39.4 | ) | ||||||
Other (expense) income: | |||||||||||||
Interest expense | (12.2 | ) | (29.5 | ) | (49.8 | ) | (67.4 | ) | |||||
Interest income | 0.2 | 0.1 | 0.4 | 0.9 | |||||||||
Loss on debt extinguishment | — | — | (6.2 | ) | (4.0 | ) | |||||||
Loss on sale of business | — | — | (0.1 | ) | (3.6 | ) | |||||||
Benefit plans, net | 7.3 | 3.6 | 22.3 | 9.1 | |||||||||
Foreign exchange | 25.0 | (26.7 | ) | 22.7 | (27.4 | ) | |||||||
Other – net | (0.3 | ) | (0.3 | ) | (3.1 | ) | 0.2 | ||||||
Total other income (expense) | 20.0 | (52.8 | ) | (13.7 | ) | (92.2 | ) | ||||||
Income (loss) before income tax (benefit) expense | 34.1 | (55.9 | ) | (17.6 | ) | (131.6 | ) | ||||||
Income tax (benefit) expense | (0.5 | ) | 1.0 | (0.5 | ) | 3.6 | |||||||
Income (loss) from continuing operations | 34.6 | (57.0 | ) | (17.1 | ) | (135.2 | ) | ||||||
Income from discontinued operations, net of tax | — | — | 1.8 | 0.7 | |||||||||
Net income (loss) | 34.6 | (57.0 | ) | (15.3 | ) | (134.5 | ) | ||||||
Net loss attributable to non-controlling interest | 0.2 | — | 0.4 | 0.1 | |||||||||
Net income (loss) attributable to stockholders | $ | 34.7 | $ | (57.0 | ) | $ | (14.9 | ) | $ | (134.4 | ) | ||
Basic earnings (loss) per share - continuing operations | $ | 0.70 | $ | (1.39 | ) | $ | (0.35 | ) | $ | (5.21 | ) | ||
Basic earnings per share - discontinued operations | — | — | 0.04 | 0.03 | |||||||||
Basic earnings (loss) per share | $ | 0.70 | $ | (1.39 | ) | $ | (0.31 | ) | $ | (5.18 | ) | ||
Diluted earnings (loss) per share - continuing operations | $ | 0.69 | $ | (1.39 | ) | $ | (0.35 | ) | $ | (5.21 | ) | ||
Diluted earnings per share - discontinued operations | — | — | 0.04 | 0.03 | |||||||||
Diluted earnings (loss) per share | $ | 0.69 | $ | (1.39 | ) | $ | (0.31 | ) | $ | (5.18 | ) | ||
Shares used in the computation of earnings per share: | |||||||||||||
Basic | 49.5 | 40.9 | 47.6 | 26.0 | |||||||||
Diluted | 50.1 | 40.9 | 47.6 | 26.0 | |||||||||
(1) Figures may not be clerically accurate due to rounding.
Exhibit 2
Babcock & Wilcox Enterprises, Inc.
Condensed Consolidated Balance Sheets(1)
(In millions, except per share amount) | September 30, 2020 | December 31, 2019 | ||||
Cash and cash equivalents | $ | 38.9 | $ | 43.8 | ||
Restricted cash and cash equivalents | 9.4 | 13.2 | ||||
Accounts receivable – trade, net | 126.8 | 142.2 | ||||
Accounts receivable – other | 52.1 | 23.3 | ||||
Contracts in progress | 73.9 | 91.6 | ||||
Inventories | 67.0 | 63.1 | ||||
Other current assets | 20.6 | 27.0 | ||||
Current assets held for sale | 4.8 | 8.1 | ||||
Total current assets | 393.6 | 412.2 | ||||
Net property, plant and equipment, and finance lease | 88.6 | 97.1 | ||||
Goodwill | 47.1 | 47.2 | ||||
Intangible assets | 23.7 | 25.3 | ||||
Right-of-use assets | 10.3 | 12.5 | ||||
Other assets | 34.9 | 25.0 | ||||
Non-current assets held for sale | 7.5 | 7.3 | ||||
Total assets | $ | 605.8 | $ | 626.5 | ||
Revolving credit facilities | — | 179.0 | ||||
Last out term loans | — | 104.0 | ||||
Financing lease liabilities | 0.9 | — | ||||
Accounts payable | 80.0 | 109.9 | ||||
Accrued employee benefits | 17.4 | 18.3 | ||||
Advance billings on contracts | 54.0 | 75.3 | ||||
Accrued warranty expense | 26.8 | 33.4 | ||||
Operating lease liabilities | 4.0 | 4.3 | ||||
Other accrued liabilities | 86.8 | 68.8 | ||||
Current liabilities held for sale | 6.9 | 9.5 | ||||
Total current liabilities | 276.7 | 602.5 | ||||
Revolving credit facilities | 181.9 | — | ||||
Last out term loans | 173.3 | — | ||||
Pension and other accumulated postretirement benefit liabilities | 236.4 | 259.3 | ||||
Non-current finance lease liabilities | 29.9 | 30.5 | ||||
Non-current operating lease liabilities | 6.4 | 8.4 | ||||
Other non-current liabilities | 21.9 | 20.9 | ||||
Non-current liabilities held for sale | — | — | ||||
Total liabilities | 926.5 | 921.5 | ||||
Commitments and contingencies | ||||||
Stockholders' deficit: | ||||||
Common stock, par value $0.01 per share, authorized shares of 500,000; issued and outstanding shares of 52,006 and 46,374 at September 30, 2020 and December 31, 2019, respectively | 4.8 | 4.7 | ||||
Capital in excess of par value | 1,157.8 | 1,142.6 | ||||
Treasury stock at cost, 716 and 616 shares at September 30, 2020 and December 31, 2019, respectively | (106.0 | ) | (105.7 | ) | ||
Accumulated deficit | (1,354.8 | ) | (1,339.9 | ) | ||
Accumulated other comprehensive income (loss) | (23.4 | ) | 1.9 | |||
Stockholders' deficit attributable to shareholders | (321.7 | ) | (296.4 | ) | ||
Non-controlling interest | 0.9 | 1.4 | ||||
Total stockholders' deficit | (320.8 | ) | (294.9 | ) | ||
Total liabilities and stockholders' deficit | $ | 605.8 | $ | 626.5 | ||
(1) Figures may not be clerically accurate due to rounding.
Exhibit 3
Babcock & Wilcox Enterprises, Inc.
Condensed Consolidated Statements of Cash Flows(1)
(In millions) | Nine months ended September 30, | |||||
2020 | 2019 | |||||
Cash flows from operating activities: | ||||||
Net loss | $ | (15.3 | ) | $ | (134.5 | ) |
Adjustments to reconcile net loss to net cash provided by (used in) operating activities: | ||||||
Depreciation and amortization of long-lived assets | 12.3 | 19.1 | ||||
Amortization of deferred financing costs, debt discount and payment-in-kind interest | 16.0 | 42.2 | ||||
Amortization of guaranty fee | 0.7 | — | ||||
Non-cash operating lease expense | 3.6 | 4.1 | ||||
Loss on sale of business | 0.1 | 3.6 | ||||
Loss on debt extinguishment | 6.2 | 4.0 | ||||
(Gains) losses on asset disposals and impairments | (0.9 | ) | (0.2 | ) | ||
Benefit from deferred income taxes, including valuation allowances | (0.8 | ) | (0.7 | ) | ||
Mark to market losses (gains) and prior service cost amortization for pension plans | (0.7 | ) | (0.1 | ) | ||
Stock-based compensation, net of associated income taxes | 3.3 | 1.8 | ||||
Changes in assets and liabilities: | ||||||
Accounts receivable | 28.6 | 41.3 | ||||
Accrued insurance receivable | (26.0 | ) | — | |||
Contracts in progress | 21.6 | 23.1 | ||||
Advance billings on contracts | (23.2 | ) | (68.1 | ) | ||
Inventories | (4.9 | ) | (6.6 | ) | ||
Income taxes | (4.8 | ) | 1.6 | |||
Accounts payable | (33.5 | ) | (71.3 | ) | ||
Accrued and other current liabilities | 9.9 | (21.1 | ) | |||
Accrued non-cash interest expense | 11.9 | — | ||||
Accrued contract loss | (5.3 | ) | (49.8 | ) | ||
Pension liabilities, accrued postretirement benefits and employee benefits | (25.9 | ) | (5.8 | ) | ||
Other, net | (40.3 | ) | 16.2 | |||
Net cash used in operating activities | (67.3 | ) | (201.1 | ) | ||
Cash flows from investing activities: | ||||||
Purchase of property, plant and equipment | (2.3 | ) | (1.6 | ) | ||
Proceeds from sale of business | 8.0 | 7.4 | ||||
Purchases of available-for-sale securities | (19.1 | ) | (3.5 | ) | ||
Sales and maturities of available-for-sale securities | 14.6 | 5.1 | ||||
Other, net | 0.8 | (0.4 | ) | |||
Net cash from investing activities | 2.0 | 7.1 | ||||
Cash flows from financing activities: | ||||||
Borrowings under our U.S. revolving credit facility | 126.3 | 251.9 | ||||
Repayments of our U.S. revolving credit facility | (123.4 | ) | (205.1 | ) | ||
Borrowings under Last Out Term Loans | 60.0 | 151.4 | ||||
Repayments under Last Out Term Loans | — | (41.8 | ) | |||
Repayments under our foreign revolving credit facilities | — | (0.6 | ) | |||
Shares of our common stock returned to treasury stock | (0.3 | ) | — | |||
Proceeds from rights offering | — | 40.4 | ||||
Costs related to rights offering | — | (0.7 | ) | |||
Debt issuance costs | (10.3 | ) | (15.5 | ) | ||
Issuance of common stock | — | 1.4 | ||||
Other, net | 0.1 | (0.3 | ) | |||
Net cash from financing activities | 52.4 | 181.0 | ||||
Effects of exchange rate changes on cash | 4.4 | (4.0 | ) | |||
Net decrease in cash, cash equivalents and restricted cash | (8.6 | ) | (16.9 | ) | ||
Cash, cash equivalents and restricted cash, beginning of period | 56.9 | 60.3 | ||||
Cash, cash equivalents and restricted cash, end of period | $ | 48.4 | $ | 43.3 | ||
(1) Figures may not be clerically accurate due to rounding.
Exhibit 4
Babcock & Wilcox Enterprises, Inc.
Segment Information(1)
(In millions)
SEGMENT RESULTS | Three months ended September 30, | Nine months ended September 30, | |||||||||||
2020 | 2019 | 2020 | 2019 | ||||||||||
REVENUES: | |||||||||||||
Babcock & Wilcox Renewable | $ | 39.1 | $ | 51.3 | $ | 118.6 | $ | 158.9 | |||||
Babcock & Wilcox Environmental | 25.3 | 45.0 | 76.4 | 234.5 | |||||||||
Babcock & Wilcox Thermal | 70.0 | 108.2 | 223.9 | 315.6 | |||||||||
Eliminations | (1.8 | ) | (5.8 | ) | (2.4 | ) | (30.3 | ) | |||||
$ | 132.5 | $ | 198.6 | $ | 416.5 | $ | 678.7 | ||||||
ADJUSTED EBITDA: | |||||||||||||
Babcock & Wilcox Renewable | $ | 23.6 | $ | (0.6 | ) | $ | 22.0 | $ | (4.2 | ) | |||
Babcock & Wilcox Environmental | 1.1 | 1.8 | (0.1 | ) | 2.5 | ||||||||
Babcock & Wilcox Thermal | 7.3 | 12.9 | 22.7 | 35.0 | |||||||||
Corporate | (4.9 | ) | (3.1 | ) | (12.9 | ) | (17.0 | ) | |||||
Research and development costs | (1.4 | ) | (0.8 | ) | (3.9 | ) | (2.3 | ) | |||||
$ | 25.6 | $ | 10.1 | $ | 27.8 | $ | 14.0 | ||||||
AMORTIZATION EXPENSE: | |||||||||||||
Babcock & Wilcox Renewable (2) | $ | 0.1 | $ | 0.1 | $ | 0.5 | $ | 0.5 | |||||
Babcock & Wilcox Environmental | 0.8 | 0.8 | 2.3 | 2.5 | |||||||||
Babcock & Wilcox Thermal (2) | 0.4 | 0.1 | 1.3 | 0.3 | |||||||||
$ | 1.3 | $ | 1.0 | $ | 4.1 | $ | 3.3 | ||||||
DEPRECIATION EXPENSE: | |||||||||||||
Babcock & Wilcox Renewable | $ | 0.7 | $ | 1.0 | $ | 2.3 | $ | 3.7 | |||||
Babcock & Wilcox Environmental | 0.4 | 0.4 | 1.4 | 1.6 | |||||||||
Babcock & Wilcox Thermal | 1.5 | 2.9 | 4.5 | 10.5 | |||||||||
Corporate | — | — | — | — | |||||||||
$ | 2.7 | $ | 4.3 | $ | 8.2 | $ | 15.8 | ||||||
As of September 30, | |||||||||||||
BACKLOG: | 2020 | 2019 | |||||||||||
Babcock & Wilcox Renewable (3) | $ | 196 | $ | 207 | |||||||||
Babcock & Wilcox Environmental | 107 | 112 | |||||||||||
Babcock & Wilcox Thermal | 208 | 161 | |||||||||||
Other/Eliminations | (2 | ) | (7 | ) | |||||||||
$ | 509 | $ | 473 | ||||||||||
(1) Figures may not be clerically accurate due to rounding.
(2) Amortization expense in the Babcock and Wilcox Renewable and Babcock and Wilcox Thermal segments include $0.1 million and $0.4 million in finance lease amortization for the three months ended September 30, 2020, respectively. Amortization expense in the Babcock and Wilcox Renewable and Babcock and Wilcox Thermal segments include $0.3 million and $1.2 million in finance lease amortization for the nine months ended September 30, 2020, respectively.
(3) | Babcock & Wilcox Renewable backlog at September 30, 2020, includes $159.0 million related to long-term operation and maintenance contracts for renewable energy plants, with remaining durations extending until 2034. Generally, such contracts have a duration of 10-20 years and include options to extend. |
Exhibit 5
Babcock & Wilcox Enterprises, Inc.
Reconciliation of Adjusted EBITDA(2)
(In millions)
Three months ended September 30, | Nine months ended September 30, | ||||||||||||
2020 | 2019 | 2020 | 2019 | ||||||||||
Adjusted EBITDA | |||||||||||||
B&W Renewable segment | $ | 23.6 | $ | (0.6 | ) | $ | 22.0 | $ | (4.2 | ) | |||
B&W Environmental segment | 1.1 | 1.8 | (0.1 | ) | 2.5 | ||||||||
B&W Thermal segment | 7.3 | 12.9 | 22.7 | 35.0 | |||||||||
Corporate | (4.9 | ) | (3.1 | ) | (12.9 | ) | (17.0 | ) | |||||
Research and development costs | (1.4 | ) | (0.8 | ) | (3.9 | ) | (2.3 | ) | |||||
25.6 | 10.1 | 27.8 | 14.0 | ||||||||||
Restructuring activities | (2.4 | ) | (2.6 | ) | (6.7 | ) | (9.6 | ) | |||||
Financial advisory services | (1.7 | ) | (1.2 | ) | (3.2 | ) | (8.4 | ) | |||||
Settlement cost to exit B&W Renewable contract (1) | — | — | — | (6.6 | ) | ||||||||
Advisory fees for settlement costs and liquidity planning | (1.4 | ) | (2.8 | ) | (5.2 | ) | (7.4 | ) | |||||
Litigation legal costs | (0.8 | ) | (0.5 | ) | (1.8 | ) | (0.5 | ) | |||||
Stock compensation | (1.2 | ) | (1.3 | ) | (3.1 | ) | (2.1 | ) | |||||
Loss from business held for sale | (0.1 | ) | — | (0.4 | ) | — | |||||||
Depreciation & amortization | (4.1 | ) | (5.3 | ) | (12.3 | ) | (19.1 | ) | |||||
Gain on asset disposals, net | — | 0.3 | 0.9 | 0.2 | |||||||||
Operating income (loss) | 14.1 | (3.2 | ) | (3.9 | ) | (39.4 | ) | ||||||
Interest expense, net | (12.0 | ) | (29.4 | ) | (49.3 | ) | (66.6 | ) | |||||
Loss on debt extinguishment | — | — | (6.2 | ) | (4.0 | ) | |||||||
Loss on sale of business | — | — | (0.1 | ) | (3.6 | ) | |||||||
Net pension benefit before MTM | 7.3 | 3.6 | 22.3 | 10.4 | |||||||||
MTM loss from benefit plans | — | — | — | (1.3 | ) | ||||||||
Foreign exchange | 25.0 | (26.7 | ) | 22.7 | (27.4 | ) | |||||||
Other – net | (0.3 | ) | (0.3 | ) | (3.1 | ) | 0.2 | ||||||
Total other income (expense) | 20.0 | (52.8 | ) | (13.7 | ) | (92.2 | ) | ||||||
Income (loss) before income tax (benefit) expense | 34.1 | (55.9 | ) | (17.6 | ) | (131.6 | ) | ||||||
Income tax (benefit) expense | (0.5 | ) | 1.0 | (0.5 | ) | 3.6 | |||||||
Income (loss) from continuing operations | 34.6 | (57.0 | ) | (17.1 | ) | (135.2 | ) | ||||||
Income from discontinued operations, net of tax | — | — | 1.8 | 0.7 | |||||||||
Net income (loss) | 34.6 | (57.0 | ) | (15.3 | ) | (134.5 | ) | ||||||
Net loss attributable to non-controlling interest | 0.2 | — | 0.4 | 0.1 | |||||||||
Net income (loss) attributable to stockholders | $ | 34.7 | $ | (57.0 | ) | $ | (14.9 | ) | $ | (134.4 | ) | ||
(1) In March 2019, we entered into a settlement in connection with an additional B&W Renewable waste-to-energy EPC contract, for which notice to proceed was not given and the contract was not started. The settlement eliminated our obligations to act, and our risk related to acting, as the prime EPC should the project have moved forward.
(2) Figures may not be clerically accurate due to rounding.
Exhibit 6
Babcock & Wilcox Enterprises, Inc.
Reconciliation of Adjusted Gross Profit (Loss)(2)
(In millions)
Three months ended September 30, | Nine months ended September 30, | ||||||||||||
2020 | 2019 | 2020 | 2019 | ||||||||||
Adjusted gross profit (loss) (1) | |||||||||||||
Operating income (loss) | $ | 14.1 | $ | (3.2 | ) | $ | (3.9 | ) | $ | (39.4 | ) | ||
Selling, general and administrative ("SG&A") expenses | 35.6 | 35.8 | 107.6 | 120.0 | |||||||||
Advisory fees and settlement costs | 3.8 | 4.5 | 10.1 | 22.9 | |||||||||
Amortization expense | 1.4 | 1.0 | 4.1 | 3.3 | |||||||||
Restructuring activities | 2.4 | 2.6 | 6.7 | 9.6 | |||||||||
Research and development costs | 1.4 | 0.8 | 3.9 | 2.3 | |||||||||
Losses (gains) on asset disposals, net | — | (0.3 | ) | (0.9 | ) | (0.2 | ) | ||||||
Adjusted gross profit (loss) | 58.6 | 41.2 | 127.7 | 118.4 | |||||||||
Adjusted gross profit by segment is as follows:
Three months ended September 30, | Nine months ended September 30, | ||||||||
2020 | 2019 | 2020 | 2019 | ||||||
Adjusted gross profit (loss) (1) | |||||||||
B&W Renewable segment | 32.1 | 6.6 | 48.4 | 19.3 | |||||
B&W Environmental segment | 5.9 | 9.0 | 15.5 | 33.6 | |||||
B&W Thermal segment | 20.6 | 25.6 | 63.8 | 65.5 | |||||
Adjusted gross profit (loss) | 58.6 | 41.2 | 127.7 | 118.4 | |||||
(1) Amortization is not allocated to the segments' adjusted gross profit, but depreciation is allocated to the segments' adjusted gross profit.
(2) Figures may not be clerically accurate due to rounding.