Exhibit 99.1


Media Contact: | Investor Contact: |
January 27, 2026
Bridgewater Bancshares, Inc. Announces Fourth Quarter 2025 Financial Results
Fourth Quarter 2025 Highlights
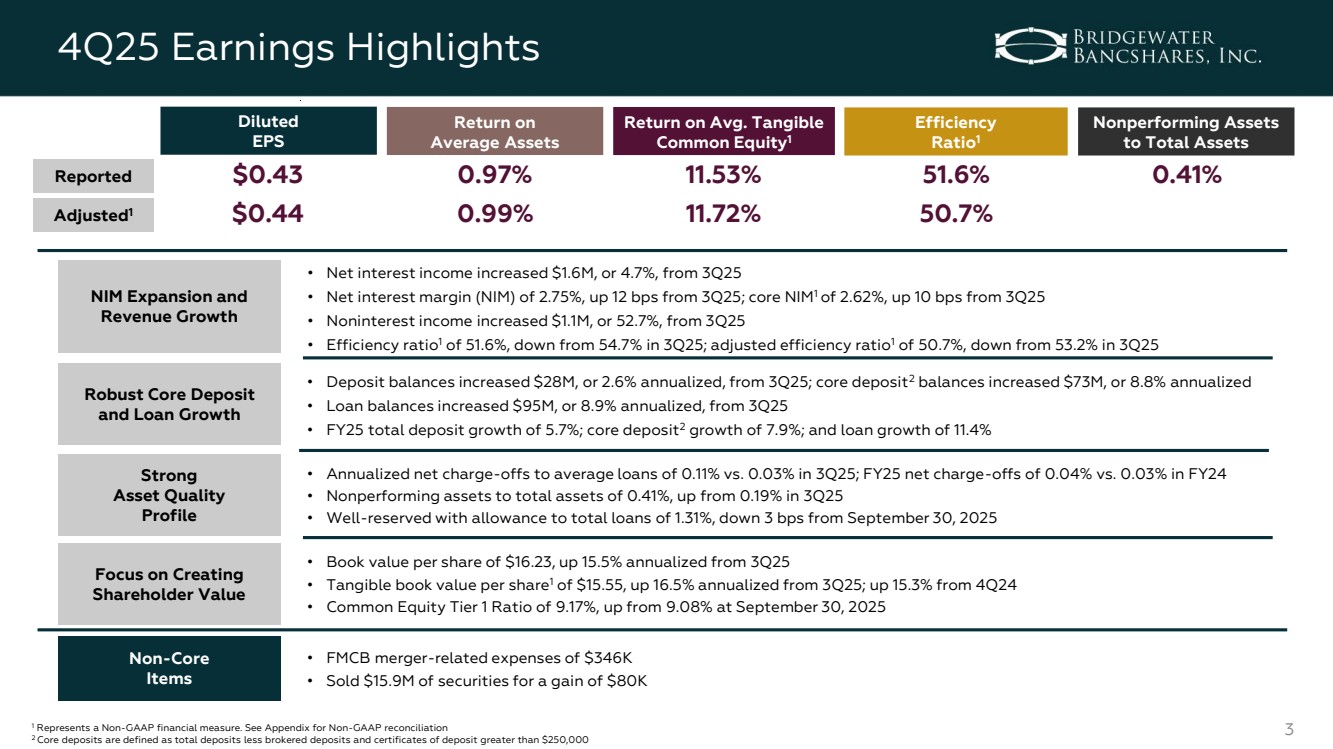
| ● | Net income of $13.3 million, or $0.43 per diluted common share; adjusted net income of $13.5 million, or $0.44 per diluted common share.(1) |
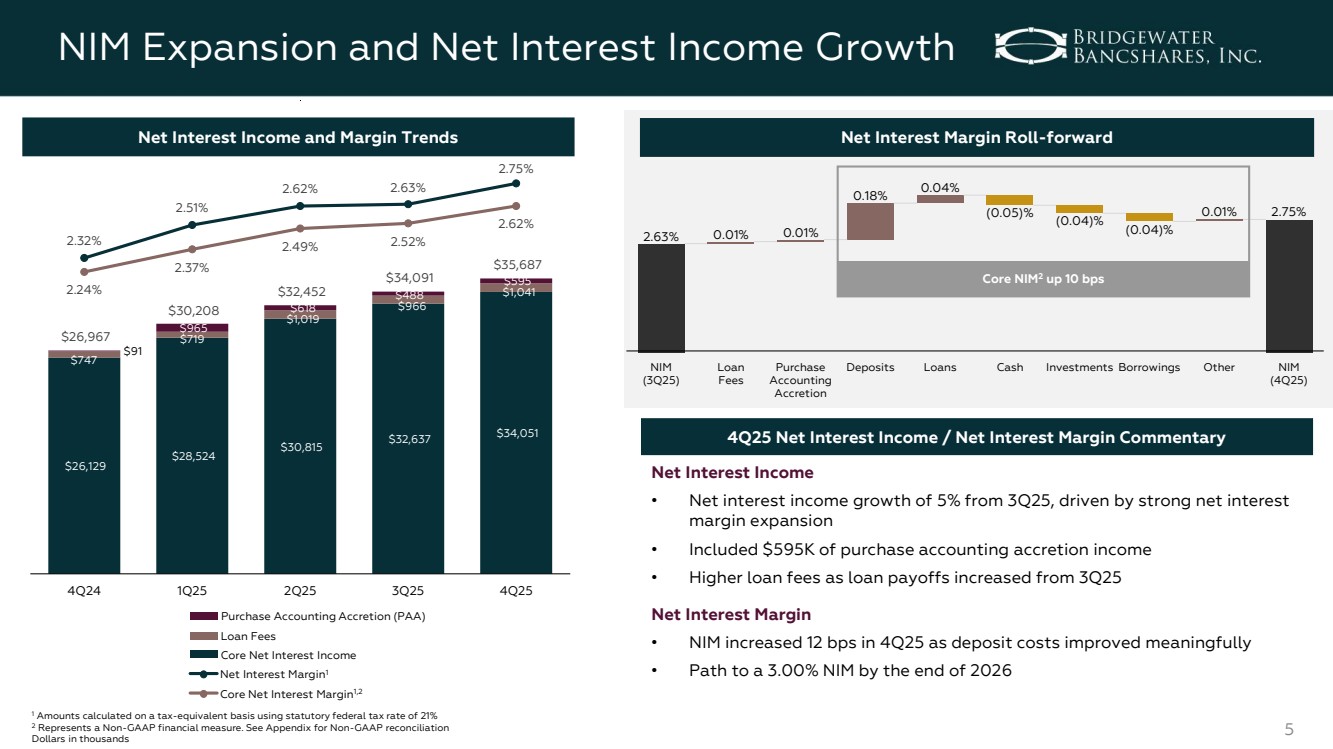
| ● | Net interest income increased $1.6 million, or 4.7%, from the third quarter of 2025. |
| ● | Net interest margin (on a fully tax-equivalent basis) of 2.75%, an increase of 12 basis points from the third quarter of 2025. |
| ● | Noninterest income increased $1.1 million, or 52.7%, from the third quarter of 2025. |
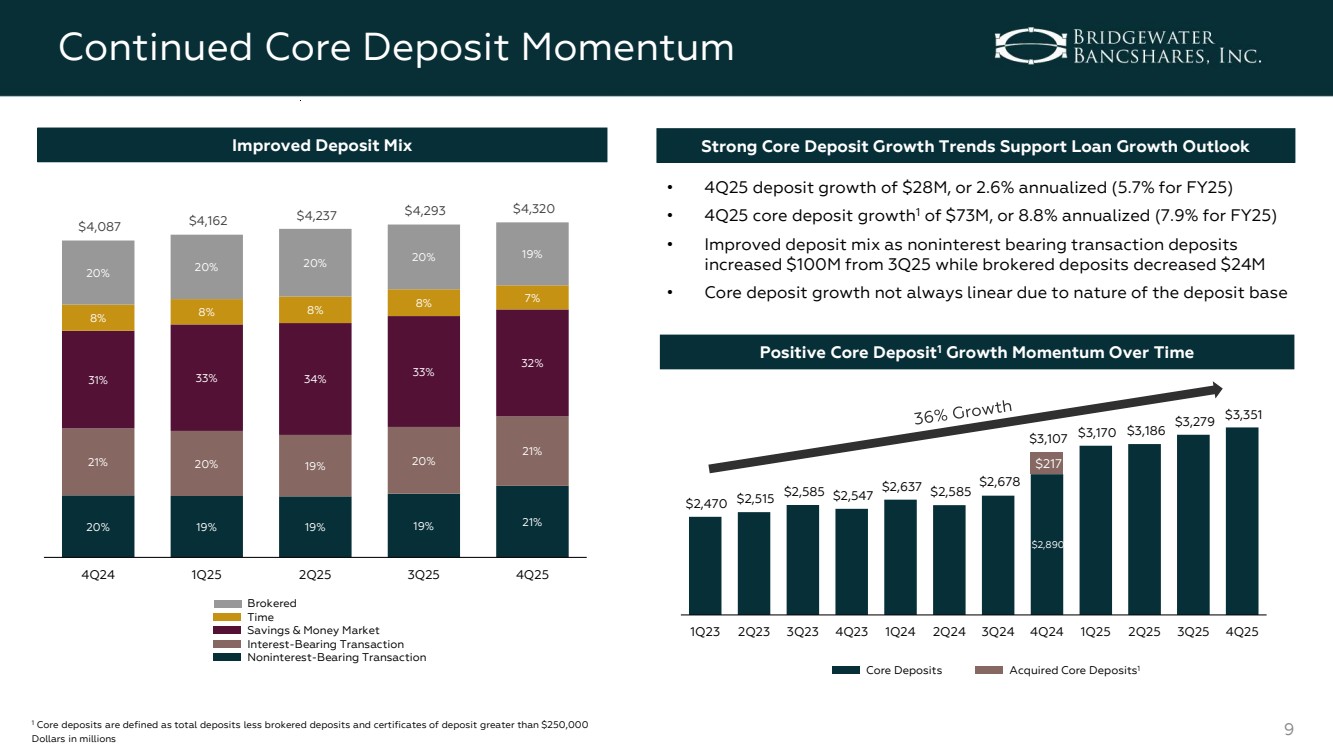
| ● | Total deposits increased by $27.6 million, or 2.6% annualized, from the third quarter of 2025; core deposits(2) increased by $72.6 million, or 8.8% annualized, from the third quarter of 2025. |
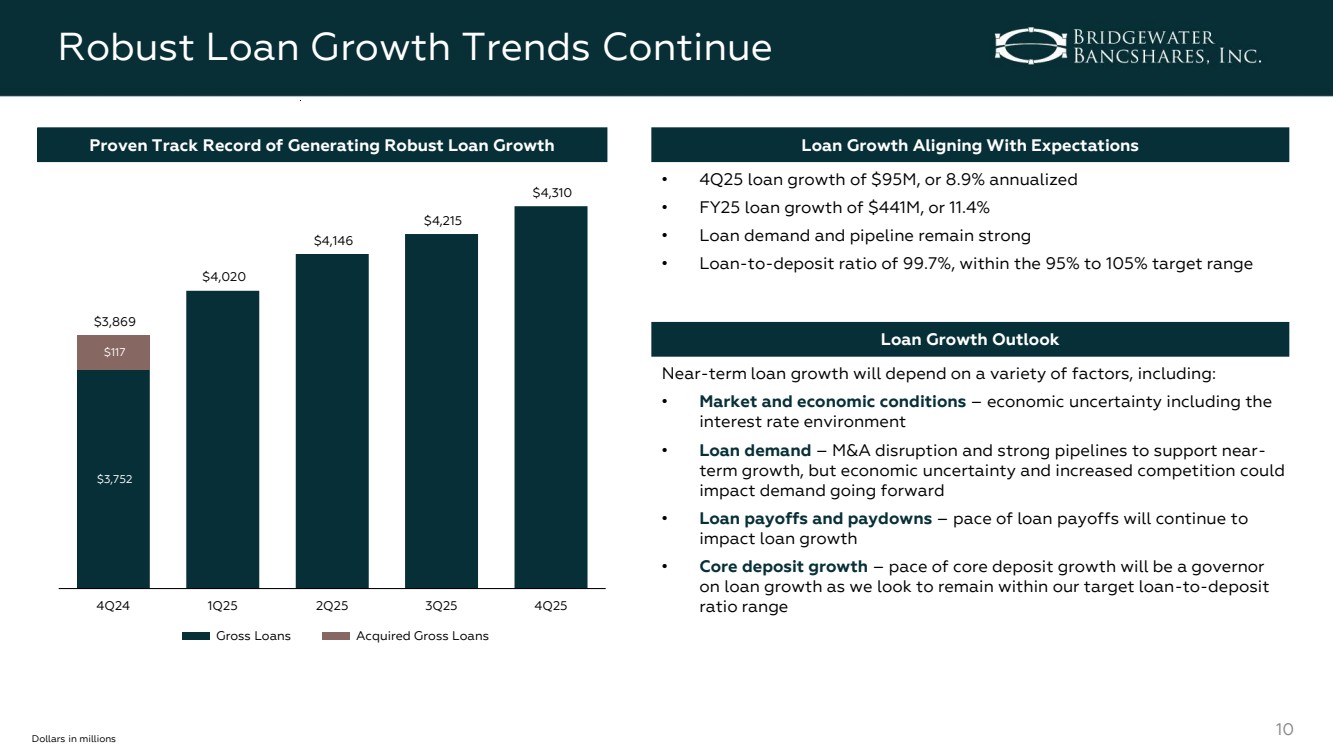
| ● | Gross loans increased by $95.0 million, or 8.9% annualized, from the third quarter of 2025. |
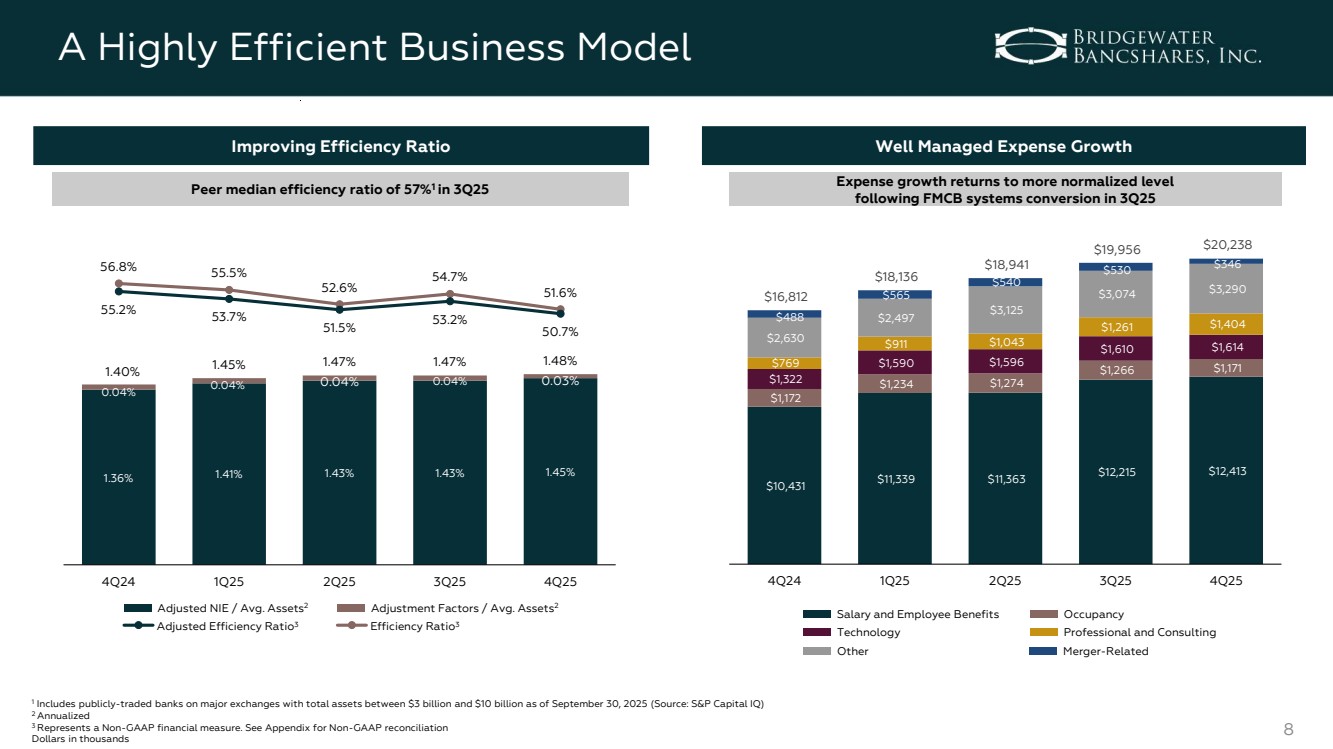
| ● | Efficiency ratio(1) of 51.6%, down from 54.7% for the third quarter of 2025; adjusted efficiency ratio(1) of 50.7%, down from 53.2% for the third quarter of 2025. |
| ● | Completed the closure of one branch acquired from First Minnetonka City Bank (“FMCB”) in 2024. |
Full Year 2025 Highlights
| ● | Net income of $46.1 million, or $1.49 per diluted common share; adjusted net income of $46.9 million, or $1.52 per diluted common share.(1) |
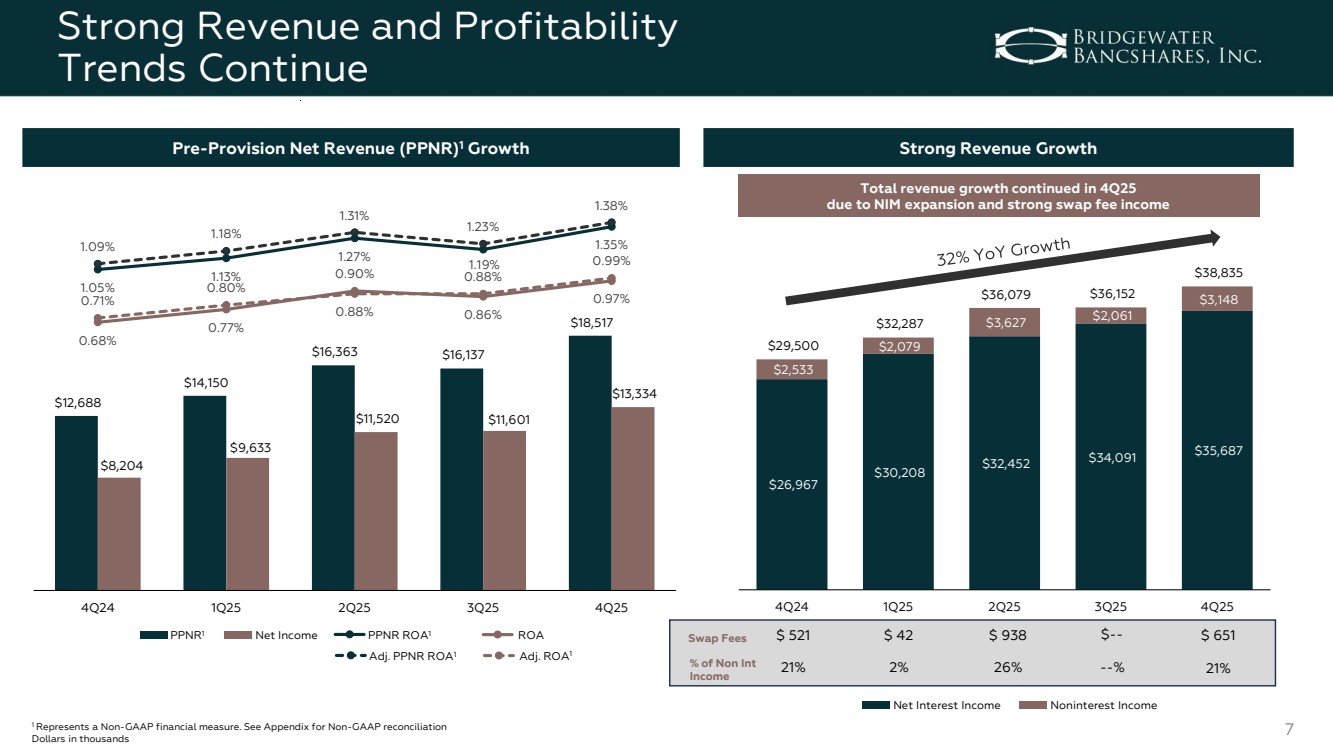
| ● | Pre-provision net revenue(1) increased $19.3 million, or 42.1%, from 2024. |
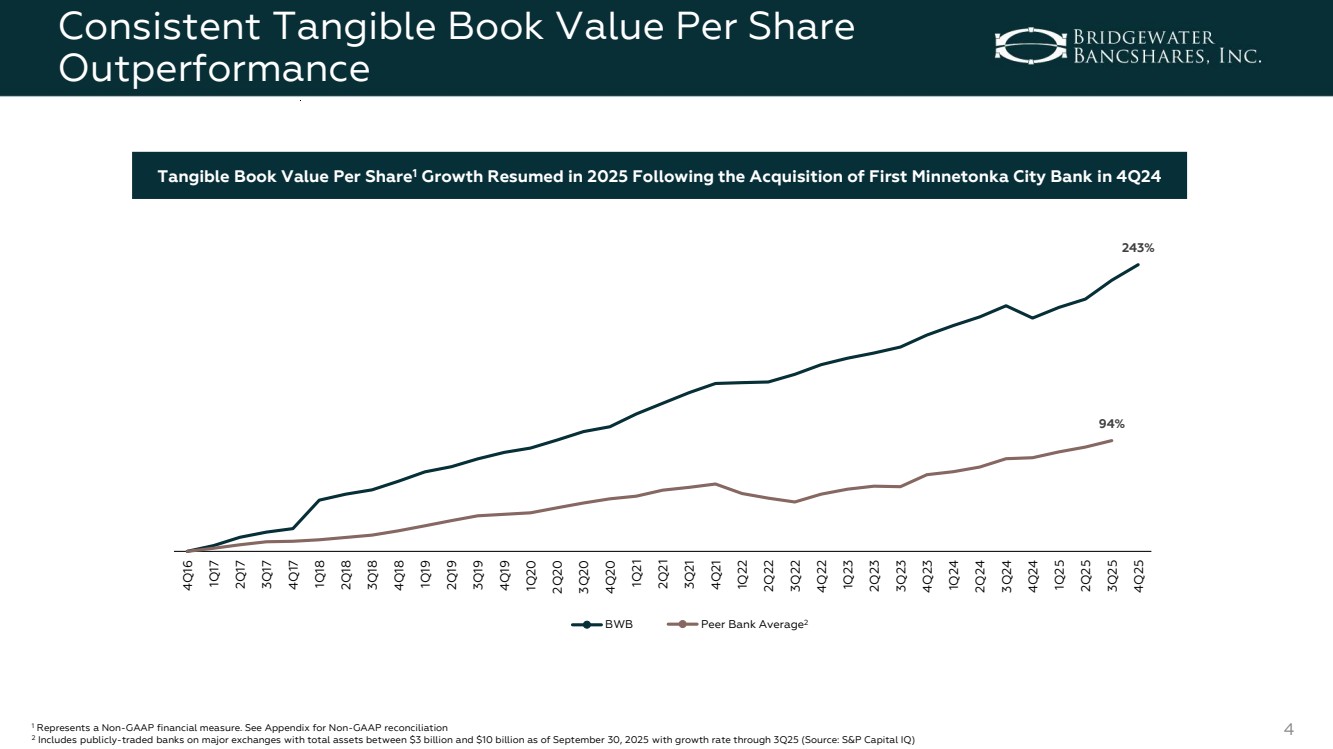
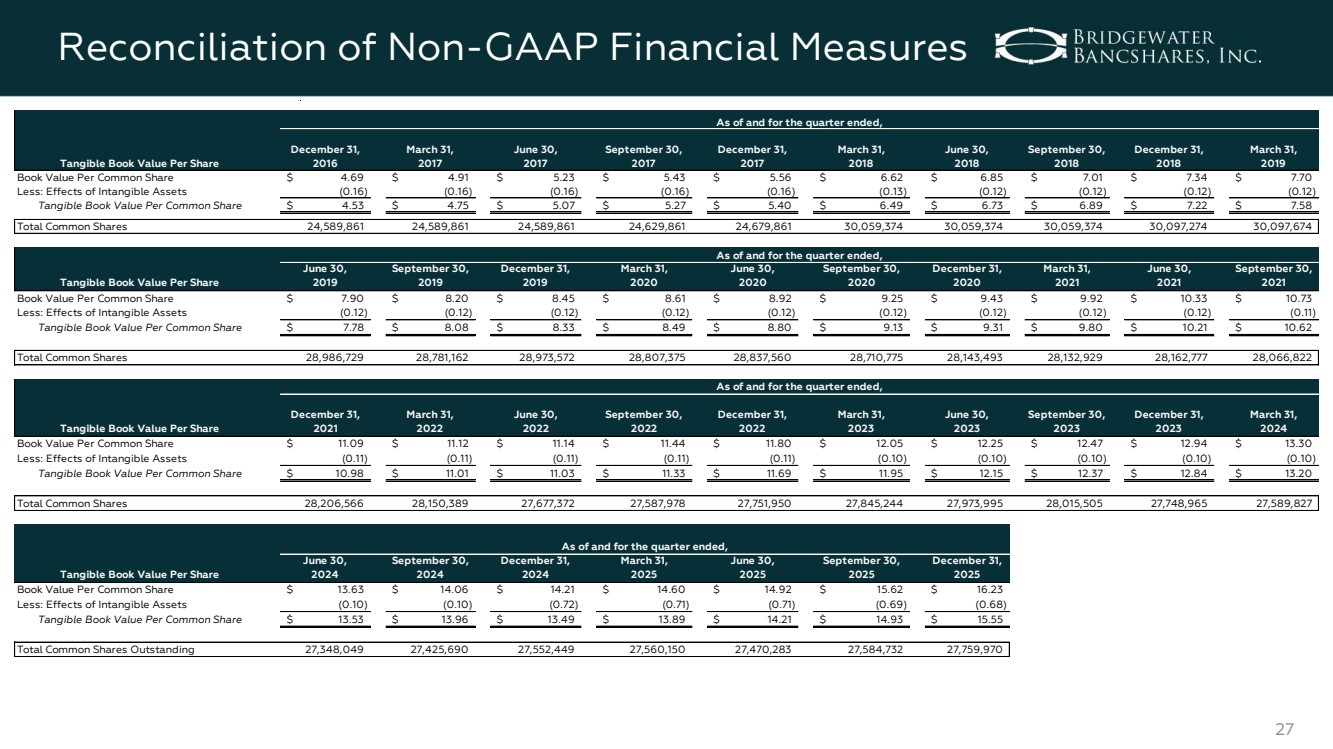
| ● | Tangible book value per share(1) of $15.55 at December 31, 2025, an increase of $2.06, or 15.3%, from December 31, 2024. |
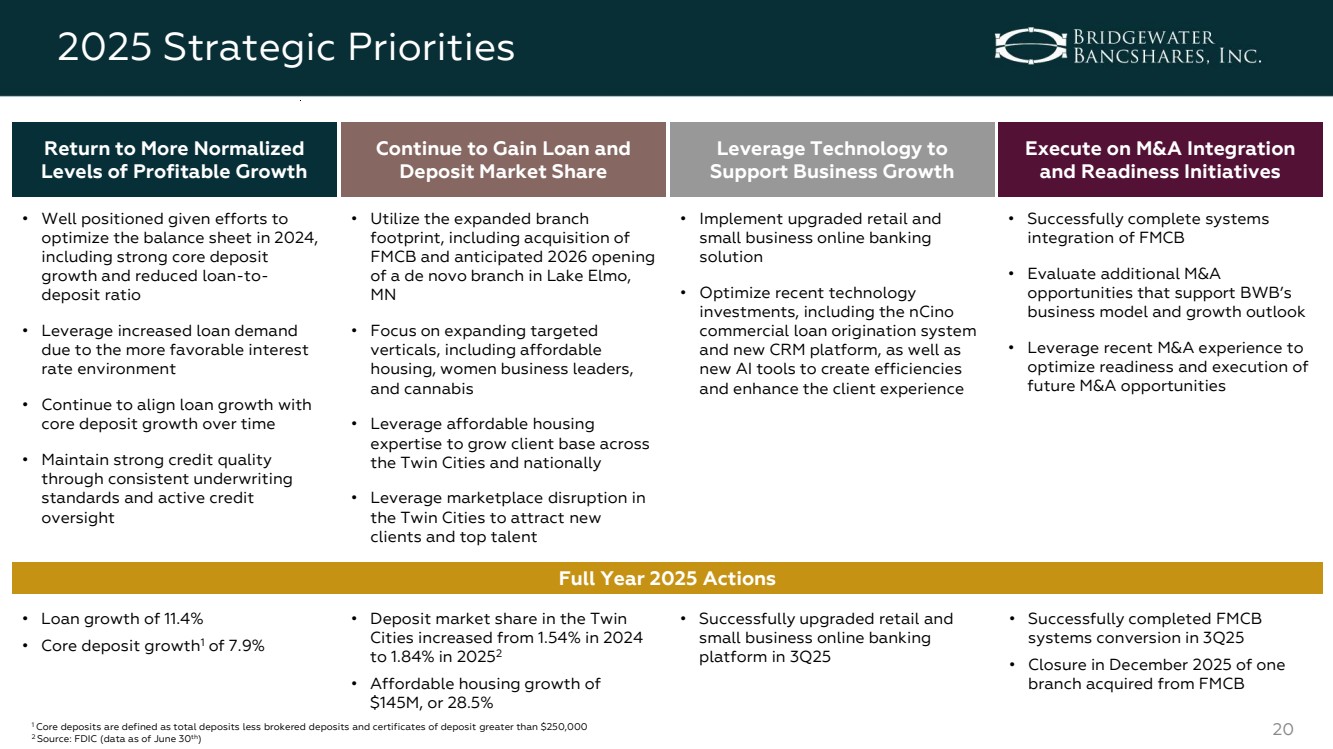
| ● | Total deposits increased by $233.6 million, or 5.7%, in 2025; core deposits(2) increased by $244.6 million, or 7.9%, in 2025. |
| ● | Gross loans increased by $441.0 million, or 11.4%, in 2025. |
| ● | Net loan charge-offs as a percentage of average loans of 0.04%, up from 0.03% for the year ended December 31, 2024. |
| (1) | Represents a non-GAAP financial measure. See "Non-GAAP Financial Measures" for further details. |
| (2) | Core deposits are defined as total deposits less brokered deposits and certificates of deposit greater than $250,000. |
Page 1 of 19
St. Louis Park, MN – Bridgewater Bancshares, Inc. (Nasdaq: BWB) (“the Company”), the parent company of Bridgewater Bank (“the Bank”), today announced net income of $13.3 million for the fourth quarter of 2025, compared to $11.6 million for the third quarter of 2025, and $8.2 million for the fourth quarter of 2024. Earnings per diluted common share were $0.43 for the fourth quarter of 2025, compared to $0.38 for the third quarter of 2025, and $0.26 for the fourth quarter of 2024. Adjusted net income, a non-GAAP financial measure, was $13.5 million for the fourth quarter of 2025, compared to $12.0 million for the third quarter of 2025, and $8.6 million for the fourth quarter of 2024. Adjusted earnings per diluted common share, a non-GAAP financial measure, were $0.44 for the fourth quarter of 2025, compared to $0.39 for the third quarter of 2025, and $0.27 for the fourth quarter of 2024.
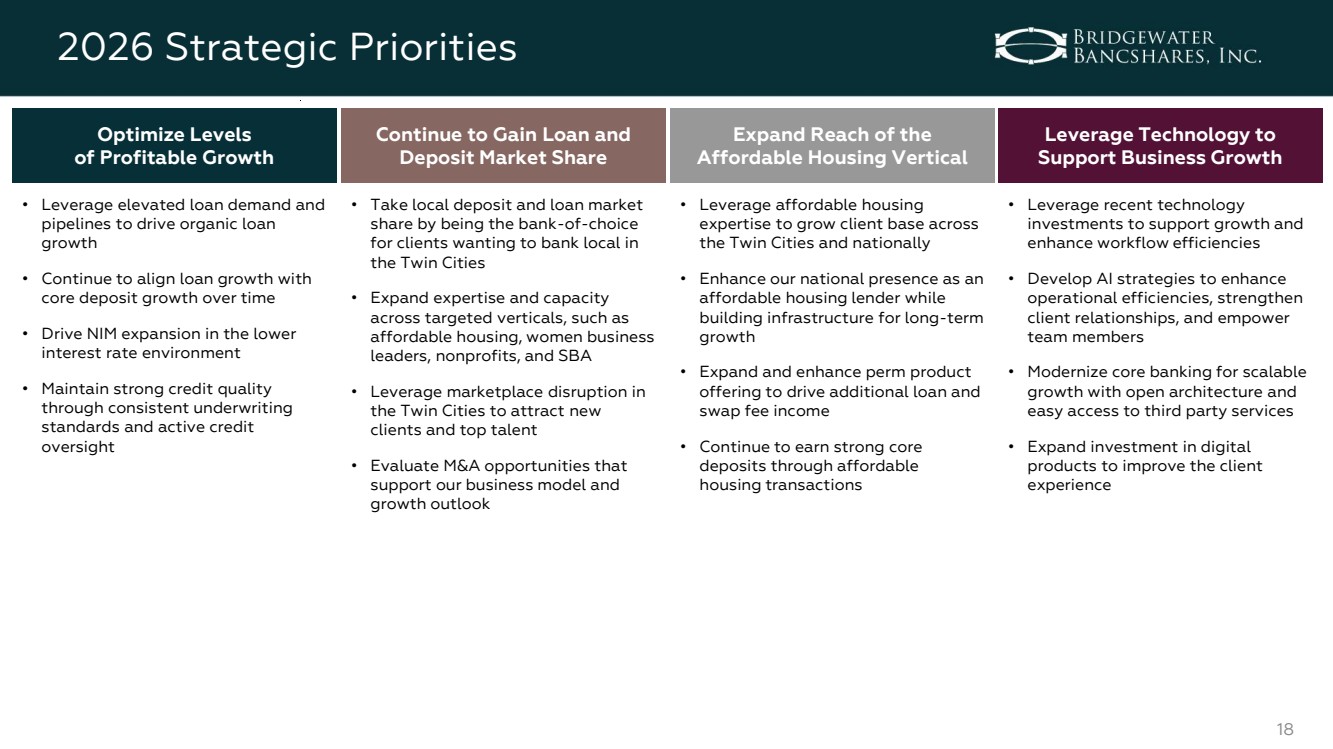
“Bridgewater’s fourth quarter was highlighted by strong revenue growth, well controlled expenses, and continued core deposit and loan growth momentum,” said Chairman and Chief Executive Officer, Jerry Baack. “Our overall efficiency improved as meaningful net interest margin expansion and strong swap fee income drove revenue higher while expense growth returned to more normalized levels following the systems conversion of our recent acquisition. Meanwhile, we continued to capitalize on the M&A disruption in the Twin Cities through opportunities to attract top talent and earn new client relationships.
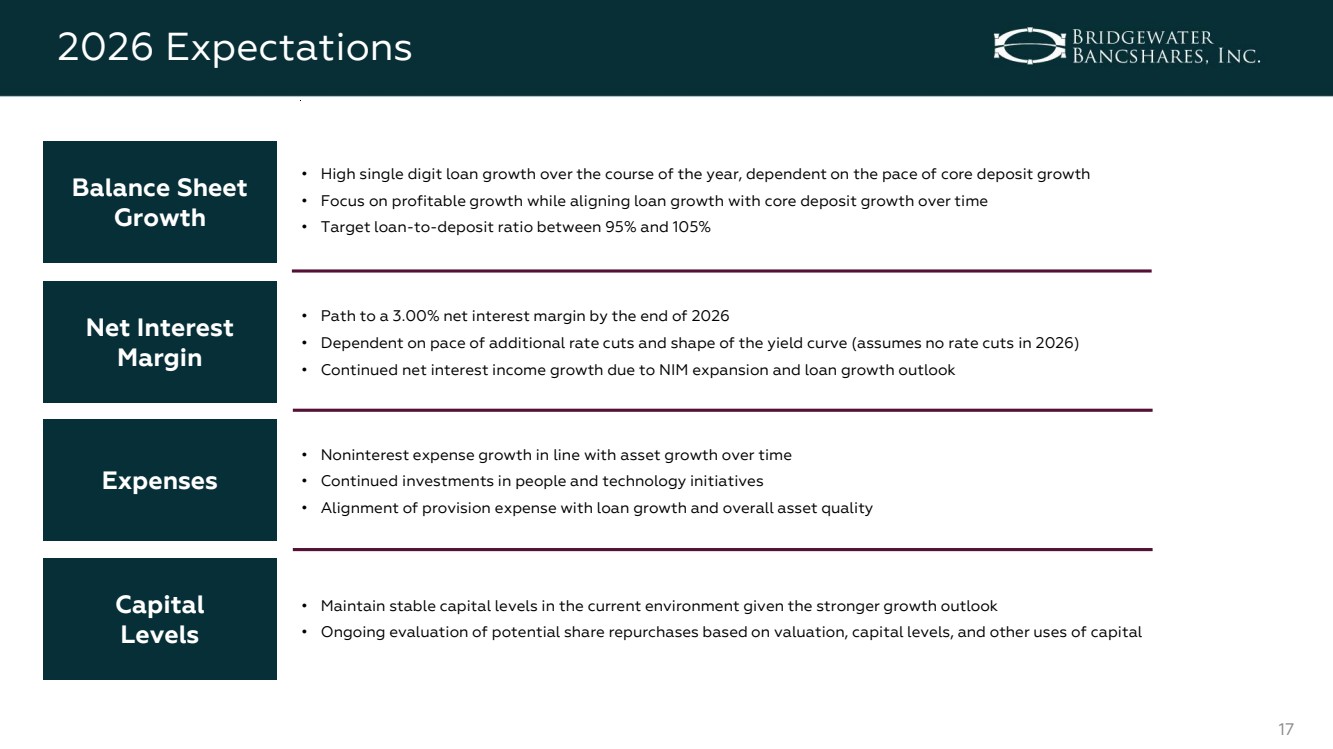
“As we look ahead to 2026, we are focused on driving profitable growth, gaining market share, and continuing to leverage technology investments to support future growth. We will also look to expand key verticals including affordable housing, which became a key growth driver for us in 2025. With the right team in place, an outlook for continued growth and net interest margin expansion, and a strong credit culture, we believe we are well positioned to continue improving profitability and growing tangible book value in 2026.”
Page 2 of 19
Key Financial Measures
| | As of and for the Three Months Ended |
| | As of and for the Year Ended |
| |||||||||||
| | December 31, | | September 30, | | December 31, |
| | December 31, | | December 31, |
| |||||
| | 2025 | | 2025 | | 2024 |
| | 2025 | | 2024 |
| |||||
Per Common Share Data | | | | | | | | | | | | | | | | | |
Basic Earnings Per Share | | $ | 0.45 | | $ | 0.38 | | $ | 0.26 | | | $ | 1.53 | | $ | 1.05 | |
Diluted Earnings Per Share | | | 0.43 | | | 0.38 | | | 0.26 | | | | 1.49 | | | 1.03 | |
Adjusted Diluted Earnings Per Share (1) | | | 0.44 | | | 0.39 | | | 0.27 | | | | 1.52 | | | 1.04 | |
Book Value Per Share | | | 16.23 | | | 15.62 | | | 14.21 | | | | 16.23 | | | 14.21 | |
Tangible Book Value Per Share (1) | | | 15.55 | | | 14.93 | | | 13.49 | | | | 15.55 | | | 13.49 | |
| | | | | | | | | | | | | | | | | |
Financial Ratios | | | | | | | | | | | | | | | | | |
Return on Average Assets (2) | | | 0.97 | % | | 0.86 | % | | 0.68 | % | | | 0.87 | % | | 0.70 | % |
Pre-Provision Net Revenue Return on Average Assets (1)(2) | | | 1.35 | | | 1.19 | | | 1.05 | | | | 1.24 | | | 0.98 | |
Return on Average Shareholders' Equity (2) | | | 10.38 | | | 9.47 | | | 7.16 | | | | 9.53 | | | 7.45 | |
Return on Average Tangible Common Equity (1)(2) | | | 11.53 | | | 10.50 | | | 7.43 | | | | 10.56 | | | 7.75 | |
Net Interest Margin (3) | | | 2.75 | | | 2.63 | | | 2.32 | | | | 2.63 | | | 2.26 | |
Core Net Interest Margin (1)(3) | | | 2.62 | | | 2.52 | | | 2.24 | | | | 2.50 | | | 2.19 | |
Cost of Total Deposits | | | 2.97 | | | 3.19 | | | 3.40 | | | | 3.12 | | | 3.44 | |
Cost of Funds | | | 3.07 | | | 3.25 | | | 3.38 | | | | 3.17 | | | 3.44 | |
Efficiency Ratio (1) | | | 51.6 | | | 54.7 | | | 56.8 | | | | 53.5 | | | 57.9 | |
Noninterest Expense to Average Assets (2) | | | 1.48 | | | 1.47 | | | 1.40 | | | | 1.47 | | | 1.35 | |
Tangible Common Equity to Tangible Assets (1) | | | 8.01 | | | 7.71 | | | 7.36 | | | | 8.01 | | | 7.36 | |
Common Equity Tier 1 Risk-based Capital Ratio (Consolidated) (4) | | | 9.17 | | | 9.08 | | | 9.08 | | | | 9.17 | | | 9.08 | |
| | | | | | | | | | | | | | | | | |
Adjusted Financial Ratios (1) | | | | | | | | | | | | | | | | | |
Adjusted Return on Average Assets (2) | | | 0.99 | % | | 0.88 | % | | 0.71 | % | | | 0.89 | % | | 0.71 | % |
Adjusted Pre-Provision Net Revenue Return on Average Assets (2) | | | 1.38 | | | 1.23 | | | 1.09 | | | | 1.27 | | | 0.99 | |
Adjusted Return on Average Shareholders' Equity (2) | | | 10.54 | | | 9.77 | | | 7.49 | | | | 9.69 | | | 7.50 | |
Adjusted Return on Average Tangible Common Equity (2) | | | 11.72 | | | 10.86 | | | 7.82 | | | | 10.77 | | | 7.82 | |
Adjusted Efficiency Ratio | | | 50.7 | | | 53.2 | | | 55.2 | | | | 52.2 | | | 57.3 | |
Adjusted Noninterest Expense to Average Assets (2) | | | 1.45 | | | 1.43 | | | 1.36 | | | | 1.43 | | | 1.34 | |
| | | | | | | | | | | | | | | | | |
Balance Sheet and Asset Quality (dollars in thousands) | | | | | | | | | | | | | | | | | |
Total Assets | | $ | 5,407,002 | | $ | 5,359,994 | | $ | 5,066,242 | | | $ | 5,407,002 | | $ | 5,066,242 | |
Total Loans, Gross | | | 4,309,517 | | | 4,214,554 | | | 3,868,514 | | | | 4,309,517 | | | 3,868,514 | |
Deposits | | | 4,320,369 | | | 4,292,764 | | | 4,086,767 | | | | 4,320,369 | | | 4,086,767 | |
Loan to Deposit Ratio | | | 99.7 | % | | 98.2 | % | | 94.7 | % | | | 99.7 | % | | 94.7 | % |
Net Loan Charge-Offs to Average Loans (2) | | | 0.11 | | | 0.03 | | | 0.03 | | | | 0.04 | | | 0.03 | |
Nonperforming Assets to Total Assets (5) | | | 0.41 | | | 0.19 | | | 0.01 | | | | 0.41 | | | 0.01 | |
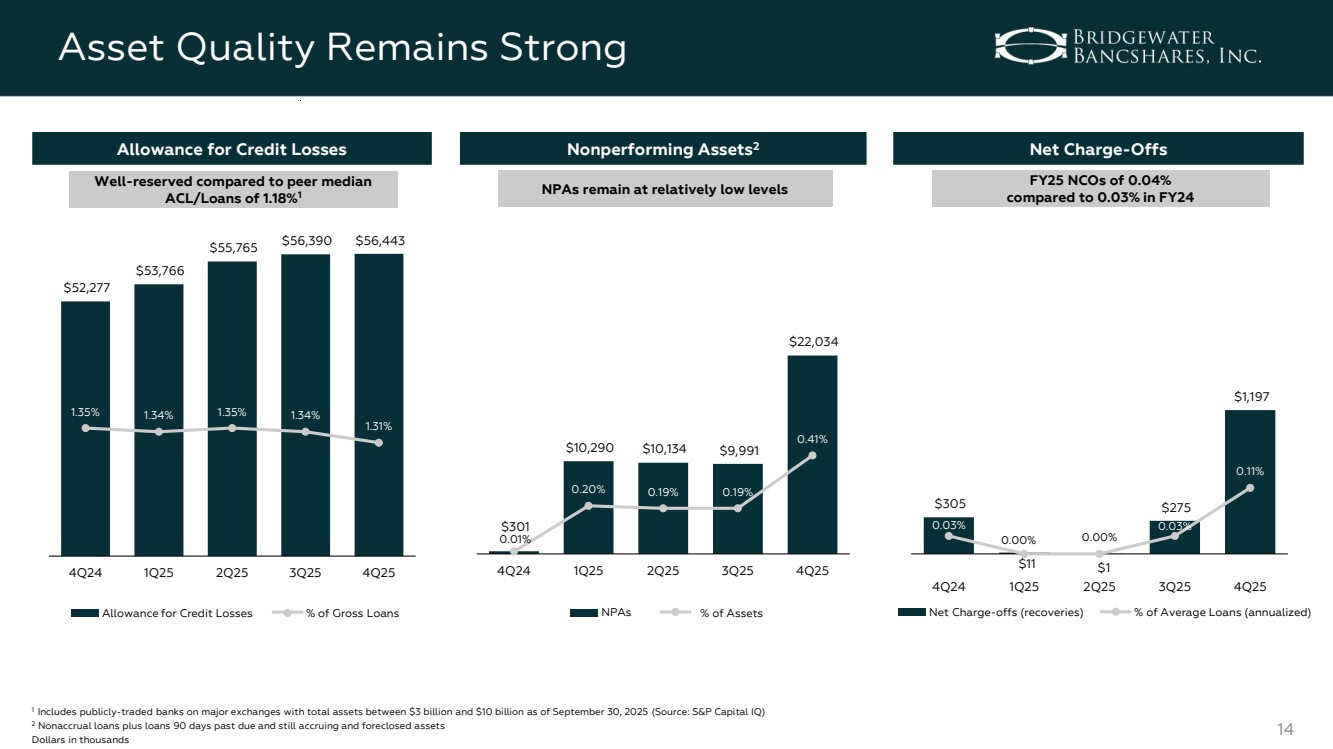
Allowance for Credit Losses to Total Loans | | | 1.31 | | | 1.34 | | | 1.35 | | | | 1.31 | | | 1.35 | |
| (1) | Represents a non-GAAP financial measure. See "Non-GAAP Financial Measures" for further details. |
| (2) | Annualized. |
| (3) | Amounts calculated on a tax-equivalent basis using the statutory federal tax rate of 21%. |
| (4) | Preliminary data. Current period subject to change prior to filings with applicable regulatory agencies. |
| (5) | Nonperforming assets are defined as nonaccrual loans plus 90 days past due and still accruing plus foreclosed assets. |
Page 3 of 19
Income Statement
Net Interest Margin and Net Interest Income
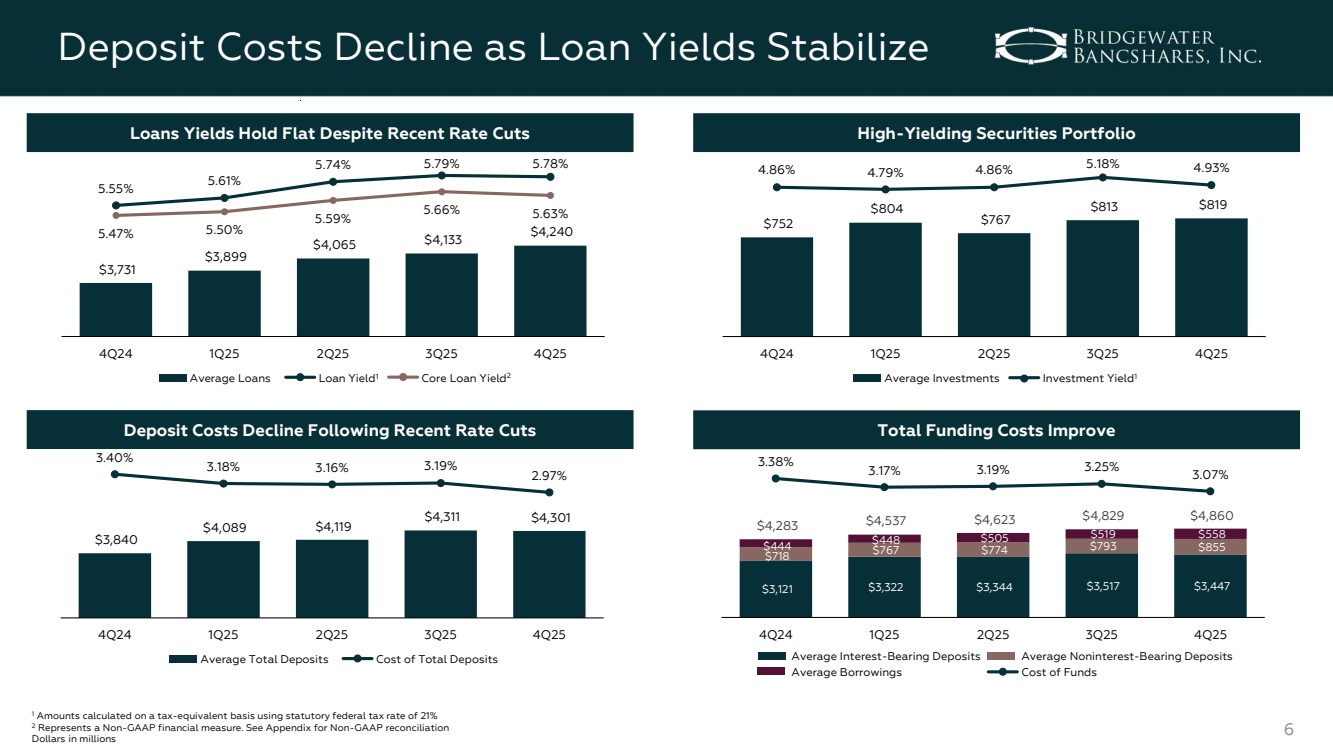
Net interest margin (on a fully tax-equivalent basis) for the fourth quarter of 2025 was 2.75%, a 12 basis point increase from 2.63% in the third quarter of 2025, and a 43 basis point increase from 2.32% in the fourth quarter of 2024. Core net interest margin (on a fully tax-equivalent basis), a non-GAAP financial measure which excludes the impact of loan fees and purchase accounting accretion attributable to the acquisition of FMCB, was 2.62% for the fourth quarter of 2025, a 10 basis point increase from 2.52% in the third quarter of 2025, and a 38 basis point increase from 2.24% in the fourth quarter of 2024.
| ● | Net interest margin expanded to 2.75% in the fourth quarter of 2025 primarily due to growth in the loan portfolio at accretive yields and lower rates paid on deposits. |
| ● | The year-over-year expansion in margin was primarily due to growth in the securities and loan portfolios at higher yields and lower rates paid on deposit balances, offset by higher average balances and rates paid on FHLB advances, as well as the refinancing of subordinated debt at the end of the second quarter of 2025. |
Net interest income was $35.7 million for the fourth quarter of 2025, an increase of $1.6 million from $34.1 million in the third quarter of 2025, and an increase of $8.7 million from $27.0 million in the fourth quarter of 2024.
| ● | The linked-quarter increase in net interest income was primarily due to growth in the loan portfolio and lower rates paid on deposit balances, offset partially by lower cash balances. |
| ● | The year-over-year increase in net interest income was primarily due to growth in the loan portfolio, lower rates paid on deposits, and purchase accounting accretion, offset partially by growth in deposit balances as well as higher balances and rates paid on FHLB advances. |
Interest income was $73.3 million for the fourth quarter of 2025, a decrease of $324,000 from $73.6 million in the third quarter of 2025, and an increase of $10.0 million from $63.3 million in the fourth quarter of 2024.
| ● | The yield on interest earning assets (on a fully tax-equivalent basis) was 5.58% in the fourth quarter of 2025, compared to 5.63% in the third quarter of 2025, and 5.40% in the fourth quarter of 2024. |
| ● | The linked-quarter decrease in the yield on interest earning assets was primarily due to 0.75% of Fed interest rate cuts which occurred in the last four months of the year. |
| ● | The year-over-year increase in the yield on interest earning assets was primarily due to growth and repricing of the loan and securities portfolios at accretive yields and purchase accounting accretion. |
| ● | The aggregate loan yield was 5.78% in the fourth quarter of 2025, one basis point lower than 5.79% in the third quarter of 2025, and 23 basis points higher than 5.55% in the fourth quarter of 2024. |
| ● | Core loan yield, a non-GAAP financial measure, was 5.63% in the fourth quarter of 2025, three basis points lower than 5.66% in the third quarter of 2025, and 16 basis points higher than 5.47% in the fourth quarter of 2024. |
A summary of interest and fees recognized on loans for the periods indicated is as follows:
| | Three Months Ended | ||||||||||||||
| | December 31, 2025 | | | September 30, 2025 | | | June 30, 2025 | | | March 31, 2025 | | | December 31, 2024 | | |
Interest | | 5.63 | % | | 5.66 | % | | 5.59 | % | | 5.50 | % | | 5.47 | % | |
Fees | | 0.10 | | | 0.09 | | | 0.11 | | | 0.07 | | | 0.08 | | |
Accretion | | 0.05 | | | 0.04 | | | 0.04 | | | 0.04 | | | — | | |
Yield on Loans | | 5.78 | % | | 5.79 | % | | 5.74 | % | | 5.61 | % | | 5.55 | % | |
Interest expense was $37.6 million for the fourth quarter of 2025, a decrease of $1.9 million from $39.5 million in the third quarter of 2025, and an increase of $1.3 million from $36.4 million in the fourth quarter of 2024.
| ● | The cost of interest bearing liabilities was 3.73% in the fourth quarter of 2025, compared to 3.89% in the third quarter of 2025, and 4.06% in the fourth quarter of 2024. |
| ● | The linked-quarter decrease in the cost of interest bearing liabilities was primarily due to lower rates paid on interest bearing deposits as the result of recent fed rate cuts, offset partially by higher balances and rates paid on FHLB advances. |
| ● | The year-over-year decrease in the cost of interest bearing liabilities was primarily due to lower interest bearing deposit costs, offset partially by growth in deposits and higher balances and rates paid on FHLB advances and subordinated debentures. |
Page 4 of 19
Interest expense on deposits was $32.2 million for the fourth quarter of 2025, a decrease of $2.4 million from $34.6 million in the third quarter of 2025, and a decrease of $607,000 from $32.8 million in the fourth quarter of 2024.
| ● | The cost of total deposits was 2.97% in the fourth quarter of 2025, 22 basis points lower than 3.19% in the third quarter of 2025, and 43 basis points lower than 3.40% in the fourth quarter of 2024. |
| ● | The linked-quarter decrease in the cost of total deposits was primarily due to lower rates paid on interest bearing deposits following interest rate cuts, lower average balance of brokered deposits, and an increase in noninterest bearing deposits. |
| ● | The year-over-year decrease in the cost of total deposits was primarily due to lower rates paid on deposits following interest rate cuts in 2024 and 2025, lower average brokered deposit balances, and an increase in noninterest bearing deposits. |
Provision for Credit Losses
The provision for credit losses on loans and leases was $1.3 million for the fourth quarter of 2025, compared to $900,000 for the third quarter of 2025 and $1.5 million for the fourth quarter of 2024.
| ● | The provision recorded in the fourth quarter of 2025 was primarily attributable to growth in the loan portfolio and an increase in historical loss rates. |
| ● | The allowance for credit losses on loans to total loans was 1.31% at December 31, 2025, compared to 1.34% at September 30, 2025, and 1.35% at December 31, 2024. |
The provision for credit losses for off-balance sheet credit exposures was $200,000 for the fourth quarter of 2025, stable with the third quarter of 2025, and compared to $725,000 for the fourth quarter of 2024.
| ● | A provision was recorded during the fourth quarter of 2025 due to an increase in the volume of newly originated loans with unfunded commitments. |
Noninterest Income
Noninterest income was $3.1 million for the fourth quarter of 2025, an increase of $1.1 million from $2.1 million for the third quarter of 2025, and an increase of $615,000 from $2.5 million for the fourth quarter of 2024.
| ● | The linked-quarter increase was primarily due to higher swap fees and letter of credit fees. |
| ● | The year-over-year increase was primarily due to higher investment advisory fees, other income, and swap fees, offset partially by lower letter of credit fees. |
Noninterest Expense
Noninterest expense was $20.2 million for the fourth quarter of 2025, an increase of $282,000 from $20.0 million for the third quarter of 2025 and an increase of $3.4 million from $16.8 million for the fourth quarter of 2024.
| ● | Noninterest expense for the fourth quarter of 2025 included $346,000 of merger-related expenses associated with the acquisition of FMCB, compared to $530,000 for the third quarter of 2025, and $488,000 for the fourth quarter of 2024. |
| ● | The linked-quarter increase was primarily due to increases in salaries and employee benefits and professional and consulting fees. |
| ● | The year-over-year increase was primarily attributable to increases in salaries and employee benefits, professional and consulting fees, marketing and advertising, operating costs related to the FMCB acquisition, and merger-related expenses. |
| ● | The efficiency ratio, a non-GAAP financial measure, was 51.6% for the fourth quarter of 2025, compared to 54.7% for the third quarter of 2025, and 56.8% for the fourth quarter of 2024. |
| ● | The Company had 322 full-time equivalent employees at December 31, 2025, compared to 325 at September 30, 2025, and 290 at December 31, 2024. The year-over-year increase was largely driven by the hiring of key talent across the organization. |
Income Taxes
The effective combined federal and state income tax rate was 22.2% for the fourth quarter of 2025, compared to 23.2% for the third quarter of 2025, and 22.0% for the fourth quarter of 2024.
Page 5 of 19
Balance Sheet
Loans
(dollars in thousands) | | December 31, 2025 | | September 30, 2025 | | June 30, 2025 | | March 31, 2025 | | December 31, 2024 | | |||||
Commercial | | $ | 547,245 | | $ | 533,476 | | $ | 549,259 | | $ | 528,801 | | $ | 497,662 | |
Leases | | | 43,407 | | | 43,186 | | | 44,817 | | | 43,958 | | | 44,291 | |
Construction and Land Development | | | 216,163 | | | 159,991 | | | 136,438 | | | 128,073 | | | 97,255 | |
1-4 Family Construction | | | 45,152 | | | 41,739 | | | 39,095 | | | 39,438 | | | 41,961 | |
Real Estate Mortgage: | | | | | | | | | | | | | | | | |
1 - 4 Family Mortgage | | | 496,142 | | | 487,297 | | | 474,269 | | | 479,461 | | | 474,383 | |
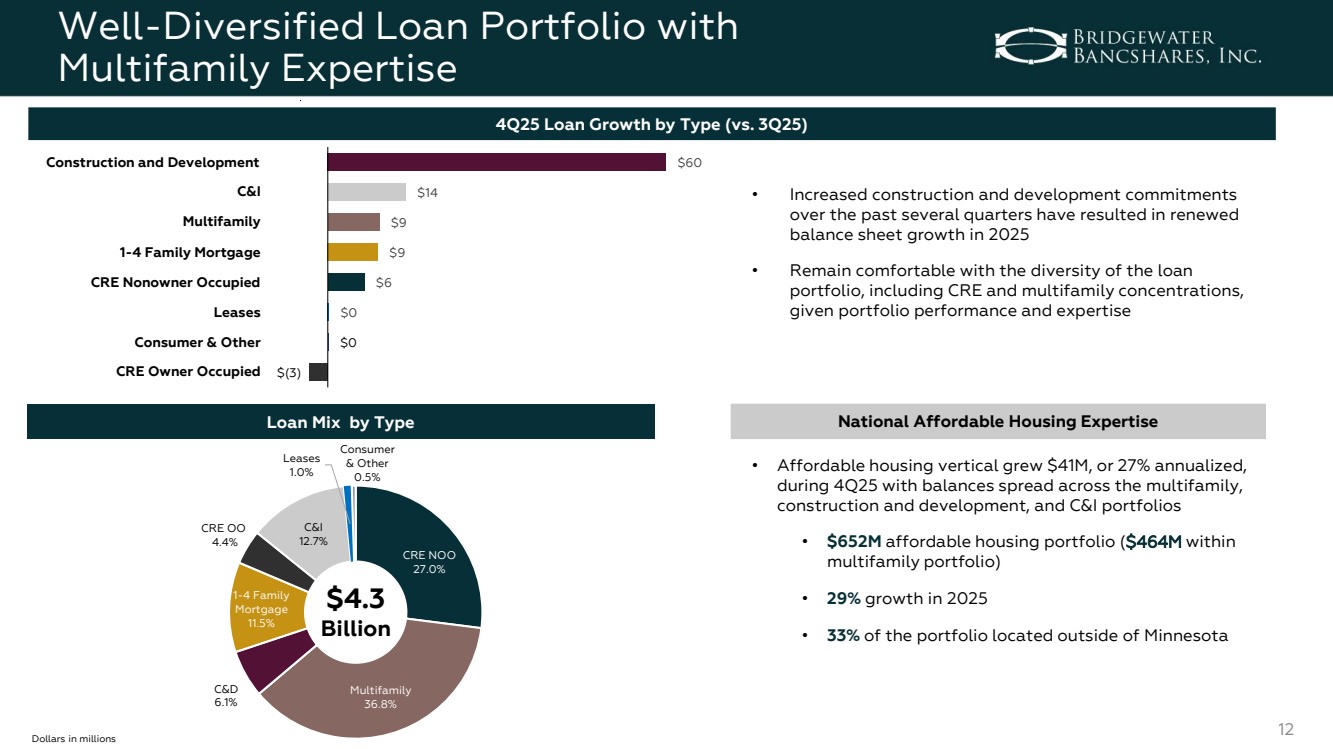
Multifamily | | | 1,587,338 | | | 1,578,223 | | | 1,555,731 | | | 1,534,747 | | | 1,425,610 | |
CRE Owner Occupied | | | 189,754 | | | 192,966 | | | 192,837 | | | 196,080 | | | 191,248 | |
CRE Nonowner Occupied | | | 1,165,104 | | | 1,158,622 | | | 1,137,007 | | | 1,055,157 | | | 1,083,108 | |
Total Real Estate Mortgage Loans | |
| 3,438,338 | |
| 3,417,108 | |
| 3,359,844 | |
| 3,265,445 | |
| 3,174,349 | |
Consumer and Other | | | 19,212 | | | 19,054 | | | 16,346 | | | 14,361 | | | 12,996 | |
Total Loans, Gross | |
| 4,309,517 | |
| 4,214,554 | |
| 4,145,799 | |
| 4,020,076 | |
| 3,868,514 | |
Allowance for Credit Losses on Loans | | | (56,443) | | | (56,390) | | | (55,765) | | | (53,766) | | | (52,277) | |
Net Deferred Loan Fees | | | (8,966) | | | (8,282) | | | (7,629) | | | (7,218) | | | (6,801) | |
Total Loans, Net | | $ | 4,244,108 | | $ | 4,149,882 | | $ | 4,082,405 | | $ | 3,959,092 | | $ | 3,809,436 | |
Total gross loans at December 31, 2025 were $4.31 billion, an increase of $95.0 million, or 8.9% annualized, over total gross loans of $4.21 billion at September 30, 2025, and an increase of $441.0 million, or 11.4%, over total gross loans of $3.87 billion at December 31, 2024.
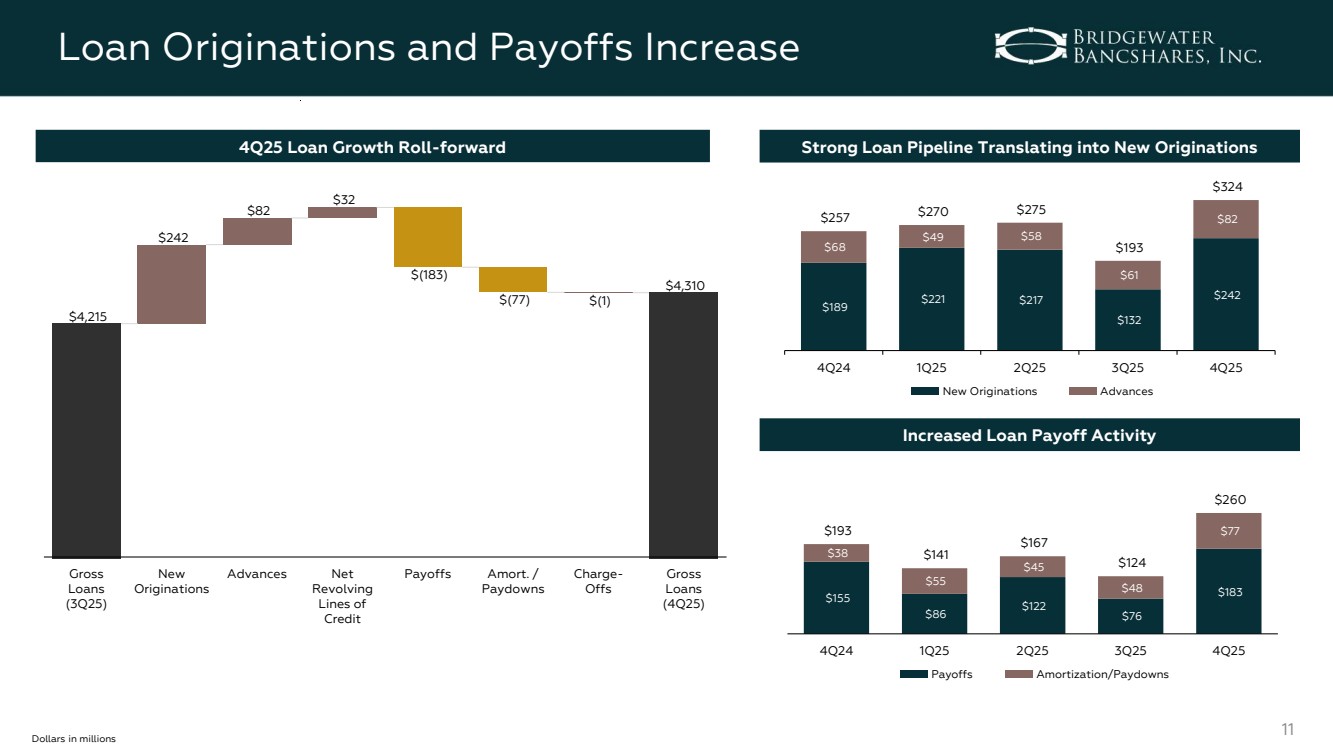
| ● | The increase in the loan portfolio during the fourth quarter of 2025 was due to strong loan originations and advances outpacing the increase in payoffs and paydowns. |
Deposits
(dollars in thousands) | | December 31, 2025 | | September 30, 2025 | | June 30, 2025 | | March 31, 2025 | | December 31, 2024 | | |||||
Noninterest Bearing Transaction Deposits | | $ | 923,070 | | $ | 822,632 | | $ | 787,868 | | $ | 791,528 | | $ | 800,763 | |
Interest Bearing Transaction Deposits | | | 893,740 | | | 860,774 | | | 791,748 | | | 840,378 | | | 862,242 | |
Savings and Money Market Deposits | | | 1,380,922 | | | 1,428,726 | | | 1,441,694 | | | 1,372,191 | | | 1,259,503 | |
Time Deposits | | | 312,154 | | | 346,214 | | | 344,882 | | | 326,821 | | | 338,506 | |
Brokered Deposits | | | 810,483 | | | 834,418 | | | 870,550 | | | 831,539 | | | 825,753 | |
Total Deposits | | $ | 4,320,369 | | $ | 4,292,764 | | $ | 4,236,742 | | $ | 4,162,457 | | $ | 4,086,767 | |
Total deposits at December 31, 2025 were $4.32 billion, an increase of $27.6 million, or 2.6% annualized, over total deposits of $4.29 billion at September 30, 2025, and an increase of $233.6 million, or 5.7%, over total deposits of $4.09 billion at December 31, 2024.
| ● | Core deposits, defined as total deposits excluding brokered deposits and certificates of deposits greater than $250,000, increased $72.6 million, or 8.8% annualized, from September 30, 2025, and increased $244.6 million, or 7.9%, from December 31, 2024. |
| ● | Noninterest bearing deposits increased $100.4 million, or 48.4% annualized, from September 30, 2025, and increased $122.3 million, or 15.3%, from December 31, 2024. Based on the nature of the Company’s client base, noninterest bearing deposit balances can fluctuate from quarter to quarter, as deposit growth is not always linear. |
| ● | Brokered deposits decreased $23.9 million, or 11.4% annualized, from September 30, 2025, and decreased $15.3 million, or 1.8%, from December 31, 2024. While balances are down, brokered deposits continue to be used as a supplemental funding source, as needed. |
Asset Quality
Overall asset quality remained strong due to the Company’s measured risk selection, consistent underwriting standards, active credit oversight, and experienced lending and credit teams.
| ● | Annualized net charge-offs as a percentage of average loans were 0.11% for the fourth quarter of 2025, compared to 0.03% for both the third quarter of 2025 and the fourth quarter of 2024. |
Page 6 of 19
| ● | Net charge-offs as a percentage of average loans for the year ended December 31, 2025 were 0.04%, compared to 0.03% for the year ended December 31, 2024. |
| ● | At December 31, 2025, the Company’s nonperforming assets, which include nonaccrual loans, loans past due 90 days and still accruing, and foreclosed assets, were $22.0 million, or 0.41% of total assets, compared to $10.0 million, or 0.19% of total assets, at September 30, 2025, and $301,000, or 0.01% of total assets, at December 31, 2024. |
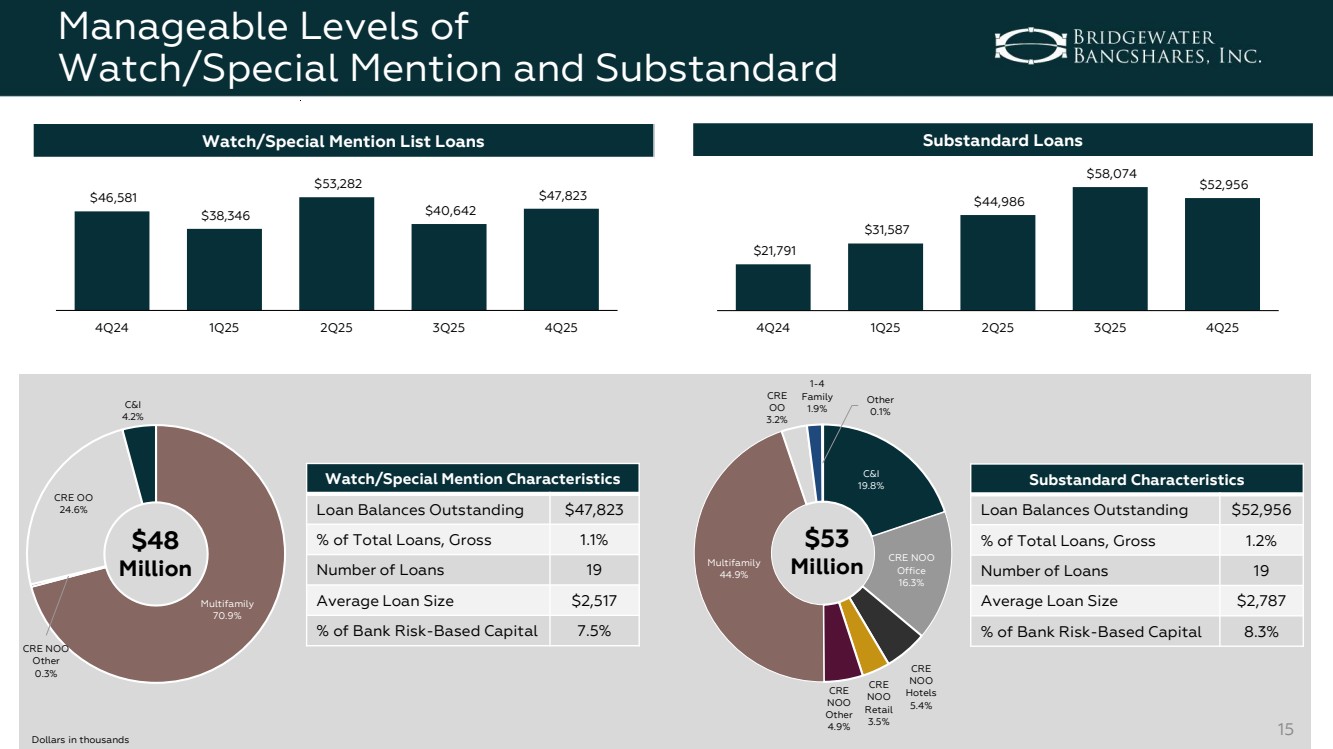
| ● | Loans with potential weaknesses that warranted a watch/special mention risk rating at December 31, 2025 totaled $47.8 million, compared to $40.6 million at September 30, 2025, and $46.6 million at December 31, 2024. |
| ● | Loans that warranted a substandard risk rating at December 31, 2025 totaled $53.0 million, compared to $58.1 million at September 30, 2025, and $21.8 million at December 31, 2024. |
Capital
Total shareholders’ equity at December 31, 2025 was $517.1 million, an increase of $19.6 million, or 15.7% annualized, compared to $497.5 million at September 30, 2025, and an increase of $59.2 million, or 12.9%, over $457.9 million at December 31, 2024.
| ● | The linked-quarter increase was primarily due to net income retained, a decrease in unrealized losses in the securities portfolio, and an increase in unrealized gains in the derivatives portfolio, offset partially by preferred stock dividends. |
| ● | The year-over-year increase was primarily due to net income retained and a decrease in unrealized losses in the securities portfolio, offset partially by a decrease in unrealized gains in the derivatives portfolio, preferred stock dividends, and stock repurchases. |
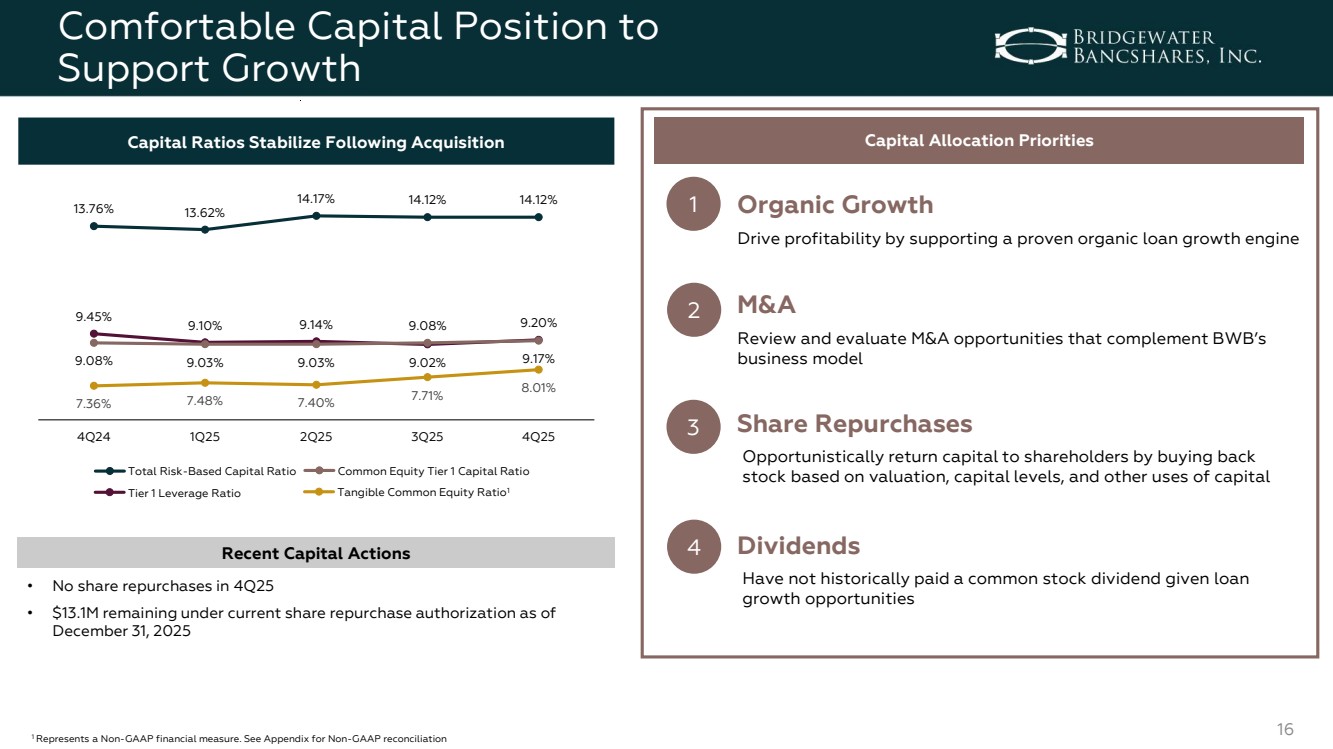
| ● | The Consolidated Common Equity Tier 1 Risk-Based Capital Ratio was 9.17% at December 31, 2025, compared to 9.08% at both September 30, 2025 and December 31, 2024. |
| ● | Tangible common equity as a percentage of tangible assets, a non-GAAP financial measure, was 8.01% at December 31, 2025, compared to 7.71% at September 30, 2025, and 7.36% at December 31, 2024. |
Tangible book value per share, a non-GAAP financial measure, was $15.55 as of December 31, 2025, an increase of 16.5% annualized from $14.93 as of September 30, 2025, and an increase of 15.3% from $13.49 as of December 31, 2024.
The Company did not repurchase any shares of its common stock during the fourth quarter of 2025.
| ● | The Company had $13.1 million remaining under its current share repurchase authorization at December 31, 2025. |
Today, the Company also announced that its Board of Directors has declared a quarterly cash dividend on its 5.875% Non-Cumulative Perpetual Preferred Stock, Series A (“Series A Preferred Stock”). The quarterly cash dividend of $36.72 per share, equivalent to $0.3672 per depositary share, each representing a 1/100th interest in a share of the Series A Preferred Stock (Nasdaq: BWBBP), is payable on March 2, 2026 to shareholders of record of the Series A Preferred Stock at the close of business on February 13, 2026.
Page 7 of 19
Conference Call and Webcast
The Company will host a conference call to discuss its fourth quarter 2025 financial results on Wednesday, January 28, 2026 at 8:00 a.m. Central Time. The conference call can be accessed by dialing 844-481-2913 and requesting to join the Bridgewater Bancshares earnings call. To listen to a replay of the conference call via phone, please dial 855-669-9658 and enter access code 9545199. The replay will be available through February 4, 2026. The conference call will also be available via a live webcast on the Investor Relations section of the Company’s website, investors.bridgewaterbankmn.com, and archived for replay.
About the Company
Bridgewater Bancshares, Inc. (Nasdaq: BWB) is a St. Louis Park, Minnesota-based financial holding company founded in 2005. Its banking subsidiary, Bridgewater Bank, is a premier, full-service bank dedicated to providing responsive support and simple solutions to businesses, entrepreneurs, and successful individuals across the Twin Cities. Bridgewater offers a comprehensive suite of products and services spanning deposits, lending, and treasury management solutions. Bridgewater has also received numerous awards for its banking services and esteemed corporate culture. With total assets of $5.4 billion as of December 31, 2025 and eight strategically located branches, Bridgewater is one of the largest locally-led banks in Minnesota and is committed to being the finest entrepreneurial bank. For more information, please visit www.bridgewaterbankmn.com.
Use of Non-GAAP Financial Measures
In addition to the results presented in accordance with U.S. Generally Accepted Accounting Principles (“GAAP”), the Company routinely supplements its evaluation with an analysis of certain non-GAAP financial measures. The Company believes these non-GAAP financial measures, in addition to the related GAAP measures, provide meaningful information to investors to help them understand the Company’s operating performance and trends, and to facilitate comparisons with the performance of peers. These disclosures should not be viewed as a substitute for operating results determined in accordance with GAAP, nor are they necessarily comparable to non-GAAP performance measures that may be presented by other companies. Reconciliations of non-GAAP disclosures used in this earnings release to the comparable GAAP measures are provided in the accompanying tables.
Forward-Looking Statements
This earnings release contains “forward-looking statements” within the meaning of the safe harbor provisions of the U.S. Private Securities Litigation Reform Act of 1995. Forward-looking statements include, without limitation, statements concerning plans, estimates, calculations, forecasts and projections with respect to the anticipated future performance of the Company. These statements are often, but not always, identified by words such as “may”, “might”, “should”, “could”, “predict”, “potential”, “believe”, “expect”, “continue”, “will”, “anticipate”, “seek”, “estimate”, “intend”, “plan”, “projection”, “would”, “annualized”, “target” and “outlook”, or the negative version of those words or other comparable words of a future or forward-looking nature.
Forward-looking statements are neither historical facts nor assurances of future performance. Instead, they are based only on our current beliefs, expectations and assumptions regarding our business, future plans and strategies, projections, anticipated events and trends, the economy and other future conditions. Because forward-looking statements relate to the future, they are subject to inherent uncertainties, risks and changes in circumstances that are difficult to predict and many of which are outside of our control. Our actual results and financial condition may differ materially from those indicated in the forward-looking statements. Therefore, you should not rely on any of these forward-looking statements. Important factors that could cause our actual results and financial condition to differ materially from those indicated in the forward-looking statements include, among others, the following: interest rate risk, including the effects of changes in interest rates; effects on the U.S. economy resulting from actions taken by the federal government, including the threat or implementation of tariffs, immigration enforcement and changes in foreign policy; fluctuations in the values of the securities held in our securities portfolio, including as the result of changes in interest rates; business and economic conditions generally and in the financial services industry, nationally and within our market area, including the level and impact of inflation, and future monetary policies of the Federal Reserve and executive orders in response thereto, and possible recession; credit risk and risks from concentrations (including by type of borrower, geographic area, collateral and industry) within the Company’s loan portfolio or large loans to certain borrowers (including CRE loans); the overall health of the local and national real estate market; our ability to successfully manage credit risk; our ability to maintain an adequate level of allowance for credit losses on loans; new or revised accounting standards as may be adopted by state and federal regulatory agencies, the Financial Accounting Standards Board, Securities and Exchange Commission or Public Company Accounting Oversight Board; the concentration of large deposits from certain clients, including those who have balances above current Federal Deposit Insurance Corporation insurance limits; our ability to successfully manage liquidity risk, which may increase our dependence on non-core funding sources such as brokered deposits, and negatively
Page 8 of 19
impact our cost of funds; our ability to raise additional capital to implement our business plan; our ability to implement our growth strategy and manage costs effectively; the composition of our senior leadership team and our ability to attract and retain key personnel; talent and labor shortages and employee turnover; the occurrence of fraudulent activity, breaches or failures of our or our third-party vendors’ information security controls or cybersecurity-related incidents, including as a result of sophisticated attacks using artificial intelligence and similar tools or as a result of insider fraud; interruptions involving our information technology and telecommunications systems or third-party servicers; competition in the financial services industry, including from nonbank competitors such as credit unions, “fintech” companies and digital asset service providers; the effectiveness of our risk management framework; rapid technological changes implemented by us and other parties in the financial services industry, including third-party vendors, which may be more difficult to implement or more expensive than anticipated or which may have unforeseen consequence to us and our customers, including the development and implementation of tools incorporating artificial intelligence; the commencement, cost and outcome of litigation and other legal proceedings and regulatory actions against us; the impact of recent and future legislative and regulatory changes, domestic or foreign; risks related to climate change and the negative impact it may have on our customers and their businesses; the imposition of tariffs or other governmental policies impacting the global supply chain and the value of products produced by our commercial borrowers; severe weather, natural disasters, wide spread disease or pandemics, acts of war, military conflicts, or terrorism, changes in foreign relations, or other adverse external events, including ongoing conflicts in the Middle East, the Russian invasion of Ukraine and recent military activities in Venezuela; potential impairment to the goodwill the Company recorded in connection with acquisitions; risks associated with our integration of FMCB, including the possibility that the merger may be more difficult or expensive to integrate than anticipated, and the effect of the merger on the Company’s customer and employee relationships and operating results; changes to U.S. or state tax laws, regulations and governmental policies concerning the Company’s general business, including changes in interpretation or prioritization of such rules and regulations; the impact of bank failures or adverse developments at other banks and related negative publicity about the banking industry in general on investor and depositor sentiment regarding the stability and liquidity of banks; and any other risks described in the “Risk Factors” sections of reports filed by the Company with the Securities and Exchange Commission.
Any forward-looking statement made by us in this press release is based only on information currently available to us and speaks only as of the date on which it is made. The Company undertakes no obligation to publicly update any forward-looking statement, whether written or oral, that may be made from time to time, whether as a result of new information, future developments or otherwise.
Page 9 of 19
Bridgewater Bancshares, Inc. and Subsidiaries
Financial Highlights
(dollars in thousands, except share data)
| | As of and for the Three Months Ended | | |||||||||||||
| | December 31, | | September 30, | | June 30, | | March 31, |
| December 31, |
| |||||
(dollars in thousands) | | 2025 | | 2025 | | 2025 | | 2025 | | 2024 | | |||||
| | | (Unaudited) | | | (Unaudited) | | | (Unaudited) | | | (Unaudited) | | | (Unaudited) | |
Income Statement | | | | | | | | | | | | | | | | |
Net Interest Income | | $ | 35,687 | | $ | 34,091 | | $ | 32,452 | | $ | 30,208 | | $ | 26,967 | |
Provision for Credit Losses | | | 1,450 | | | 1,100 | | | 2,000 | | | 1,500 | | | 2,175 | |
Noninterest Income | | | 3,148 | | | 2,061 | | | 3,627 | | | 2,079 | | | 2,533 | |
Noninterest Expense | | | 20,238 | | | 19,956 | | | 18,941 | | | 18,136 | | | 16,812 | |
Net Income | | | 13,334 | | | 11,601 | | | 11,520 | | | 9,633 | | | 8,204 | |
Net Income Available to Common Shareholders | | | 12,320 | | | 10,588 | | | 10,506 | | | 8,620 | | | 7,190 | |
| | | | | | | | | | | | | | | | |
Per Common Share Data | | | | | | | | | | | | | | | | |
Basic Earnings Per Share | | $ | 0.45 | | $ | 0.38 | | $ | 0.38 | | $ | 0.31 | | $ | 0.26 | |
Diluted Earnings Per Share | | | 0.43 | | | 0.38 | | | 0.38 | | | 0.31 | | | 0.26 | |
Adjusted Diluted Earnings Per Share (1) | | | 0.44 | | | 0.39 | | | 0.37 | | | 0.32 | | | 0.27 | |
Book Value Per Share | | | 16.23 | | | 15.62 | | | 14.92 | | | 14.60 | | | 14.21 | |
Tangible Book Value Per Share (1) | | | 15.55 | | | 14.93 | | | 14.21 | | | 13.89 | | | 13.49 | |
Basic Weighted Average Shares Outstanding | | | 27,641,138 | | | 27,504,840 | | | 27,460,982 | | | 27,568,772 | | | 27,459,433 | |
Diluted Weighted Average Shares Outstanding | | | 28,354,756 | | | 28,190,406 | | | 27,998,008 | | | 28,036,506 | | | 28,055,532 | |
Shares Outstanding at Period End | | | 27,759,970 | | | 27,584,732 | | | 27,470,283 | | | 27,560,150 | | | 27,552,449 | |
| | | | | | | | | | | | | | | | |
Financial Ratios | | | | | | | | | | | | | | | | |
Return on Average Assets (2) | | | 0.97 | % | | 0.86 | % | | 0.90 | % | | 0.77 | % | | 0.68 | % |
Pre-Provision Net Revenue Return on Average Assets (1)(2) | | | 1.35 | | | 1.19 | | | 1.27 | | | 1.13 | | | 1.05 | |
Return on Average Shareholders' Equity (2) | | | 10.38 | | | 9.47 | | | 9.80 | | | 8.39 | | | 7.16 | |
Return on Average Tangible Common Equity (1)(2) | | | 11.53 | | | 10.50 | | | 10.93 | | | 9.22 | | | 7.43 | |
Net Interest Margin (3) | | | 2.75 | | | 2.63 | | | 2.62 | | | 2.51 | | | 2.32 | |
Core Net Interest Margin (1)(3) | | | 2.62 | | | 2.52 | | | 2.49 | | | 2.37 | | | 2.24 | |
Cost of Total Deposits | | | 2.97 | | | 3.19 | | | 3.16 | | | 3.18 | | | 3.40 | |
Cost of Funds | | | 3.07 | | | 3.25 | | | 3.19 | | | 3.17 | | | 3.38 | |
Efficiency Ratio (1) | | | 51.6 | | | 54.7 | | | 52.6 | | | 55.5 | | | 56.8 | |
Noninterest Expense to Average Assets (2) | | | 1.48 | | | 1.47 | | | 1.47 | | | 1.45 | | | 1.40 | |
| | | | | | | | | | | | | | | | |
Adjusted Financial Ratios (1) | | | | | | | | | | | | | | | | |
Adjusted Return on Average Assets (2) | | | 0.99 | % | | 0.88 | % | | 0.88 | % | | 0.80 | % | | 0.71 | % |
Adjusted Pre-Provision Net Revenue Return on Average Assets (2) | | | 1.38 | | | 1.23 | | | 1.31 | | | 1.18 | | | 1.09 | |
Adjusted Return on Average Shareholders' Equity (2) | | | 10.54 | | | 9.77 | | | 9.64 | | | 8.77 | | | 7.49 | |
Adjusted Return on Average Tangible Common Equity (2) | | | 11.72 | | | 10.86 | | | 10.74 | | | 9.68 | | | 7.82 | |
Adjusted Efficiency Ratio | | | 50.7 | | | 53.2 | | | 51.5 | | | 53.7 | | | 55.2 | |
Adjusted Noninterest Expense to Average Assets (2) | | | 1.45 | | | 1.43 | | | 1.43 | | | 1.41 | | | 1.36 | |
| | | | | | | | | | | | | | | | |
Balance Sheet | | | | | | | | | | | | | | | | |
Total Assets | | $ | 5,407,002 | | $ | 5,359,994 | | $ | 5,296,673 | | $ | 5,136,808 | | $ | 5,066,242 | |
Total Loans, Gross | | | 4,309,517 | | | 4,214,554 | | | 4,145,799 | | | 4,020,076 | | | 3,868,514 | |
Deposits | | | 4,320,369 | | | 4,292,764 | | | 4,236,742 | | | 4,162,457 | | | 4,086,767 | |
Total Shareholders' Equity | | | 517,095 | | | 497,463 | | | 476,282 | | | 468,975 | | | 457,935 | |
Loan to Deposit Ratio | | | 99.7 | % | | 98.2 | % | | 97.9 | % | | 96.6 | % | | 94.7 | % |
Core Deposits to Total Deposits (4) | | | 77.6 | | | 76.4 | | | 75.2 | | | 76.2 | | | 76.0 | |
| | | | | | | | | | | | | | | | |
Asset Quality | | | | | | | | | | | | | | | | |
Net Loan Charge-Offs to Average Loans (2) | | | 0.11 | % | | 0.03 | % | | 0.00 | % | | 0.00 | % | | 0.03 | % |
Nonperforming Assets to Total Assets (5) | | | 0.41 | | | 0.19 | | | 0.19 | | | 0.20 | | | 0.01 | |
Allowance for Credit Losses to Total Loans | | | 1.31 | | | 1.34 | | | 1.35 | | | 1.34 | | | 1.35 | |
Page 10 of 19
| | As of and for the Three Months Ended | | |||||||||||||
| | December 31, | | September 30, | | June 30, | | March 31, |
| December 31, | | |||||
(dollars in thousands) | | 2025 | | 2025 | | 2025 | | 2025 | | 2024 | | |||||
| | | (Unaudited) | | | (Unaudited) | | | (Unaudited) | | | (Unaudited) | | | (Unaudited) | |
Capital Ratios (Consolidated) (6) | | | | | | | | | | | | | | | | |
Tier 1 Leverage Ratio | | | 9.20 | % | | 9.02 | % | | 9.14 | % | | 9.10 | % | | 9.45 | % |
Common Equity Tier 1 Risk-based Capital Ratio | | | 9.17 | | | 9.08 | | | 9.03 | | | 9.03 | | | 9.08 | |
Tier 1 Risk-based Capital Ratio | | | 10.57 | | | 10.52 | | | 10.51 | | | 10.55 | | | 10.64 | |
Total Risk-based Capital Ratio | | | 14.12 | | | 14.12 | | | 14.17 | | | 13.62 | | | 13.76 | |
Tangible Common Equity to Tangible Assets (1) | | | 8.01 | | | 7.71 | | | 7.40 | | | 7.48 | | | 7.36 | |
| (1) | Represents a non-GAAP financial measure. See "Non-GAAP Financial Measures" for further details. |
| (2) | Annualized. |
| (3) | Amounts calculated on a tax-equivalent basis using the statutory federal tax rate of 21%. |
| (4) | Core deposits are defined as total deposits less brokered deposits and certificates of deposit greater than $250,000. |
| (5) | Nonperforming assets are defined as nonaccrual loans plus 90 days past due and still accruing plus foreclosed assets. |
| (6) | Preliminary data. Current period subject to change prior to filings with applicable regulatory agencies. |
Page 11 of 19
Bridgewater Bancshares, Inc. and Subsidiaries
Consolidated Balance Sheets
(dollars in thousands, except share data)
| | December 31, | | September 30, | | June 30, | | March 31, |
| December 31, | |||||
| | 2025 | | 2025 | | 2025 | | 2025 | | 2024 | |||||
| | | (Unaudited) | | | (Unaudited) | | | (Unaudited) | | | (Unaudited) | | | |
Assets | | | | | | | | | | | | | | | |
Cash and Cash Equivalents | | $ | 123,511 | | $ | 131,818 | | $ | 217,495 | | $ | 166,205 | | $ | 229,760 |
Bank-Owned Certificates of Deposit | |
| — | |
| 3,658 | |
| 3,897 | |
| 4,139 | |
| 4,377 |
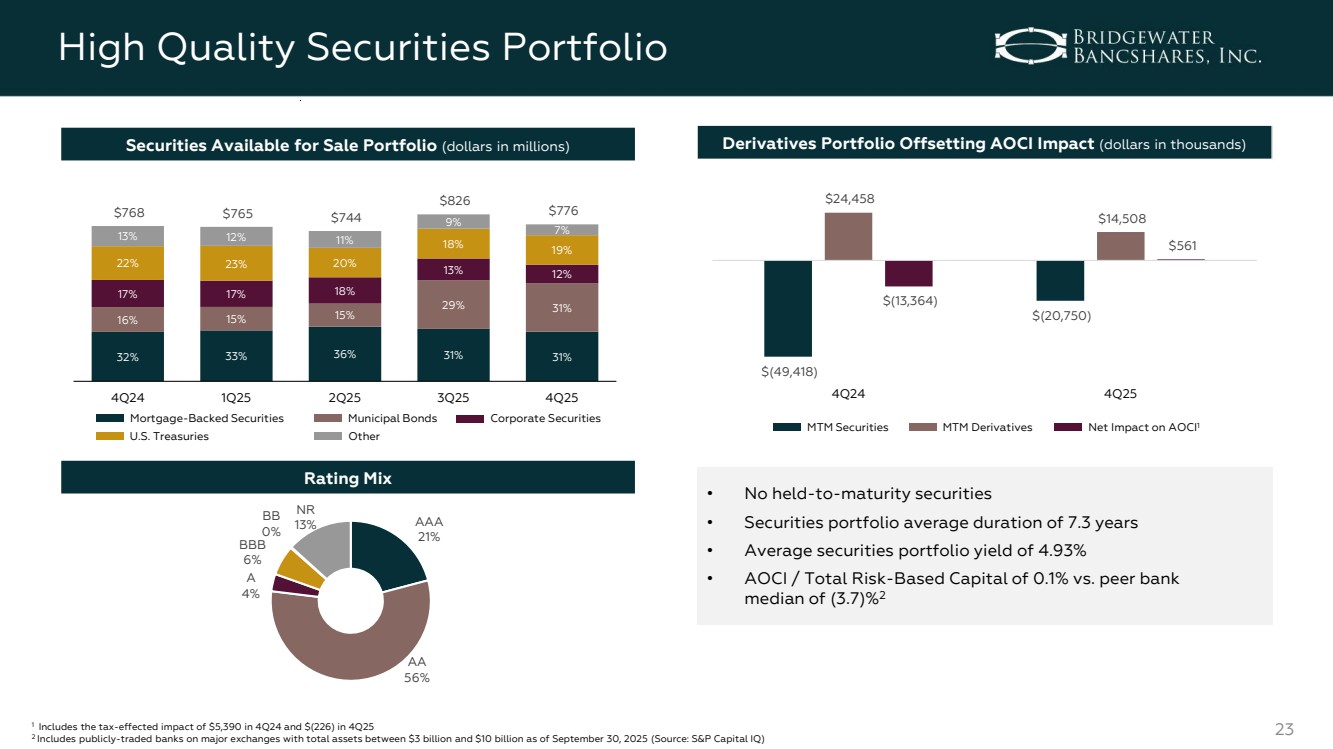
Securities Available for Sale, at Fair Value | |
| 776,441 | |
| 826,473 | |
| 743,889 | |
| 764,626 | |
| 768,247 |
Loans, Net of Allowance for Credit Losses | |
| 4,244,108 | |
| 4,149,882 | | | 4,082,405 | | | 3,959,092 | |
| 3,809,436 |
Federal Home Loan Bank (FHLB) Stock, at Cost | |
| 21,122 | |
| 21,373 | |
| 21,472 | |
| 18,984 | |
| 19,297 |
Premises and Equipment, Net | |
| 51,576 | |
| 50,955 | |
| 49,979 | |
| 49,442 | |
| 49,533 |
Foreclosed Assets | | | — | | | — | | | 185 | | | — | | | — |
Accrued Interest | |
| 18,929 | |
| 19,244 | |
| 17,711 | |
| 17,700 | |
| 17,711 |
Goodwill | |
| 11,982 | |
| 11,982 | |
| 11,982 | |
| 11,982 | |
| 11,982 |
Other Intangible Assets, Net | |
| 6,930 | |
| 7,160 | |
| 7,390 | |
| 7,620 | |
| 7,850 |
Bank-Owned Life Insurance | | | 46,576 | | | 46,121 | | | 45,413 | | | 45,025 | | | 44,646 |
Other Assets | |
| 105,827 | |
| 91,328 | |
| 94,855 | |
| 91,993 | |
| 103,403 |
Total Assets | | $ | 5,407,002 | | $ | 5,359,994 | | $ | 5,296,673 | | $ | 5,136,808 | | $ | 5,066,242 |
| | | | | | | | | | | | | | | |
Liabilities and Equity | |
| | |
| | |
| | |
| | |
| |
Liabilities | |
| | |
| | |
| | |
| | |
| |
Deposits: | |
| | |
| | |
| | |
| | |
| |
Noninterest Bearing | | $ | 923,070 | | $ | 822,632 | | $ | 787,868 | | $ | 791,528 | | $ | 800,763 |
Interest Bearing | |
| 3,397,299 | |
| 3,470,132 | |
| 3,448,874 | |
| 3,370,929 | |
| 3,286,004 |
Total Deposits | |
| 4,320,369 | |
| 4,292,764 | |
| 4,236,742 | |
| 4,162,457 | |
| 4,086,767 |
Notes Payable | |
| — | |
| — | |
| 13,750 | |
| 13,750 | |
| 13,750 |
FHLB Advances | |
| 399,500 | |
| 404,500 | |
| 404,500 | |
| 349,500 | |
| 359,500 |
Subordinated Debentures, Net of Issuance Costs | |
| 108,677 | |
| 108,588 | |
| 108,689 | |
| 79,766 | |
| 79,670 |
Accrued Interest Payable | |
| 3,227 | |
| 5,208 | |
| 4,110 | |
| 4,525 | |
| 4,008 |
Other Liabilities | |
| 58,134 | |
| 51,471 | |
| 52,600 | |
| 57,835 | |
| 64,612 |
Total Liabilities | | | 4,889,907 | | | 4,862,531 | | | 4,820,391 | | | 4,667,833 | | | 4,608,307 |
| | | | | | | | | | | | | | | |
Shareholders' Equity | |
| | |
| | |
| | |
| | |
| |
Preferred Stock- $0.01 par value; Authorized 10,000,000 | | | | | | | | | | | | | | | |
Preferred Stock - Issued and Outstanding 27,600 Series A shares ($2,500 liquidation preference) at December 31, 2025 (unaudited), September 30, 2025 (unaudited), June 30, 2025 (unaudited), March 31, 2025 (unaudited), and December 31, 2024 | |
| 66,514 | |
| 66,514 | | | 66,514 | | | 66,514 | |
| 66,514 |
Common Stock- $0.01 par value; Authorized 75,000,000 | |
| | |
| | |
| | |
| | |
| |
Common Stock - Issued and Outstanding 27,759,970 at December 31, 2025 (unaudited), 27,584,732 at September 30, 2025 (unaudited), 27,470,283 at June 30, 2025 (unaudited), 27,560,150 at March 31, 2025 (unaudited), and 27,552,449 at December 31, 2024 | |
| 278 | |
| 276 | | | 275 | | | 276 | |
| 276 |
Additional Paid-In Capital | |
| 98,287 | |
| 97,101 | |
| 95,174 | |
| 95,503 | |
| 95,088 |
Retained Earnings | |
| 351,455 | |
| 339,135 | |
| 328,547 | |
| 318,041 | |
| 309,421 |
Accumulated Other Comprehensive Gain (Loss) | |
| 561 | |
| (5,563) | |
| (14,228) | |
| (11,359) | |
| (13,364) |
Total Shareholders' Equity | |
| 517,095 | |
| 497,463 | |
| 476,282 | |
| 468,975 | |
| 457,935 |
Total Liabilities and Equity | | $ | 5,407,002 | | $ | 5,359,994 | | $ | 5,296,673 | | $ | 5,136,808 | | $ | 5,066,242 |
Page 12 of 19
Bridgewater Bancshares, Inc. and Subsidiaries
Consolidated Statements of Income
(dollars in thousands, except per share data)
| | Three Months Ended | | Year Ended | |||||||||||||||||
| | December 31, | | September 30, | | June 30, | | March 31, |
| December 31, | | December 31, | | December 31, | |||||||
| | 2025 | | 2025 | | 2025 | | 2025 | | 2024 | | 2025 | | 2024 | |||||||
| | | (Unaudited) | | | (Unaudited) | | | (Unaudited) | | | (Unaudited) | | | (Unaudited) | | | (Unaudited) | | | |
Interest Income | | | | | | | | | | | | | | | | | | | | | |
Loans, Including Fees | | $ | 61,444 | | $ | 60,038 | | $ | 57,888 | | $ | 53,820 | | $ | 51,870 | | $ | 233,190 | | $ | 204,731 |
Investment Securities | |
| 9,720 | |
| 10,371 | |
| 9,200 | |
| 9,397 | |
| 9,109 | |
| 38,688 | |
| 33,927 |
Other | |
| 2,145 | |
| 3,224 | |
| 2,110 | |
| 2,491 | |
| 2,345 | |
| 9,970 | |
| 7,240 |
Total Interest Income | |
| 73,309 | |
| 73,633 | |
| 69,198 | |
| 65,708 | |
| 63,324 | |
| 281,848 | |
| 245,898 |
| | | | | | | | | | | | | | | | | | | | | |
| | | | | | | | | | | | | | | | | | | | | |
Interest Expense | |
| | |
| | |
| | |
| | |
| | |
| | |
| |
Deposits | |
| 32,203 | |
| 34,615 | |
| 32,497 | |
| 32,103 | |
| 32,810 | |
| 131,418 | |
| 128,805 |
Federal Funds Purchased | |
| 5 | |
| — | |
| 16 | |
| — | |
| 42 | |
| 21 | |
| 1,201 |
Notes Payable | |
| — | |
| 106 | |
| 260 | |
| 258 | |
| 275 | |
| 624 | |
| 1,162 |
FHLB Advances | |
| 3,524 | |
| 2,933 | |
| 2,852 | |
| 2,156 | |
| 2,229 | |
| 11,465 | |
| 8,554 |
Subordinated Debentures | |
| 1,890 | |
| 1,888 | |
| 1,121 | |
| 983 | |
| 1,001 | |
| 5,882 | |
| 3,983 |
Total Interest Expense | |
| 37,622 | |
| 39,542 | |
| 36,746 | |
| 35,500 | |
| 36,357 | |
| 149,410 | |
| 143,705 |
| | | | | | | | | | | | | | | | | | | | | |
Net Interest Income | |
| 35,687 | |
| 34,091 | |
| 32,452 | |
| 30,208 | |
| 26,967 | |
| 132,438 | |
| 102,193 |
Provision for Credit Losses | |
| 1,450 | |
| 1,100 | |
| 2,000 | |
| 1,500 | |
| 2,175 | |
| 6,050 | |
| 3,525 |
| | | | | | | | | | | | | | | | | | | | | |
Net Interest Income After Provision for Credit Losses | |
| 34,237 | |
| 32,991 | |
| 30,452 | |
| 28,708 | |
| 24,792 | |
| 126,388 | |
| 98,668 |
| | | | | | | | | | | | | | | | | | | | | |
Noninterest Income | | | | | | | | | | | | | | | | | | | | | |
Customer Service Fees | | | 521 | | | 501 | | | 496 | | | 495 | | | 394 | | | 2,013 | | | 1,475 |
Net Gain on Sales of Securities | | | 80 | | | 59 | | | 474 | | | 1 | | | — | | | 614 | | | 385 |
Net Gain on Sales of Foreclosed Assets | | | — | | | — | | | — | | | — | | | 62 | | | — | | | 62 |
Letter of Credit Fees | | | 668 | | | 383 | | | 323 | | | 455 | | | 849 | | | 1,829 | | | 1,976 |
Debit Card Interchange Fees | | | 178 | | | 173 | | | 152 | | | 137 | | | 145 | | | 640 | | | 593 |
Swap Fees | | | 651 | | | — | | | 938 | | | 42 | | | 521 | | | 1,631 | | | 547 |
Bank-Owned Life Insurance | | | 455 | | | 440 | | | 387 | | | 379 | | | 362 | | | 1,661 | | | 1,327 |
Investment Advisory Fees | | | 227 | | | 208 | | | 213 | | | 325 | | | — | | | 973 | | | — |
FHLB Prepayment Income | | | — | | | — | | | 301 | | | — | | | — | | | 301 | | | — |
Other Income | | | 368 | | | 297 | | | 343 | | | 245 | | | 200 | | | 1,253 | | | 1,003 |
Total Noninterest Income | | | 3,148 | | | 2,061 | | | 3,627 | | | 2,079 | | | 2,533 | | | 10,915 | | | 7,368 |
| | | | | | | | | | | | | | | | | | | | | |
Noninterest Expense | | | | | | | | | | | | | | | | | | | | | |
Salaries and Employee Benefits | | | 12,434 | | | 12,229 | | | 11,363 | | | 11,371 | | | 10,605 | | | 47,397 | | | 39,564 |
Occupancy and Equipment | | | 1,171 | | | 1,266 | | | 1,274 | | | 1,234 | | | 1,181 | | | 4,945 | | | 4,399 |
FDIC Insurance Assessment | | | 770 | | | 775 | | | 750 | | | 450 | | | 609 | | | 2,745 | | | 2,959 |
Data Processing | | | 638 | | | 637 | | | 625 | | | 619 | | | 445 | | | 2,519 | | | 1,697 |
Professional and Consulting Fees | | | 1,404 | | | 1,261 | | | 1,110 | | | 994 | | | 989 | | | 4,769 | | | 3,879 |
Derivative Collateral Fees | | | 237 | | | 309 | | | 372 | | | 451 | | | 426 | | | 1,369 | | | 1,821 |
Information Technology and Telecommunications | | | 976 | | | 973 | | | 971 | | | 971 | | | 877 | | | 3,891 | | | 3,325 |
Marketing and Advertising | | | 718 | | | 658 | | | 435 | | | 327 | | | 479 | | | 2,138 | | | 1,485 |
Intangible Asset Amortization | | | 231 | | | 230 | | | 230 | | | 230 | | | 52 | | | 921 | | | 78 |
Other Expense | | | 1,659 | | | 1,618 | | | 1,811 | | | 1,489 | | | 1,149 | | | 6,577 | | | 4,093 |
Total Noninterest Expense | | | 20,238 | | | 19,956 | | | 18,941 | | | 18,136 | | | 16,812 | | | 77,271 | | | 63,300 |
| | | | | | | | | | | | | | | | | | | | | |
Income Before Income Taxes | | | 17,147 | | | 15,096 | | | 15,138 | | | 12,651 | | | 10,513 | | | 60,032 | | | 42,736 |
Provision for Income Taxes | | | 3,813 | | | 3,495 | | | 3,618 | | | 3,018 | | | 2,309 | | | 13,944 | | | 9,911 |
Net Income | | | 13,334 | | | 11,601 | | | 11,520 | | | 9,633 | | | 8,204 | | | 46,088 | | | 32,825 |
Preferred Stock Dividends | | | (1,014) | | | (1,013) | | | (1,014) | | | (1,013) | | | (1,014) | | | (4,054) | | | (4,054) |
Net Income Available to Common Shareholders | | $ | 12,320 | | $ | 10,588 | | $ | 10,506 | | $ | 8,620 | | $ | 7,190 | | $ | 42,034 | | $ | 28,771 |
| | | | | | | | | | | | | | | | | | | | | |
Earnings Per Share | | | | | | | | | | | | | | | | | | | | | |
Basic | | $ | 0.45 | | $ | 0.38 | | $ | 0.38 | | $ | 0.31 | | $ | 0.26 | | $ | 1.53 | | $ | 1.05 |
Diluted | | | 0.43 | | | 0.38 | | | 0.38 | | | 0.31 | | | 0.26 | | | 1.49 | | | 1.03 |
Page 13 of 19
Bridgewater Bancshares, Inc. and Subsidiaries
Analysis of Average Balances, Yields and Rates
(dollars in thousands, except per share data)
(Unaudited)
| | For the Three Months Ended |
| ||||||||||||||||||||||
| | December 31, 2025 | | September 30, 2025 |
| December 31, 2024 |
| ||||||||||||||||||
| | Average | | Interest | | Yield/ | | Average | | Interest | | Yield/ |
| Average | | Interest | | Yield/ |
| ||||||
(dollars in thousands) | | Balance | | & Fees | | Rate | | Balance | | & Fees | | Rate |
| Balance | | & Fees | | Rate |
| ||||||
Interest Earning Assets: | | | | | | | | | | | | | | | | | | | | | | | | | |
Cash Investments | | $ | 182,129 | | $ | 1,649 | | 3.59 | % | $ | 256,174 | | $ | 2,732 | | 4.23 | % | $ | 181,904 | | $ | 1,968 | | 4.30 | % |
Investment Securities: | | | | | | | | | | | | | | | | | | | | | | | | | |
Taxable Investment Securities | |
| 671,444 | | | 8,001 | | 4.73 | |
| 730,643 | | | 9,448 | | 5.13 | |
| 723,038 | |
| 8,814 | | 4.85 | |
Tax-Exempt Investment Securities (1) | |
| 147,832 | | | 2,177 | | 5.84 | |
| 81,962 | | | 1,168 | | 5.66 | |
| 28,681 | |
| 374 | | 5.19 | |
Total Investment Securities | |
| 819,276 | |
| 10,178 | | 4.93 | |
| 812,605 | |
| 10,616 | | 5.18 | |
| 751,719 | |
| 9,188 | | 4.86 | |
Loans (1)(2) | |
| 4,239,936 | | | 61,746 | | 5.78 | |
| 4,132,987 | | | 60,317 | | 5.79 | |
| 3,730,532 | | | 52,078 | | 5.55 | |
Federal Home Loan Bank Stock | |
| 23,359 | | | 496 | | 8.43 | |
| 21,373 | | | 492 | | 9.12 | |
| 18,686 | | | 377 | | 8.02 | |
Total Interest Earning Assets | |
| 5,264,700 | |
| 74,069 | | 5.58 | % |
| 5,223,139 | |
| 74,157 | | 5.63 | % |
| 4,682,841 | |
| 63,611 | | 5.40 | % |
Noninterest Earning Assets | | | 173,855 | | | | | | | | 149,304 | | | | | | | | 105,195 | | | | | | |
Total Assets | | $ | 5,438,555 | | | | | | | $ | 5,372,443 | | | | | | | $ | 4,788,036 | | | | | | |
| | | | | | | | | | | | | | | | | | | | | | | | | |
Interest Bearing Liabilities: | | | | | | | | | | | | | | | | | | | | | | | | | |
Deposits: | | | | | | | | | | | | | | | | | | | | | | | | | |
Interest Bearing Transaction Deposits | | $ | 891,419 | | $ | 7,912 | | 3.52 | % | $ | 843,905 | | $ | 8,037 | | 3.78 | % | $ | 836,155 | | $ | 8,962 | | 4.26 | % |
Savings and Money Market Deposits | |
| 1,445,588 | | | 12,597 | | 3.46 | |
| 1,473,465 | | | 13,465 | | 3.63 | |
| 1,073,194 | | | 10,795 | | 4.00 | |
Time Deposits | |
| 333,904 | | | 3,282 | | 3.90 | |
| 342,926 | | | 3,703 | | 4.28 | |
| 336,917 | | | 3,650 | | 4.31 | |
Brokered Deposits | |
| 775,750 | | | 8,412 | | 4.30 | |
| 856,516 | | | 9,410 | | 4.36 | |
| 875,015 | | | 9,403 | | 4.27 | |
Total Interest Bearing Deposits | | | 3,446,661 | | | 32,203 | | 3.71 | | | 3,516,812 | | | 34,615 | | 3.90 | | | 3,121,281 | | | 32,810 | | 4.18 | |
Federal Funds Purchased | | | 496 | | | 5 | | 4.22 | |
| — | | | — | | — | |
| 3,290 | | | 42 | | 5.09 | |
Notes Payable | | | — | | | — | | — | |
| 5,679 | | | 106 | | 7.40 | |
| 13,750 | | | 275 | | 7.95 | |
FHLB Advances | | | 449,065 | | | 3,524 | | 3.11 | |
| 404,500 | | | 2,933 | | 2.88 | |
| 347,652 | | | 2,229 | | 2.55 | |
Subordinated Debentures | | | 108,629 | | | 1,890 | | 6.90 | |
| 108,639 | | | 1,888 | | 6.89 | |
| 79,616 | | | 1,001 | | 5.00 | |
Total Interest Bearing Liabilities | |
| 4,004,851 | |
| 37,622 | | 3.73 | % |
| 4,035,630 | |
| 39,542 | | 3.89 | % |
| 3,565,589 | |
| 36,357 | | 4.06 | % |
| | | | | | | | | | | | | | | | | | | | | | | | | |
Noninterest Bearing Liabilities: | | | | | | | | | | | | | | | | | | | | | | | | | |
Noninterest Bearing Transaction Deposits | |
| 854,687 | | | | | | |
| 793,760 | | | | | | |
| 718,227 | | | | | | |
Other Noninterest Bearing Liabilities | | | 69,362 | | | | | | | | 57,184 | | | | | | | | 48,271 | | | | | | |
Total Noninterest Bearing Liabilities | |
| 924,049 | | | | | | |
| 850,944 | | | | | | |
| 766,498 | | | | | | |
Shareholders' Equity | | | 509,655 | | | | | | | | 485,869 | | | | | | | | 455,949 | | | | | | |
Total Liabilities and Shareholders' Equity | | $ | 5,438,555 | | | | | | | $ | 5,372,443 | | | | | | | $ | 4,788,036 | | | | | | |
Net Interest Income / Interest Rate Spread | | | | |
| 36,447 | | 1.86 | % | | | |
| 34,615 | | 1.74 | % | | | |
| 27,254 | | 1.35 | % |
Net Interest Margin (3) | | | | | | | | 2.75 | % | | | | | | | 2.63 | % | | | | | | | 2.32 | % |
Taxable Equivalent Adjustment: | | | | | | | | | | | | | | | | | | | | | | | | | |
Tax-Exempt Investment Securities and Loans | | | | |
| (760) | | | | | | |
| (524) | | | | | | |
| (287) | | | |
Net Interest Income | | | | | $ | 35,687 | | | | | | | $ | 34,091 | | | | | | | $ | 26,967 | | | |
| (1) | Interest income and average rates for tax-exempt investment securities and loans are presented on a tax-equivalent basis, assuming a statutory federal income tax rate of 21%. |
| (2) | Average loan balances include nonaccrual loans. Interest income on loans includes amortization of deferred loan fees, net of deferred loan costs. |
| (3) | Net interest margin includes the tax equivalent adjustment and represents the annualized results of: (i) the difference between interest income on interest earning assets and the interest expense on interest bearing liabilities, divided by (ii) average interest earning assets for the period. |
Page 14 of 19
Bridgewater Bancshares, Inc. and Subsidiaries
Analysis of Average Balances, Yields and Rates
(dollars in thousands, except per share data)
(Unaudited)
| | For the Year Ended |
| ||||||||||||||
| | December 31, 2025 | | December 31, 2024 |
| ||||||||||||
| | Average | | Interest | | Yield/ | | Average | | Interest | | Yield/ | | ||||
(dollars in thousands) | | Balance | | & Fees | | Rate | | Balance | | & Fees | | Rate |
| ||||
Interest Earning Assets: | | | | | | | | | | | | | | | | | |
Cash Investments | | $ | 203,433 | | $ | 8,118 | | 3.99 | % | $ | 124,205 | | $ | 5,690 | | 4.58 | % |
Investment Securities: | | | | | | | | | | | | | | | | | |
Taxable Investment Securities | |
| 726,164 | |
| 35,365 | | 4.87 | |
| 668,012 | |
| 32,681 | | 4.89 | |
Tax-Exempt Investment Securities (1) | |
| 74,649 | |
| 4,207 | | 5.64 | |
| 30,864 | |
| 1,577 | | 5.11 | |
Total Investment Securities | |
| 800,813 | |
| 39,572 | | 4.94 | |
| 698,876 | |
| 34,258 | | 4.90 | |
Loans (1)(2) | | | 4,088,601 | | | 234,164 | | 5.73 | | | 3,738,260 | | | 205,646 | | 5.50 | |
Federal Home Loan Bank Stock | |
| 21,296 | | | 1,852 | | 8.70 | |
| 18,256 | | | 1,550 | | 8.49 | |
Total Interest Earning Assets | |
| 5,114,143 | |
| 283,706 | | 5.55 | % |
| 4,579,597 | |
| 247,144 | | 5.40 | % |
Noninterest Earning Assets | | | 154,410 | | | | | | | | 103,547 | | | | | | |
Total Assets | | $ | 5,268,553 | | | | | | | $ | 4,683,144 | | | | | | |
Interest Bearing Liabilities: | | | | | | | | | | | | | | | | | |
Deposits: | | | | | | | | | | | | | | | | | |
Interest Bearing Transaction Deposits | | $ | 852,426 | | $ | 31,907 | | 3.74 | % | $ | 776,768 | | $ | 34,294 | | 4.41 | % |
Savings and Money Market Deposits | |
| 1,401,187 | | | 50,689 | | 3.62 | |
| 956,300 | | | 39,297 | | 4.11 | |
Time Deposits | |
| 334,003 | | | 13,562 | | 4.06 | |
| 342,582 | | | 14,585 | | 4.26 | |
Brokered Deposits | |
| 825,114 | | | 35,260 | | 4.27 | |
| 963,676 | | | 40,629 | | 4.22 | |
Total Interest Bearing Deposits | | | 3,412,730 | | | 131,418 | | 3.85 | | | 3,039,326 | | | 128,805 | | 4.24 | |
Federal Funds Purchased | |
| 466 | | | 21 | | 4.53 | |
| 21,493 | | | 1,201 | | 5.59 | |
Notes Payable | |
| 8,250 | | | 624 | | 7.57 | |
| 13,750 | | | 1,162 | | 8.45 | |
FHLB Advances | |
| 403,411 | | | 11,465 | | 2.84 | |
| 320,497 | | | 8,554 | | 2.67 | |
Subordinated Debentures | |
| 95,334 | | | 5,882 | | 6.17 | |
| 79,473 | | | 3,983 | | 5.01 | |
Total Interest Bearing Liabilities | |
| 3,920,191 | |
| 149,410 | | 3.81 | % |
| 3,474,539 | |
| 143,705 | | 4.14 | % |
Noninterest Bearing Liabilities: | | | | | | | | | | | | | | | | | |
Noninterest Bearing Transaction Deposits | |
| 799,099 | | | | | | |
| 705,247 | | | | | | |
Other Noninterest Bearing Liabilities | | | 65,435 | | | | | | | | 62,595 | | | | | | |
Total Noninterest Bearing Liabilities | |
| 864,534 | | | | | | |
| 767,842 | | | | | | |
Shareholders' Equity | | | 483,828 | | | | | | | | 440,763 | | | | | | |
Total Liabilities and Shareholders' Equity | | $ | 5,268,553 | | | | | | | $ | 4,683,144 | | | | | | |
Net Interest Income / Interest Rate Spread | | | | |
| 134,296 | | 1.74 | % | | | |
| 103,439 | | 1.26 | % |
Net Interest Margin (3) | | | | | | | | 2.63 | % | | | | | | | 2.26 | % |
Taxable Equivalent Adjustment: | | | | | | | | | | | | | | | | | |
Tax-Exempt Investment Securities and Loans | | | | |
| (1,858) | | | | | | |
| (1,246) | | | |
Net Interest Income | | | | | $ | 132,438 | | | | | | | $ | 102,193 | | | |
| (1) | Interest income and average rates for tax-exempt investment securities and loans are presented on a tax-equivalent basis, assuming a statutory federal income tax rate of 21%. |
| (2) | Average loan balances include nonaccrual loans. Interest income on loans includes amortization of deferred loan fees, net of deferred loan costs. |
| (3) | Net interest margin includes the tax equivalent adjustment and represents the annualized results of: (i) the difference between interest income on interest earning assets and the interest expense on interest bearing liabilities, divided by (ii) average interest earning assets for the period. |
Page 15 of 19
Bridgewater Bancshares, Inc. and Subsidiaries
Asset Quality Summary
(unaudited)
| | As of and for the Three Months Ended | | As of and for the Year Ended | | |||||||||||||||||
| | December 31, | | September 30, | | June 30, | | March 31, |
| December 31, |
| December 31, | | December 31, | | |||||||
(dollars in thousands) | | 2025 | | 2025 | | 2025 | | 2025 | | 2024 | | 2025 | | 2024 | | |||||||
Allowance for Credit Losses | | | | | | | | | | | | | | | | | | | | | | |
Balance at Beginning of Period | | $ | 56,390 | | $ | 55,765 | | $ | 53,766 | | $ | 52,277 | | $ | 51,018 | | $ | 52,277 | | $ | 50,494 | |
Day 1 PCD Allowance | | | — | | | — | | | — | | | — | | | 114 | | | — | | | 114 | |
Provision for Credit Losses(1) | | | 1,250 | | | 900 | | | 2,000 | | | 1,500 | | | 1,450 | | | 5,650 | | | 2,900 | |
Charge-offs | | | (1,259) | | | (276) | | | (6) | | | (12) | | | (317) | | | (1,553) | | | (1,266) | |
Recoveries | | | 62 | | | 1 | | | 5 | | | 1 | | | 12 | | | 69 | | | 35 | |
Net Charge-offs | | | (1,197) | | | (275) | | | (1) | | | (11) | | | (305) | | | (1,484) | | | (1,231) | |
Balance at End of Period | | $ | 56,443 | | $ | 56,390 | | $ | 55,765 | | $ | 53,766 | | $ | 52,277 | | $ | 56,443 | | $ | 52,277 | |
Allowance for Credit Losses to Total Loans | | | 1.31 | % | | 1.34 | % | | 1.35 | % | | 1.34 | % | | 1.35 | % | | 1.31 | % | | 1.35 | % |
| (1) | Includes a day 1 provision for credit losses for non-PCD loans acquired in the FMCB transaction of $950,000 for the three and twelve months ended December 31, 2024. |
| | As of and for the Three Months Ended | | As of and for the Year Ended | |||||||||||||||||
| | December 31, | | September 30, | | June 30, | | March 31, |
| December 31, | | December 31, | | December 31, | |||||||
(dollars in thousands) | | 2025 | | 2025 | | 2025 | | 2025 | | 2024 | | 2025 | | 2024 | |||||||
Provision for Credit Losses on Loans and Leases | | $ | 1,250 | | $ | 900 | | $ | 2,000 | | $ | 1,500 | | $ | 1,450 | | $ | 5,650 | | $ | 2,900 |
Provision for Credit Losses for Off-Balance Sheet Credit Exposures | | | 200 | | | 200 | | | — | | | — | | | 725 | | | 400 | | | 625 |
Provision for Credit Losses | | $ | 1,450 | | $ | 1,100 | | $ | 2,000 | | $ | 1,500 | | $ | 2,175 | | $ | 6,050 | | $ | 3,525 |
| | As of and for the Three Months Ended | | |||||||||||||
| | December 31, | | September 30, | | June 30, | | March 31, |
| December 31, | | |||||
(dollars in thousands) | | 2025 | | 2025 | | 2025 | | 2025 | | 2024 | | |||||
Selected Asset Quality Data | | | | | | | | | | | | | | | | |
Loans 30-89 Days Past Due | | $ | 968 | | $ | 2,906 | | $ | 12,492 | | $ | 466 | | $ | 1,291 | |
Loans 30-89 Days Past Due to Total Loans | | | 0.02 | % | | 0.07 | % | | 0.30 | % | | 0.01 | % | | 0.03 | % |
Nonperforming Loans | | $ | 22,034 | | $ | 9,991 | | $ | 10,134 | | $ | 10,290 | | $ | 301 | |
Nonperforming Loans to Total Loans | | | 0.51 | % | | 0.24 | % | | 0.24 | % | | 0.26 | % | | 0.01 | % |
Nonaccrual Loans to Total Loans | | | 0.51 | | | 0.24 | | | 0.24 | | | 0.26 | | | 0.01 | |
Nonaccrual Loans and Loans Past Due 90 Days and Still Accruing to Total Loans | | | 0.51 | | | 0.24 | | | 0.24 | | | 0.26 | | | 0.01 | |
Foreclosed Assets | | $ | — | | $ | — | | $ | 185 | | $ | — | | $ | — | |
Nonperforming Assets (1) | | | 22,034 | | | 9,991 | | | 10,319 | | | 10,290 | | | 301 | |
Nonperforming Assets to Total Assets (1) | | | 0.41 | % | | 0.19 | % | | 0.19 | % | | 0.20 | % | | 0.01 | % |
Net Loan Charge-Offs (Annualized) to Average Loans | | | 0.11 | | | 0.03 | | | 0.00 | | | 0.00 | | | 0.03 | |
Watchlist/Special Mention Risk Rating Loans | | $ | 47,823 | | $ | 40,642 | | $ | 53,282 | | $ | 38,346 | | $ | 46,581 | |
Substandard Risk Rating Loans | | | 52,956 | | | 58,074 | | | 44,986 | | | 31,587 | | | 21,791 | |
| (1) | Nonperforming assets are defined as nonaccrual loans plus 90 days past due and still accruing plus foreclosed assets. |
Page 16 of 19
Bridgewater Bancshares, Inc. and Subsidiaries
Non-GAAP Financial Measures
(unaudited)
| | For the Three Months Ended | | For the Year Ended | | |||||||||||||||||
| | December 31, | | September 30, | | June 30, | | March 31, |
| December 31, | | December 31, | | December 31, | | |||||||
(dollars in thousands) | | 2025 | | 2025 | | 2025 | | 2025 | | 2024 | | 2025 | | 2024 | | |||||||
Pre-Provision Net Revenue | | | | | | | | | | | | | | | | | | | | | | |
Noninterest Income | | $ | 3,148 | | $ | 2,061 | | $ | 3,627 | | $ | 2,079 | | $ | 2,533 | | $ | 10,915 | | $ | 7,368 | |
Less: Gain on Sales of Securities | | | (80) | | | (59) | | | (474) | | | (1) | | | — | | | (614) | | | (385) | |
Less: FHLB Advance Prepayment Income | | | — | | | — | | | (301) | | | — | | | — | | | (301) | | | — | |
Total Operating Noninterest Income | | | 3,068 | | | 2,002 | | | 2,852 | | | 2,078 | | | 2,533 | | | 10,000 | | | 6,983 | |
Plus: Net Interest Income | | | 35,687 | | | 34,091 | | | 32,452 | | | 30,208 | | | 26,967 | | | 132,438 | | | 102,193 | |
Net Operating Revenue | | $ | 38,755 | | $ | 36,093 | | $ | 35,304 | | $ | 32,286 | | $ | 29,500 | | $ | 142,438 | | $ | 109,176 | |
| | | | | | | | | | | | | | | | | | | | | | |
Noninterest Expense | | $ | 20,238 | | $ | 19,956 | | $ | 18,941 | | $ | 18,136 | | $ | 16,812 | | $ | 77,271 | | $ | 63,300 | |
Total Operating Noninterest Expense | | $ | 20,238 | | $ | 19,956 | | $ | 18,941 | | $ | 18,136 | | $ | 16,812 | | $ | 77,271 | | $ | 63,300 | |
| | | | | | | | | | | | | | | | | | | | | | |
Pre-Provision Net Revenue | | $ | 18,517 | | $ | 16,137 | | $ | 16,363 | | $ | 14,150 | | $ | 12,688 | | $ | 65,167 | | $ | 45,876 | |
| | | | | | | | | | | | | | | | | | | | | | |
Plus: | | | | | | | | | | | | | | | | | | | | | | |
Non-Operating Revenue Adjustments | | | 80 | | | 59 | | | 775 | | | 1 | | | — | | | 915 | | | 385 | |
Less: | | | | | | | | | | | | | | | | | | | | | | |
Provision for Credit Losses | | | 1,450 | | | 1,100 | | | 2,000 | | | 1,500 | | | 2,175 | | | 6,050 | | | 3,525 | |
Provision for Income Taxes | | | 3,813 | | | 3,495 | | | 3,618 | | | 3,018 | | | 2,309 | | | 13,944 | | | 9,911 | |
Net Income | | $ | 13,334 | | $ | 11,601 | | $ | 11,520 | | $ | 9,633 | | $ | 8,204 | | $ | 46,088 | | $ | 32,825 | |
| | | | | | | | | | | | | | | | | | | | | | |
Average Assets | | $ | 5,438,555 | | $ | 5,372,443 | | $ | 5,162,182 | | $ | 5,071,446 | | $ | 4,788,036 | | $ | 5,268,553 | | $ | 4,683,144 | |
Pre-Provision Net Revenue Return on Average Assets | | | 1.35 | % | | 1.19 | % | | 1.27 | % | | 1.13 | % | | 1.05 | % | | 1.24 | % | | 0.98 | % |
| | | | | | | | | | | | | | | | | | | | | | |
Adjusted Pre-Provision Net Revenue | | | | | | | | | | | | | | | | | | | | | | |
Net Operating Revenue | | $ | 38,755 | | $ | 36,093 | | $ | 35,304 | | $ | 32,286 | | $ | 29,500 | | $ | 142,438 | | $ | 109,176 | |
| | | | | | | | | | | | | | | | | | | | | | |
Noninterest Expense | | $ | 20,238 | | $ | 19,956 | | $ | 18,941 | | $ | 18,136 | | $ | 16,812 | | $ | 77,271 | | $ | 63,300 | |
Less: Merger-related Expenses | | | (346) | | | (530) | | | (540) | | | (565) | | | (488) | | | (1,981) | | | (712) | |
Adjusted Total Operating Noninterest Expense | | $ | 19,892 | | $ | 19,426 | | $ | 18,401 | | $ | 17,571 | | $ | 16,324 | | $ | 75,290 | | $ | 62,588 | |
| | | | | | | | | | | | | | | | | | | | | | |
Adjusted Pre-Provision Net Revenue | | $ | 18,863 | | $ | 16,667 | | $ | 16,903 | | $ | 14,715 | | $ | 13,176 | | $ | 67,148 | | $ | 46,588 | |
Adjusted Pre-Provision Net Revenue Return on Average Assets | | | 1.38 | % | | 1.23 | % | | 1.31 | % | | 1.18 | % | | 1.09 | % | | 1.27 | % | | 0.99 | % |
| | | | | | | | | | | | | | | | | | | | | | |
Core Net Interest Margin | | | | | | | | | | | | | | | | | | | | | | |
Net Interest Income (Tax-equivalent Basis) |
| $ | 36,447 | | $ | 34,614 | | $ | 32,770 | | $ | 30,464 | | $ | 27,254 | | $ | 134,296 | | $ | 103,440 | |
Less: | | | | | | | | | | | | | | | | | | | | | | |
Loan Fees | | | (1,041) | | | (966) | | | (1,019) | | | (719) | | | (747) | | | (3,745) | | | (3,090) | |
Purchase Accounting Accretion: | | | | | | | | | | | | | | | | | | | | | | |
Loan Accretion | | | (546) | | | (380) | | | (425) | | | (342) | | | — | | | (1,693) | | | — | |
Bond Accretion | | | (33) | | | (89) | | | (152) | | | (578) | | | (91) | | | (852) | | | (91) | |
Bank-Owned Certificates of Deposit Accretion | | | (16) | | | (6) | | | (4) | | | (7) | | | — | | | (33) | | | — | |
Deposit Certificates of Deposit Accretion | | | — | | | (13) | | | (37) | | | (38) | | | — | | | (88) | | | — | |
Total Purchase Accounting Accretion | | | (595) | | | (488) | | | (618) | | | (965) | | | (91) | | | (2,666) | | | (91) | |
Core Net Interest Income (Tax-equivalent Basis) | | $ | 34,811 | | $ | 33,160 | | $ | 31,133 | | $ | 28,780 | | $ | 26,416 | | $ | 127,885 | | $ | 100,259 | |
| | | | | | | | | | | | | | | | | | | | | | |
Average Interest Earning Assets | | $ | 5,264,700 | | $ | 5,223,139 | | $ | 5,019,058 | | $ | 4,928,283 | | $ | 4,682,841 | | $ | 5,114,143 | | $ | 4,579,597 | |
Core Net Interest Margin | | | 2.62 | % | | 2.52 | % | | 2.49 | % | | 2.37 | % |
| 2.24 | % |
| 2.50 | % |
| 2.19 | % |
| | | | | | | | | | | | | | | | | | | | | | |
Core Loan Yield | | | | | | | | | | | | | | | | | | | | | | |
Loan Interest Income (Tax-equivalent Basis) | | $ | 61,746 | | $ | 60,317 | | $ | 58,122 | | $ | 53,979 | | $ | 52,078 | | $ | 234,164 | | $ | 205,646 | |
Less: | | | | | | | | | | | | | | | | | | | | | | |
Loan Fees | | | (1,041) | | | (966) | | | (1,019) | | | (719) | | | (747) | | | (3,745) | | | (3,090) | |
Loan Accretion | | | (546) | | | (380) | | | (425) | | | (342) | | | — | | | (1,693) | | | — | |
Core Loan Interest Income | | $ | 60,159 | | $ | 58,971 | | $ | 56,678 | | $ | 52,918 | | $ | 51,331 | | $ | 228,726 | | $ | 202,556 | |
| | | | | | | | | | | | | | | | | | | | | | |
Average Loans | | $ | 4,239,936 | | $ | 4,132,987 | | $ | 4,064,540 | | $ | 3,899,258 | | $ | 3,730,532 | | $ | 4,088,601 | | $ | 3,738,260 | |
Core Loan Yield | | | 5.63 | % |
| 5.66 | % |
| 5.59 | % | | 5.50 | % |
| 5.47 | % |
| 5.59 | % |
| 5.42 | % |
Page 17 of 19
Bridgewater Bancshares, Inc. and Subsidiaries
Non-GAAP Financial Measures
(unaudited)
| | For the Three Months Ended | | For the Year Ended | | |||||||||||||||||
| | December 31, | | September 30, | | June 30, | | March 31, | | December 31, | | December 31, | | December 31, | | |||||||
(dollars in thousands) | | 2025 | | 2025 | | 2025 | | 2025 | | 2024 | | 2025 | | 2024 | | |||||||
Efficiency Ratio | | | | | | | | | | | | | | | | | | | | | | |
Noninterest Expense |
| $ | 20,238 | | $ | 19,956 | | $ | 18,941 | | $ | 18,136 | | $ | 16,812 | | $ | 77,271 | | $ | 63,300 | |
Less: Amortization of Intangible Assets | | | (231) | | | (230) | | | (230) | | | (230) | | | (52) | | | (921) | | | (78) | |
Adjusted Noninterest Expense | | $ | 20,007 | | $ | 19,726 | | $ | 18,711 | | $ | 17,906 | | $ | 16,760 | | $ | 76,350 | | $ | 63,222 | |
| | | | | | | | | | | | | | | | | | | | | | |
Net Interest Income | | $ | 35,687 | | $ | 34,091 | | $ | 32,452 | | $ | 30,208 | | $ | 26,967 | | $ | 132,438 | | $ | 102,193 | |
Noninterest Income | | | 3,148 | | | 2,061 | | | 3,627 | | | 2,079 | | | 2,533 | | | 10,915 | | | 7,368 | |
Less: Gain on Sales of Securities | | | (80) | | | (59) | | | (474) | | | (1) | | | — | | | (614) | | | (385) | |
Adjusted Operating Revenue | | $ | 38,755 | | $ | 36,093 | | $ | 35,605 | | $ | 32,286 | | $ | 29,500 | | $ | 142,739 | | $ | 109,176 | |
Efficiency Ratio | |
| 51.6 | % |
| 54.7 | % |
| 52.6 | % |
| 55.5 | % |
| 56.8 | % |
| 53.5 | % |
| 57.9 | % |
| | | | | | | | | | | | | | | | | | | | | | |
Adjusted Efficiency Ratio | | | | | | | | | | | | | | | | | | | | | | |
Noninterest Expense | | $ | 20,238 | | $ | 19,956 | | $ | 18,941 | | $ | 18,136 | | $ | 16,812 | | $ | 77,271 | | $ | 63,300 | |
Less: Amortization of Intangible Assets | | | (231) | | | (230) | | | (230) | | | (230) | | | (52) | | | (921) | | | (78) | |
Less: Merger-related Expenses | | | (346) | | | (530) | | | (540) | | | (565) | | | (488) | | | (1,981) | | | (712) | |
Adjusted Noninterest Expense | | $ | 19,661 | | $ | 19,196 | | $ | 18,171 | | $ | 17,341 | | $ | 16,272 | | $ | 74,369 | | $ | 62,510 | |
| | | | | | | | | | | | | | | | | | | | | | |
Net Interest Income | | $ | 35,687 | | $ | 34,091 | | $ | 32,452 | | $ | 30,208 | | $ | 26,967 | | $ | 132,438 | | $ | 102,193 | |
Noninterest Income | | | 3,148 | | | 2,061 | | | 3,627 | | | 2,079 | | | 2,533 | | | 10,915 | | | 7,368 | |
Less: Gain on Sales of Securities | | | (80) | | | (59) | | | (474) | | | (1) | | | — | | | (614) | | | (385) | |
Less: FHLB Advance Prepayment Income | | | — | | | — | | | (301) | | | — | | | — | | | (301) | | | — | |
Adjusted Operating Revenue | | $ | 38,755 | | $ | 36,093 | | $ | 35,304 | | $ | 32,286 | | $ | 29,500 | | $ | 142,438 | | $ | 109,176 | |
Adjusted Efficiency Ratio | |
| 50.7 | % |
| 53.2 | % |
| 51.5 | % |
| 53.7 | % |
| 55.2 | % |
| 52.2 | % |
| 57.3 | % |
| | | | | | | | | | | | | | | | | | | | | | |
Adjusted Noninterest Expense to Average Assets (Annualized) | | | | | | | | | | | | | | | | | | | | | | |
Noninterest Expense | | $ | 20,238 | | $ | 19,956 | | $ | 18,941 | | $ | 18,136 | | $ | 16,812 | | $ | 77,271 | | $ | 63,300 | |
Less: Merger-related Expenses | | | (346) | | | (530) | | | (540) | | | (565) | | | (488) | | | (1,981) | | | (712) | |
Adjusted Noninterest Expense | | $ | 19,892 | | $ | 19,426 | | $ | 18,401 | | $ | 17,571 | | $ | 16,324 | | $ | 75,290 | | $ | 62,588 | |
| | | | | | | | | | | | | | | | | | | | | | |
Average Assets | | $ | 5,438,555 | | $ | 5,372,443 | | $ | 5,162,182 | | $ | 5,071,446 | | $ | 4,788,036 | | $ | 5,268,553 | | $ | 4,683,144 | |
Adjusted Noninterest Expense to Average Assets (Annualized) | | | 1.45 | % | | 1.43 | % | | 1.43 | % | | 1.41 | % | | 1.36 | % | | 1.43 | % | | 1.34 | % |
| | | | | | | | | | | | | | | | | | | | | | |
Tangible Common Equity and Tangible Common Equity/Tangible Assets | | | | | | | | | | | | | | | | | | | | | | |
Total Shareholders' Equity | | $ | 517,095 | | $ | 497,463 | | $ | 476,282 | | $ | 468,975 | | $ | 457,935 | | | | | | | |
Less: Preferred Stock | | | (66,514) | | | (66,514) | | | (66,514) | | | (66,514) | | | (66,514) | | | | | | | |
Total Common Shareholders' Equity | | | 450,581 | | | 430,949 | | | 409,768 | | | 402,461 | | | 391,421 | | | | | | | |
Less: Intangible Assets | | | (18,912) | | | (19,142) | | | (19,372) | | | (19,602) | | | (19,832) | | | | | | | |
Tangible Common Equity | | $ | 431,669 | | $ | 411,807 | | $ | 390,396 | | $ | 382,859 | | $ | 371,589 | | | | | | | |
| | | | | | | | | | | | | | | | | | | | | | |
Total Assets | | $ | 5,407,002 | | $ | 5,359,994 | | $ | 5,296,673 | | $ | 5,136,808 | | $ | 5,066,242 | | | | | | | |
Less: Intangible Assets | | | (18,912) | | | (19,142) | | | (19,372) | | | (19,602) | | | (19,832) | | | | | | | |
Tangible Assets | | $ | 5,388,090 | | $ | 5,340,852 | | $ | 5,277,301 | | $ | 5,117,206 | | $ | 5,046,410 | | | | | | | |
Tangible Common Equity/Tangible Assets | |
| 8.01 | % |
| 7.71 | % |
| 7.40 | % |
| 7.48 | % |
| 7.36 | % | | | | | | |
| | | | | | | | | | | | | | | | | | | | | | |
Tangible Book Value Per Share | | | | | | | | | | | | | | | | | | | | | | |
Book Value Per Common Share | | $ | 16.23 | | $ | 15.62 | | $ | 14.92 | | $ | 14.60 | | $ | 14.21 | | | | | | | |
Less: Effects of Intangible Assets | | | (0.68) | | | (0.69) | | | (0.71) | | | (0.71) | | | (0.72) | | | | | | | |
Tangible Book Value Per Common Share | | $ | 15.55 | | $ | 14.93 | | $ | 14.21 | | $ | 13.89 | | $ | 13.49 | | | | | | | |
| | | | | | | | | | | | | | | | | | | | | | |
Return on Average Tangible Common Equity | | | | | | | | | | | | | | | | | | | | | | |
Net Income Available to Common Shareholders | | $ | 12,320 | | $ | 10,588 | | $ | 10,506 | | $ | 8,620 | | $ | 7,190 | | $ | 42,034 | | $ | 28,771 | |
| | | | | | | | | | | | | | | | | | | | | | |
Average Shareholders' Equity | | $ | 509,655 | | $ | 485,869 | | $ | 471,700 | | $ | 465,408 | | $ | 455,949 | | $ | 483,828 | | $ | 440,763 | |
Less: Average Preferred Stock | | | (66,514) | | | (66,514) | | | (66,514) | | | (66,514) | | | (66,514) | | | (66,514) | | | (66,514) | |
Average Common Equity | | | 443,141 | | | 419,355 | | | 405,186 | | | 398,894 | | | 389,435 | | | 417,314 | | | 374,249 | |
Less: Effects of Average Intangible Assets | | | (19,042) | | | (19,274) | | | (19,504) | | | (19,738) | | | (4,412) | | | (19,387) | | | (3,207) | |
Average Tangible Common Equity | | $ | 424,099 | | $ | 400,081 | | $ | 385,682 | | $ | 379,156 | | $ | 385,023 | | $ | 397,927 | | $ | 371,042 | |
Return on Average Tangible Common Equity | | | 11.53 | % | | 10.50 | % | | 10.93 | % | | 9.22 | % | | 7.43 | % | | 10.56 | % | | 7.75 | % |
Page 18 of 19
Bridgewater Bancshares, Inc. and Subsidiaries
Non-GAAP Financial Measures
(unaudited)
| | For the Three Months Ended | | For the Year Ended | | |||||||||||||||||
| | December 31, | | September 30, | | June 30, | | March 31, | | December 31, | | December 31, | | December 31, | | |||||||
(dollars in thousands) | | 2025 | | 2025 | | 2025 | | 2025 | | 2024 | | 2025 | | 2024 | | |||||||
Adjusted Diluted Earnings Per Common Share | | | | | | | | | | | | | | | | | | | | | | |
Net Income Available to Common Shareholders | | $ | 12,320 | | $ | 10,588 | | $ | 10,506 | | $ | 8,620 | | $ | 7,190 | | $ | 42,034 | | $ | 28,771 | |
| | | | | | | | | | | | | | | | | | | | | | |
Add: Merger-related Expenses | | | 346 | | | 530 | | | 540 | | | 565 | | | 488 | | | 1,981 | | | 712 | |
Less: FHLB Advance Prepayment Income | | | — | | | — | | | (301) | | | — | | | — | | | (301) | | | — | |
Less: Gain on Sales of Securities | | | (80) | | | (59) | | | (474) | | | (1) | | | — | | | (614) | | | (385) | |
Total Adjustments | | | 266 | | | 471 | | | (235) | | | 564 | | | 488 | | | 1,066 | | | 327 | |
Less: Tax Impact of Adjustments | | | (59) | | | (110) | | | 56 | | | (135) | | | (107) | | | (247) | | | (76) | |
Adjusted Net Income Available to Common Shareholders | | $ | 12,527 | | $ | 10,949 | | $ | 10,327 | | $ | 9,049 | | $ | 7,571 | | $ | 42,853 | | $ | 29,022 | |
| | | | | | | | | | | | | | | | | | | | | | |
Diluted Weighted Average Shares Outstanding | | | 28,354,756 | | | 28,190,406 | | | 27,998,008 | | | 28,036,506 | | | 28,055,532 | | | 28,169,857 | | | 27,943,343 | |
Adjusted Diluted Earnings Per Common Share | | $ | 0.44 | | $ | 0.39 | | $ | 0.37 | | $ | 0.32 | | $ | 0.27 | | $ | 1.52 | | $ | 1.04 | |
| | | | | | | | | | | | | | | | | | | | | | |
Adjusted Return on Average Assets | | | | | | | | | | | | | | | | | | | | | | |
Net Income | | $ | 13,334 | | $ | 11,601 | | $ | 11,520 | | $ | 9,633 | | $ | 8,204 | | $ | 46,088 | | $ | 32,825 | |
Add: Total Adjustments | | | 266 | | | 471 | | | (235) | | | 564 | | | 488 | | | 1,066 | | | 327 | |
Less: Tax Impact of Adjustments | | | (59) | | | (110) | | | 56 | | | (135) | | | (107) | | | (247) | | | (76) | |
Adjusted Net Income | | $ | 13,541 | | $ | 11,962 | | $ | 11,341 | | $ | 10,062 | | $ | 8,585 | | $ | 46,907 | | $ | 33,076 | |
| | | | | | | | | | | | | | | | | | | | | | |
Average Assets | | $ | 5,438,555 | | $ | 5,372,443 | | $ | 5,162,182 | | $ | 5,071,446 | | $ | 4,788,036 | | $ | 5,268,553 | | $ | 4,683,144 | |
Adjusted Return on Average Assets | | | 0.99 | % | | 0.88 | % | | 0.88 | % | | 0.80 | % | | 0.71 | % | | 0.89 | % | | 0.71 | % |
| | | | | | | | | | | | | | | | | | | | | | |
Adjusted Return on Average Shareholders' Equity | | | | | | | | | | | | | | | | | | | | | | |
Adjusted Net Income | | $ | 13,541 | | $ | 11,962 | | $ | 11,341 | | $ | 10,062 | | $ | 8,585 | | $ | 46,907 | | $ | 33,076 | |
| | | | | | | | | | | | | | | | | | | | | | |
Average Shareholders' Equity | | $ | 509,655 | | $ | 485,869 | | $ | 471,700 | | $ | 465,408 | | $ | 455,949 | | $ | 483,828 | | $ | 440,763 | |
Adjusted Return on Average Shareholders' Equity | | | 10.54 | % | | 9.77 | % | | 9.64 | % | | 8.77 | % | | 7.49 | % | | 9.69 | % | | 7.50 | % |
| | | | | | | | | | | | | | | | | | | | | | |
Adjusted Return on Average Tangible Common Equity | | | | | | | | | | | | | | | | | | | | | | |
Adjusted Net Income Available to Common Shareholders | | $ | 12,527 | | $ | 10,949 | | $ | 10,327 | | $ | 9,049 | | $ | 7,571 | | $ | 42,853 | | $ | 29,022 | |
| | | | | | | | | | | | | | | | | | | | | | |
Average Tangible Common Equity | | $ | 424,099 | | $ | 400,081 | | $ | 385,682 | | $ | 379,156 | | $ | 385,023 | | $ | 397,927 | | $ | 371,042 | |
Adjusted Return on Average Tangible Common Equity | | | 11.72 | % | | 10.86 | % | | 10.74 | % | | 9.68 | % | | 7.82 | % | | 10.77 | % | | 7.82 | % |
Page 19 of 19