Form 8-K
0001120370 False 0001120370 2022-03-02 2022-03-02 iso4217:USD xbrli:shares iso4217:USD xbrli:shares
 

UNITED STATES

SECURITIES AND EXCHANGE COMMISSION

Washington, D.C. 20549

_________________

FORM 8-K

_________________

CURRENT REPORT

Pursuant to Section 13 or 15(d)
of the Securities Exchange Act of 1934

Date of Report (Date of earliest event reported):  March 2, 2022

_______________________________

BROADWIND, INC.

(Exact name of registrant as specified in its charter)

_______________________________

Delaware001-3427888-0409160
(State or Other Jurisdiction of Incorporation)(Commission File Number)(I.R.S. Employer Identification No.)

3240 South Central Avenue

Cicero, Illinois 60804

(Address of Principal Executive Offices) (Zip Code)

(708) 780-4800

(Registrant's telephone number, including area code)

Not Applicable

(Former name or former address, if changed since last report)

_______________________________

Check the appropriate box below if the Form 8-K filing is intended to simultaneously satisfy the filing obligation of the registrant under any of the following provisions:

Written communications pursuant to Rule 425 under the Securities Act (17 CFR 230.425)
Soliciting material pursuant to Rule 14a-12 under the Exchange Act (17 CFR 240.14a-12)
Pre-commencement communications pursuant to Rule 14d-2(b) under the Exchange Act (17 CFR 240.14d-2(b))
Pre-commencement communications pursuant to Rule 13e-4(c) under the Exchange Act (17 CFR 240.13e-4(c))

Securities registered pursuant to Section 12(b) of the Act:

Title of each classTrading Symbol(s)Name of each exchange on which registered
Common Stock, $0.001 par valueBWENThe NASDAQ Capital Market

Indicate by check mark whether the registrant is an emerging growth company as defined in Rule 405 of the Securities Act of 1933 (§230.405 of this chapter) or Rule 12b-2 of the Securities Exchange Act of 1934 (§240.12b-2 of this chapter).

Emerging growth company

If an emerging growth company, indicate by check mark if the registrant has elected not to use the extended transition period for complying with any new or revised financial accounting standards provided pursuant to Section 13(a) of the Exchange Act. ☐


Item 2.02. Results of Operations and Financial Condition.

On March 2, 2022, Broadwind, Inc. (the “Company”) issued a press release announcing its financial results as of and for the quarter ended December 31, 2021. The press release is incorporated herein by reference and is attached hereto as Exhibit 99.1.

The information contained in, or incorporated into, this Item 2.02 of this Current Report on Form 8-K (this “Report”), including Exhibit 99.1, is furnished under Item 2.02 of Form 8-K and shall not be deemed “filed” for the purposes of Section 18 of the Securities Exchange Act of 1934, as amended (the “Exchange Act”) or otherwise subject to the liabilities of that section, and shall not be deemed to be incorporated by reference into the filings of the Company under the Securities Act of 1933, as amended (the “Securities Act”) or the Exchange Act regardless of any general incorporation language in such filings.

Please refer to Exhibit 99.1 for a discussion of certain forward-looking statements included therein and the risks and uncertainties related thereto.

Item 7.01. Regulation FD Disclosure.

An Investor Presentation dated March 2, 2022 is incorporated herein by reference and attached hereto as Exhibit 99.2.

The information contained in, or incorporated into, this Item 7.01 of this Report, including Exhibit 99.2 attached hereto, is furnished under Item 7.01 of Form 8-K and shall not be deemed “filed” for the purposes of Section 18 of the Exchange Act or otherwise subject to the liabilities of that section, and shall not be deemed to be incorporated by reference into the filings of the Company under the Securities Act or the Exchange Act regardless of any general incorporation language in such filings.

This Report shall not be deemed an admission as to the materiality of any information in this Report that is being disclosed pursuant to Regulation FD.

Please refer to Exhibit 99.2 for a discussion of certain forward-looking statements included therein and the risks and uncertainties related thereto.

Item 9.01. Financial Statements and Exhibits.

(d) Exhibits

EXHIBIT NUMBER DESCRIPTION
   
99.1 Press Release dated March 2, 2022  
99.2 Investor Presentation dated March 2, 2022
104 Cover Page Interactive Data File (embedded within the Inline XBRL document)


SIGNATURE

Pursuant to the requirements of the Securities Exchange Act of 1934, the registrant has duly caused this report to be signed on its behalf by the undersigned hereunto duly authorized.

 BROADWIND, INC.
   
  
Date: March 2, 2022By: /s/ Eric B. Blashford        
  Eric B. Blashford
  President, Chief Executive Officer, and Interim Chief Financial Officer
(Principal Executive Officer and Principal Financial Officer)


EXHIBIT 99.1

Broadwind Announces Fourth Quarter and Full-Year 2021 Results

CICERO, Ill., March 02, 2022 (GLOBE NEWSWIRE) -- Broadwind (NASDAQ: BWEN, or the “Company”), a diversified precision manufacturer of specialized components and solutions serving global markets, today announced results for the fourth quarter and full-year 2021.

FULL-YEAR 2021 RESULTS
(As compared to the full-year 2020)

FOURTH QUARTER 2021 RESULTS
(As compared to the fourth quarter 2020)

For the three months ended December 31, 2021, the Company reported total sales of $26.0 million, a decline of 35% when compared to the prior year period. The Company reported a net loss of ($4.1) million, or ($0.21) per basic share in the fourth quarter 2021, compared to a net loss of ($2.0) million, or ($0.12) per basic share, in the fourth quarter 2020. The Company reported adjusted EBITDA, a non-GAAP measure, of ($1.2) million in the fourth quarter 2021, compared to $0.2 million in the prior year period.

Fourth quarter results within the Heavy Fabrications segment were impacted by a near-term pause in wind tower orders, as higher commodity steel costs, supply chain challenges and uncertainty related to renewable energy production tax credits delayed near-term order activity. A year-over-year decline in Heavy Fabrications segment adjusted EBITDA more than offset a continued recovery within the Gearing segment, driven by a sustained recovery in both energy and mining customer demand.

Tower quoting activity increased during the first quarter 2022, as customers began to reserve tower production capacity for the second half of 2022 and into 2023.   To date, the Company has nearly 50% of optimal tower production capacity booked for the full-year 2022.

ORDERS AND BACKLOG

Total orders increased 55% year-over-year to $55.8 million in the fourth quarter 2021, with significant year-over-year order growth across all reporting segments. During the fourth quarter 2021, Heavy Fabrication segment orders increased by $3.6 million on a year-over-year basis to $31.1 million; Gearing segment orders increased $11.0 million to $16.8 million; and Industrial Solutions segment orders increased $5.2 million to $7.9 million.

Total backlog increased 15% year-over-year to $106.4 million in the fourth quarter of 2021. As of December 31, 2021, Heavy Fabrication segment orders represented approximately 60% of the Company’s total backlog.

MANAGEMENT COMMENTARY

“We continued to leverage our precision manufacturing expertise across a diverse portfolio of end-markets during the fourth quarter, an approach that served to mitigate a transitory pause in wind tower demand,” stated Eric Blashford, President and CEO of Broadwind. “Total customer orders increased by more than 55% in the fourth quarter to the highest level in nearly three years. Total backlog at year-end was approximately 40% higher than at the end of the third quarter 2021, given accelerating activity levels within both energy and industrial markets.”

“Near-term wind tower demand remains impacted by a combination of legislative delays around a proposed Production Tax Credit extension, elevated raw materials costs and pronounced supply chain disruptions,” continued Blashford. “Despite these challenges, our core investment thesis remains intact, with more than 100 gigawatts of new onshore wind capacity forecasted to come online in the United States by 2030, as demand for cost-competitive renewable energy rises across commercial, industrial and utility markets. We remain well-positioned to capitalize on the current energy transition, one that seeks to replace aging, carbon-centric power generators with long-lived, sustainable development projects.”

“During 2021, we introduced a series of strategic initiatives within our Gearing segment designed to expand our available markets, lessen customer lead-times, reduce fixed overhead costs and streamline critical business processes,” continued Blashford.   “During the fourth quarter, Gearing segment revenue increased by 70% on a year-over-year basis to $8.3 million, a performance made possible by the targeted strategic actions taken last year. Gearing segment orders increased by nearly 200% at quarter-end, while backlog increased by more than 120% to $32 million, as demand within key energy markets continues to increase. We are encouraged by the positive inflection within our Gearing segment and look forward to further advancing this business.”

“Looking ahead, we anticipate continued strength within our non-wind end-markets, as reflected by current order rates and backlog levels,” continued Blashford. “Although our core wind markets are expected to be soft during the first half of 2022, we remain in the early phase of a broader recovery in onshore wind tower demand. Accordingly, we anticipate increasing customer interest in securing tower production capacity as commodity prices normalize and policy uncertainty becomes clearer.”

“For the first quarter of 2022, we currently anticipate non-GAAP adjusted EBITDA loss of $0.5 million, subject to market conditions,” concluded Blashford.  

SEGMENT RESULTS

Heavy Fabrications Segment
Broadwind provides large, complex and precision fabrications to customers in a broad range of industrial markets. Key products include wind towers and industrial fabrications, including mining and material handling components and other frames/structures.

Heavy Fabrications segment sales declined by $15.1 million to $14.7 million in the fourth quarter 2021, as compared to the prior year period. This decrease is primarily due to a 62% decline in tower sections sold. The decline in tower section sales was primarily attributable to a near-term pause in customer demand. The segment reported an operating loss of ($1.3) million, versus operating income of $1.6 million in the prior year period. Segment non-GAAP adjusted EBITDA was break-even in the fourth quarter 2021, a decline of $2.8 million versus the fourth quarter 2020.

Gearing Segment
Broadwind provides custom gearboxes, loose gearing and heat treat services to a broad set of customers in diverse markets, including oil & gas production, surface and underground mining, wind energy, steel, material handling and other infrastructure markets.

Gearing segment sales increased by $3.4 million to $8.3 million in the fourth quarter 2021, as compared to the prior year period, primarily due to increased demand within the energy and mining markets. The segment reported an operating loss of ($0.5) million in the fourth quarter 2021, compared to an operating loss of ($1.9) million in the prior year period. The segment reported non-GAAP adjusted EBITDA of $0.1 million in the fourth quarter 2021, an increase of $1.6 million versus the fourth quarter 2020.

Industrial Solutions Segment
Broadwind provides supply chain solutions, light fabrication, inventory management, kitting and assembly services, primarily serving the combined cycle natural gas turbine market as well as other clean technology markets.  

Industrial Solutions segment sales declined $2.7 million to $3.0 million in the fourth quarter 2021 as compared to the prior year period, primarily driven by lower order intake during the first part of 2021, as well as supply chain issues experienced during the fourth quarter of 2021.   The segment reported an operating loss of ($0.2) million in the fourth quarter 2021, a decrease of $0.6 compared to the prior year period. The segment reported break-even non-GAAP adjusted EBITDA in the fourth quarter 2021, a decline of $0.6 million versus the prior year period.

FOURTH QUARTER AND FULL-YEAR 2021 CONFERENCE CALL

Broadwind will host a conference call today, March 2, 2022 at 11:00 A.M. ET to review the Company’s financial results, discuss recent events and conduct a question-and-answer session.

A webcast of the conference call and accompanying presentation materials will be available in the Investor Relations section of the Company’s corporate website at https://investors.bwen.com/investors. To listen to a live broadcast, go to the site at least 15 minutes prior to the scheduled start time in order to register, download, and install any necessary audio software.

To participate in the live teleconference:

Domestic Live:
International Live:
877-407-9716
201-493-6779
  

To listen to a replay of the teleconference, which will be available through March 9, 2022:

Domestic Replay:
International Replay:
Conference ID:
844-512-2921
412-317-6671
13726270
  

ABOUT BROADWIND

Broadwind (NASDAQ: BWEN) is a precision manufacturer of structures, equipment and components for clean tech and other specialized applications. With facilities throughout the U.S., our talented team is committed to helping customers maximize performance of their investments—quicker, easier and smarter. Find out more at www.bwen.com

NON-GAAP FINANCIAL MEASURES

The Company provides non-GAAP adjusted EBITDA (earnings before interest, income taxes, depreciation, amortization, share-based compensation and other stock payments, restructuring costs, impairment charges and other non-cash gains and losses) as supplemental information regarding the Company’s business performance. The Company’s management uses this supplemental information when it internally evaluates its performance, reviews financial trends and makes operating and strategic decisions. The Company believes that this non-GAAP financial measure is useful to investors because it provides investors with a better understanding of the Company’s past financial performance and future results, which allows investors to evaluate the Company’s performance using the same methodology and information as used by the Company’s management. The Company's definition of adjusted EBITDA may be different from similar non-GAAP financial measures used by other companies and/or analysts.

FORWARD-LOOKING STATEMENTS

This release contains “forward looking statements”—that is, statements related to future, not past, events—as defined in Section 21E of the Securities Exchange Act of 1934, as amended, that reflect our current expectations regarding our future growth, results of operations, financial condition, cash flows, performance, business prospects and opportunities, as well as assumptions made by, and information currently available to, our management. Forward looking statements include any statement that does not directly relate to a current or historical fact. We have tried to identify forward looking statements by using words such as “anticipate,” “believe,” “expect,” “intend,” “will,” “should,” “may,” “plan” and similar expressions, but these words are not the exclusive means of identifying forward looking statements.

Our forward-looking statements may include or relate to our beliefs, expectations, plans and/or assumptions with respect to the following, many of which are, and will be, amplified by the COVID-19 pandemic, including as a result of emerging variants: (i) the impact of global health concerns, including the impact of the current COVID-19 pandemic on the economies and financial markets and the demand for our products; (ii) state, local and federal regulatory frameworks affecting the industries in which we compete, including the wind energy industry, and the related extension, continuation or renewal of federal tax incentives and grants and state renewable portfolio standards as well as new or continuing tariffs on steel or other products imported into the United States; (iii) our customer relationships and our substantial dependency on a few significant customers and our efforts to diversify our customer base and sector focus and leverage relationships across business units; (iv) the economic and operational stability of our significant customers and suppliers, including their respective supply chains, and the ability to source alternative suppliers as necessary, in light of the COVID-19 pandemic; (v) our ability to continue to grow our business organically and through acquisitions, and the impairment thereto by the impact of the COVID-19 pandemic; (vi) the production, sales, collections, customer deposits and revenues generated by new customer orders and our ability to realize the resulting cash flows; (vii) information technology failures, network disruptions, cybersecurity attacks or breaches in data security, including with respect to any remote work arrangements implemented in response to the COVID-19 pandemic; (viii) the sufficiency of our liquidity and alternate sources of funding, if necessary; (ix) our ability to realize revenue from customer orders and backlog; (x) our ability to operate our business efficiently, comply with our debt obligations, manage capital expenditures and costs effectively, and generate cash flow; (xi) the economy, including its stability in light of the COVID-19 pandemic, and the potential impact it may have on our business, including our customers; (xii) the state of the wind energy market and other energy and industrial markets generally and the impact of competition and economic volatility in those markets; (xiii) the effects of market disruptions and regular market volatility, including fluctuations in the price of oil, gas and other commodities; (xiv) competition from new or existing industry participants including, in particular, increased competition from foreign tower manufacturers; (xv) the effects of the change of administrations in the U.S. federal government; (xvi) our ability to successfully integrate and operate acquired companies and to identify, negotiate and execute future acquisitions; (xvii) the potential loss of tax benefits if we experience an “ownership change” under Section 382 of the Internal Revenue Code of 1986, as amended; (xviii) our ability to utilize various relief options enabled by the Coronavirus Aid, Relief, and Economic Security Act (CARES Act); (xix) the limited trading market for our securities and the volatility of market price for our securities; and (xx) the impact of future sales of our common stock or securities convertible into our common stock on our stock price. These statements are based on information currently available to us and are subject to various risks, uncertainties and other factors that could cause our actual growth, results of operations, financial condition, cash flows, performance, business prospects and opportunities to differ materially from those expressed in, or implied by, these statements including, but not limited to, those set forth under the caption “Risk Factors” in Part I, Item 1A of our most recently filed Form 10-K and our other filings with the Securities and Exchange Commission. We are under no duty to update any of these statements. You should not consider any list of such factors to be an exhaustive statement of all of the risks, uncertainties or other factors that could cause our current beliefs, expectations, plans and/or assumptions to change. Accordingly, forward-looking statements should not be relied upon as a predictor of actual results.


BROADWIND, INC. AND SUBSIDIARIES
CONSOLIDATED BALANCE SHEETS
(IN THOUSANDS)

  December 31,  December 31,
   2021   2020 
ASSETS    
CURRENT ASSETS:    
Cash $852  $3,372 
Accounts receivable, net  13,802   15,337 
Employee retention credit receivable  497   - 
Contract assets  1,136   2,253 
Inventories, net  33,377   26,724 
Prepaid expenses and other current assets  2,661   2,909 
Total current assets  52,325   50,595 
LONG-TERM ASSETS:    
Property and equipment, net  43,655   45,195 
Operating lease right-of-use assets  18,029   19,321 
Intangible assets, net  3,453   4,186 
Other assets  585   385 
TOTAL ASSETS $118,047  $119,682 
     
LIABILITIES AND STOCKHOLDERS' EQUITY    
CURRENT LIABILITIES:    
Line of credit and other notes payable $6,650  $1,406 
Current portion of finance lease obligations  2,060   1,427 
Current portion of operating lease obligations  1,775   1,832 
Accounts payable  16,462   18,180 
Accrued liabilities  3,654   6,307 
Customer deposits  12,082   18,819 
Total current liabilities  42,683   47,971 
LONG-TERM LIABILITIES:    
Long-term debt, net of current maturities  177   9,381 
Long-term finance lease obligations, net of current portion  2,481   1,996 
Long-term operating lease obligations, net of current portion  18,405   19,569 
Other  167   104 
Total long-term liabilities  21,230   31,050 
COMMITMENTS AND CONTINGENCIES    
     
STOCKHOLDERS' EQUITY:    
Preferred stock, $0.001 par value; 10,000,000 shares authorized; no shares issued or outstanding  -   - 
Common stock, $0.001 par value; 30,000,000 shares authorized; 19,859,650 and 17,211,498 shares issued as of December 31, 2021 and December 31, 2020,  respectively  20   17 
Treasury stock, at cost, 273,937 shares as of December 31, 2021 and December 31, 2020, respectively  (1,842)  (1,842)
Additional paid-in capital  395,372   384,749 
Accumulated deficit  (339,416)  (342,263)
Total stockholders' equity  54,134   40,661 
TOTAL LIABILITIES AND STOCKHOLDERS' EQUITY $118,047  $119,682 


BROADWIND, INC. AND SUBSIDIARIES
CONSOLIDATED STATEMENTS OF OPERATIONS
(IN THOUSANDS, EXCEPT PER SHARE DATA)
(UNAUDITED)

         
  Three Months Ended
December 31,
 Twelve Months Ended
December 31,
   2021   2020   2021   2020 
         
         
Revenues $26,011  $40,322  $145,619  $198,496 
Cost of sales  25,054   37,648   140,108   180,495 
Gross profit  957   2,674   5,511   18,001 
         
OPERATING EXPENSES:        
Selling, general and administrative  4,749   4,309   17,372   16,846 
Intangible amortization  183   183   733   733 
Total operating expenses  4,932   4,492   18,105   17,579 
Operating (loss) income  (3,975)  (1,818)  (12,594)  422 
         
OTHER INCOME (EXPENSE), net:        
Paycheck Protection Program loan forgiveness  -   -   9,151   - 
Interest expense, net  (313)  (330)  (1,129)  (1,984)
Other, net  122   126   7,444   123 
Total other (expense) income, net  (191)  (204)  15,466   (1,861)
         
Net (loss) income before (benefit) provision for income taxes  (4,166)  (2,022)  2,872   (1,439)
(Benefit) provision for income taxes  (76)  (55)  25   48 
NET (LOSS) INCOME $(4,090) $(1,967) $2,847  $(1,487)
         
         
NET (LOSS) INCOME PER COMMON SHARE - BASIC:        
Net (loss) income $(0.21) $(0.12) $0.15  $(0.09)
         
WEIGHTED AVERAGE COMMON SHARES OUTSTANDING - BASIC  19,516   16,938   18,726   16,746 
         
NET (LOSS) INCOME PER COMMON SHARE - DILUTED:        
Net (loss) income $(0.21) $(0.12) $0.15  $(0.09)
         
WEIGHTED AVERAGE COMMON SHARES OUTSTANDING - DILUTED  19,516   16,938   19,388   16,746 


BROADWIND, INC. AND SUBSIDIARIES
CONSOLIDATED STATEMENTS OF CASH FLOWS
(IN THOUSANDS)
(UNAUDITED)

    
  Twelve Months Ended December 31,
   2021  2020 
CASH FLOWS FROM OPERATING ACTIVITIES:   
Net income (loss) $2,847 $(1,487)
Adjustments to reconcile net cash (used in) provided by operating activities:
     
Depreciation and amortization expense  6,336  6,279 
Paycheck Protection Program loan forgiveness  (9,151) - 
Deferred income taxes  (2) (4)
Change in fair value of interest rate swap agreements  23  167 
Stock-based compensation  1,541  1,295 
Allowance for doubtful accounts  (426) 346 
Common stock issued under defined contribution 401(k) plan  1,193  - 
Gain on disposal of assets  (33) - 
Changes in operating assets and liabilities:   
Accounts receivable  1,961  2,627 
Employee retention credit receivable  (497) - 
Contract assets  1,117  (2,253)
Inventories  (6,653) 5,139 
Prepaid expenses and other current assets  133  (865)
Accounts payable  (1,736) (3,320)
Accrued liabilities  (2,676) 1,229 
Customer deposits  (6,737) (3,898)
Other non-current assets and liabilities  (66) 75 
Net cash (used in) provided by operating activities  (12,826) 5,330 
CASH FLOWS FROM INVESTING ACTIVITIES:   
Purchases of property and equipment  (1,707) (1,547)
Proceeds from disposals of property and equipment  33  - 
Net cash used in investing activities  (1,674) (1,547)
CASH FLOWS FROM FINANCING ACTIVITIES:   
Proceeds from line of credit  156,004  153,891 
Payments on line of credit  (150,899) (164,163)
Proceeds from long-term debt  817  9,530 
Payments on long-term debt  (161) (1,186)
Principal payments on finance leases  (1,672) (992)
Shares withheld for taxes in connection with issuance of restricted stock  (1,423) (139)
Proceeds from sale of common stock, net  9,314  232 
Net cash provided by (used in) financing activities  11,980  (2,827)
    - 
    
NET (DECREASE) INCREASE IN CASH  (2,520) 956 
CASH beginning of the period  3,372  2,416 
CASH end of the period $852 $3,372 
Supplemental cash flow information:   
Interest paid $741 $1,449 
Income taxes paid $102 $81 
Non-cash investing and financing activities:   
Equipment additions via finance lease $2,757 $3,196 
Non-cash purchases of property and equipment $18 $376 


BROADWIND, INC. AND SUBSIDIARIES
SELECTED SEGMENT FINANCIAL INFORMATION
(IN THOUSANDS)
(UNAUDITED)

  Three Months Ended Twelve Months Ended
  December 31, December 31,
   2021   2020   2021   2020 
ORDERS:      
Heavy Fabrications $31,150  $27,536  $93,246  $105,843 
Gearing  16,757   5,741   46,081   25,117 
Industrial Solutions  7,866   2,682   19,698   17,922 
Total orders $55,773  $35,959  $159,025  $148,882 
         
REVENUES:      
Heavy Fabrications $14,713  $29,776  $101,994  $155,198 
Gearing  8,268   4,863   28,583   25,136 
Industrial Solutions  3,044   5,783   15,402   18,299 
Corporate and Other  (14)  (100)  (360)  (137)
Total revenues $26,011  $40,322  $145,619  $198,496 
         
OPERATING (LOSS)/PROFIT:      
Heavy Fabrications $(1,341) $1,624  $(3,214) $10,385 
Gearing  (504)  (1,948)  (2,593)  (3,883)
Industrial Solutions  (217)  385   (386)  881 
Corporate and Other  (1,913)  (1,879)  (6,401)  (6,961)
Total operating profit/(loss $(3,975) $(1,818) $(12,594) $422 


BROADWIND, INC. AND SUBSIDIARIES
RECONCILIATION OF NON-GAAP FINANCIAL MEASURES
(IN THOUSANDS)
(UNAUDITED)

Consolidated Three Months Ended
December 31,
 Twelve Months
Ended December 31,
   2021   2020   2021   2020 
Net (Loss) Income $(4,090) $(1,967) $2,847  $(1,487)
Interest Expense  313   330   1,129   1,984 
Income Tax (Benefit) Provision  (76)  (55)  25   48 
Depreciation and Amortization  1,577   1,518   6,336   6,279 
Share-based Compensation and Other Stock Payments  1,067   395   2,872   1,161 
Adjusted EBITDA (Non-GAAP)  (1,209)  221   13,209   7,985 


Heavy Fabrications Segment Three Months Ended
December 31,
 Twelve Months Ended
December 31,
   2021   2020   2021   2020 
Net Income $367  $1,270  $6,996  $7,949 
Interest Expense  149   79   530   356 
Income Tax (Benefit) Provision  (1,742)  389   382   2,193 
Depreciation  941   905   3,844   3,737 
Share-based Compensation and Other Stock Payments  244   66   975   205 
Adjusted EBITDA (Non-GAAP) $(41) $2,709  $12,727  $14,440 


Gearing Segment Three Months Ended
December 31,
 Twelve Months Ended
December 31,
   2021   2020   2021   2020 
Net (Loss) Income $(554) $(1,924) $1,280  $(3,957)
Interest Expense  30   11   62   100 
Income Tax Provision (Benefit)  20   (35)  30   (26)
Depreciation and Amortization  472   459   1,855   1,961 
Share-based Compensation and Other Stock Payments  173   30   531   86 
Adjusted EBITDA (Non-GAAP)$141  $(1,459) $3,758  $(1,836)


Industrial Solutions Segment Three Months Ended
December 31,
 Twelve Months Ended
December 31,
   2021   2020   2021   2020 
Net (Loss) Income $(196) $391  $488  $824 
Interest Expense  13   21   56   39 
Income Tax (Benefit) Provision  (34)  (38)  21   3 
Depreciation and Amortization  110   111   425   430 
Share-based Compensation and Other Stock Payments  64   39   211   103 
Adjusted EBITDA (Non-GAAP) $(43) $524  $1,201  $1,399 


Corporate and Other Three Months Ended
December 31,
 Twelve Months Ended
December 31,
   2021   2020   2021   2020 
Net Loss $(3,707) $(1,704) $(5,917) $(6,303)
Interest Expense  121   219   481   1,489 
Income Tax Provision (Benefit)  1,680   (371)  (408)  (2,122)
Depreciation and Amortization  54   43   212   151 
Share-based Compensation and Other Stock Payments  586   260   1,155   767 
Adjusted EBITDA (Non-GAAP) $(1,266) $(1,553) $(4,477) $(6,018)

CORPORATE CONTACT

Noel Ryan, IRC
[email protected]

Exhibit 99.2


Fourth Quarter 2021 Results Conference Call Investor Presentation


SAFE - HARBOR STATEMENT 2 | Investor Presentation This release contains “forward looking statements” — that is, statements related to future, not past, events — as defined in Section 21 E of the Securities Exchange Act of 1934 , as amended, that reflect our current expectations regarding our future growth, results of operations, financial condition, cash flows, performance, business prospects and opportunities, as well as assumptions made by, and information currently available to, our management . Forward looking statements include any statement that does not directly relate to a current or historical fact . We have tried to identify forward looking statements by using words such as “anticipate,” “believe,” “expect,” “intend,” “will,” “should,” “may,” “plan” and similar expressions, but these words are not the exclusive means of identifying forward looking statements . Our forward - looking statements may include or relate to our beliefs, expectations, plans and/or assumptions with respect to the following, many of which are, and will be, amplified by the COVID - 19 pandemic, including as a result of emerging variants : ( i ) the impact of global health concerns, including the impact of the current COVID - 19 pandemic on the economies and financial markets and the demand for our products ; (ii) state, local and federal regulatory frameworks affecting the industries in which we compete, including the wind energy industry, and the related extension, continuation or renewal of federal tax incentives and grants and state renewable portfolio standards as well as new or continuing tariffs on steel or other products imported into the United States ; (iii) our customer relationships and our substantial dependency on a few significant customers and our efforts to diversify our customer base and sector focus and leverage relationships across business units ; (iv) the economic and operational stability of our significant customers and suppliers, including their respective supply chains, and the ability to source alternative suppliers as necessary, in light of the COVID - 19 pandemic ; (v) our ability to continue to grow our business organically and through acquisitions, and the impairment thereto by the impact of the COVID - 19 pandemic ; (vi) the production, sales, collections, customer deposits and revenues generated by new customer orders and our ability to realize the resulting cash flows ; (vii) information technology failures, network disruptions, cybersecurity attacks or breaches in data security, including with respect to any remote work arrangements implemented in response to the COVID - 19 pandemic ; (viii) the sufficiency of our liquidity and alternate sources of funding, if necessary ; (ix) our ability to realize revenue from customer orders and backlog ; (x) our ability to operate our business efficiently, comply with our debt obligations, manage capital expenditures and costs effectively, and generate cash flow ; (xi) the economy, including its stability in light of the COVID - 19 pandemic, and the potential impact it may have on our business, including our customers ; (xii) the state of the wind energy market and other energy and industrial markets generally and the impact of competition and economic volatility in those markets ; (xiii) the effects of market disruptions and regular market volatility, including fluctuations in the price of oil, gas and other commodities ; (xiv) competition from new or existing industry participants including, in particular, increased competition from foreign tower manufacturers ; (xv) the effects of the change of administrations in the U . S . federal government ; (xvi) our ability to successfully integrate and operate acquired companies and to identify, negotiate and execute future acquisitions ; (xvii) the potential loss of tax benefits if we experience an “ownership change” under Section 382 of the Internal Revenue Code of 1986 , as amended ; (xviii) our ability to utilize various relief options enabled by the Coronavirus Aid, Relief, and Economic Security Act (CARES Act) ; (xix) the limited trading market for our securities and the volatility of market price for our securities ; and (xx) the impact of future sales of our common stock or securities convertible into our common stock on our stock price . These statements are based on information currently available to us and are subject to various risks, uncertainties and other factors that could cause our actual growth, results of operations, financial condition, cash flows, performance, business prospects and opportunities to differ materially from those expressed in, or implied by, these statements including, but not limited to, those set forth under the caption “Risk Factors” in Part I, Item 1 A of our most recently filed Form 10 - K and our other filings with the Securities and Exchange Commission . We are under no duty to update any of these statements . You should not consider any list of such factors to be an exhaustive statement of all of the risks, uncertainties or other factors that could cause our current beliefs, expectations, plans and/or assumptions to change . Accordingly, forward - looking statements should not be relied upon as a predictor of actual results .


PERFORMANCE OVERVIEW


4 | Investor Presentation EXECUTIVE SUMMARY Market update, recent results and outlook Market Update As of March 2022 4Q21 Results Performance Overview Management Outlook As of March 2022 Revenue diversification offsets Wind softness Stable contributions from non - wind businesses served to offset temporary pause in tower demand, given policy uncertainty, supply chain challenges and raw material cost inflation Heavy Fabrications segment update Total wind towers sections sold declined by 62% on a y/y basis due to above - referenced issues Gearing segment update Gearing revenue increased by more than 70% y/y, driven by increased energy and industrial demand Industrial Solutions segment update Revenue impacted by lower order intake and supply chain - related challenges Wind tower plant utilization As of March 2022, received orders for nearly 50% of full - year 2022 optimal tower production capacity 1Q22 financial guidance Anticipate 1Q22 adjusted EBITDA loss of $0.5 million Expect a pause in order activity in 1H22 Pandemic - related supply chain issues, raw material cost inflation and policy outlook have led turbine OEMs to postpone orders to 2H22 LT onshore installation outlook remains stable Currently anticipate average annual installation activity of ~11 GW annually thru 2030; anticipate an acceleration in new installation activity in latter half of decade; LT fundamentals intact Long - term C&I demand drives decarbonization Commercial and industrial demand for renewable power purchase agreements remains high, supported by ESG mandates and cost - related benefits Stable liquidity position, low net leverage Total cash and availability was $14.9 million as of December 31, 2021; Ratio of net debt to trailing twelve - month non - GAAP adjusted EBITDA was 0.8x Long - term PTC extension remains a priority Multi - year PTC extension would provide wind developers with improved visibility, providing a catalyst for onshore/offshore wind development


CONSOLIDATED FINANCIAL DATA Fourth quarter results impacted by near - term pause in wind tower demand 5 | Investor Presentation Total Revenue ($MM) Gross Profit ($MM) Adjusted EBITDA (1) ($MM) Earnings (Loss) Per Diluted Share (1) ($) • Total revenue declined 35% y/y to $26 million, given lower tower demand • Significant, ongoing recovery in diverse end - markets reflected in improved Gearing revenue, adjusted EBITDA, order and backlog • PTC uncertainty, supply chain challenges and permitting delays have impacted near - term pace of new wind installations • Remain positive on onshore outlook, despite near - term pause in orders (1) For 2021, results include $9.2 million benefit related to loan forgiveness under the Paycheck Protection Program (PPP), toget he r with a $7.0 million related to the Employee Retention Tax Credit (ERC), as outlined under the provisions of the Coronavirus Aid, Relief, and Economic Security Act (CARES Act) and further modified under the Taxpayer Certainty and D isa ster Tax Relief Act of 2020 and the American Rescue Plan Act of 2021. $40.3 $26.0 $198.5 $145.6 4Q20 4Q21 2020 2021 $2.7 $1.0 $18.0 $5.5 4Q20 4Q21 2020 2021 $0.2 ($1.2) $8.0 $13.2 4Q20 4Q21 2020 2021 $(0.12) $(0.21) $(0.09) $0.15 4Q20 4Q21 2020 2021


HEAVY FABRICATIONS SEGMENT Near - term wind tower demand impacted by policy uncertainty, raw material cost escalations 6 | Investor Presentation Segment Revenue ($MM) Segment Adjusted EBITDA ($MM) Segment Orders ($MM) Quarter - End Segment Backlog ($MM) • Segment revenue declined 51% y/y to $14.7 million due to lower near - term demand for wind towers • Fluid policy environment, higher raw material costs, supply chain disruptions and higher freight costs leading developers to delay project timing • Segment orders increased 13% y/y to $31.1 million; backlog increased 36% q/q in 4Q21 • Successfully managed to breakeven segment EBITDA in a challenging market environment $29.8 $14.7 $155.2 $102.0 4Q20 4Q21 2020 2021 $2.7 ($0.0) $14.4 $12.7 4Q20 4Q21 2020 2021 $27.5 $31.1 $105.8 $93.2 4Q20 4Q21 2020 2021 $71.2 $46.1 $62.6 4Q20 3Q21 4Q21


HEAVY FABRICATIONS SEGMENT Wind tower sections sold declined 35% y/y in 2021 7 | Investor Presentation Total Wind Tower Sections Sold (Number of Sections) Spread Between Plate Steel vs. HRC Steel (Price of Steel Per Ton) (1) . (1) Source: Euromoney Global Limited $0 $500 $1,000 $1,500 $2,000 $2,500 US Domestic Steel Plate US HRC Steel • 35% y/y decline in tower sections sold impacted Heavy Fabrications EBITDA; we believe tower demand has begun to stabilize, with a recovery in demand expected beginning in 2H22 and 2023 • Commodity plate steel prices have not declined in tandem with HRC steel; however, we expect plate prices to correct over time, reducing tower raw material costs $0.0 $2.0 $4.0 $6.0 $8.0 $10.0 $12.0 $14.0 $16.0 - 200 400 600 800 1,000 1,200 1,400 2017 2018 2019 2020 2021 Wind Tower Sections Sold Heavy Fabrictions EBITDA
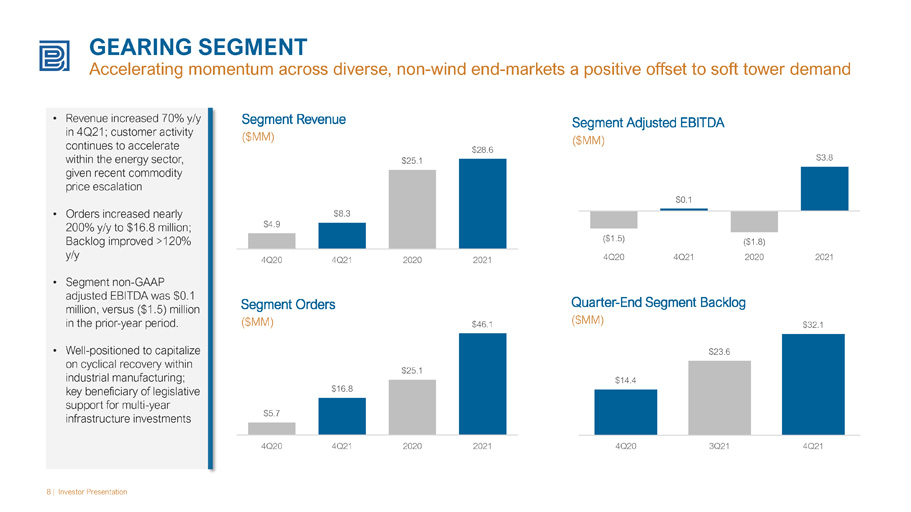


GEARING SEGMENT Accelerating momentum across diverse, non - wind end - markets a positive offset to soft tower demand 8 | Investor Presentation Segment Revenue ($MM) Segment Adjusted EBITDA ($MM) Segment Orders ($MM) Quarter - End Segment Backlog ($MM) • Revenue increased 70% y/y in 4Q21; customer activity continues to accelerate within the energy sector, given recent commodity price escalation • Orders increased nearly 200% y/y to $16.8 million; Backlog improved >120% y/y • Segment non - GAAP adjusted EBITDA was $0.1 million, versus ($1.5) million in the prior - year period. • Well - positioned to capitalize on cyclical recovery within industrial manufacturing; key beneficiary of legislative support for multi - year infrastructure investments $14.4 $23.6 $32.1 4Q20 3Q21 4Q21 $4.9 $8.3 $25.1 $28.6 4Q20 4Q21 2020 2021 ($1.5) $0.1 ($1.8) $3.8 4Q20 4Q21 2020 2021 $5.7 $16.8 $25.1 $46.1 4Q20 4Q21 2020 2021
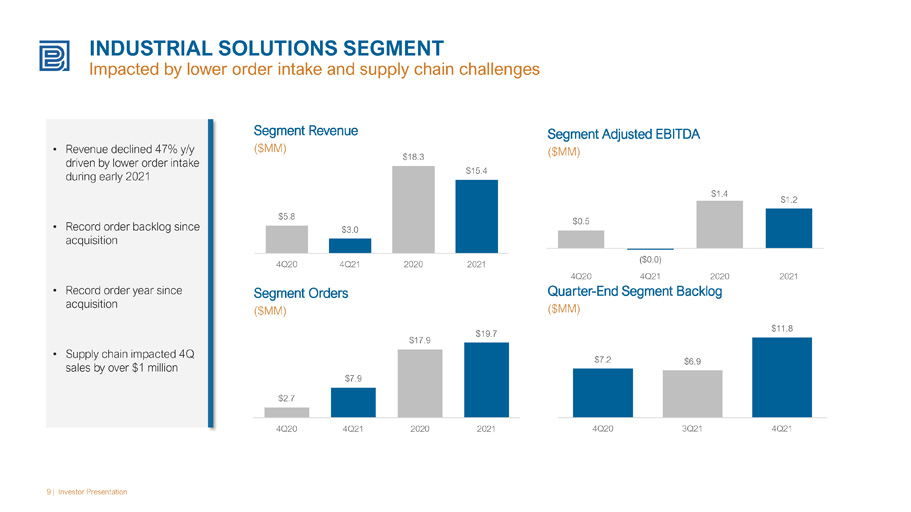


INDUSTRIAL SOLUTIONS SEGMENT Impacted by lower order intake and supply chain challenges 9 | Investor Presentation Segment Revenue ($MM) Segment Adjusted EBITDA ($MM) Segment Orders ($MM) Quarter - End Segment Backlog ($MM) • Revenue declined 47% y/y driven by lower order intake during early 2021 • Record order backlog since acquisition • Record order year since acquisition • Supply chain impacted 4Q sales by over $1 million $5.8 $3.0 $18.3 $15.4 4Q20 4Q21 2020 2021 $0.5 ($0.0) $1.4 $1.2 4Q20 4Q21 2020 2021 $2.7 $7.9 $17.9 $19.7 4Q20 4Q21 2020 2021 $7.2 $6.9 $11.8 4Q20 3Q21 4Q21


BALANCE SHEET UPDATE $15 million of cash and availability to support growth as of 12/31/21 10 | Investor Presentation $19.0 $19.0 $21.9 $21.8 $24.1 $21.6 $23.7 $21.1 $14.9 4Q19 1Q20 2Q20 3Q20 4Q20 1Q21 2Q21 3Q21 4Q21 Quarter - End Total Cash and Availability on Credit Facility ($MM) • Ample liquidity to support the growth of the business • We continue to maintain a disciplined cost structure, while mitigating cash burn ahead of an expected recovery in tower deman d • We have aligned our cost structure with current customer demand, while positioning us to bring tower capacity on - line as activit y accelerates


U.S. WIND POWER INSTALLATION FORECAST Potential multi - year extension of the PTC and ITC remains a key catalyst for new wind installations 11 | Investor Presentation (1) Source: Wood MacKenzie 3Q21 Wind Sector Outlook; wind values include new build and repowering U.S. Onshore Wind Capacity Installations (Annual On - Shore GW Installed) (1) U.S. Offshore Wind Capacity Installations (Annual Off - Shore GW Installed) (1) 9.8 9.0 9.7 10.2 10.9 12.7 13.9 13.7 13.4 2022e 2023e 2024e 2025e 2026e 2027e 2028e 2029e 2030e 3Q21 Forecast 4Q21 Forecast 0.7 1.8 4.3 4.6 5.9 4.9 5.4 4.8 2023e 2024e 2025e 2026e 2027e 2028e 2029e 2030e 3Q21 Forecast 4Q21 Forecast • Between 2022 and 2030, we expect more than 100 GW of onshore capacity to be installed • Developers are ordering larger, more complex turbines, creating an opportunity for increased content per tower • Over the near - to - medium term, we view a potential PTC extension, rising C&I demand and repowering as key catalysts for new onsho re installations


CUSTOMER DIVERSIFICATION INITIATIVE Balanced revenue mix supports long - term growth and profitability 12 | Investor Presentation Wind vs. Non - Wind Revenue Concentration (% of Total Revenue) (1) (1) Wind energy figures shown above exclude repair/replacement demand Fastest Growing Non - Wind Sectors in 2021 (Absolute Growth in Revenue) Energy Mining Industrial • Non - wind revenue has increased to 39% of total 2021 revenue, an increase from 8% in 2016, serving to offset volatility in wind tower demand • Revenue diversification positions us to better optimize our production capabilities during periods of lower wind tower demand 8% 28% 50% 34% 31% 39% 2016 2017 2018 2019 2020 2021 Wind Revenue Non-Wind Revenue


APPENDIX


EXHIBIT A Orders, Revenues and Operating (Loss)/Profit by Segment 14 | Investor Presentation Three Months Ended Twelve Months Ended 2021 2020 2021 2020 ORDERS: Heavy Fabrications………………………………………………………………31,150$ 27,536$ 93,246$ 105,843$ Gearing………………………………………………………………16,757 5,741 46,081 25,117 Industrial Solutions………………………………………………………………7,866 2,682 19,698 17,922 Total orders………………………………...………………55,773$ 35,959$ 159,025$ 148,882$ REVENUES: Heavy Fabrications………………………………………………………………14,713$ 29,776$ 101,994$ 155,198$ Gearing………………………………………………………………8,268 4,863 28,583 25,136 Industrial Solutions………………………………………………………………3,044 5,783 15,402 18,299 Corporate and Other……………………………………………………………(14) (100) (360) (137) Total revenues…………………………………..……………………26,011$ 40,322$ 145,619$ 198,496$ OPERATING (LOSS)/PROFIT: Heavy Fabrications………………………………………………………………(1,341)$ 1,624$ (3,214)$ 10,385$ Gearing………………………………………………………………(504) (1,948) (2,593) (3,883) Industrial Solutions………………………………………………………………(217) 385 (386) 881 Corporate and Other……………………………………………………………(1,913) (1,879) (6,401) (6,961) Total operating profit/(loss)……………………………………(3,975)$ (1,818)$ (12,594)$ 422$ December 31, December 31,


EXHIBIT B GAAP to Non - GAAP Consolidated Adjusted EBITDA Reconciliation 15 | Investor Presentation 15 | Investor Presentation Heavy Fabrications Segment 2021 2020 2021 2020 Net Income……………………...…………………………….……. 367$ 1,270$ 6,996$ 7,949$ Interest Expense……………………………..……………………. 149 79 530 356 Income Tax (Benefit) Provision……..…………………...……………………(1,742) 389 382 2,193 Depreciation……………………………………………………………… 941 905 3,844 3,737 Share-based Compensation and Other Stock Payments………………………………………………………………244 66 975 205 Adjusted EBITDA (Non-GAAP)…………………………….. (41)$ 2,709$ 12,727$ 14,440$ Three Months Ended December 31, Twelve Months Ended December 31, Gearing Segment 2021 2020 2021 2020 Net (Loss) Income……………………...……………………...……………. (554)$ (1,924)$ 1,280$ (3,957)$ Interest Expense………………………...……………………………… 30 11 62 100 Income Tax Provision (Benefit)…………………...…………………… 20 (35) 30 (26) Depreciation and Amortization………………………………………………………………472 459 1,855 1,961 Share-based Compensation and Other Stock Payments………………………………………………………………173 30 531 86 Adjusted EBITDA (Non-GAAP)……………………….. 141$ (1,459)$ 3,758$ (1,836)$ Three Months Ended December 31, Twelve Months Ended December 31, Industrial Solutions Segment 2021 2020 2021 2020 Net (Loss) Income……………………...……...……………………………. (196)$ 391$ 488$ 824$ Interest Expense……………………………………………………. 13 21 56 39 Income Tax (Benefit) Provision…………………...…………………… (34) (38) 21 3 Depreciation and Amortization……………………………………. 110 111 425 430 Share-based Compensation and Other Stock Payments………… 64 39 211 103 Adjusted EBITDA (Non-GAAP)……………………………… (43)$ 524$ 1,201$ 1,399$ Three Months Ended December 31, Twelve Months Ended December 31, Corporate and Other 2021 2020 2021 2020 Net Loss………………………..……...……………………………. (3,707)$ (1,704)$ (5,917)$ (6,303)$ Interest Expense……………….…………………………………… 121 219 481 1,489 Income Tax Provision (Benefit)…………………..…………… 1,680 (371) (408) (2,122) Depreciation and Amortization………………………………………………………………54 43 212 151 Share-based Compensation and Other Stock Payments………………………………………………………………586 260 1,155 767 Adjusted EBITDA (Non-GAAP)……………………..……………. (1,266)$ (1,553)$ (4,477)$ (6,018)$ Three Months Ended December 31, Twelve Months Ended December 31,


EXHIBIT C Consolidated Statement of Cash Flows 16 | Investor Presentation 2021 2020 Net income (loss)…...……………………………………………………………………………………………2,847$ (1,487)$ Adjustments to reconcile net cash (used in) provided by operating activities: Depreciation and amortization expense…………………………………………………………………….6,336 6,279 Paycheck Protection Program loan forgiveness…………………………………………………………………….(9,151) - Deferred income taxes………………………………………………………………………………………….(2) (4) Change in fair value of interest rate swap agreements………………………………………………………………….23 167 Stock-based compensation……………………………………………………………………………………..1,541 1,295 Allowance for doubtful accounts……………………………………………………………………………….(426) 346 Common stock issued under defined contribution 401(k) plan…………………………………….1,193 - Gain on disposal of assets……………………………………………………………………………………….(33) - Changes in operating assets and liabilities: Accounts receivable………………………………………………………………………………………………..1,961 2,627 Employee retention credit receivable………………………………………………………………………………………………..(497) - Contract assets………………………………………………………………………………………………..1,117 (2,253) Inventories ……………………………………………………………………………………………………………(6,653) 5,139 Prepaid expenses and other current assets……………………………………………………………..133 (865) Accounts payable ……………………………………………………………………………………………….(1,736) (3,320) Accrued liabilities………………………………………………………………………………………………(2,676) 1,229 Customer deposits…………………………………………………………………………………………….(6,737) (3,898) Other non-current assets and liabilities…………………………………………………………………………………………….(66) 75 Net cash (used in) provided by operating activities………………………………………………………………………………………………(12,826) 5,330 Purchases of property and equipment……………………………………………………………………………...…….(1,707) (1,547) Proceeds from disposals of property and equipment……………………………………………………………………33 - (1,674) (1,547) CASH FLOWS FROM FINANCING ACTIVITIES: Proceeds from line of credit………………………………………………………………………..156,004 153,891 Payments on line of credit………………………………………………………………………..(150,899) (164,163) Proceeds from long-term debt…………………………………………………………………………817 9,530 Payments on long-term debt…………………………………………………………………………(161) (1,186) Principal payments on finance leases………………………………………………………………………………..(1,672) (992) Shares withheld for taxes in connection with issuance of restricted stock………………………………………………………………………………..(1,423) (139) Proceeds from sale of common stock, net………………………………………………………………………………..9,314 232 11,980 (2,827) - NET (DECREASE) INCREASE IN CASH……………………………………….…………………….(2,520) 956 CASH beginning of the period……………………………………………………. 3,372 2,416 CASH end of the period………………………………………………………………………..852$ 3,372$ Supplemental cash flow information: Interest paid………………………………………………………………………………...……………….……………..741$ 1,449$ Income taxes paid………………………………………………………………..………………………………………………..102$ 81$ Non-cash investing and financing activities: Equipment additions via finance lease………………………………………………………………..………………………………………………..2,757$ 3,196$ Non-cash purchases of property and equipment………………………………………………………………..………………………………………………..18$ 376$ Twelve Months Ended December 31, CASH FLOWS FROM OPERATING ACTIVITIES: CASH FLOWS FROM INVESTING ACTIVITIES: Net cash used in investing activities……………………………………………………………………………………………… Net cash provided by (used in) financing activities………………………………………………………………………………………………………………………………


EXHIBIT D Consolidated Balance Sheet 17 | Investor Presentation December 31, December 31, 2021 2020 CURRENT ASSETS: Cash………………………………………………………………………………………………………………………852$ 3,372$ Accounts receivable, net………………………………………………………………………………………………………………………13,802 15,337 Employee retention credit receivable………………………………………………………………………………………………………………………497 - Contract assets………………………………………………………………………………………………………………………1,136 2,253 Inventories, net………………………………………………………………………………………………………..33,377 26,724 Prepaid expenses and other current assets……………………………………………………………………………2,661 2,909 Total current assets…………………………………………………………………………………………………….52,325 50,595 LONG-TERM ASSETS: Property and equipment, net………………………………………………………………………………….. 43,655 45,195 Operating lease right-of-use assets…………………………………………………………………………………………………………………..18,029 19,321 Intangible assets, net…………………………………………………………………………………………… 3,453 4,186 Other assets………………………………………………………………………………………………………. 585 385 TOTAL ASSETS……………………………………………………………………………………………………….. 118,047$ 119,682$ CURRENT LIABILITIES: Line of credit and other notes payable…………………………………………………………………………………………..6,650$ 1,406$ Current portion of finance lease obligations………………………………………………………………………..2,060 1,427 Current portion of operating lease obligations………………………………………………………………………..1,775 1,832 Accounts payable………………………………………………………………………………………………………….16,462 18,180 Accrued liabilities ………………………………………………………………………………………………………..3,654 6,307 Customer deposits…………………………………………………………………………………………………. 12,082 18,819 Total current liabilities………………………………………………………………………………………………..42,683 47,971 LONG-TERM LIABILITIES: Long-term debt, net of current maturities……………………………………………………………………………….177 9,381 Long-term finance lease obligations, net of current portion…………………………………………………. 2,481 1,996 Long-term operating lease obligations, net of current portion………………………………………………….18,405 19,569 Other…………………………………………………………………………………………………………………………167 104 Total long-term liabilities………………………………………………………………………………………….21,230 31,050 COMMITMENTS AND CONTINGENCIES STOCKHOLDERS' EQUITY: Preferred stock, $0.001 par value; 10,000,000 shares authorized; no shares issued or outstanding…………………………………………………………………………………………………………………….- - Common stock, $0.001 par value; 30,000,000 shares authorized; 19,859,650 and 17,211,498 shares issued as of December 31, 2021 and December 31, 2020, respectively………………………………………………………………………………………………………20 17 Treasury stock, at cost, 273,937 shares as of December 31, 2021 and December 31, 2020, respectively……………………………………………………………………………………………………… (1,842) (1,842) Additional paid-in capital………………………………………………………………………………………………….395,372 384,749 Accumulated deficit……………………………………………………………………………………………………………….(339,416) (342,263) Total stockholders' equity……………………………………………………………………………………… 54,134 40,661 TOTAL LIABILITIES AND STOCKHOLDERS' EQUITY………………………………………………………….. 118,047$ 119,682$ ASSETS LIABILITIES AND STOCKHOLDERS' EQUITY


Please contact our investor relations team at [email protected] IR CONTACT