UNITED STATES
SECURITIES AND EXCHANGE COMMISSION
Washington, D.C. 20549
_____________________
Form 8-K
_____________________
CURRENT REPORT
Pursuant to Section 13 or 15(d) of the Securities Exchange Act of 1934
Date of Report (Date of earliest event Reported): November 4, 2020
BROADWIND, INC.
(Exact Name of Registrant as Specified in Charter)
| Delaware | 001-34278 | 88-0409160 |
| (State or Other Jurisdiction of Incorporation) | (Commission File Number) | (I.R.S. Employer Identification Number) |
| 3240 South Central Avenue, Cicero, Illinois 60804 |
| (Address of Principal Executive Offices) (Zip Code) |
(708) 780-4800
(Registrant's telephone number, including area code)
Not Applicable
(Former name or former address, if changed since last report)
Check the appropriate box below if the Form 8-K filing is intended to simultaneously satisfy the filing obligation of the registrant under any of the following provisions:
|
| | [ ] | Written communications pursuant to Rule 425 under the Securities Act (17 CFR 230.425) |
| | [ ] | Soliciting material pursuant to Rule 14a-12 under the Exchange Act (17 CFR 240.14a-12) |
| | [ ] | Pre-commencement communications pursuant to Rule 14d-2(b) under the Exchange Act (17 CFR 240.14d-2(b)) |
| | [ ] | Pre-commencement communications pursuant to Rule 13e-4(c) under the Exchange Act (17 CFR 240.13e-4(c)) |
Securities registered pursuant to Section 12(b) of the Act:
| Title of each class | Trading Symbol(s) | Name of each exchange on which registered |
| Common stock, $0.001 par value | BWEN | The NASDAQ Capital Market |
Indicate by check mark whether the registrant is an emerging growth company as defined in Rule 405 of the Securities Act of 1933 (17 CFR §230.405) or Rule 12b-2 of the Securities Exchange Act of 1934 (17 CFR §240.12b-2). Emerging growth company [ ]
If an emerging growth company, indicate by check mark if the registrant has elected not to use the extended transition period for complying with any new or revised financial accounting standards provided pursuant to Section 13(a) of the Exchange Act. [ ]
Item 2.02. Results of Operations and Financial Condition.
On November 4, 2020, Broadwind, Inc. (the “Company”) issued a press release announcing its financial results as of and for the quarter ended September 30, 2020. The press release is incorporated herein by reference and is attached hereto as Exhibit 99.1.
The information contained in, or incorporated into, this Item 2.02 of this Current Report on Form 8-K (this “Report”), including Exhibit 99.1, is furnished under Item 2.02 of Form 8-K and shall not be deemed “filed” for the purposes of Section 18 of the Securities Exchange Act of 1934, as amended (the “Exchange Act”) or otherwise subject to the liabilities of that section, and shall not be deemed to be incorporated by reference into the filings of the Company under the Securities Act of 1933, as amended (the “Securities Act”) or the Exchange Act regardless of any general incorporation language in such filings.
Item 7.01. Regulation FD Disclosure.
An Investor Presentation dated November 4, 2020 is incorporated herein by reference and attached hereto as Exhibit 99.2.
The information contained in, or incorporated into, this Item 7.01 of this Report, including Exhibit 99.2 attached hereto, is furnished under Item 7.01 of Form 8-K and shall not be deemed “filed” for the purposes of Section 18 of the Exchange Act or otherwise subject to the liabilities of that section, and shall not be deemed to be incorporated by reference into the filings of the Company under the Securities Act or the Exchange Act regardless of any general incorporation language in such filings.
This Report shall not be deemed an admission as to the materiality of any information in this Report that is being disclosed pursuant to Regulation FD.
Please refer to Exhibit 99.2 for a discussion of certain forward-looking statements included therein and the risks and uncertainties related thereto.
Item 9.01. Financial Statements and Exhibits.
(d) Exhibits
SIGNATURE
Pursuant to the requirements of the Securities Exchange Act of 1934, the registrant has duly caused this report to be signed on its behalf by the undersigned hereunto duly authorized.
| | BROADWIND, INC. |
| | | |
| | | |
| Date: November 4, 2020 | By: | /s/ Eric B. Blashford |
| | | Eric B. Blashford |
| | | President, Chief Executive Officer
(Principal Executive Officer) |
| | | |
EXHIBIT INDEX
EXHIBIT 99.1
Broadwind Announces Third Quarter 2020 Results
CICERO, Ill., Nov. 04, 2020 (GLOBE NEWSWIRE) -- Broadwind (NASDAQ: BWEN), a diversified precision manufacturer of specialized components and solutions serving global markets, today announced results for the third quarter 2020.
THIRD QUARTER 2020 RESULTS
(As compared to the third quarter 2019)
- Total revenue of $54.6 million, +18% y/y
- Total gross profit of $3.7 million, (6%) y/y
- Total net loss of ($1.0) million, or ($0.06) per basic share
- Total non-GAAP adjusted EBITDA of $1.3 million (30%) y/y
- Total cash and excess availability of $21.8 million, +13% y/y
For the three months ended September 30, 2020, Broadwind reported total sales of $54.6 million, an increase of 18.4% when compared to the prior-year period. The Company reported a net loss of ($1.0) million, or ($0.06) per basic share in the third quarter 2020, compared to a net loss of ($0.9) million, or ($0.06) per basic share, in the third quarter 2019. The Company reported adjusted EBITDA, a non-GAAP measure, of $1.3 million in the third quarter 2020, compared to $1.9 million in the prior-year period.
Year-over-year revenue growth in the Heavy Fabrications segment more than offset a decline in Gearing and Industrial Solutions segment revenues during the third quarter 2020. Heavy Fabrications segment revenue increased by more than 28% on a year-over-year basis in the third quarter, supported by a combination of strong demand for wind towers, together with higher selling prices, the combination of which contributed to a favorable sales mix. Gearing segment revenue declined by 11% driven primarily by lower order intake in recent quarters, primarily in oil/gas and mining end markets, partially offset by increased demand in other industrial markets. Industrial Solutions segment revenue declined 5%, due to supply chain constraints and customer project delays.
STRATEGY UPDATE
During the third quarter, Broadwind continued to execute on a multi-year strategy focused on (1) market expansion across key verticals (2) improved operating efficiency and plant utilization; and (3) disciplined capital management.
- Diverse market focus. Revenue from non-wind markets, including the industrial, mining and natural gas turbine markets, continue to be a strategic focus for the Company, contributing 29% of total revenue for the nine months ended 2020. The Company’s trailing twelve months revenue from non-wind markets is $63 million, a reflection of the Company’s progress against executing its multi-year strategy to diversify its customers and end market exposure beyond its legacy wind business. The Company continues to evaluate new, offshore wind customer opportunities that leverage its existing expertise.
- Increased operating efficiency. The Company sold 312 wind tower sections in the third quarter 2020, versus 243 sections in the prior-year period. Plant utilization has increased year over year, due in part to increases in expected wind tower installations in the current year and expansion of its customer base. Broadwind produced towers for three of the four top global wind turbine manufacturers in Q3. During the current year quarter, supply chain and staffing constraints caused by the COVID-19 pandemic resulted in increased manufacturing inefficiencies.
- Disciplined capital management. During the third quarter, the Company reduced total outstanding indebtedness under its line of credit by $4.5 million. Total cash and availability under outstanding credit facilities was flat sequentially and increased $2.5 million when compared to the prior year third quarter. As of September 30, 2020, the ratio of net debt to trailing twelve-month adjusted EBITDA was .9x, after excluding the $9.2 million in loans received under the Paycheck Protection Program.
MANAGEMENT COMMENTARY
“During a period of pandemic-related market disruption, we have continued to advance our long-term strategy through targeted end-market diversification, operational execution, cost discipline and the pursuit of new organic growth opportunities that leverage our precision manufacturing expertise,” stated Eric Blashford, President and CEO of Broadwind.
“Total revenue increased more than 18% on a year-over-year basis in the third quarter, driven by sustained demand for new wind tower installations in the US,” continued Blashford. “Despite the negative impacts caused by the pandemic, we sold a total of 312 wind tower sections during the third quarter, an increase of nearly 30% when compared to the year-ago period, supported by a safe-harbor extension of the Production Tax Credit announced earlier this year.”
“By 2025, we expect annual North American offshore wind capacity additions to exceed onshore additions, representing a significant new opportunity for Broadwind,” stated Blashford. “We are continuing to evaluate the economics of the offshore tower market and our strategy to serve this market. We believe the transition to offshore represents a natural progression for our business, should we choose to move forward with the initiative.”
“We generated positive cash flow during the third quarter, positioning us to reduce outstanding borrowings under our line of credit by $4.5 million during the period. At third quarter-end, outstanding borrowings on our credit facility stood at $7.6 million, the lowest level since the third quarter 2017. With almost $22 million of cash and excess availability on our credit facility, we believe we are well capitalized to support the ongoing growth of the business.”
“Despite the effects of COVID-19 on our business and the general economy in 2020, assuming there are no new material disturbances caused by the COVID-19 pandemic, we expect year over year growth in Revenue and adjusted EBITDA for the full year 2020. For Q4 2020, we expect revenue to be approximately $43.0 million to $46.0 million and EBITDA to be approximately $0.5 million to $1.0 million.”
ORDERS AND BACKLOG
Total orders declined 48% on a year-over-year basis to $39.6 million in the third quarter, given a reduction in the pace of new tower orders, as wind turbine original equipment manufacturers secured production capacity in advance of historical lead times to secure the full benefit of the Production Tax Credit (PTC) in the prior year. Gearing segment orders declined sequentially mainly due to continued softness in domestic oil and gas production and from mining customers. Industrial Solutions segment orders increased sequentially during the third quarter due to improved demand for aftermarket and new gas turbine components.
Total backlog declined 12% sequentially in the third quarter to $98.6 million, as COVID-19 related delays postponed the timing of customer orders. As of September 30, 2020, Heavy Fabrications represented approximately 74% of total Company backlog.
SEGMENT RESULTS
Heavy Fabrications Segment
Broadwind provides large complex and precision fabrications to customers in a broad range of industrial markets. Key products include wind towers and industrial fabrications, including mining and material handling components and other frames/structures.
Heavy Fabrications segment sales increased by $9.6 million to $43.4 million in the third quarter, when compared to the prior year period, primarily due to strong demand for wind towers. Total operating income increased $1.3 million to $2.0 million, when compared to the third quarter 2019. Segment non-GAAP adjusted EBITDA increased $1.2 million to $3.0 million, when compared to the third quarter 2019. Third quarter segment performance was primarily driven by a 28% year-over-year increase in wind towers sold, a better product mix sold in the quarter, partially offset by increased manufacturing variances associated with supply chain interruptions due in part to the impact of the COVID-19 pandemic and multiple design change overs.
Gearing Segment
Broadwind provides custom gearboxes, loose gearing and heat treat services to a broad set of customers in diverse markets, including oil & gas production, surface and underground mining, wind energy, steel, material handling and other infrastructure markets.
Gearing segment sales declined by $0.9 million to $7.1 million in the third quarter, when compared to the year-ago period, due primarily to lower order intake from oil/gas and mining customers. The Gearing segment reported an operating loss of ($1.0) million, versus operating income of $0.5 million in the prior-year period. Segment non-GAAP adjusted EBITDA declined $1.6 million to ($0.5) million, when compared to the third quarter 2019. Third quarter segment performance was primarily driven by lower sales and increased manufacturing inefficiencies associated with lower activity levels.
Industrial Solutions Segment
Broadwind provides supply chain solutions, inventory management, kitting and assembly services, primarily serving the combined cycle natural gas turbine market.
Industrial Solutions segment sales declined by $0.2 million to $4.1 million in the third quarter, when compared to the year-ago period, as higher sales of aftermarket content was offset by lower sales into the natural gas turbine market, primarily due to supply chain interruptions and customer project delays. Total operating income was flat at $0.1 million in the third quarter, when compared to the prior-year period, given improved expense management. Segment non-GAAP adjusted EBITDA declined $0.1 million to $0.2 million, when compared to the third quarter 2019.
THIRD QUARTER 2020 CONFERENCE CALL
Broadwind will host a conference call today, November 4, 2020, at 11:00 A.M. ET to review the Company’s financial results, discuss recent events and conduct a question-and-answer session. A webcast of the conference call and accompanying presentation materials will be available in the Investor Relations section of Broadwind’s website at www.BWEN.com/Investors. To listen to a live broadcast, go to the site at least 15 minutes prior to the scheduled start time in order to register, download, and install any necessary audio software.
To participate in the live teleconference:
| Domestic Live: | 877-407-9716 |
| International Live: | 201-493-6779 |
| | |
| To listen to a replay of the teleconference, which will be available through November 11, 2020: |
| | |
| Domestic Replay: | 844-512-2921 |
| International Replay: | 412-317-6671 |
| Conference ID: | 13711760 |
ABOUT BROADWIND
Broadwind (NASDAQ: BWEN) is a precision manufacturer of structures, equipment and components for clean tech and other specialized applications. With facilities throughout the U.S., our talented team is committed to helping customers maximize performance of their investments—quicker, easier and smarter. Find out more at www.bwen.com
NON-GAAP FINANCIAL MEASURES
The Company provides non-GAAP adjusted EBITDA (earnings before interest, income taxes, depreciation, amortization, share-based compensation and other stock payments, restructuring costs, impairment charges and other non-cash gains and losses) as supplemental information regarding the Company’s business performance. The Company’s management uses this supplemental information when it internally evaluates its performance, reviews financial trends and makes operating and strategic decisions. The Company believes that this non-GAAP financial measure is useful to investors because it provides investors with a better understanding of the Company’s past financial performance and future results, which allows investors to evaluate the Company’s performance using the same methodology and information as used by the Company’s management. The Company's definition of adjusted EBITDA may be different from similar non-GAAP financial measures used by other companies and/or analysts.
FORWARD-LOOKING STATEMENTS
This release contains “forward looking statements”—that is, statements related to future, not past, events—as defined in Section 21E of the Securities Exchange Act of 1934, as amended, that reflect our current expectations regarding our future growth, results of operations, financial condition, cash flows, performance, business prospects and opportunities, as well as assumptions made by, and information currently available to, our management. Forward-looking statements include any statement that does not directly relate to a current or historical fact. We have tried to identify forward looking statements by using words such as “anticipate,” “believe,” “expect,” “intend,” “will,” “should,” “may,” “plan” and similar expressions, but these words are not the exclusive means of identifying forward looking statements.
Our forward-looking statements may include or relate to our beliefs, expectations, plans and/or assumptions with respect to the following, many of which are, and will be, amplified by the COVID-19 pandemic: (i) the impact of global health concerns, including the impact of the current COVID-19 pandemic on the economies and financial markets and the demand for our products; (ii) state, local and federal regulatory frameworks affecting the industries in which we compete, including the wind energy industry, and the related extension, continuation or renewal of federal tax incentives and grants and state renewable portfolio standards as well as new or continuing tariffs on steel or other products imported into the United States; (iii) our customer relationships and our substantial dependency on a few significant customers and our efforts to diversify our customer base and sector focus and leverage relationships across business units; (iv) the economic and operational stability of our significant customers and suppliers, including their respective supply chains, and the ability to source alternative suppliers as necessary, in light of the COVID-19 pandemic; (v) our ability to continue to grow our business organically and through acquisitions, and the impairment thereto by the impact of the COVID-19 pandemic; (vi) the production, sales, collections, customer deposits and revenues generated by new customer orders and our ability to realize the resulting cash flows; (vii) information technology failures, network disruptions, cybersecurity attacks or breaches in data security, including with respect to any remote work arrangements implemented in response to the COVID-19 pandemic; (viii) the sufficiency of our liquidity and alternate sources of funding, if necessary; (ix) our ability to realize revenue from customer orders and backlog; (x) our ability to operate our business efficiently, comply with our debt obligations, manage capital expenditures and costs effectively, and generate cash flow; (xi) the economy, including its stability in light of the COVID-19 pandemic, and the potential impact it may have on our business, including our customers; (xii) the state of the wind energy market and other energy and industrial markets generally and the impact of competition and economic volatility in those markets; (xiii) the effects of market disruptions and regular market volatility, including fluctuations in the price of oil, gas and other commodities; (xiv) competition from new or existing industry participants including, in particular, increased competition from foreign tower manufacturers; (xv) the effects of the change of administrations in the U.S. federal government; (xvi) our ability to successfully integrate and operate acquired companies and to identify, negotiate and execute future acquisitions; (xvii) the potential loss of tax benefits if we experience an “ownership change” under Section 382 of the Internal Revenue Code of 1986, as amended; (xviii) our ability to utilize various relief options enabled by the CARES Act, including our ability to receive forgiveness of the PPP Loans; (xix) the limited trading market for our securities and the volatility of market price for our securities; and (xx) the impact of future sales of our common stock or securities convertible into our common stock on our stock price. These statements are based on information currently available to us and are subject to various risks, uncertainties and other factors that could cause our actual growth, results of operations, financial condition, cash flows, performance, business prospects and opportunities to differ materially from those expressed in, or implied by, these statements including, but not limited to, those set forth under the caption “Risk Factors” in Part I, Item 1A of our Annual Report on Form 10-K for the year ended December 31, 2019, as supplemented by our Current Report on Form 8-K filed April 17, 2020 and our Quarterly Report on Form 10-Q for the quarterly period ended June 30, 2020. We are under no duty to update any of these statements. You should not consider any list of such factors to be an exhaustive statement of all of the risks, uncertainties or other factors that could cause our current beliefs, expectations, plans and/or assumptions to change. Accordingly, forward-looking statements should not be relied upon as a predictor of actual results.
BROADWIND, INC. AND SUBSIDIARIES
CONSOLIDATED BALANCE SHEETS
(IN THOUSANDS)
(UNAUDITED)
| | | | September 30, | | December 31, |
| | | | | 2020 | | | | 2019 | |
| ASSETS | | | |
| CURRENT ASSETS: | | | |
| | Cash | $ | 2,541 | | | $ | 2,416 | |
| | Accounts receivable, net | | 24,161 | | | | 18,310 | |
| | Contract assets | | 1,475 | | | | - | |
| | Inventories, net | | 25,480 | | | | 31,863 | |
| | Prepaid expenses and other current assets | | 2,463 | | | | 2,124 | |
| | | Total current assets | | 56,120 | | | | 54,713 | |
| LONG-TERM ASSETS: | | | |
| | Property and equipment, net | | 46,101 | | | | 46,940 | |
| | Operating lease right-of-use assets | | 19,067 | | | | 15,980 | |
| | Intangible assets, net | | 4,369 | | | | 4,919 | |
| | Other assets | | 399 | | | | 314 | |
| TOTAL ASSETS | $ | 126,056 | | | $ | 122,866 | |
| | | | | | |
| LIABILITIES AND STOCKHOLDERS' EQUITY | | | |
| CURRENT LIABILITIES: | | | |
| | Line of credit and other notes payable | $ | 8,176 | | | $ | 12,917 | |
| | Current portion of finance lease obligations | | 1,174 | | | | 546 | |
| | Current portion of operating lease obligations | | 1,588 | | | | 1,326 | |
| | Accounts payable | | 17,631 | | | | 21,876 | |
| | Accrued liabilities | | 5,750 | | | | 4,911 | |
| | Customer deposits | | 18,524 | | | | 22,717 | |
| | | Total current liabilities | | 52,843 | | | | 64,293 | |
| LONG-TERM LIABILITIES: | | | |
| | Long-term debt, net of current maturities | | 9,497 | | | | 505 | |
| | Long-term finance lease obligations, net of current portion | | 1,856 | | | | 673 | |
| | Long-term operating lease obligations, net of current portion | | 19,529 | | | | 16,591 | |
| | Other | | | 96 | | | | 44 | |
| | | Total long-term liabilities | | 30,978 | | | | 17,813 | |
| COMMITMENTS AND CONTINGENCIES | | | |
| | | | | | |
| STOCKHOLDERS' EQUITY: | | | |
| | Preferred stock, $0.001 par value; 10,000,000 shares authorized; no shares issued | | | |
| | or outstanding | | - | | | | - | |
| | Common stock, $0.001 par value; 30,000,000 shares authorized; 17,211,498 | | | |
| | and 16,830,930 shares issued as of September 30, 2020 and | | | |
| | December 31, 2019, respectively | | 17 | | | | 17 | |
| | Treasury stock, at cost, 273,937 shares as of September 30, 2020 and December 31, 2019, | | |
| | respectively | | (1,842 | ) | | | (1,842 | ) |
| | Additional paid-in capital | | 384,356 | | | | 383,361 | |
| | Accumulated deficit. | | (340,296 | ) | | | (340,776 | ) |
| | | Total stockholders' equity | | 42,235 | | | | 40,760 | |
| TOTAL LIABILITIES AND STOCKHOLDERS' EQUITY | $ | 126,056 | | | $ | 122,866 | |
BROADWIND, INC. AND SUBSIDIARIES
CONSOLIDATED STATEMENTS OF OPERATIONS
(IN THOUSANDS, EXCEPT PER SHARE DATA)
(UNAUDITED)
| | | Three Months Ended September 30, | | Nine Months Ended September 30, |
| | | | 2020 | | | | 2019 | | | | 2020 | | | | 2019 | |
| | | | | | | | | |
| | | | | | | | | |
| Revenues | $ | 54,614 | | | $ | 46,138 | | | $ | 158,174 | | | $ | 128,967 | |
| Cost of sales | | 50,876 | | | | 42,144 | | | | 142,847 | | | | 117,532 | |
| Restructuring | | - | | | | - | | | | - | | | | 12 | |
| Gross profit | | 3,738 | | | | 3,994 | | | | 15,327 | | | | 11,423 | |
| | | | | | | | | |
| OPERATING EXPENSES: | | | | | | | |
| Selling, general and administrative | | 4,030 | | | | 4,049 | | | | 12,537 | | | | 11,772 | |
| Intangible amortization | | 183 | | | | 203 | | | | 550 | | | | 609 | |
| | Total operating expenses | | 4,213 | | | | 4,252 | | | | 13,087 | | | | 12,381 | |
| Operating (loss) income | | (475 | ) | | | (258 | ) | | | 2,240 | | | | (958 | ) |
| | | | | | | | | |
| OTHER EXPENSE, net: | | | | | | | |
| Interest expense, net | | (507 | ) | | | (610 | ) | | | (1,654 | ) | | | (1,919 | ) |
| Other, net | | (1 | ) | | | (2 | ) | | | (3 | ) | | | (19 | ) |
| | Total other expense, net | | (508 | ) | | | (612 | ) | | | (1,657 | ) | | | (1,938 | ) |
| | | | | | | | | |
| Net (loss) income before provision for income taxes | | (983 | ) | | | (870 | ) | | | 583 | | | | (2,896 | ) |
| Provision for income taxes | | 20 | | | | 28 | | | | 103 | | | | 62 | |
| NET (LOSS) INCOME | $ | (1,003 | ) | | $ | (898 | ) | | $ | 480 | | | $ | (2,958 | ) |
| | | | | | | | | |
| | | | | | | | | |
| NET (LOSS) INCOME PER COMMON SHARE - BASIC: | | | | | | | |
| Net (loss) income | $ | (0.06 | ) | | $ | (0.06 | ) | | $ | 0.03 | | | $ | (0.18 | ) |
| | | | | | | | | |
| WEIGHTED AVERAGE COMMON SHARES OUTSTANDING - BASIC | | 16,866 | | | | 16,236 | | | | 16,741 | | | | 16,024 | |
| | | | | | | | | |
| NET (LOSS) INCOME PER COMMON SHARE - DILUTED: | | | | | | | |
| Net (loss) income | $ | (0.06 | ) | | $ | (0.06 | ) | | $ | 0.03 | | | $ | (0.18 | ) |
| | | | | | | | | |
| WEIGHTED AVERAGE COMMON SHARES OUTSTANDING - DILUTED | | 16,866 | | | | 16,236 | | | | 17,278 | | | | 16,024 | |
BROADWIND, INC. AND SUBSIDIARIES
CONSOLIDATED STATEMENTS OF CASH FLOWS
(IN THOUSANDS)
(UNAUDITED)
| | | | | Nine Months Ended September 30, |
| | | | | | 2020 | | | 2019 | |
| CASH FLOWS FROM OPERATING ACTIVITIES: | | |
| | Net income (loss) | $ | 480 | | $ | (2,958 | ) |
| | | | | | |
| Adjustments to reconcile net cash (used in) provided by operating activities: | |
| | | Depreciation and amortization expense | | 4,761 | | | 5,006 | |
| | | Deferred income taxes | | 12 | | | (11 | ) |
| | | Change in fair value of interest rate swap agreements | | 161 | | | 50 | |
| | | Stock-based compensation | | 763 | | | 765 | |
| | | Allowance for doubtful accounts | | 47 | | | (30 | ) |
| | | Common stock issued under defined contribution 401(k) plan | | - | | | 669 | |
| | | Gain on disposal of assets | | - | | | (1 | ) |
| | | Changes in operating assets and liabilities, net of acquisition: | | |
| | | | Accounts receivable | | (5,898 | ) | | (5,377 | ) |
| | | | Contract assets | | (1,475 | ) | | - | |
| | | | Inventories | | 6,383 | | | (8,580 | ) |
| | | | Prepaid expenses and other current assets | | (303 | ) | | (737 | ) |
| | | | Accounts payable | | (3,900 | ) | | 6,046 | |
| | | | Accrued liabilities | | 678 | | | 1,632 | |
| | | | Customer deposits | | (4,193 | ) | | 7,557 | |
| | | | Other non-current assets and liabilities | | 9 | | | 303 | |
| Net cash (used in) provided by operating activities | | (2,475 | ) | | 4,334 | |
| | | | | | |
| CASH FLOWS FROM INVESTING ACTIVITIES: | | |
| | Purchases of property and equipment. | | (1,597 | ) | | (1,776 | ) |
| | Proceeds from disposals of property and equipment | | - | | | 1 | |
| Net cash used in investing activities | | (1,597 | ) | | (1,775 | ) |
| | | | | | |
| CASH FLOWS FROM FINANCING ACTIVITIES: | | |
| | Proceeds from line of credit | | 142,348 | | | 131,865 | |
| | Payments on line of credit | | (146,216 | ) | | (134,136 | ) |
| | Proceeds from long-term debt | | 9,530 | | | - | |
| | Payments on long-term debt | | (1,003 | ) | | (698 | ) |
| | Principal payments on finance leases | | (694 | ) | | (752 | ) |
| | Proceeds from sale of common stock, net | | 232 | | | - | |
| Net cash provided by (used in) financing activities | | 4,197 | | | (3,721 | ) |
| | | | | | |
| NET INCREASE (DECREASE) IN CASH | | 125 | | | (1,162 | ) |
| CASH beginning of the period | | 2,416 | | | 1,177 | |
| CASH end of the period | $ | 2,541 | | $ | 15 | |
BROADWIND, INC. AND SUBSIDIARIES
SELECTED SEGMENT FINANCIAL INFORMATION
(IN THOUSANDS)
(UNAUDITED)
| | | | Three Months Ended | | Nine Months Ended |
| | | | September 30, | | September 30, |
| | | | | 2020 | | | | 2019 | | | | 2020 | | | | 2019 | |
| | | | | | | | | | | | | | | | | | |
| ORDERS: | | | | | | |
| | Heavy Fabrications | | $ | 31,391 | | | $ | 65,559 | | | $ | 78,306 | | | $ | 174,398 | |
| | Gearing | | | 3,225 | | | | 5,877 | | | | 19,376 | | | | 18,584 | |
| | Industrial Solutions | | | 4,939 | | | | 5,081 | | | | 15,240 | | | | 12,153 | |
| | Total orders | | $ | 39,555 | | | $ | 76,517 | | | $ | 112,922 | | | $ | 205,135 | |
| | | | | | | | | | |
| REVENUES: | | | | | | |
| | Heavy Fabrications | | $ | 43,440 | | | $ | 33,834 | | | $ | 125,424 | | | $ | 91,098 | |
| | Gearing | | | 7,125 | | | | 7,989 | | | | 20,273 | | | | 27,282 | |
| | Industrial Solutions | | | 4,081 | | | | 4,317 | | | | 12,516 | | | | 10,589 | |
| | Corporate and Other | | | (32 | ) | | | (2 | ) | | | (39 | ) | | | (2 | ) |
| | Total revenues | | $ | 54,614 | | | $ | 46,138 | | | $ | 158,174 | | | $ | 128,967 | |
| | | | | | | | | | |
| OPERATING PROFIT/(LOSS): | | | | | | |
| | Heavy Fabrications | | $ | 2,020 | | | $ | 693 | | | $ | 8,760 | | | $ | 789 | |
| | Gearing | | | (1,023 | ) | | | 496 | | | | (1,935 | ) | | | 2,797 | |
| | Industrial Solutions | | | 87 | | | | 141 | | | | 496 | | | | (116 | ) |
| | Corporate and Other | | | (1,559 | ) | | | (1,588 | ) | | | (5,081 | ) | | | (4,428 | ) |
| | Total operating profit/(loss) | | $ | (475 | ) | | $ | (258 | ) | | $ | 2,240 | | | $ | (958 | ) |
BROADWIND, INC. AND SUBSIDIARIES
RECONCILIATION OF NON-GAAP FINANCIAL MEASURES
(IN THOUSANDS)
(UNAUDITED)
| Consolidated | Three Months Ended September 30, | | Nine Months Ended September 30, |
| | | 2020 | | | | 2019 | | | | 2020 | | | | 2019 | |
| Net (Loss)/Income | $ | (1,003 | ) | | $ | (898 | ) | | $ | 480 | | | $ | (2,958 | ) |
| Interest Expense | | 507 | | | | 609 | | | | 1,654 | | | | 1,919 | |
| Income Tax Provision | | 20 | | | | 28 | | | | 103 | | | | 62 | |
| Depreciation and Amortization | | 1,567 | | | | 1,616 | | | | 4,761 | | | | 5,006 | |
| Share-based Compensation and Other Stock Payments | | 206 | | | | 496 | | | | 768 | | | | 1,424 | |
| Restructuring Costs | | - | | | | - | | | | - | | | | 12 | |
| Adjusted EBITDA (Non-GAAP) | | 1,297 | | | | 1,851 | | | | 7,766 | | | | 5,465 | |
| Heavy Fabrications Segment | Three Months Ended September 30, | | Nine Months Ended September 30, |
| | | 2020 | | | 2019 | | | 2020 | | | 2019 |
| Net Income | $ | 1,515 | | $ | 476 | | $ | 6,679 | | $ | 427 |
| Interest Expense | | 83 | | | 61 | | | 277 | | | 190 |
| Income Tax Provision | | 422 | | | 156 | | | 1,804 | | | 157 |
| Depreciation | | 929 | | | 951 | | | 2,831 | | | 3,024 |
| Share-based Compensation and Other Stock Payments | | 36 | | | 187 | | | 140 | | | 566 |
| Restructuring Expense | | - | | | - | | | - | | | 12 |
| Adjusted EBITDA (Non-GAAP) | $ | 2,985 | | $ | 1,831 | | $ | 11,731 | | $ | 4,376 |
| Gearing Segment | Three Months Ended September 30, | | Nine Months Ended September 30, |
| | | 2020 | | | | 2019 | | | 2020 | | | | 2019 |
| Net (Loss)/Income | $ | (1,045 | ) | | $ | 435 | | $ | (2,033 | ) | | $ | 2,531 |
| Interest Expense | | 19 | | | | 61 | | | 89 | | | | 256 |
| Income Tax Provision | | 2 | | | | 1 | | | 8 | | | | 10 |
| Depreciation and Amortization | | 488 | | | | 507 | | | 1,503 | | | | 1,472 |
| Share-based Compensation and Other Stock Payments | | 16 | | | | 110 | | | 56 | | | | 304 |
| Adjusted EBITDA (Non-GAAP) | $ | (520 | ) | | $ | 1,114 | | $ | (377 | ) | | $ | 4,573 |
| Industrial Solutions Segment | Three Months Ended September 30, | | Nine Months Ended September 30, |
| | | 2020 | | | 2019 | | | 2020 | | | 2019 | |
| Net Income/(Loss) | $ | 77 | | $ | 134 | | $ | 433 | | $ | (140 | ) |
| Interest Expense | | 8 | | | 1 | | | 18 | | | 2 | |
| Income Tax Provision | | 2 | | | 3 | | | 42 | | | 17 | |
| Depreciation and Amortization | | 108 | | | 123 | | | 318 | | | 367 | |
| Share-based Compensation and Other Stock Payments | | 14 | | | 15 | | | 65 | | | 41 | |
| Adjusted EBITDA (Non-GAAP) | $ | 209 | | $ | 276 | | $ | 876 | | $ | 287 | |
| Corporate and Other | Three Months Ended September 30, | | Nine Months Ended September 30, |
| | | 2020 | | | | 2019 | | | | 2020 | | | | 2019 | |
| Net Loss | $ | (1,550 | ) | | $ | (1,943 | ) | | $ | (4,599 | ) | | $ | (5,776 | ) |
| Interest Expense | | 397 | | | | 486 | | | | 1,270 | | | | 1,471 | |
| Income Tax (Benefit)/Provision | | (406 | ) | | | (132 | ) | | | (1,751 | ) | | | (122 | ) |
| Depreciation and Amortization | | 42 | | | | 35 | | | | 109 | | | | 143 | |
| Share-based Compensation and Other Stock Payments | | 140 | | | | 184 | | | | 507 | | | | 513 | |
| Adjusted EBITDA (Non-GAAP) | $ | (1,377 | ) | | $ | (1,370 | ) | | $ | (4,464 | ) | | $ | (3,771 | ) |
CORPORATE CONTACT
Jason Bonfigt
[email protected]
EXHIBIT 99.2
3Q20 Results Conference Call Investor Presentation
SAFE - HARBOR STATEMENT 2 | Investor Presentation This release contains “forward looking statements” — that is, statements related to future, not past, events — as defined in Section 21E of the Securities Exchange Act of 1934, as amended, that reflect our current expectations regarding our future growth, results of operations, f ina ncial condition, cash flows, performance, business prospects and opportunities, as well as assumptions made by, and information currently available to , our management. Forward - looking statements include any statement that does not directly relate to a current or historical fact. We have tried to identify forward looking statements by using words such as “anticipate,” “believe,” “expect,” “intend,” “will,” “should,” “may,” “plan” and similar ex pre ssions, but these words are not the exclusive means of identifying forward looking statements. Our forward - looking statements may include or relate to our beliefs, expectations, plans and/or assumptions with respect to the following, many of which are, and will be, amplified by the COVID - 19 pandemic: ( i ) the impact of global health concerns, including the impact of the current COVID - 19 pandemic on the economies and financial markets and the demand for our products; (ii) state, local and federal regulatory frameworks affe cti ng the industries in which we compete, including the wind energy industry, and the related extension, continuation or renewal of federal tax incentives and grants and state renewable portfolio standards as well as new or continuing tariffs on steel or other products imported into the United States ; ( iii) our customer relationships and our substantial dependency on a few significant customers and our efforts to diversify our customer base an d s ector focus and leverage relationships across business units; (iv) the economic and operational stability of our significant customers and suppliers, inc luding their respective supply chains, and the ability to source alternative suppliers as necessary, in light of the COVID - 19 pandemic; (v) our ability to continue to grow our business organically and through acquisitions, and the impairment thereto by the impact of the COVID - 19 pandemic; (vi) the produ ction, sales, collections, customer deposits and revenues generated by new customer orders and our ability to realize the resulting cash fl ows ; (vii) information technology failures, network disruptions, cybersecurity attacks or breaches in data security, including with respect to any r emo te work arrangements implemented in response to the COVID - 19 pandemic; (viii) the sufficiency of our liquidity and alternate sources of funding, if n ecessary; (ix) our ability to realize revenue from customer orders and backlog; (x) our ability to operate our business efficiently, comply with our debt o bli gations, manage capital expenditures and costs effectively, and generate cash flow; (xi) the economy, including its stability in light of the COVID - 19 p andemic, and the potential impact it may have on our business, including our customers; (xii) the state of the wind energy market and other energy and i ndu strial markets generally and the impact of competition and economic volatility in those markets; (xiii) the effects of market disruptions and regular mar ket volatility, including fluctuations in the price of oil, gas and other commodities; (xiv) competition from new or existing industry participants inc lud ing, in particular, increased competition from foreign tower manufacturers; (xv) the effects of the change of administrations in the U.S. federal governmen t; (xvi) our ability to successfully integrate and operate acquired companies and to identify, negotiate and execute future acquisitions; (xvii) the pot ential loss of tax benefits if we experience an “ownership change” under Section 382 of the Internal Revenue Code of 1986, as amended; (xviii) our ability t o u tilize various relief options enabled by the CARES Act, including our ability to receive forgiveness of the PPP Loans; (xix) the limited trading ma rke t for our securities and the volatility of market price for our securities; and (xx) the impact of future sales of our common stock or securities converti ble into our common stock on our stock price. These statements are based on information currently available to us and are subject to various risks, uncert ain ties and other factors that could cause our actual growth, results of operations, financial condition, cash flows, performance, business prospects and op por tunities to differ materially from those expressed in, or implied by, these statements including, but not limited to, those set forth under the cap tion “Risk Factors” in Part I, Item 1A of our Annual Report on Form 10 - K for the year ended December 31, 2019, as supplemented by our Current Report on Form 8 - K filed April 17, 2020 and our Quarterly Report on Form 10 - Q for the quarterly period ended June 30, 2020. We are under no duty to update any of t hese statements. You should not consider any list of such factors to be an exhaustive statement of all of the risks, uncertainties or other factor s t hat could cause our current beliefs, expectations, plans and/or assumptions to change. Accordingly, forward - looking statements should not be relied upon as a predictor of actual results.

PERFORMANCE OVERVIEW
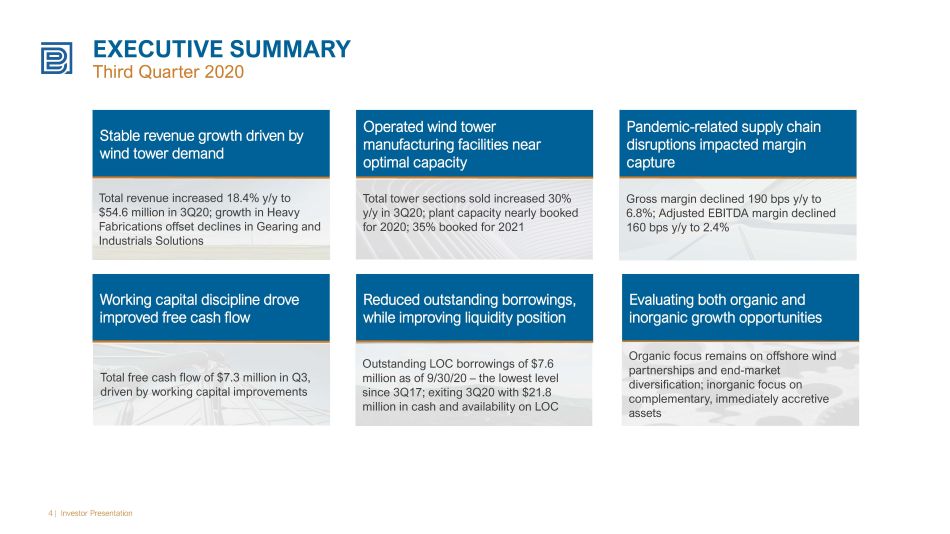
4 | Investor Presentation EXECUTIVE SUMMARY Third Quarter 2020 Stable revenue growth driven by wind tower demand Operated wind tower manufacturing facilities near optimal capacity Pandemic - related supply chain disruptions impacted margin capture Working capital discipline drove improved free cash flow Reduced outstanding borrowings, while improving liquidity position Evaluating both organic and inorganic growth opportunities Total revenue increased 18.4% y/y to $54.6 million in 3Q20; growth in Heavy Fabrications offset declines in Gearing and Industrials Solutions Total tower sections sold increased 30% y/y in 3Q20; plant capacity nearly booked for 2020; 35% booked for 2021 Total free cash flow of $7.3 million in Q3, driven by working capital improvements Outstanding LOC borrowings of $7.6 million as of 9/30/20 – the lowest level since 3Q17; exiting 3Q20 with $21.8 million in cash and availability on LOC Gross margin declined 190 bps y/y to 6.8%; Adjusted EBITDA margin declined 160 bps y/y to 2.4% Organic focus remains on offshore wind partnerships and end - market diversification; inorganic focus on complementary, immediately accretive assets
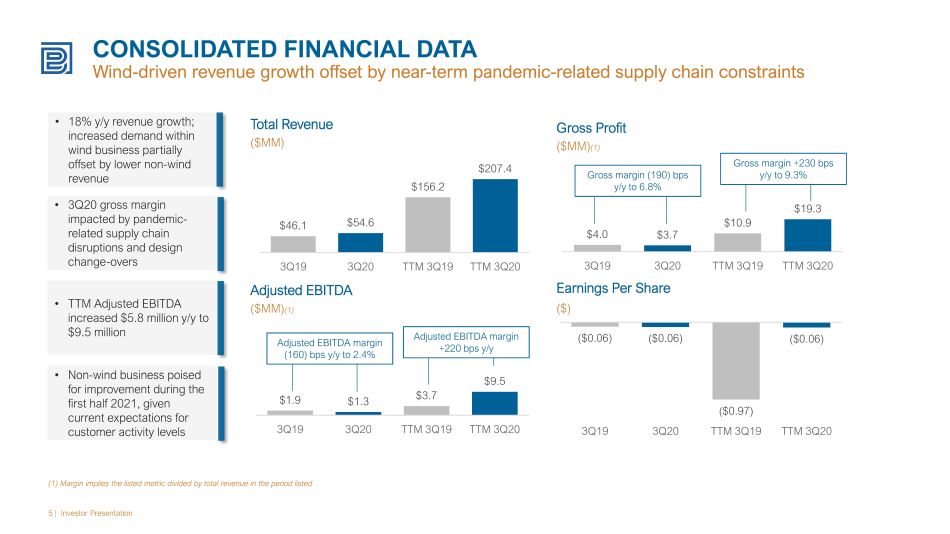
CONSOLIDATED FINANCIAL DATA Wind - driven revenue growth offset by near - term pandemic - related supply chain constraints 5 | Investor Presentation Total Revenue ($MM) Gross Profit ($MM) (1) Adjusted EBITDA ($MM) (1) Earnings Per Share ($) • 18% y/y revenue growth; increased demand within wind business partially offset by lower non - wind revenue • 3Q20 gross margin impacted by pandemic - related supply chain disruptions and design change - overs • TTM Adjusted EBITDA increased $5.8 million y/y to $9.5 million • Non - wind business poised for improvement during the first half 2021, given current expectations for customer activity levels $46.1 $54.6 $156.2 $207.4 3Q19 3Q20 TTM 3Q19 TTM 3Q20 ($0.06) ($0.06) ($0.97) ($0.06) 3Q19 3Q20 TTM 3Q19 TTM 3Q20 (1) Margin implies the listed metric divided by total revenue in the period listed $4.0 $3.7 $10.9 $19.3 3Q19 3Q20 TTM 3Q19 TTM 3Q20 $1.9 $1.3 $3.7 $9.5 3Q19 3Q20 TTM 3Q19 TTM 3Q20 Adjusted EBITDA margin +220 bps y/y Adjusted EBITDA margin (160) bps y/y to 2.4% Gross margin +230 bps y/y to 9.3% Gross margin ( 190 ) bps y/y to 6.8%
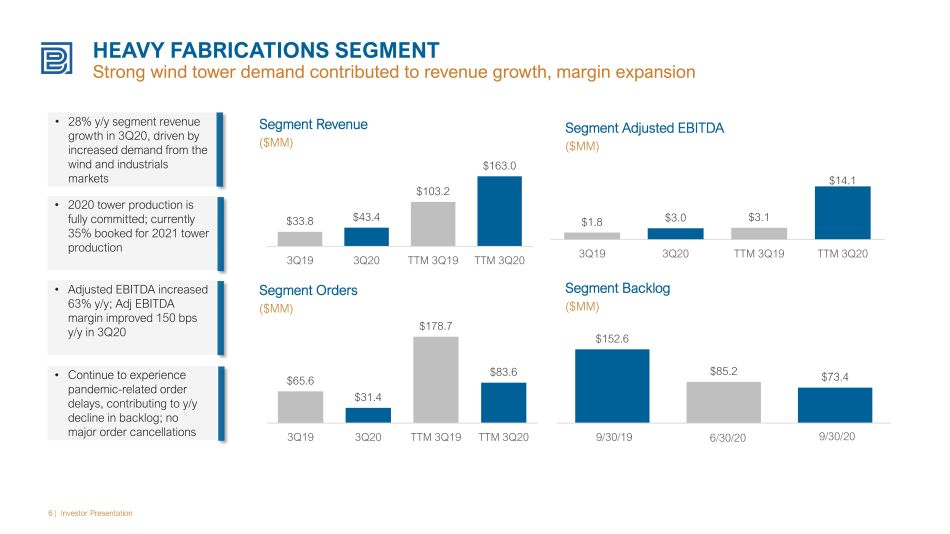
HEAVY FABRICATIONS SEGMENT Strong wind tower demand contributed to revenue growth, margin expansion 6 | Investor Presentation Segment Revenue ($MM) Segment Adjusted EBITDA ($MM) Segment Orders ($MM) Segment Backlog ($MM) • 28% y/y segment revenue growth in 3Q20, driven by increased demand from the wind and industrials markets • 2020 tower production is fully committed; currently 35% booked for 2021 tower production • Adjusted EBITDA increased 63% y/y; Adj EBITDA margin improved 150 bps y/y in 3Q20 • Continue to experience pandemic - related order delays, contributing to y/y decline in backlog ; no major order cancellations $33.8 $43.4 $103.2 $163.0 3Q19 3Q20 TTM 3Q19 TTM 3Q20 $1.8 $3.0 $3.1 $14.1 3Q19 3Q20 TTM 3Q19 TTM 3Q20 $65.6 $31.4 $178.7 $83.6 3Q19 3Q20 TTM 3Q19 TTM 3Q20 $152.6 $85.2 $73.4 3Q19 2Q20 3Q20 9/30/19 6/30/20 9/30/20
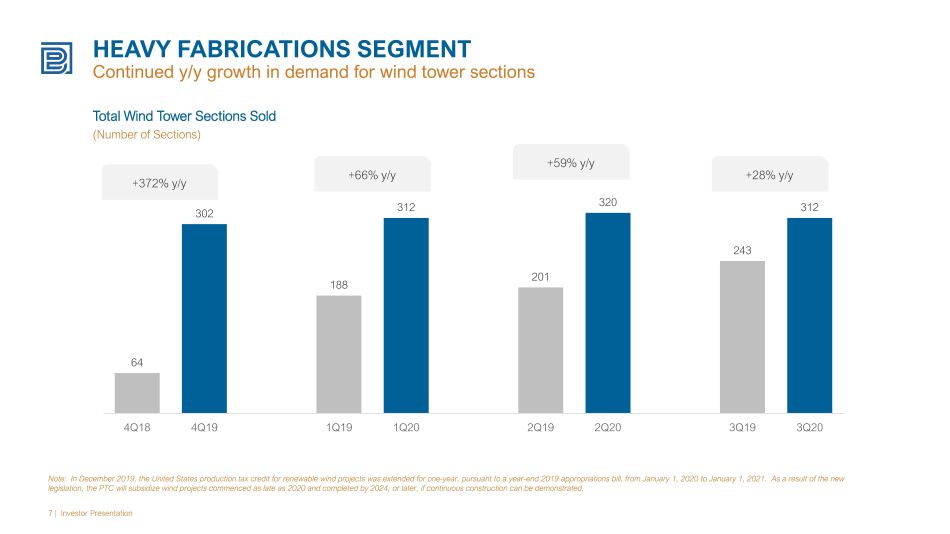
HEAVY FABRICATIONS SEGMENT Continued y/y growth in demand for wind tower sections 7 | Investor Presentation Total Wind Tower Sections Sold (Number of Sections) Note: In December 2019, the United States production tax credit for renewable wind projects was extended for one - year, pursuant to a year - end 2019 appropriations bill, from January 1, 2020 to January 1, 2021. As a result of the new legislation, the PTC will subsidize wind projects commenced as late as 2020 and completed by 2024, or later, if continuous co nst ruction can be demonstrated. +372% y/y 64 302 188 312 201 320 243 312 4Q18 4Q19 1Q19 1Q20 2Q19 2Q20 3Q19 3Q20 +66% y/y +59% y/y +28% y/y
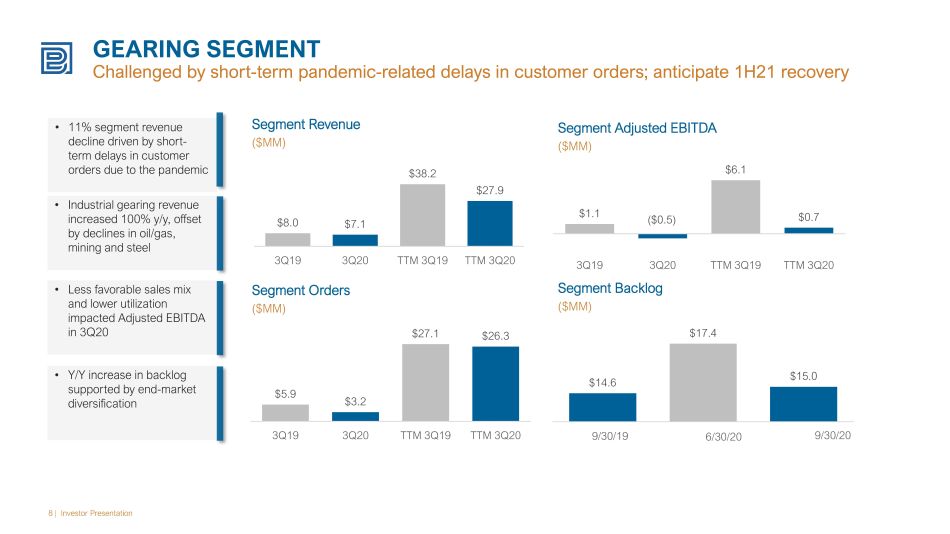
GEARING SEGMENT Challenged by short - term pandemic - related delays in customer orders; anticipate 1H21 recovery 8 | Investor Presentation Segment Revenue ($MM) Segment Adjusted EBITDA ($MM) Segment Orders ($MM) Segment Backlog ($MM) • 11% segment revenue decline driven by short - term delays in customer orders due to the pandemic • Industrial gearing revenue increased 100% y/y, offset by declines in oil/gas, mining and steel • Less favorable sales mix and lower utilization impacted Adjusted EBITDA in 3Q20 • Y/Y increase in backlog supported by end - market diversification $8.0 $7.1 $38.2 $27.9 3Q19 3Q20 TTM 3Q19 TTM 3Q20 $1.1 ($0.5) $6.1 $0.7 3Q19 3Q20 TTM 3Q19 TTM 3Q20 $5.9 $3.2 $27.1 $26.3 3Q19 3Q20 TTM 3Q19 TTM 3Q20 $14.6 $17.4 $15.0 3Q19 2Q20 3Q20 9/30/19 6/30/20 9/30/20
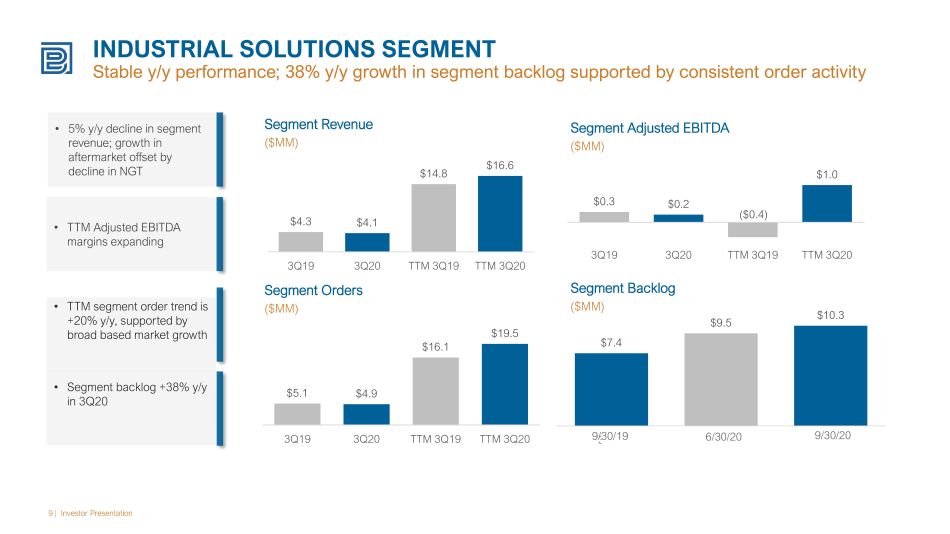
INDUSTRIAL SOLUTIONS SEGMENT Stable y/y performance; 38% y/y growth in segment backlog supported by consistent order activity 9 | Investor Presentation Segment Revenue ($MM) Segment Adjusted EBITDA ($MM) Segment Orders ($MM) Segment Backlog ($MM) • 5% y/y decline in segment revenue; growth in aftermarket offset by decline in NGT • TTM segment order trend is +20% y/y, supported by broad based market growth • Segment backlog +38% y/y in 3Q20 $4.3 $4.1 $14.8 $16.6 3Q19 3Q20 TTM 3Q19 TTM 3Q20 $0.3 $0.2 ($0.4) $1.0 3Q19 3Q20 TTM 3Q19 TTM 3Q20 $5.1 $4.9 $16.1 $19.5 3Q19 3Q20 TTM 3Q19 TTM 3Q20 $7.4 $9.5 $10.3 3Q19 2Q20 3Q20 9/30/19 6/30/20 9/30/20 • TTM Adjusted EBITDA margins expanding
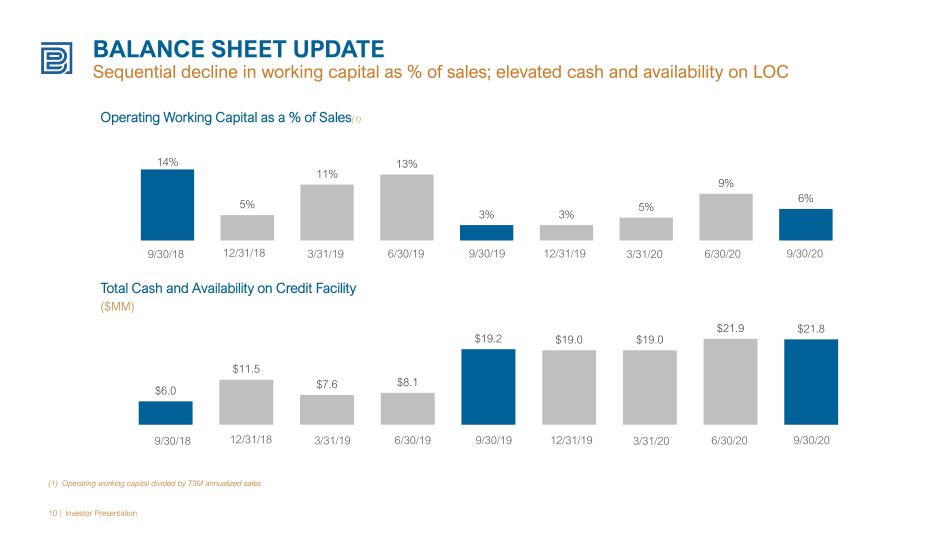
BALANCE SHEET UPDATE Sequential decline in working capital as % of sales; elevated cash and availability on LOC 10 | Investor Presentation Total Cash and Availability on Credit Facility ($MM) Operating Working Capital as a % of Sales (1) (1) Operating working capital divided by T3M annualized sales 9/30/18 12/31/18 3/31/19 6/30/19 9/30/19 12/31/19 3/31/20 6/30/20 9/30/18 12/31/18 3/31/19 6/30/19 9/30/19 12/31/19 3/31/20 6/30/20 9/30/20 9/30/20 14% 5% 11% 13% 3% 3% 5% 9% 6% $6.0 $11.5 $7.6 $8.1 $19.2 $19.0 $19.0 $21.9 $21.8

MANAGEMENT OUTLOOK
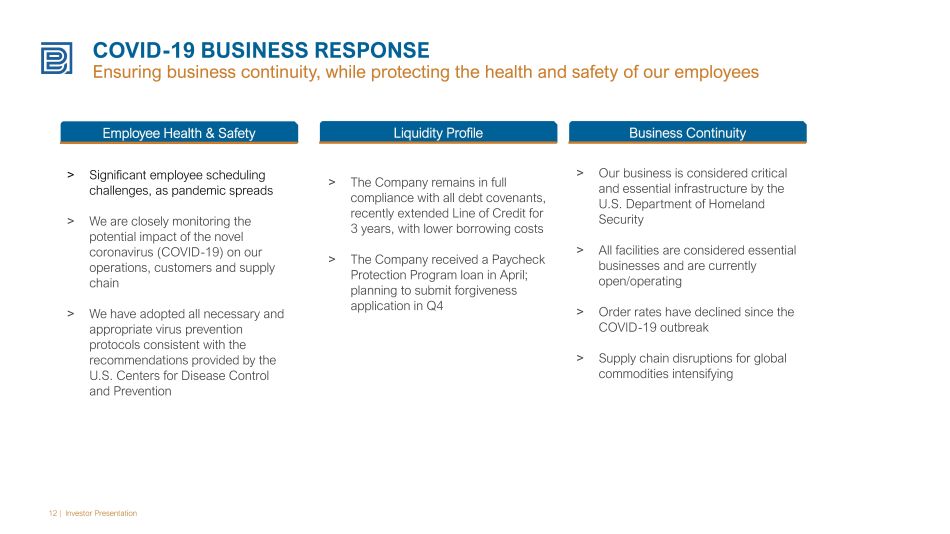
COVID - 19 BUSINESS RESPONSE Ensuring business continuity, while protecting the health and safety of our employees 12 | Investor Presentation Employee Health & Safety Liquidity Profile Business Continuity > The Company remains in full compliance with all debt covenants, recently extended Line of Credit for 3 years, with lower borrowing costs > The Company received a Paycheck Protection Program loan in April; planning to submit forgiveness application in Q4 > Our business is considered critical and essential infrastructure by the U.S. Department of Homeland Security > All facilities are considered essential businesses and are currently open/operating > Order rates have declined since the COVID - 19 outbreak > Supply chain disruptions for global commodities intensifying > Significant employee scheduling challenges, as pandemic spreads > We are closely monitoring the potential impact of the novel coronavirus (COVID - 19) on our operations, customers and supply chain > We have adopted all necessary and appropriate virus prevention protocols consistent with the recommendations provided by the U.S. Centers for Disease Control and Prevention
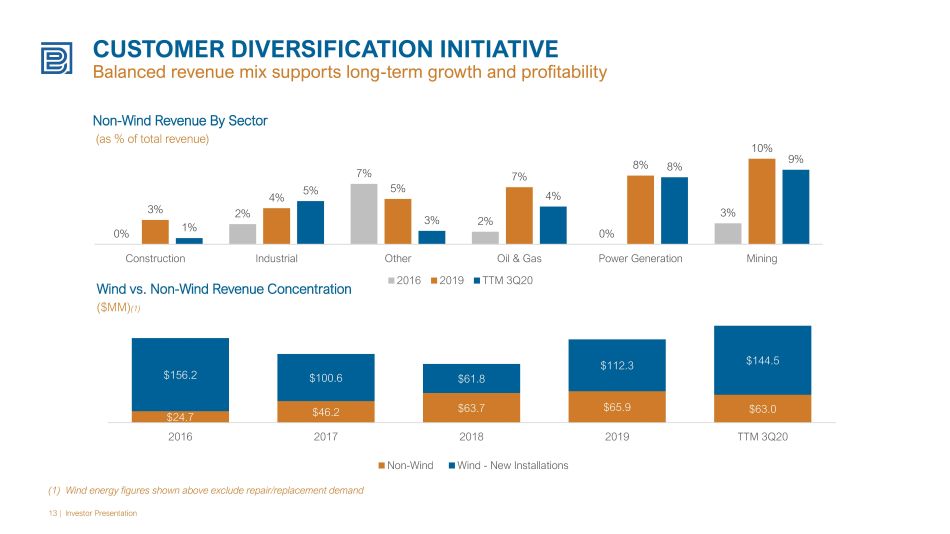
CUSTOMER DIVERSIFICATION INITIATIVE Balanced revenue mix supports long - term growth and profitability 13 | Investor Presentation Wind vs. Non - Wind Revenue Concentration ($MM) (1) Non - Wind Revenue By Sector (as % of total revenue) (1) Wind energy figures shown above exclude repair/replacement demand 0% 2% 7% 2% 0% 3% 3% 4% 5% 7% 8% 10% 1% 5% 3% 4% 8% 9% Construction Industrial Other Oil & Gas Power Generation Mining 2016 2019 TTM 3Q20 $24.7 $46.2 $63.7 $65.9 $63.0 $156.2 $100.6 $61.8 $112.3 $144.5 2016 2017 2018 2019 TTM 3Q20 Non-Wind Wind - New Installations
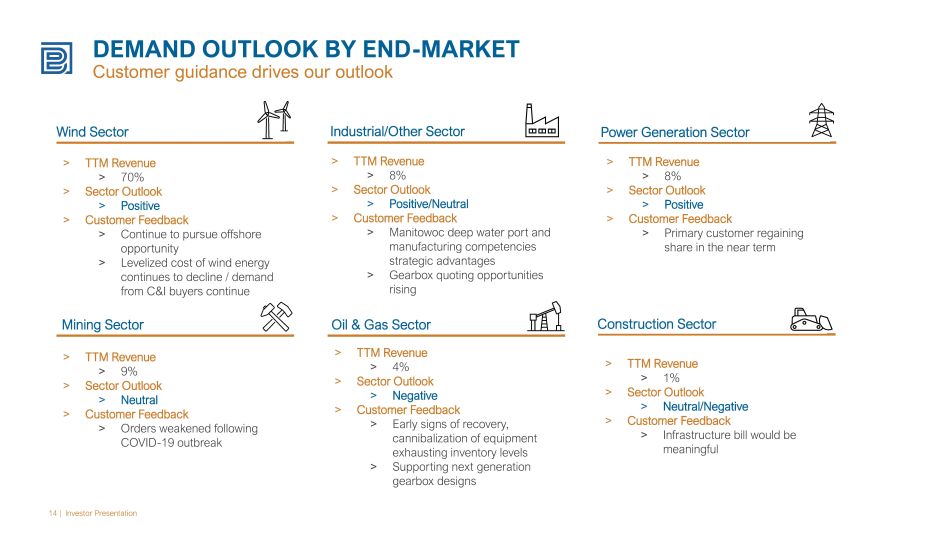
DEMAND OUTLOOK BY END - MARKET Customer guidance drives our outlook 14 | Investor Presentation > TTM Revenue > 70% > Sector Outlook > Positive > Customer Feedback > Continue to pursue offshore opportunity > Levelized cost of wind energy continues to decline / demand from C&I buyers continue > TTM Revenue > 8% > Sector Outlook > Positive/Neutral > Customer Feedback > Manitowoc deep water port and manufacturing competencies strategic advantages > Gearbox quoting opportunities rising > TTM Revenue > 8% > Sector Outlook > Positive > Customer Feedback > Primary customer regaining share in the near term > TTM Revenue > 9% > Sector Outlook > Neutral > Customer Feedback > Orders weakened following COVID - 19 outbreak > TTM Revenue > 4% > Sector Outlook > Negative > Customer Feedback > Early signs of recovery, cannibalization of equipment exhausting inventory levels > Supporting next generation gearbox designs > TTM Revenue > 1% > Sector Outlook > Neutral/Negative > Customer Feedback > Infrastructure bill would be meaningful Wind Sector Industrial/Other Sector Power Generation Sector Mining Sector Oil & Gas Sector Construction Sector
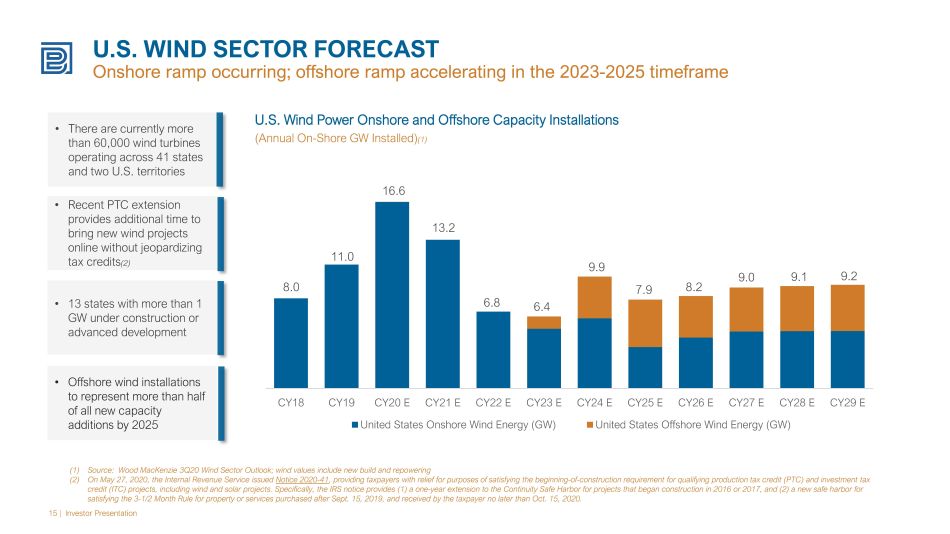
U.S. WIND SECTOR FORECAST Onshore ramp occurring; offshore ramp accelerating in the 2023 - 2025 timeframe 15 | Investor Presentation U.S. Wind Power Onshore and Offshore Capacity Installations (Annual On - Shore GW Installed) (1) (1) Source: Wood MacKenzie 3Q20 Wind Sector Outlook; wind values include new build and repowering (2) On May 27, 2020, the Internal Revenue Service issued Notice 2020 - 41 , providing taxpayers with relief for purposes of satisfying the beginning - of - construction requirement for qualifying production tax credit (PTC) and investment tax credit (ITC) projects, including wind and solar projects. Specifically, the IRS notice provides (1) a one - year extension to the Continuity Safe Harbor for projects that began construction in 2016 or 2017, and (2) a new safe harbor for satisfying the 3 - 1/2 Month Rule for property or services purchased after Sept. 15, 2019, and received by the taxpayer no later t han Oct. 15, 2020. • There are currently more than 60,000 wind turbines operating across 41 states and two U.S. territories • Recent PTC extension provides additional time to bring new wind projects online without jeopardizing tax credits (2) • 13 states with more than 1 GW under construction or advanced development • Offshore wind installations to represent more than half of all new capacity additions by 2025 CY18 CY19 CY20 E CY21 E CY22 E CY23 E CY24 E CY25 E CY26 E CY27 E CY28 E CY29 E United States Onshore Wind Energy (GW) United States Offshore Wind Energy (GW) 8.0 11.0 16.6 13.2 6.8 6.4 9.9 7.9 8.2 9.0 9.1 9.2
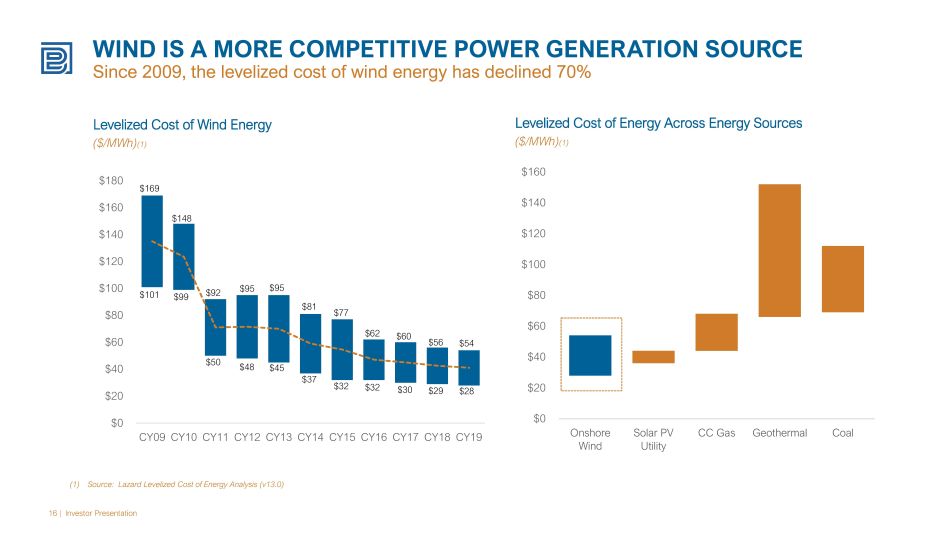
16 | Investor Presentation Levelized Cost of Wind Energy ($/MWh) (1) (1) Source: Lazard Levelized Cost of Energy Analysis (v13.0) Levelized Cost of Energy Across Energy Sources ($/MWh) (1) $0 $20 $40 $60 $80 $100 $120 $140 $160 Onshore Wind Solar PV Utility CC Gas Geothermal Coal $0 $20 $40 $60 $80 $100 $120 $140 $160 $180 CY09 CY10 CY11 CY12 CY13 CY14 CY15 CY16 CY17 CY18 CY19 $101 $169 $148 $99 $92 $50 $95 $48 $95 $45 $81 $37 $77 $32 $32 $62 $30 $60 $29 $56 $28 $54 WIND IS A MORE COMPETITIVE POWER GENERATION SOURCE Since 2009, the levelized cost of wind energy has declined 70%
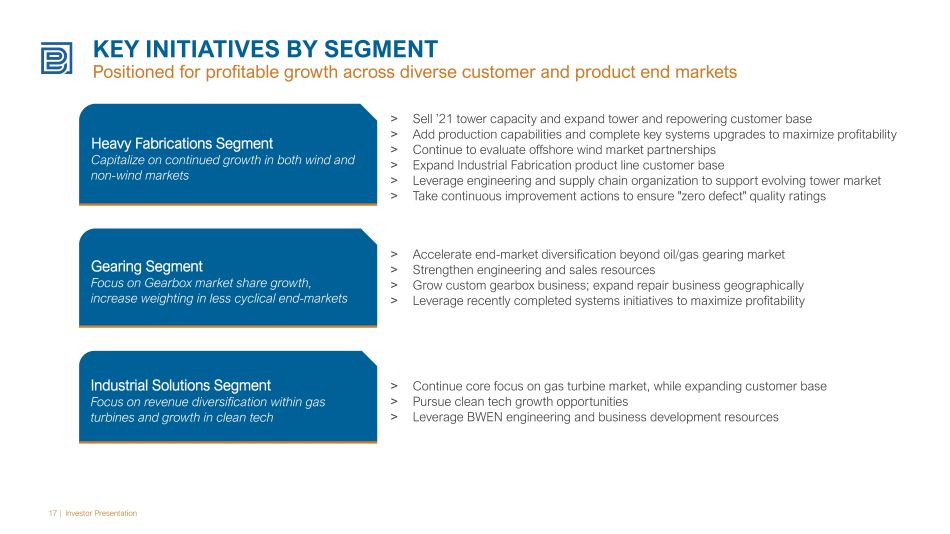
KEY INITIATIVES BY SEGMENT Positioned for profitable growth across diverse customer and product end markets 17 | Investor Presentation > Sell ’21 tower capacity and expand tower and repowering customer base > Add production capabilities and complete key systems upgrades to maximize profitability > Continue to evaluate offshore wind market partnerships > Expand Industrial Fabrication product line customer base > Leverage engineering and supply chain organization to support evolving tower market > Take continuous improvement actions to ensure "zero defect" quality ratings Heavy Fabrications Segment Capitalize on continued growth in both wind and non - wind markets > Accelerate end - market diversification beyond oil/gas gearing market > Strengthen engineering and sales resources > Grow custom gearbox business; expand repair business geographically > Leverage recently completed systems initiatives to maximize profitability Gearing Segment Focus on Gearbox market share growth, increase weighting in less cyclical end - markets > Continue core focus on gas turbine market, while expanding customer base > Pursue clean tech growth opportunities > Leverage BWEN engineering and business development resources Industrial Solutions Segment Focus on revenue diversification within gas turbines and growth in clean tech
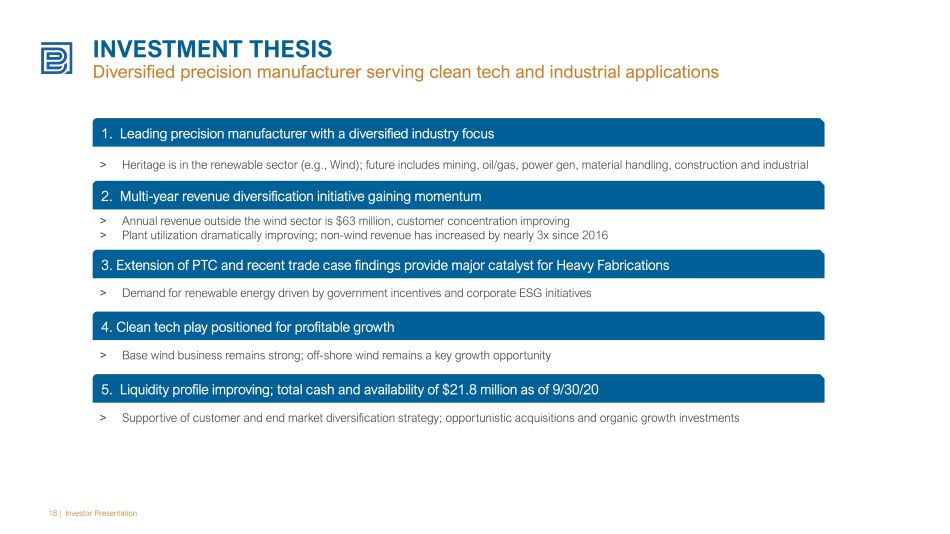
INVESTMENT THESIS Diversified precision manufacturer serving clean tech and industrial applications 18 | Investor Presentation 1. Leading precision manufacturer with a diversified industry focus > Heritage is in the renewable sector (e.g., Wind); future includes mining, oil/gas, power gen, material handling, construction an d industrial 2. Multi - year revenue diversification initiative gaining momentum > Annual revenue outside the wind sector is $ 63 million, customer concentration improving > Plant utilization dramatically improving; non - wind revenue has increased by nearly 3x since 2016 5. Liquidity profile improving; total cash and availability of $21.8 million as of 9/30/20 3. Extension of PTC and recent trade case findings provide major catalyst for Heavy Fabrications > Demand for renewable energy driven by government incentives and corporate ESG initiatives 4. Clean tech play positioned for profitable growth > Base wind business remains strong; off - shore wind remains a key growth opportunity > Supportive of customer and end market diversification strategy; opportunistic acquisitions and organic growth investments

APPENDIX
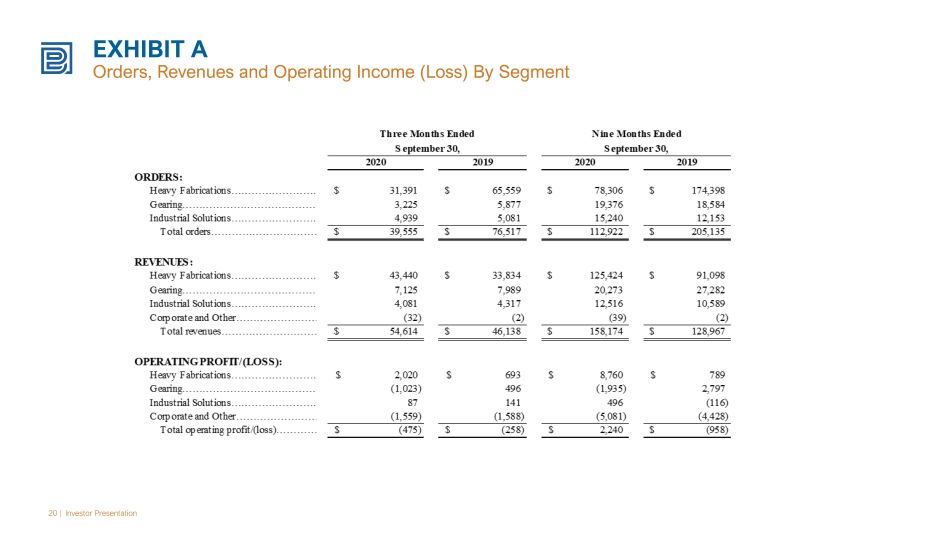
EXHIBIT A Orders, Revenues and Operating Income (Loss) By Segment 20 | Investor Presentation
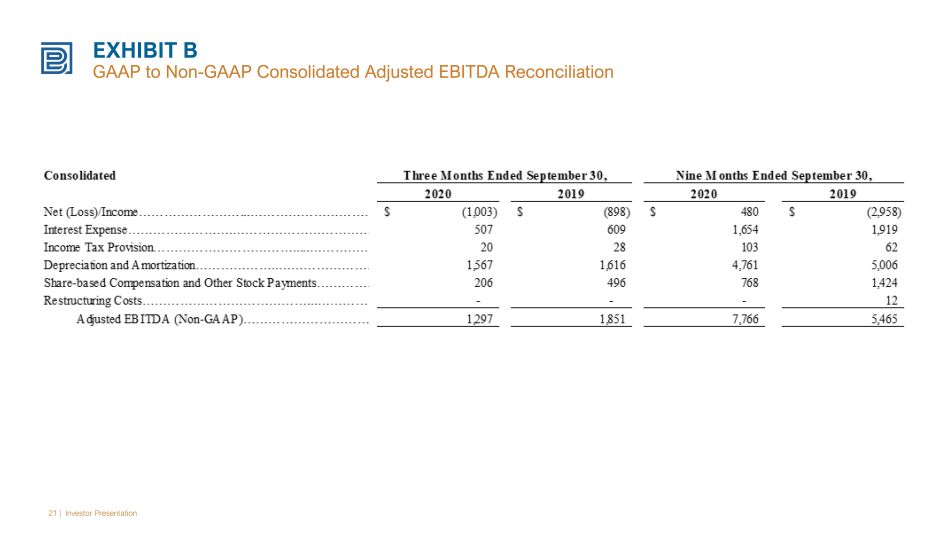
EXHIBIT B GAAP to Non - GAAP Consolidated Adjusted EBITDA Reconciliation 21 | Investor Presentation
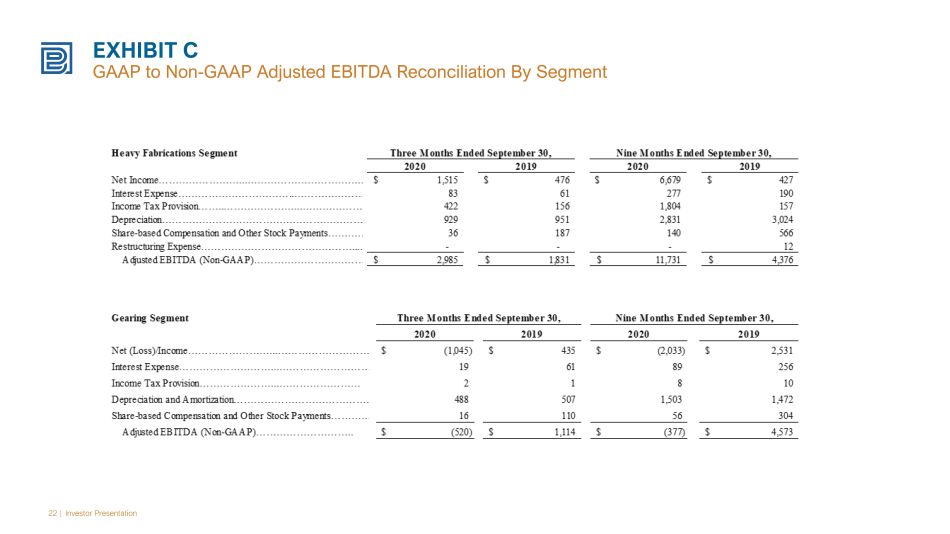
EXHIBIT C GAAP to Non - GAAP Adjusted EBITDA Reconciliation By Segment 22 | Investor Presentation
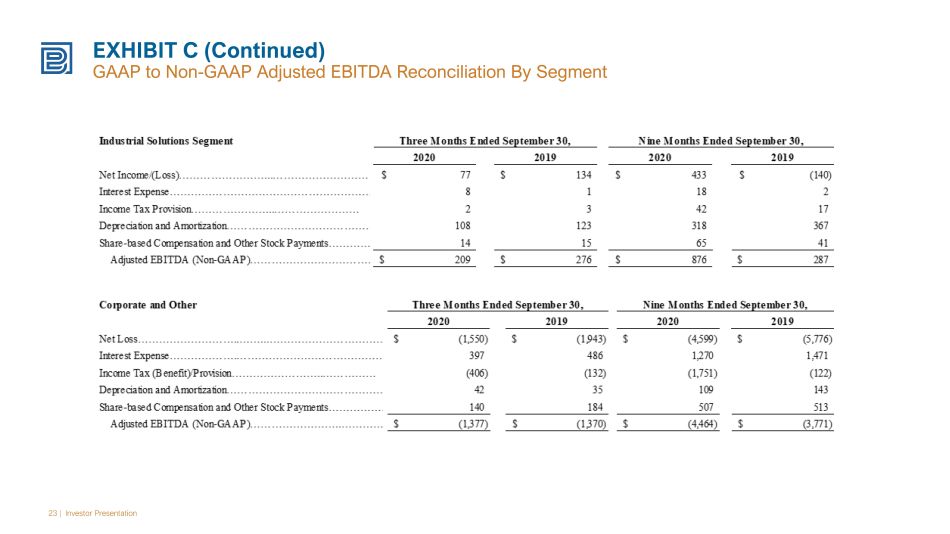
EXHIBIT C (Continued) GAAP to Non - GAAP Adjusted EBITDA Reconciliation By Segment 23 | Investor Presentation

Please contact our investor relations team at [email protected] IR CONTACT