Bankwell Financial Group 3Q20 Investor Presentation
Safe Harbor This presentation may contain certain forward-looking statements about Bankwell Financial Group, Inc. (the “Company”). Forward-looking statements include statements regarding anticipated future events and can be identified by the fact that they do not relate strictly to historical or current facts. They often include words such as “believe,” “expect,” “would,” “should,” “could,” or “may.” Forward-looking statements, by their nature, are subject to risks and uncertainties. Certain factors that could cause actual results to differ materially from expected results include increased competitive pressures, changes in the interest rate environment, general economic conditions or conditions within the securities markets, and legislative and regulatory changes that could adversely affect the business in which the Company and its subsidiaries are engaged. The COVID-19 pandemic is adversely affecting Bankwell Financial Group, its customers, counterparties, employees, and third party service providers, and the ultimate extent of the impacts on its business, financial position, results of operations, liquidity, and prospects is unknown. 2
Table of Contents • 3Q20 Performance • COVID-19 Deferrals & PPP Update • Credit • Impact of COVID-19 on 3Q20 Performance • Capital • Bankwell History & Overview 3
3Q20 Performance
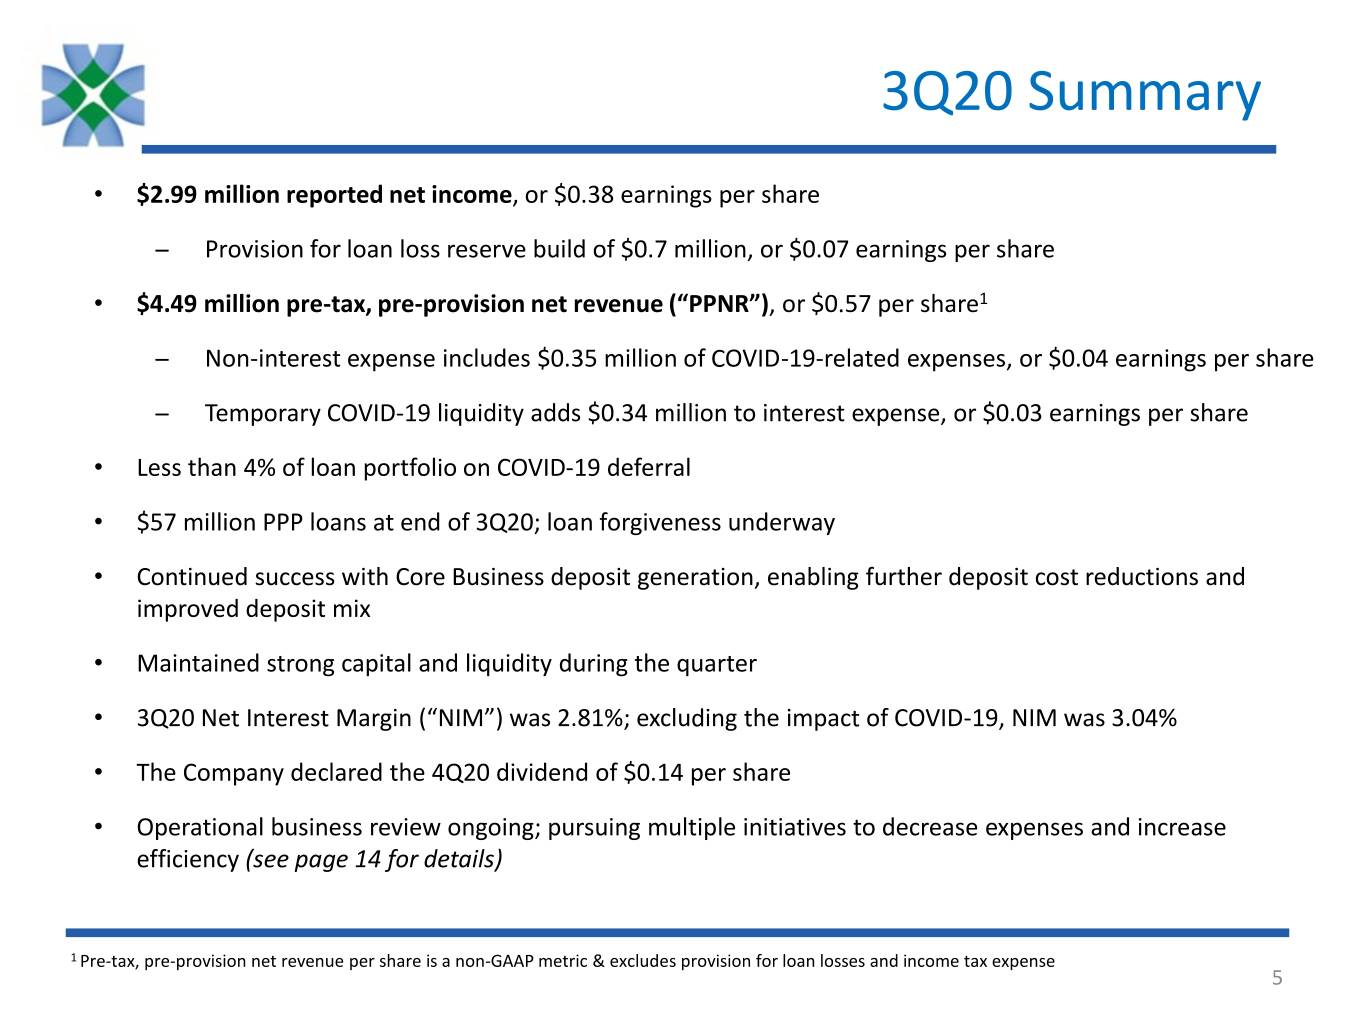
3Q20 Summary • $2.99 million reported net income, or $0.38 earnings per share ̶ Provision for loan loss reserve build of $0.7 million, or $0.07 earnings per share • $4.49 million pre-tax, pre-provision net revenue (“PPNR”), or $0.57 per share1 ̶ Non-interest expense includes $0.35 million of COVID-19-related expenses, or $0.04 earnings per share ̶ Temporary COVID-19 liquidity adds $0.34 million to interest expense, or $0.03 earnings per share • Less than 4% of loan portfolio on COVID-19 deferral • $57 million PPP loans at end of 3Q20; loan forgiveness underway • Continued success with Core Business deposit generation, enabling further deposit cost reductions and improved deposit mix • Maintained strong capital and liquidity during the quarter • 3Q20 Net Interest Margin (“NIM”) was 2.81%; excluding the impact of COVID-19, NIM was 3.04% • The Company declared the 4Q20 dividend of $0.14 per share • Operational business review ongoing; pursuing multiple initiatives to decrease expenses and increase efficiency (see page 14 for details) 1 Pre-tax, pre-provision net revenue per share is a non-GAAP metric & excludes provision for loan losses and income tax expense 5
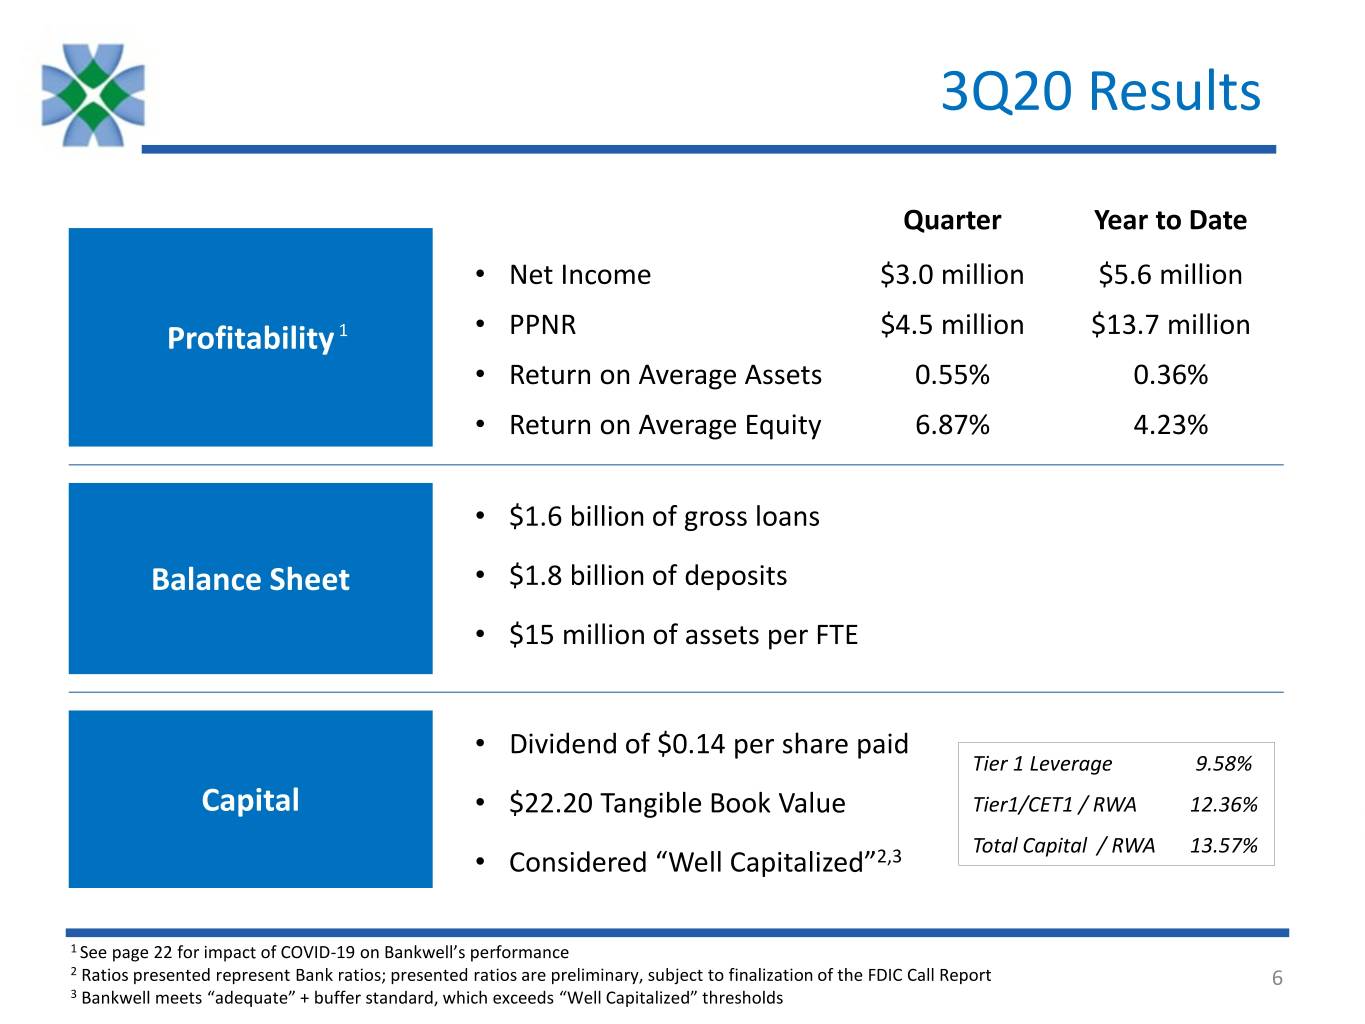
3Q20 Results Quarter Year to Date • Net Income $3.0 million $5.6 million Profitability 1 • PPNR $4.5 million $13.7 million • Return on Average Assets 0.55% 0.36% • Return on Average Equity 6.87% 4.23% • $1.6 billion of gross loans Balance Sheet • $1.8 billion of deposits • $15 million of assets per FTE • Dividend of $0.14 per share paid Tier 1 Leverage 9.58% Capital • $22.20 Tangible Book Value Tier1/CET1 / RWA 12.36% Total Capital / RWA 13.57% • Considered “Well Capitalized”2,3 1 See page 22 for impact of COVID-19 on Bankwell’s performance 2 Ratios presented represent Bank ratios; presented ratios are preliminary, subject to finalization of the FDIC Call Report 6 3 Bankwell meets “adequate” + buffer standard, which exceeds “Well Capitalized” thresholds
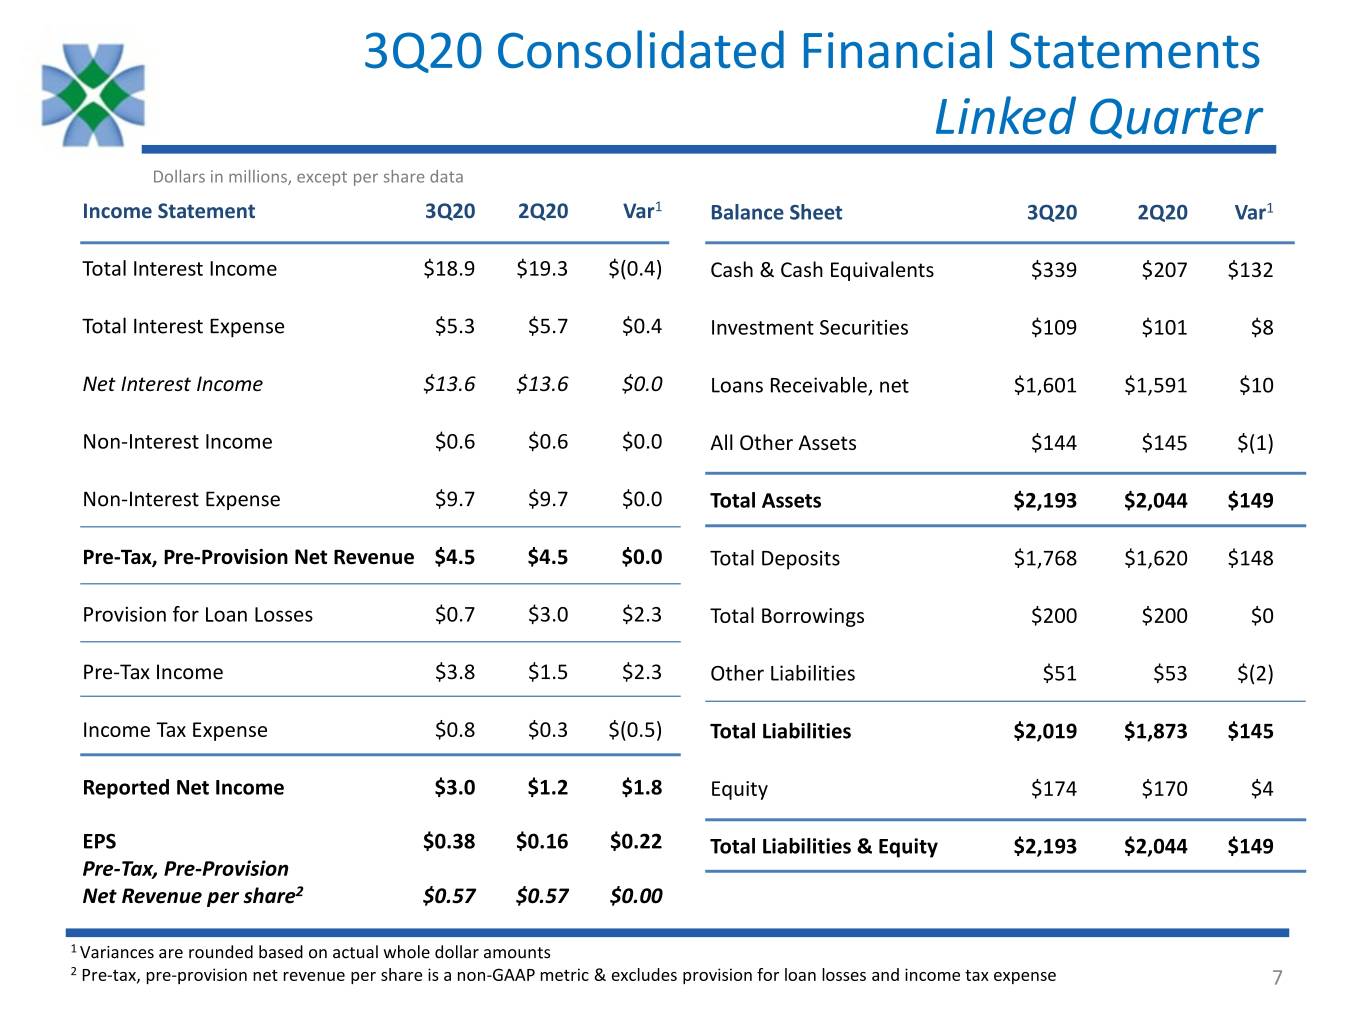
3Q20 Consolidated Financial Statements Linked Quarter Dollars in millions, except per share data Income Statement 3Q20 2Q20 Var1 Balance Sheet 3Q20 2Q20 Var1 Total Interest Income $18.9 $19.3 $(0.4) Cash & Cash Equivalents $339 $207 $132 Total Interest Expense $5.3 $5.7 $0.4 Investment Securities $109 $101 $8 Net Interest Income $13.6 $13.6 $0.0 Loans Receivable, net $1,601 $1,591 $10 Non-Interest Income $0.6 $0.6 $0.0 All Other Assets $144 $145 $(1) Non-Interest Expense $9.7 $9.7 $0.0 Total Assets $2,193 $2,044 $149 Pre-Tax, Pre-Provision Net Revenue $4.5 $4.5 $0.0 Total Deposits $1,768 $1,620 $148 Provision for Loan Losses $0.7 $3.0 $2.3 Total Borrowings $200 $200 $0 Pre-Tax Income $3.8 $1.5 $2.3 Other Liabilities $51 $53 $(2) Income Tax Expense $0.8 $0.3 $(0.5) Total Liabilities $2,019 $1,873 $145 Reported Net Income $3.0 $1.2 $1.8 Equity $174 $170 $4 EPS $0.38 $0.16 $0.22 Total Liabilities & Equity $2,193 $2,044 $149 Pre-Tax, Pre-Provision Net Revenue per share2 $0.57 $0.57 $0.00 1 Variances are rounded based on actual whole dollar amounts 2 Pre-tax, pre-provision net revenue per share is a non-GAAP metric & excludes provision for loan losses and income tax expense 7
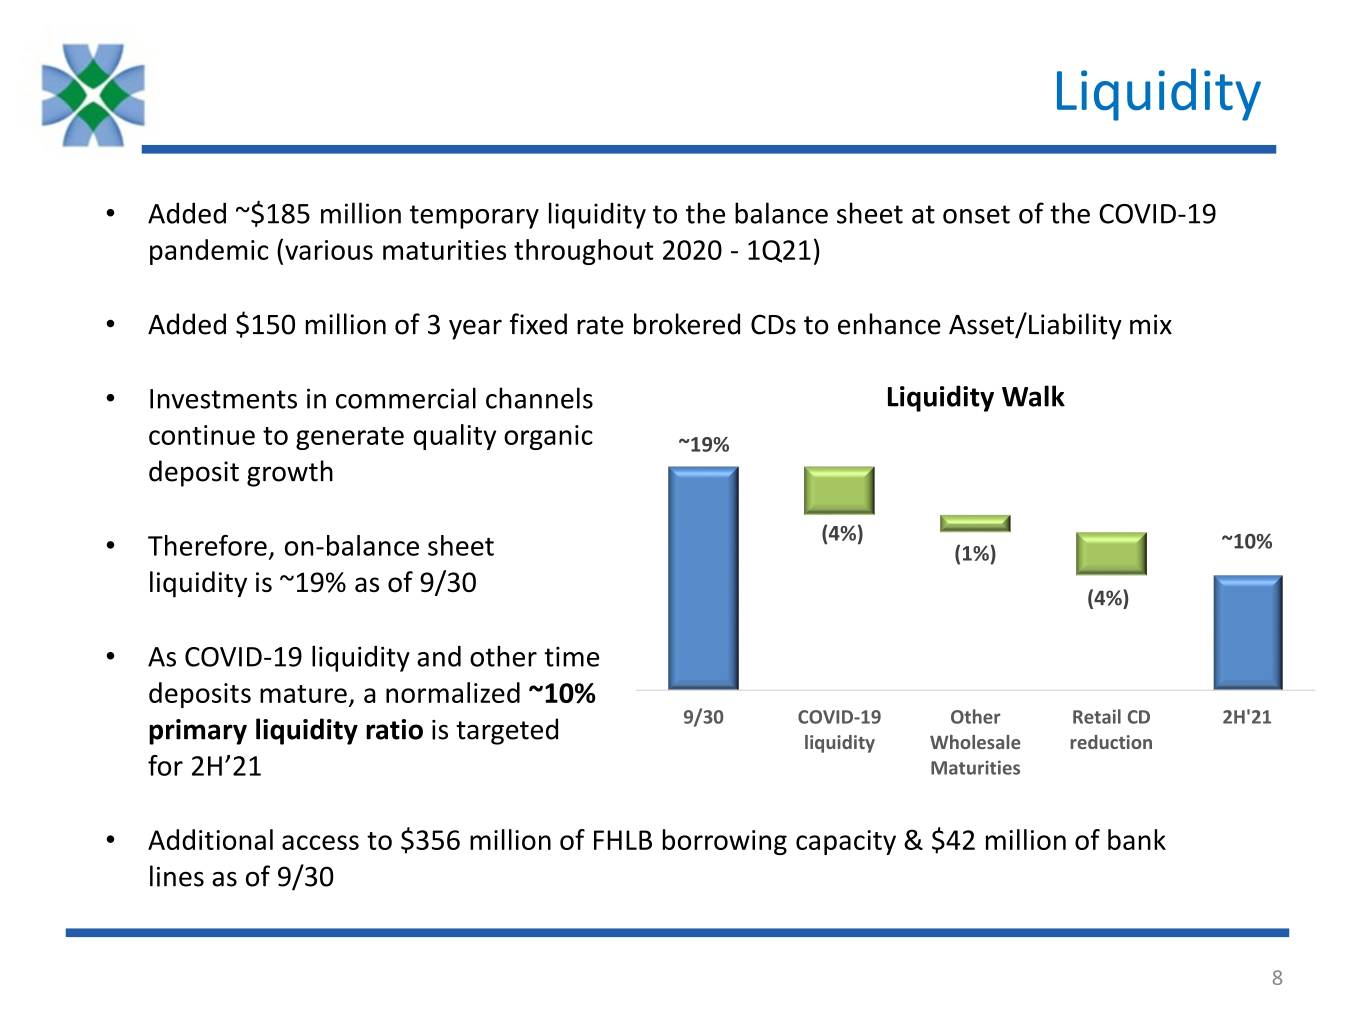
Liquidity • Added ~$185 million temporary liquidity to the balance sheet at onset of the COVID-19 pandemic (various maturities throughout 2020 - 1Q21) • Added $150 million of 3 year fixed rate brokered CDs to enhance Asset/Liability mix • Investments in commercial channels Liquidity Walk continue to generate quality organic ~19% deposit growth (4%) ~10% • Therefore, on-balance sheet (1%) liquidity is ~19% as of 9/30 (4%) • As COVID-19 liquidity and other time deposits mature, a normalized ~10% 9/30 COVID-19 Other Retail CD 2H'21 primary liquidity ratio is targeted liquidity Wholesale reduction for 2H’21 Maturities • Additional access to $356 million of FHLB borrowing capacity & $42 million of bank lines as of 9/30 8
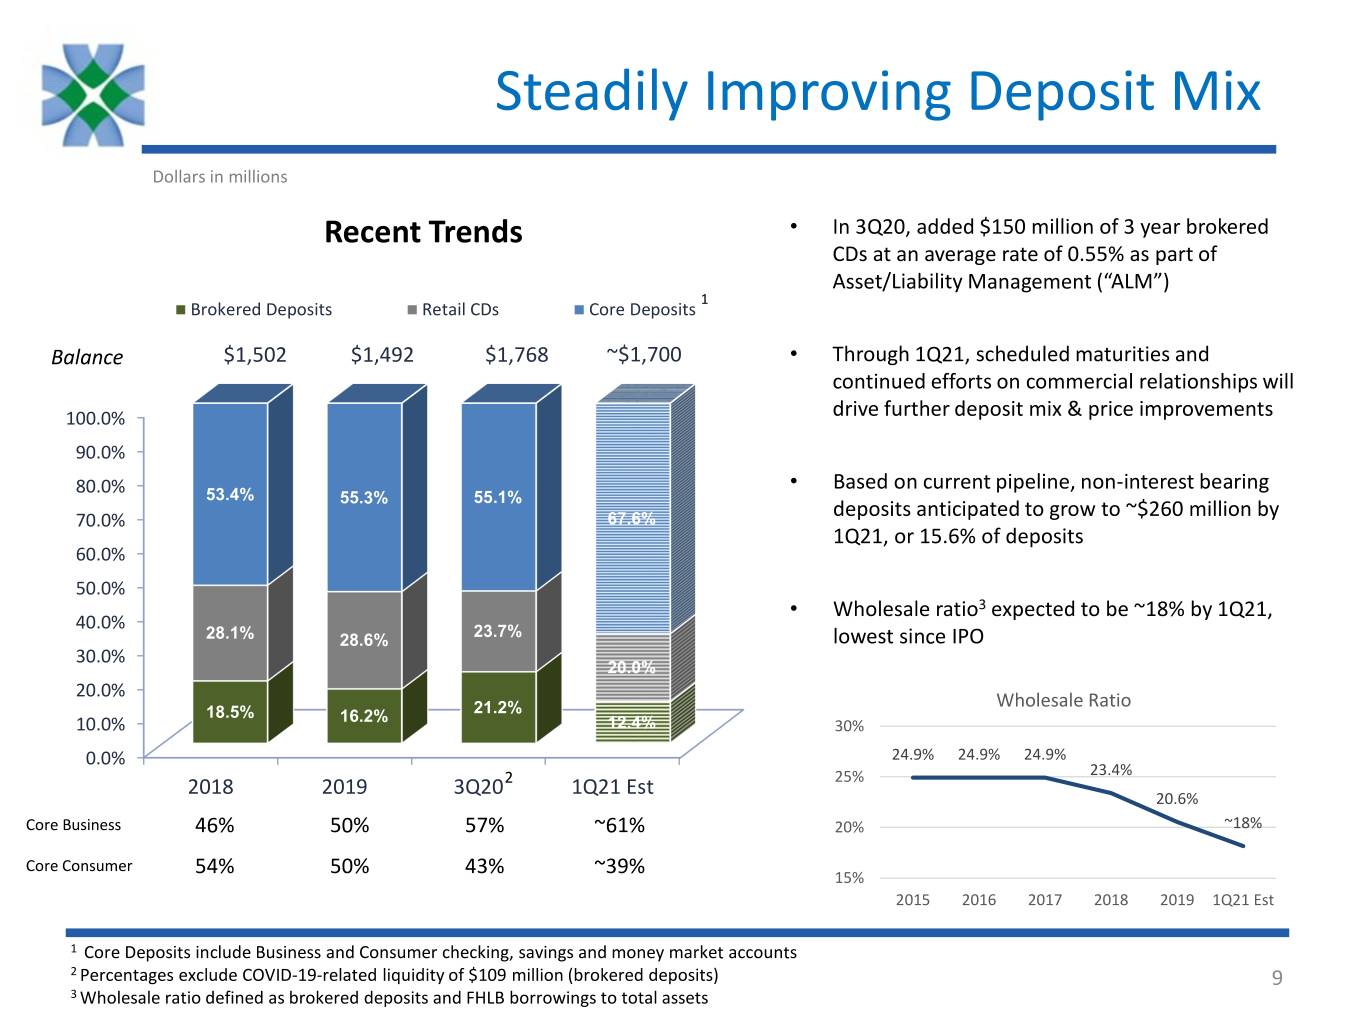
Steadily Improving Deposit Mix Dollars in millions Recent Trends • In 3Q20, added $150 million of 3 year brokered CDs at an average rate of 0.55% as part of Asset/Liability Management (“ALM”) 1 Brokered Deposits Retail CDs Core Deposits Balance $1,502 $1,492 $1,768 ~$1,700 • Through 1Q21, scheduled maturities and continued efforts on commercial relationships will 100.0% drive further deposit mix & price improvements 90.0% • Based on current pipeline, non-interest bearing 80.0% 53.4% 55.3% 55.1% deposits anticipated to grow to ~$260 million by 70.0% 67.6% 1Q21, or 15.6% of deposits 60.0% 50.0% • Wholesale ratio3 expected to be ~18% by 1Q21, 40.0% 23.7% 28.1% 28.6% lowest since IPO 30.0% 20.0% 20.0% Wholesale Ratio 18.5% 21.2% 10.0% 16.2% 12.4% 30% 0.0% 24.9% 24.9% 24.9% 2 25% 23.4% 2018 2019 3Q20 1Q21 Est 20.6% Core Business 46% 50% 57% ~61% 20% ~18% Core Consumer 54% 50% 43% ~39% 15% 2015 2016 2017 2018 2019 1Q21 Est 1 Core Deposits include Business and Consumer checking, savings and money market accounts 2 Percentages exclude COVID-19-related liquidity of $109 million (brokered deposits) 9 3 Wholesale ratio defined as brokered deposits and FHLB borrowings to total assets
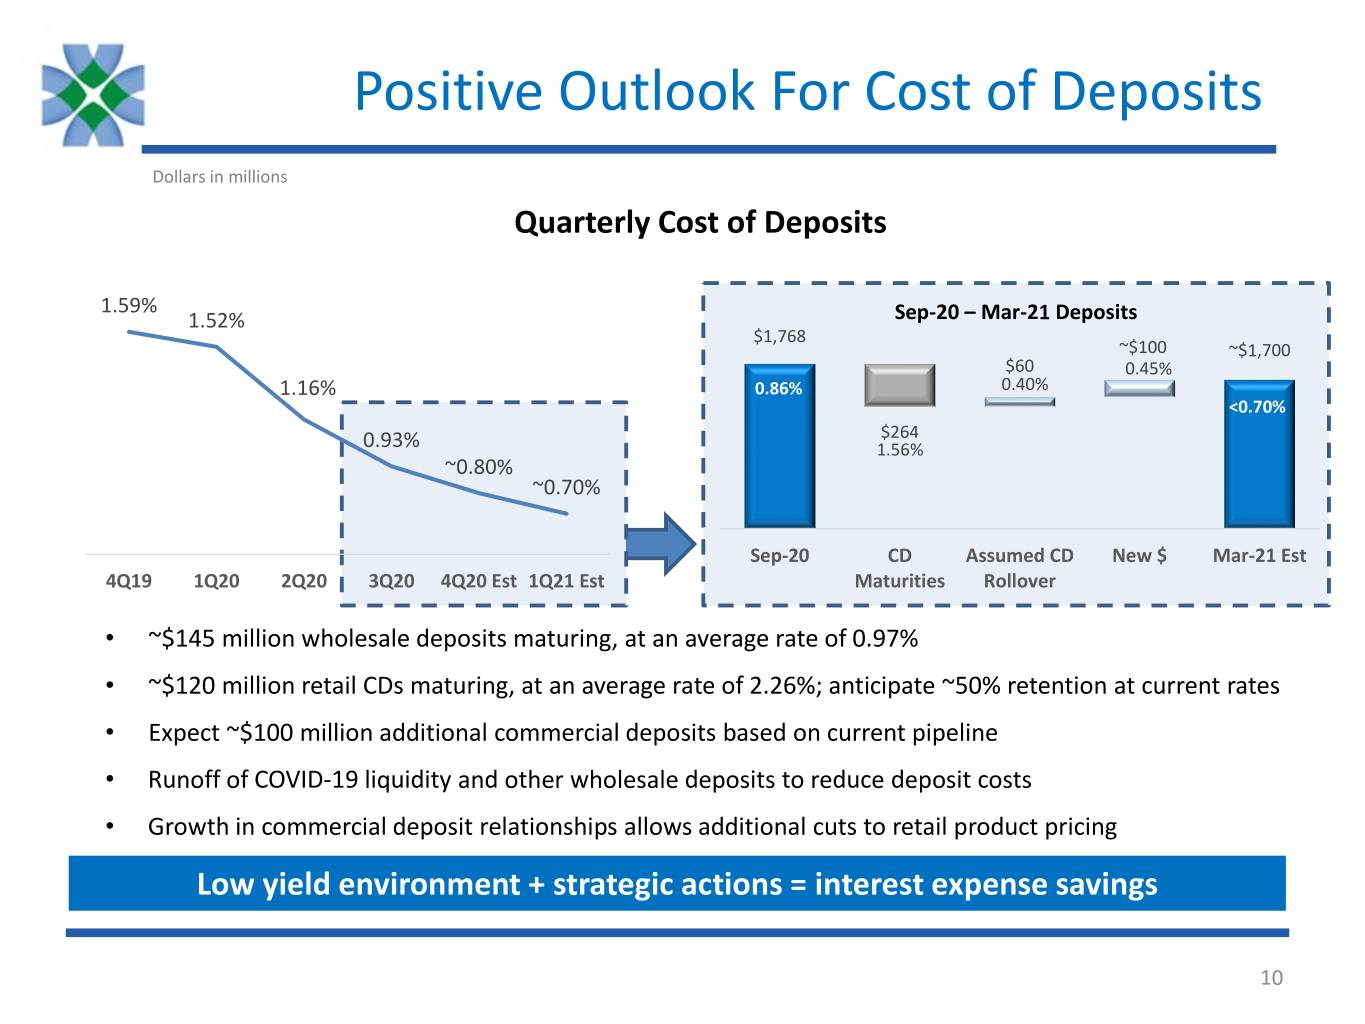
Positive Outlook For Cost of Deposits Dollars in millions Quarterly Cost of Deposits 1.59% 1.52% Sep-20 – Mar-21 Deposits $1,768 ~$100 ~$1,700 $60 0.45% 0.40% 1.16% <0.70%0.86% <0.70% $264 0.93% 1.56% ~0.80% ~0.70% Sep-20 CD Assumed CD New $ Mar-21 Est 4Q19 1Q20 2Q20 3Q20 4Q20 Est 1Q21 Est Maturities Rollover • ~$145 million wholesale deposits maturing, at an average rate of 0.97% • ~$120 million retail CDs maturing, at an average rate of 2.26%; anticipate ~50% retention at current rates • Expect ~$100 million additional commercial deposits based on current pipeline • Runoff of COVID-19 liquidity and other wholesale deposits to reduce deposit costs • Growth in commercial deposit relationships allows additional cuts to retail product pricing Low yield environment + strategic actions = interest expense savings 10
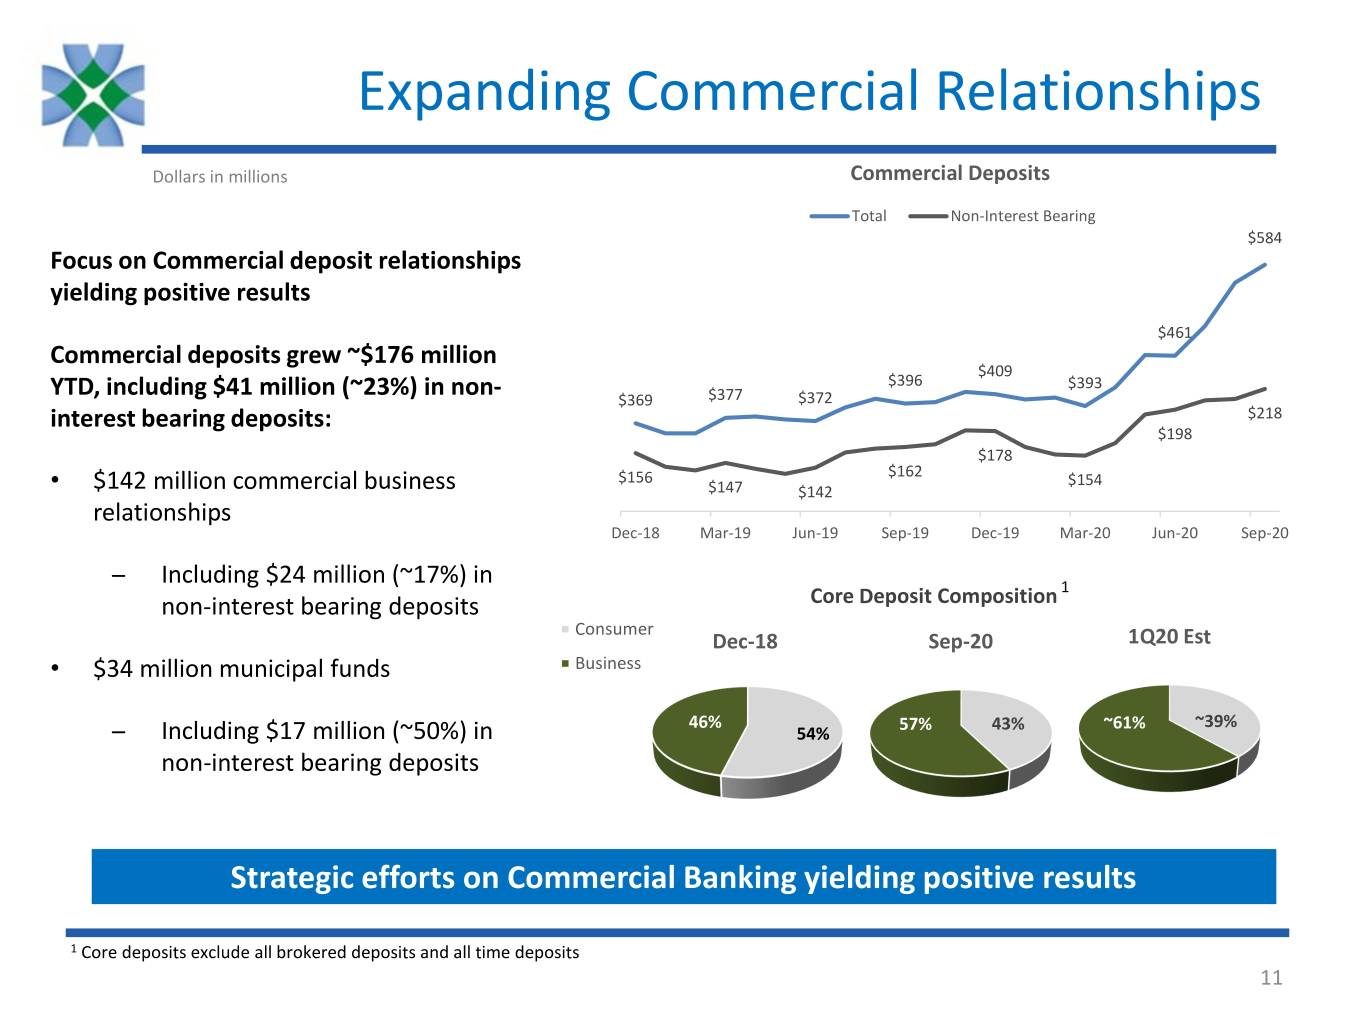
Expanding Commercial Relationships Dollars in millions Commercial Deposits Total Non-Interest Bearing $584 Focus on Commercial deposit relationships $600 $350 $550 yielding positive results $300 $500 $461 Commercial deposits grew ~$176 million $250 $450 $409 $396 $393 YTD, including $41 million (~23%) in non- $400 $369 $377 $372 interest bearing deposits: $218 $200 $350 $198 $178 $150 $162 $300 $156 $154 • $142 million commercial business $147 $142 relationships $250 $100 Dec-18 Mar-19 Jun-19 Sep-19 Dec-19 Mar-20 Jun-20 Sep-20 ̶ Including $24 million (~17%) in 1 non-interest bearing deposits Core Deposit Composition Consumer Dec-18 Sep-20 1Q20 Est • $34 million municipal funds Business 46% 57% 43% ~61% ~39% ̶ Including $17 million (~50%) in 54% non-interest bearing deposits Strategic efforts on Commercial Banking yielding positive results 1 Core deposits exclude all brokered deposits and all time deposits 11
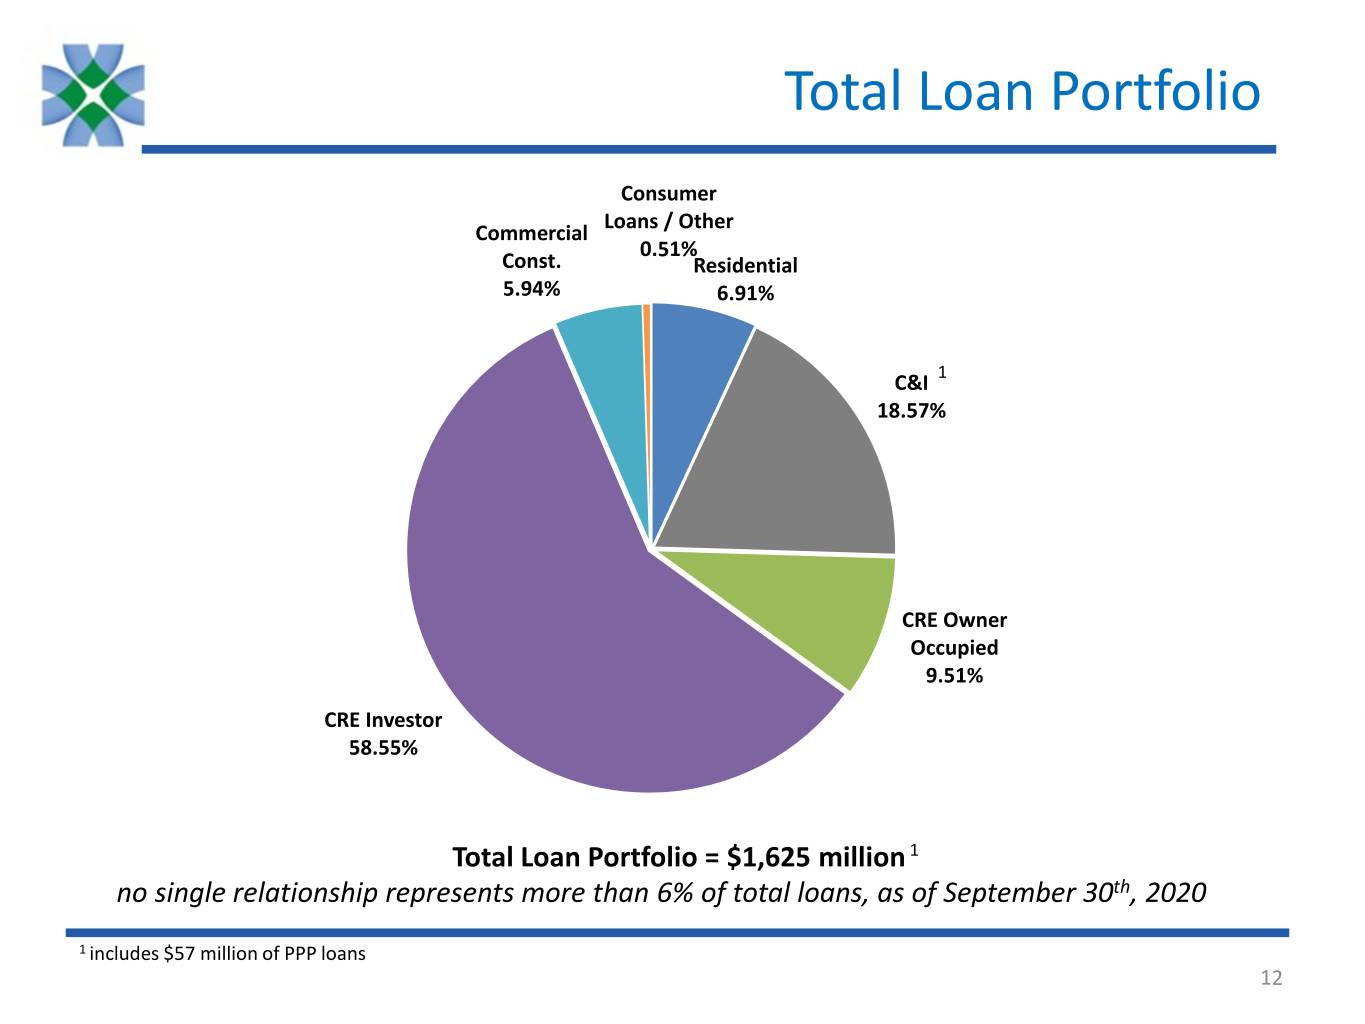
Total Loan Portfolio Consumer Loans / Other Commercial 0.51% Const. Residential 5.94% 6.91% 1 C&I 18.57% CRE Owner Occupied 9.51% CRE Investor 58.55% Total Loan Portfolio = $1,625 million 1 no single relationship represents more than 6% of total loans, as of September 30th, 2020 1 includes $57 million of PPP loans 12
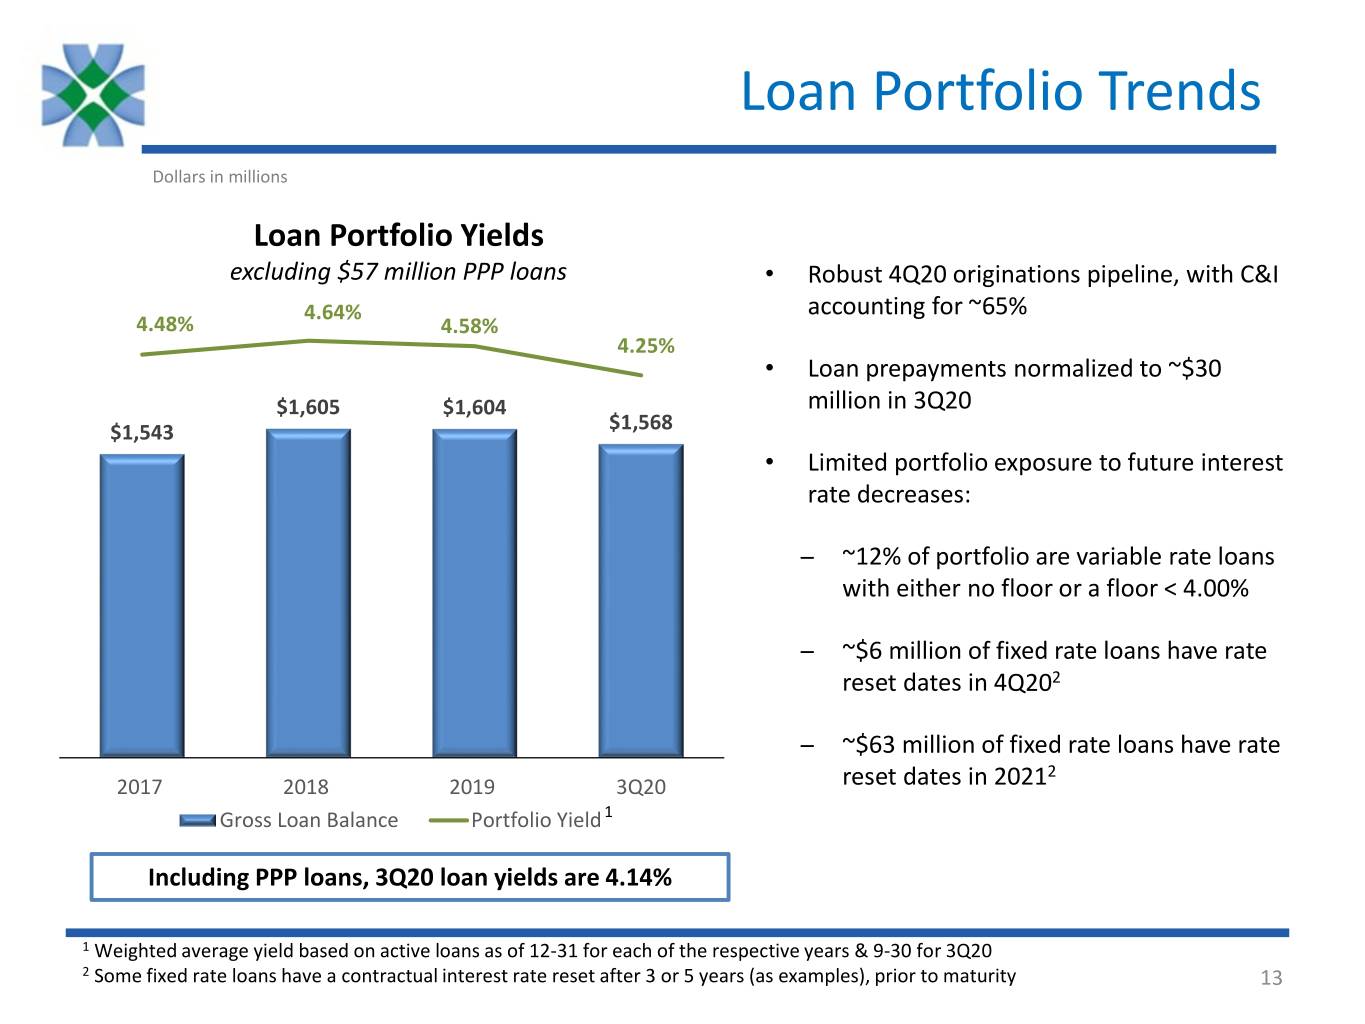
Loan Portfolio Trends Dollars in millions Loan Portfolio Yields excluding $57 million PPP loans • Robust 4Q20 originations pipeline, with C&I 4.64% 5.00% accounting for ~65% 4.48% 4.58% 1,800 4.25% • Loan prepayments normalized to ~$30 $1,605 $1,604 4.00% million in 3Q20 1,600 $1,543 $1,568 • Limited portfolio exposure to future interest 3.00% rate decreases: 1,400 ̶ ~12% of portfolio are variable rate loans 2.00% 1,200 with either no floor or a floor < 4.00% ̶ ~$6 million of fixed rate loans have rate 1.00% 1,000 reset dates in 4Q202 $800 0.00% ̶ ~$63 million of fixed rate loans have rate 2 2017 2018 2019 3Q20 reset dates in 2021 Gross Loan Balance Portfolio Yield 1 Including PPP loans, 3Q20 loan yields are 4.14% 1 Weighted average yield based on active loans as of 12-31 for each of the respective years & 9-30 for 3Q20 2 Some fixed rate loans have a contractual interest rate reset after 3 or 5 years (as examples), prior to maturity 13
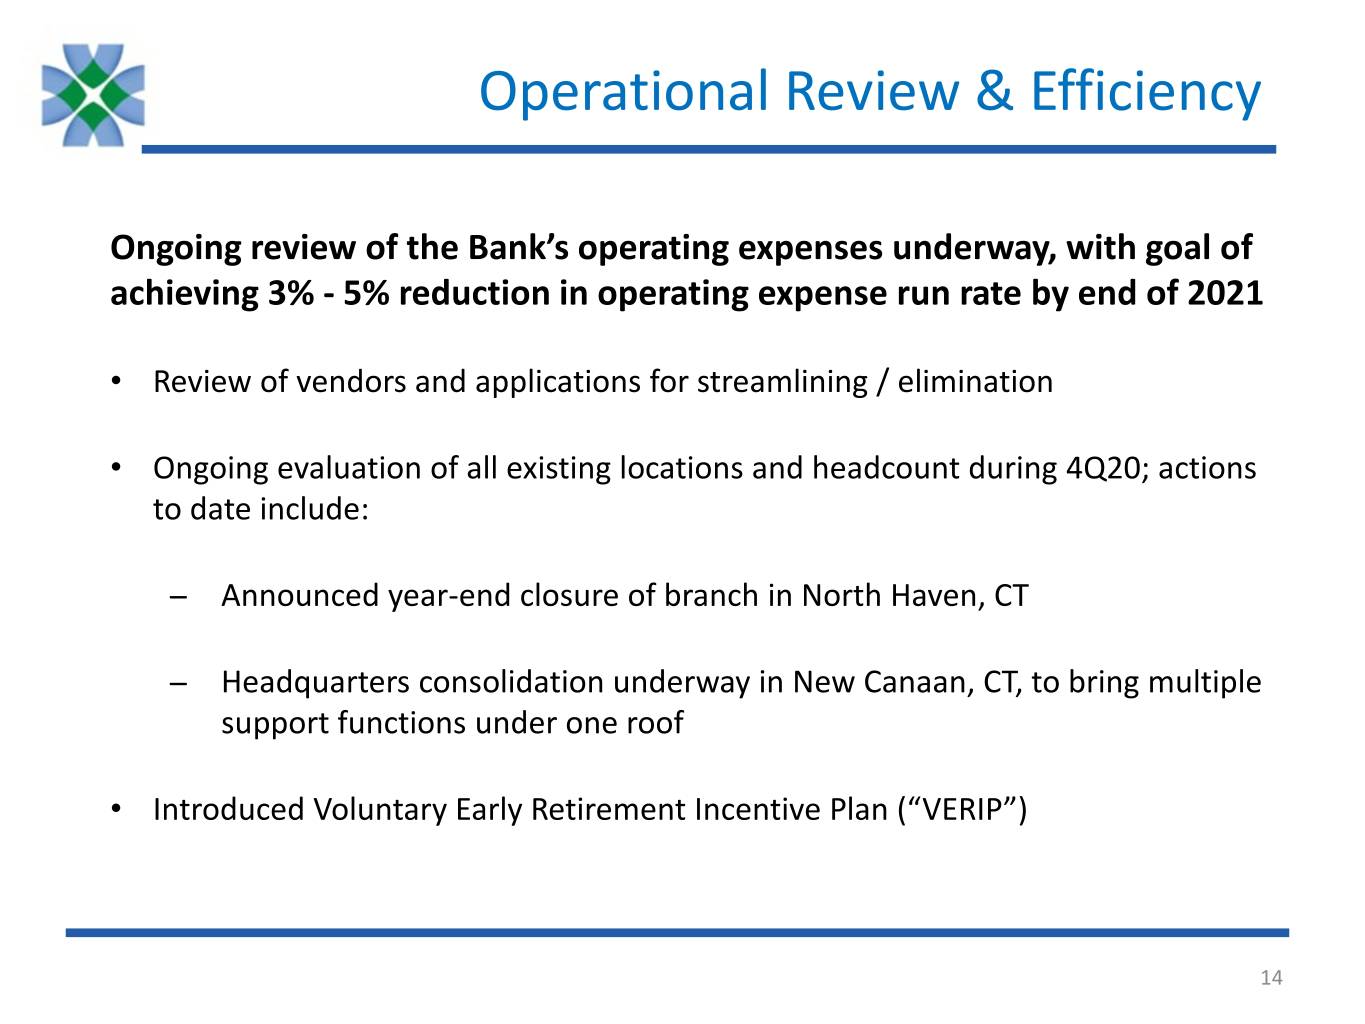
Operational Review & Efficiency Ongoing review of the Bank’s operating expenses underway, with goal of achieving 3% - 5% reduction in operating expense run rate by end of 2021 • Review of vendors and applications for streamlining / elimination • Ongoing evaluation of all existing locations and headcount during 4Q20; actions to date include: ̶ Announced year-end closure of branch in North Haven, CT ̶ Headquarters consolidation underway in New Canaan, CT, to bring multiple support functions under one roof • Introduced Voluntary Early Retirement Incentive Plan (“VERIP”) 14

COVID-19 Deferrals & PPP Update
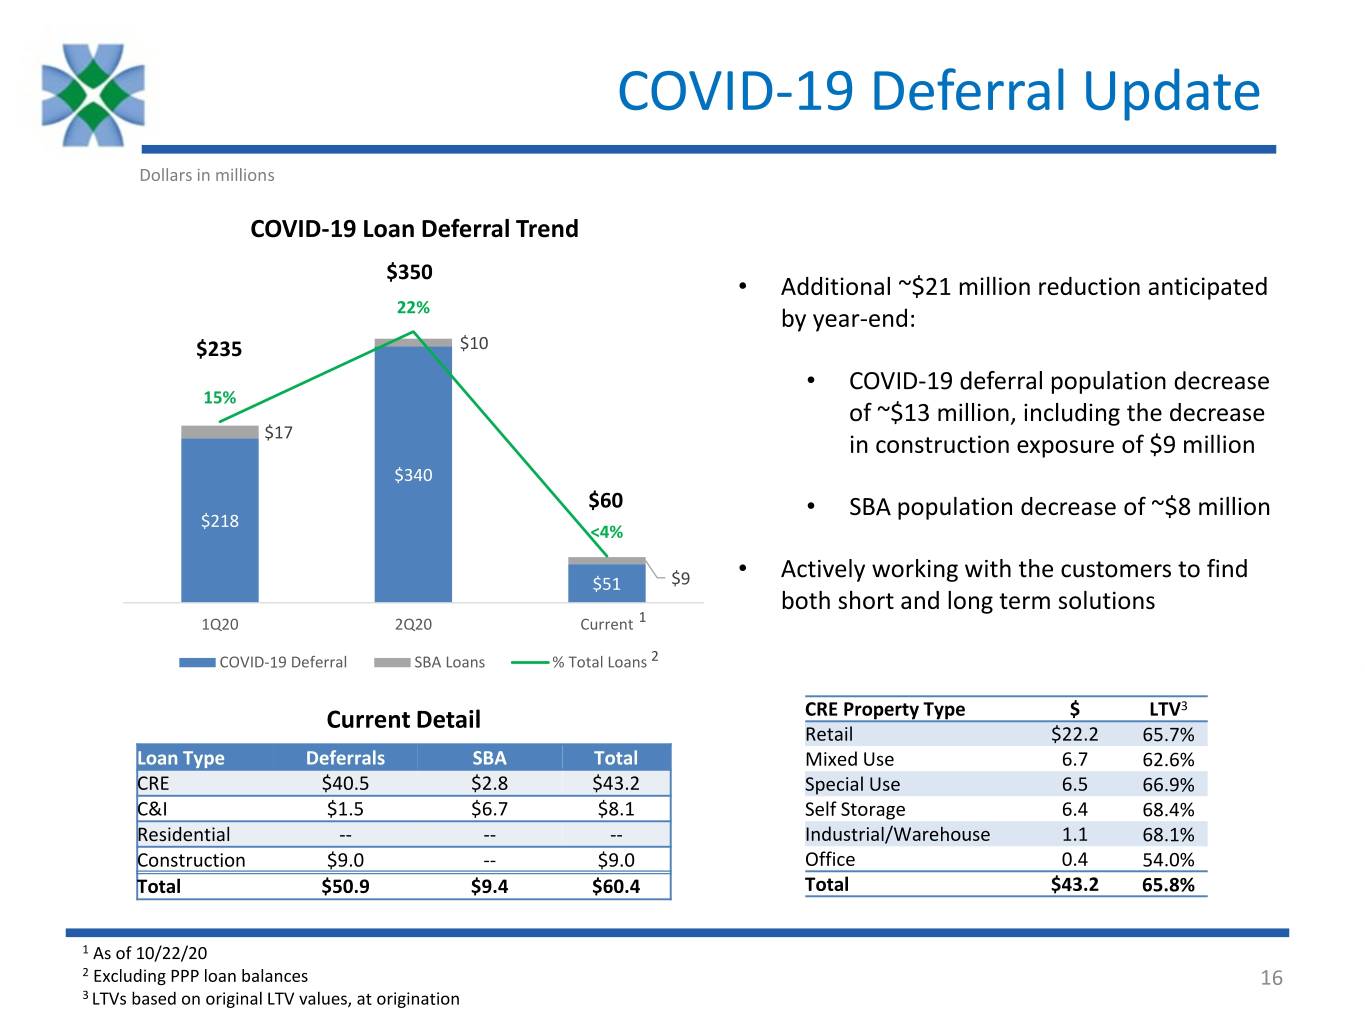
COVID-19 Deferral Update Dollars in millions COVID-19 Loan Deferral Trend $350 $400 25%• Additional ~$21 million reduction anticipated 22% by year-end: $350 $10 $235 20% $300 • COVID-19 deferral population decrease 15% $250 15% of ~$13 million, including the decrease $17 $200 in construction exposure of $9 million $340 10% $150 $60 • SBA population decrease of ~$8 million $100 $218 <4% 5% $50 • Actively working with the customers to find $51 $9 $0 0% both short and long term solutions 1Q20 2Q20 Current 1 COVID-19 Deferral SBA Loans % Total Loans 2 3 Current Detail CRE Property Type $ LTV Retail $22.2 65.7% Loan Type Deferrals SBA Total Mixed Use 6.7 62.6% CRE $40.5 $2.8 $43.2 Special Use 6.5 66.9% C&I $1.5 $6.7 $8.1 Self Storage 6.4 68.4% Residential -- -- -- Industrial/Warehouse 1.1 68.1% Construction $9.0 -- $9.0 Office 0.4 54.0% Total $50.9 $9.4 $60.4 Total $43.2 65.8% 1 As of 10/22/20 2 Excluding PPP loan balances 16 3 LTVs based on original LTV values, at origination
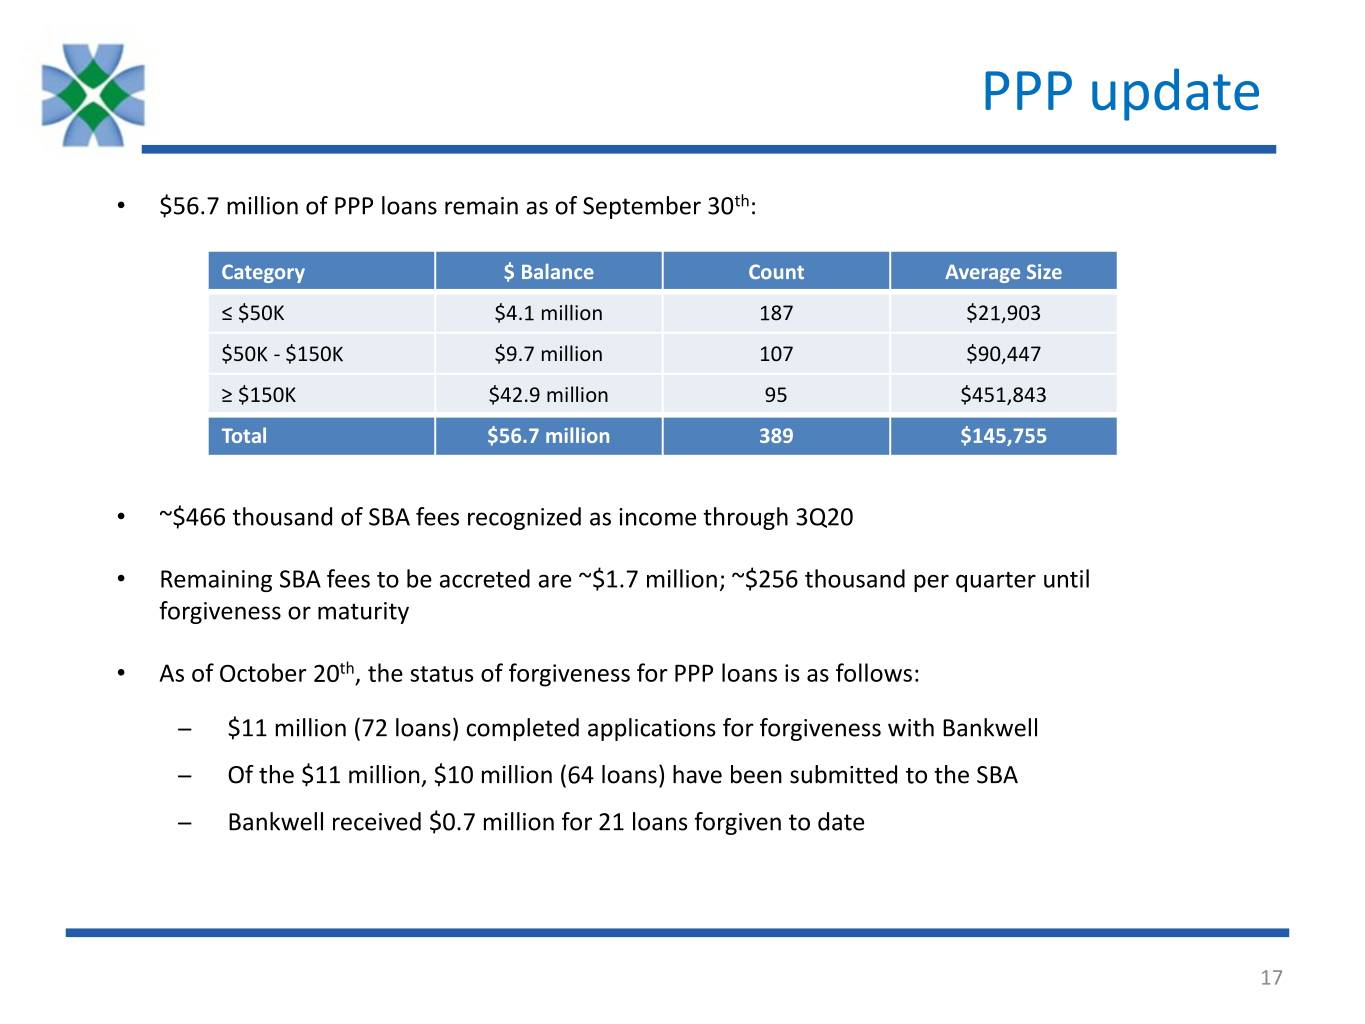
PPP update • $56.7 million of PPP loans remain as of September 30th: Category $ Balance Count Average Size ≤ $50K $4.1 million 187 $21,903 $50K - $150K $9.7 million 107 $90,447 ≥ $150K $42.9 million 95 $451,843 Total $56.7 million 389 $145,755 • ~$466 thousand of SBA fees recognized as income through 3Q20 • Remaining SBA fees to be accreted are ~$1.7 million; ~$256 thousand per quarter until forgiveness or maturity • As of October 20th, the status of forgiveness for PPP loans is as follows: ̶ $11 million (72 loans) completed applications for forgiveness with Bankwell ̶ Of the $11 million, $10 million (64 loans) have been submitted to the SBA ̶ Bankwell received $0.7 million for 21 loans forgiven to date 17

Credit
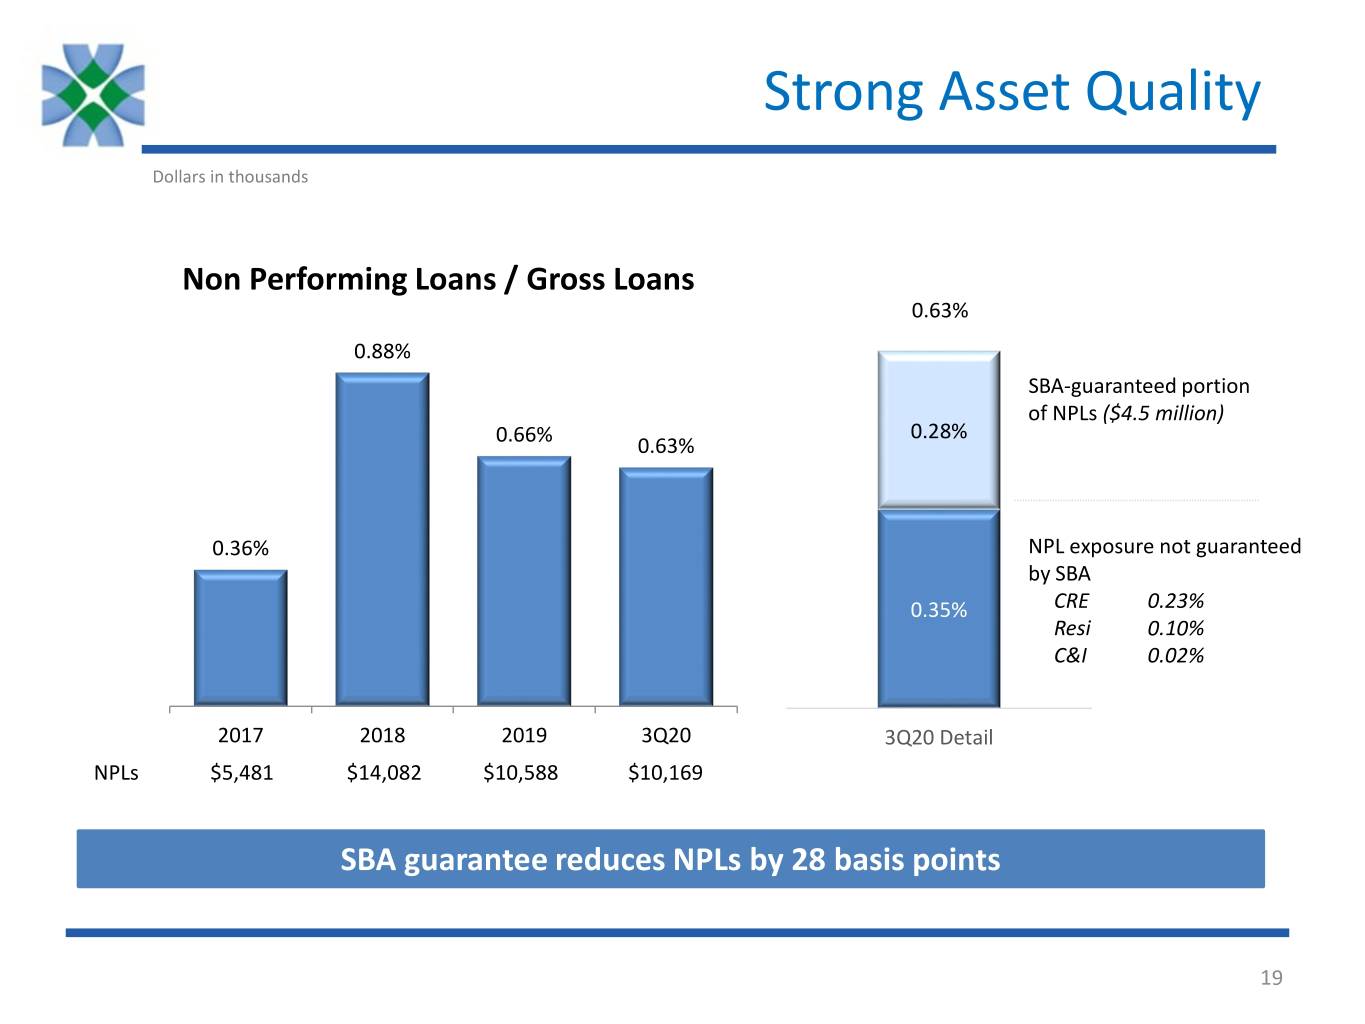
Strong Asset Quality Dollars in thousands Non Performing Loans / Gross Loans 0.63% 0.88% SBA-guaranteed portion of NPLs ($4.5 million) 0.28% 0.66% 0.63% 0.36% NPL exposure not guaranteed by SBA 0.35% CRE 0.23% Resi 0.10% C&I 0.02% 2017 2018 2019 3Q20 3Q20 Detail NPLs $5,481 $14,082 $10,588 $10,169 SBA guarantee reduces NPLs by 28 basis points 19
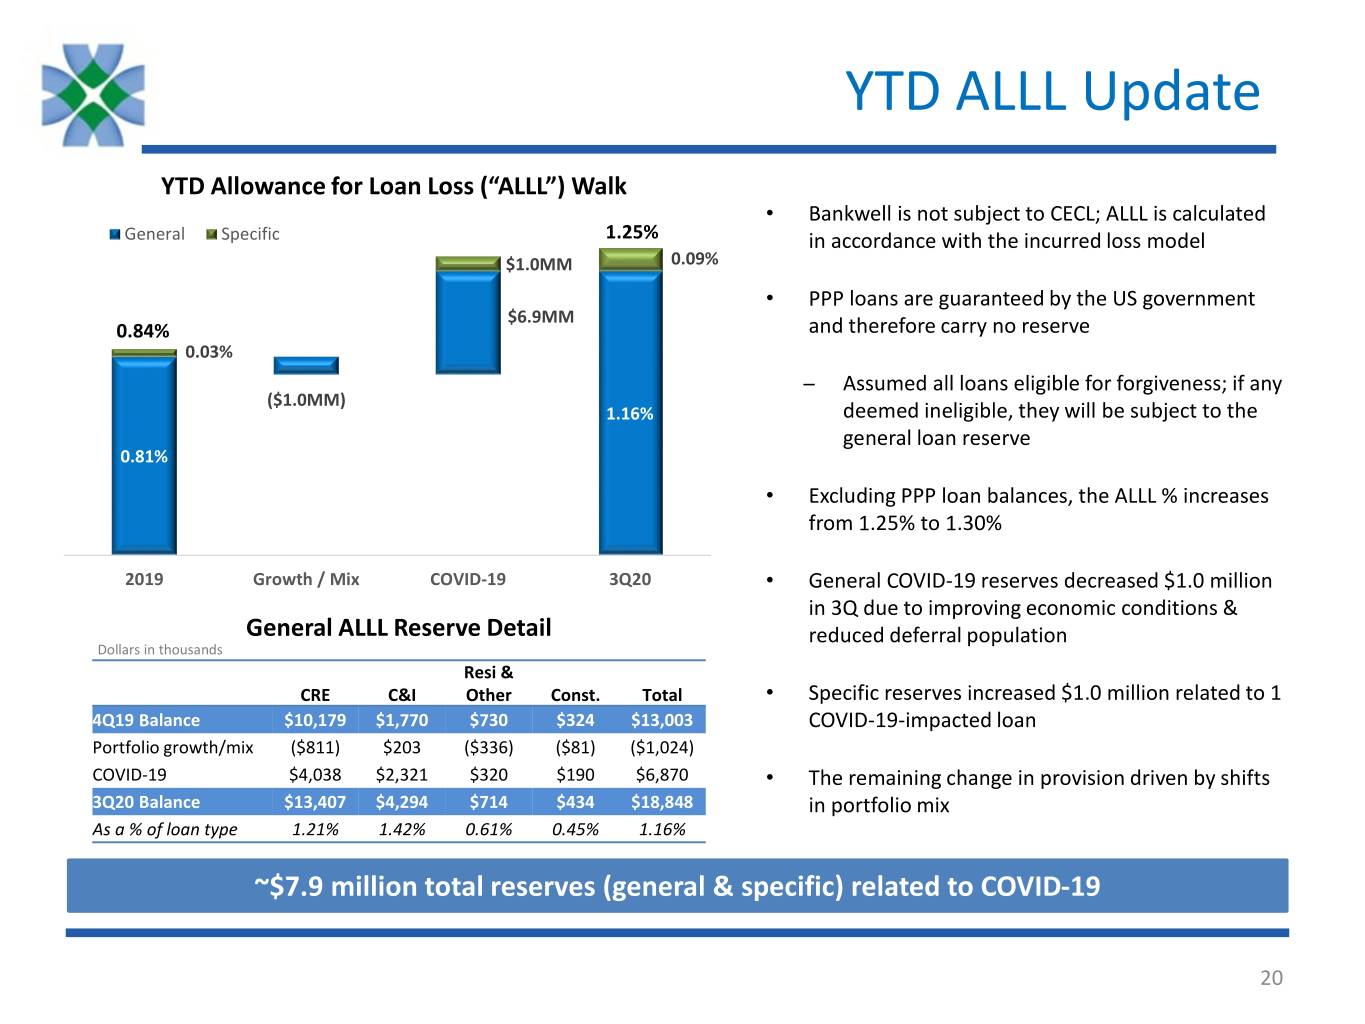
YTD ALLL Update YTD Allowance for Loan Loss (“ALLL”) Walk • Bankwell is not subject to CECL; ALLL is calculated General Specific 1.25% in accordance with the incurred loss model $1.0MM 0.09% • PPP loans are guaranteed by the US government $6.9MM 0.84% and therefore carry no reserve 0.03% ̶ Assumed all loans eligible for forgiveness; if any ($1.0MM) 1.16% deemed ineligible, they will be subject to the general loan reserve 0.81% • Excluding PPP loan balances, the ALLL % increases from 1.25% to 1.30% 2019 Growth / Mix COVID-19 3Q20 • General COVID-19 reserves decreased $1.0 million in 3Q due to improving economic conditions & General ALLL Reserve Detail reduced deferral population Dollars in thousands Resi & CRE C&I Other Const. Total • Specific reserves increased $1.0 million related to 1 4Q19 Balance $10,179 $1,770 $730 $324 $13,003 COVID-19-impacted loan Portfolio growth/mix ($811) $203 ($336) ($81) ($1,024) COVID-19 $4,038 $2,321 $320 $190 $6,870 • The remaining change in provision driven by shifts 3Q20 Balance $13,407 $4,294 $714 $434 $18,848 in portfolio mix As a % of loan type 1.21% 1.42% 0.61% 0.45% 1.16% ~$7.9 million total reserves (general & specific) related to COVID-19 20
3Q20 Performance Impact of COVID-19
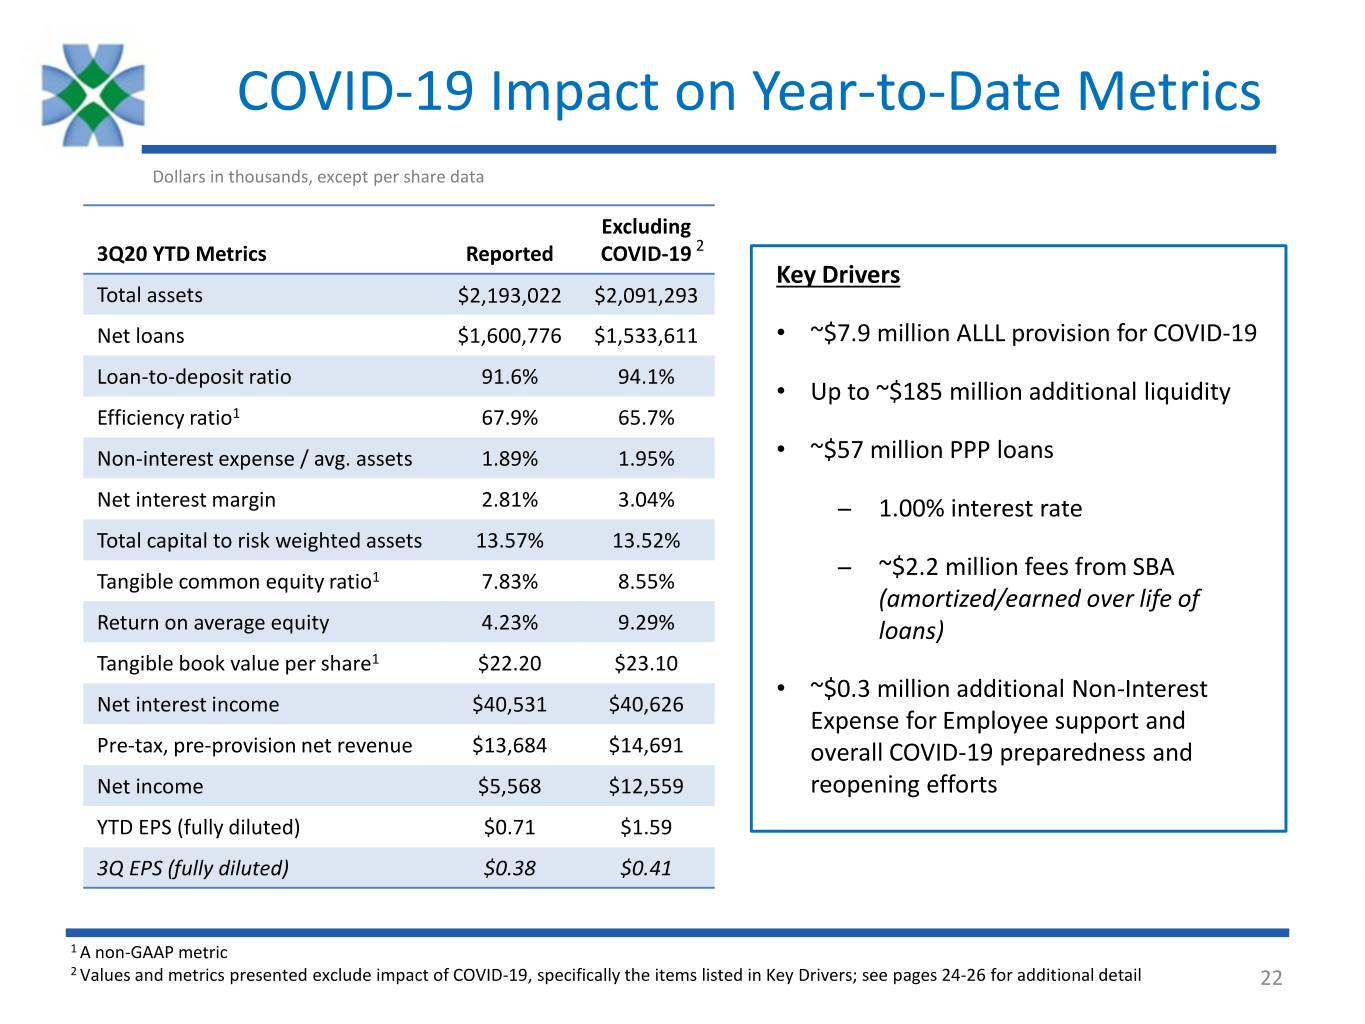
COVID-19 Impact on Year-to-Date Metrics Dollars in thousands, except per share data Excluding 2 3Q20 YTD Metrics Reported COVID-19 2 Key Drivers Total assets $2,193,022 $2,091,293 Net loans $1,600,776 $1,533,611 • ~$7.9 million ALLL provision for COVID-19 Loan-to-deposit ratio 91.6% 94.1% • Up to ~$185 million additional liquidity Efficiency ratio1 67.9% 65.7% Non-interest expense / avg. assets 1.89% 1.95% • ~$57 million PPP loans Net interest margin 2.81% 3.04% ̶ 1.00% interest rate Total capital to risk weighted assets 13.57% 13.52% ̶ ~$2.2 million fees from SBA Tangible common equity ratio1 7.83% 8.55% (amortized/earned over life of Return on average equity 4.23% 9.29% loans) Tangible book value per share1 $22.20 $23.10 • ~$0.3 million additional Non-Interest Net interest income $40,531 $40,626 Expense for Employee support and Pre-tax, pre-provision net revenue $13,684 $14,691 overall COVID-19 preparedness and Net income $5,568 $12,559 reopening efforts YTD EPS (fully diluted) $0.71 $1.59 3Q EPS (fully diluted) $0.38 $0.41 1 A non-GAAP metric 2 Values and metrics presented exclude impact of COVID-19, specifically the items listed in Key Drivers; see pages 24-26 for additional detail 22
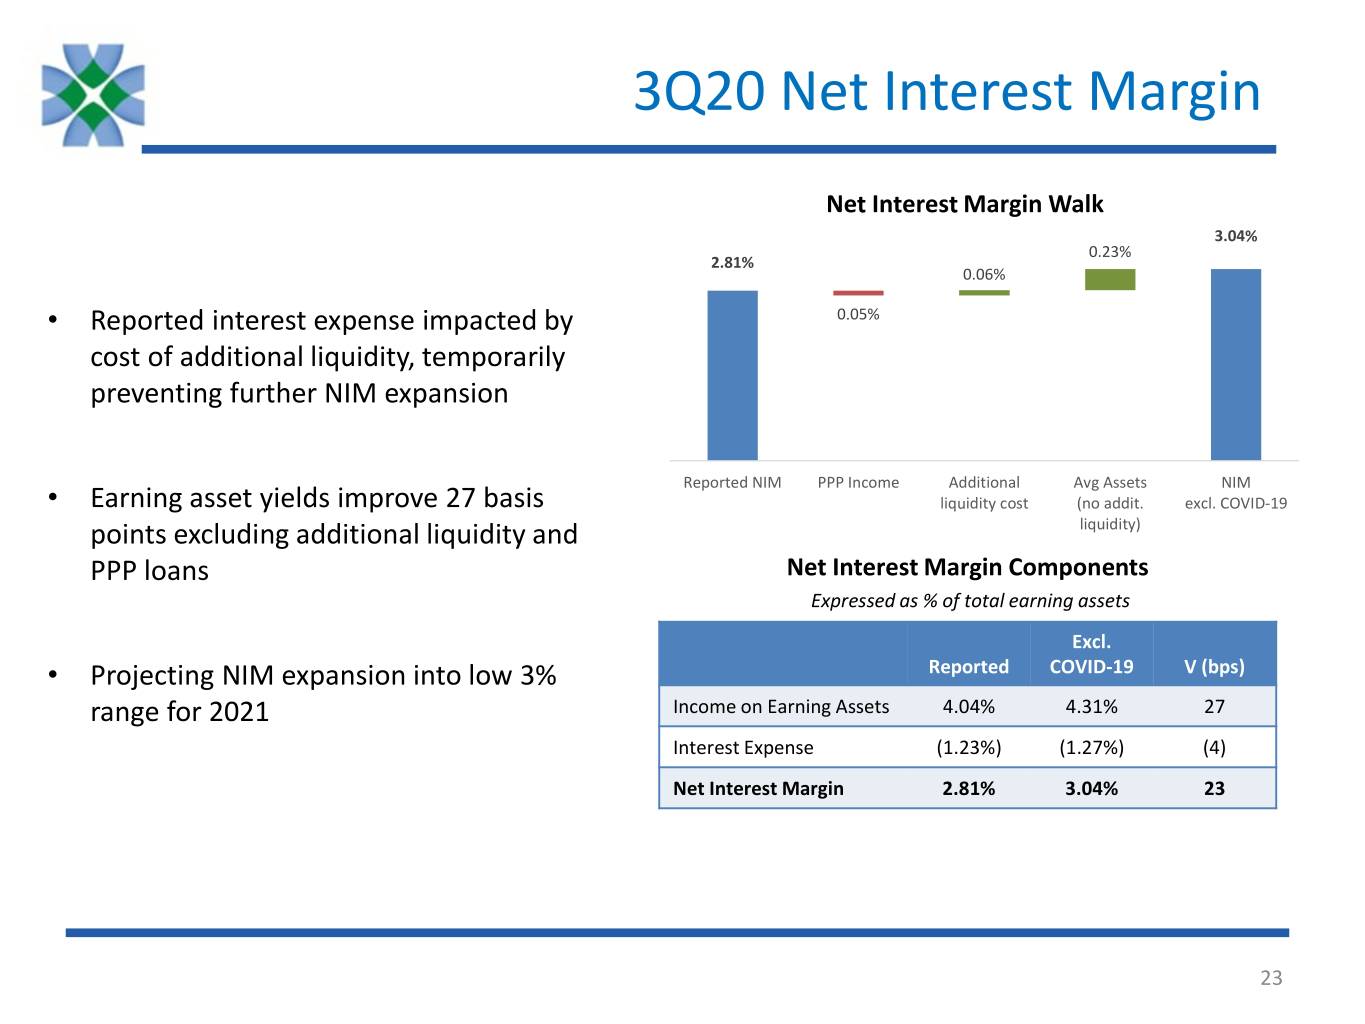
3Q20 Net Interest Margin Net Interest Margin Walk 3.04% 0.23% 2.81% 0.06% • Reported interest expense impacted by 0.05% cost of additional liquidity, temporarily preventing further NIM expansion Reported NIM PPP Income Additional Avg Assets NIM • Earning asset yields improve 27 basis liquidity cost (no addit. excl. COVID-19 points excluding additional liquidity and liquidity) PPP loans Net Interest Margin Components Expressed as % of total earning assets Excl. • Projecting NIM expansion into low 3% Reported COVID-19 V (bps) range for 2021 Income on Earning Assets 4.04% 4.31% 27 Interest Expense (1.23%) (1.27%) (4) Net Interest Margin 2.81% 3.04% 23 23
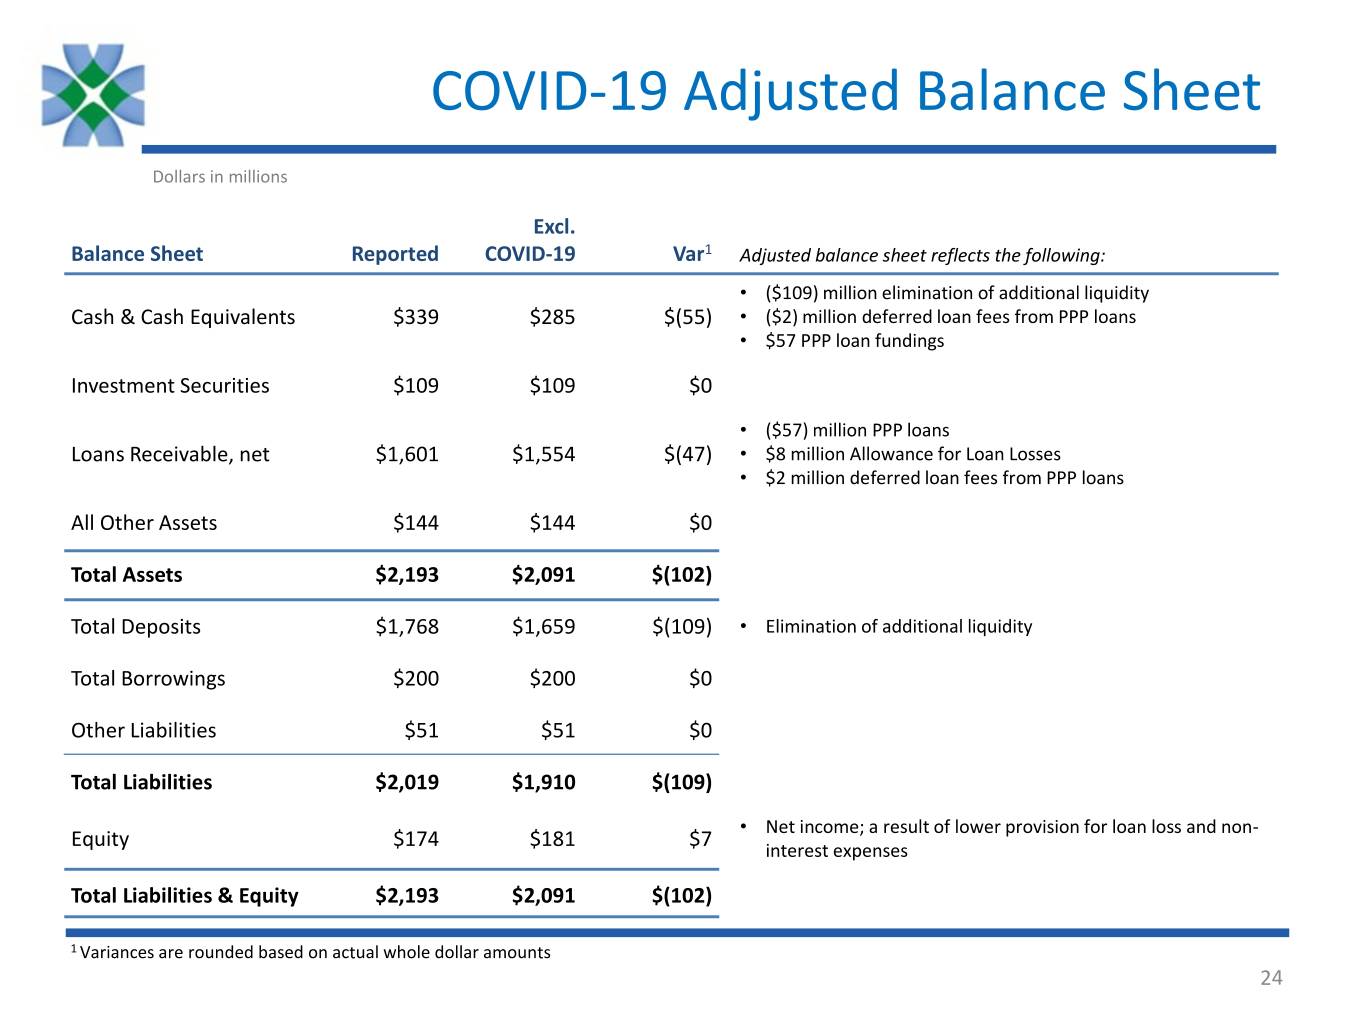
COVID-19 Adjusted Balance Sheet Dollars in millions Excl. Balance Sheet Reported COVID-19 Var1 Adjusted balance sheet reflects the following: • ($109) million elimination of additional liquidity Cash & Cash Equivalents $339 $285 $(55) • ($2) million deferred loan fees from PPP loans • $57 PPP loan fundings Investment Securities $109 $109 $0 • ($57) million PPP loans Loans Receivable, net $1,601 $1,554 $(47) • $8 million Allowance for Loan Losses • $2 million deferred loan fees from PPP loans All Other Assets $144 $144 $0 Total Assets $2,193 $2,091 $(102) Total Deposits $1,768 $1,659 $(109) • Elimination of additional liquidity Total Borrowings $200 $200 $0 Other Liabilities $51 $51 $0 Total Liabilities $2,019 $1,910 $(109) • Net income; a result of lower provision for loan loss and non- Equity $174 $181 $7 interest expenses Total Liabilities & Equity $2,193 $2,091 $(102) 1 Variances are rounded based on actual whole dollar amounts 24
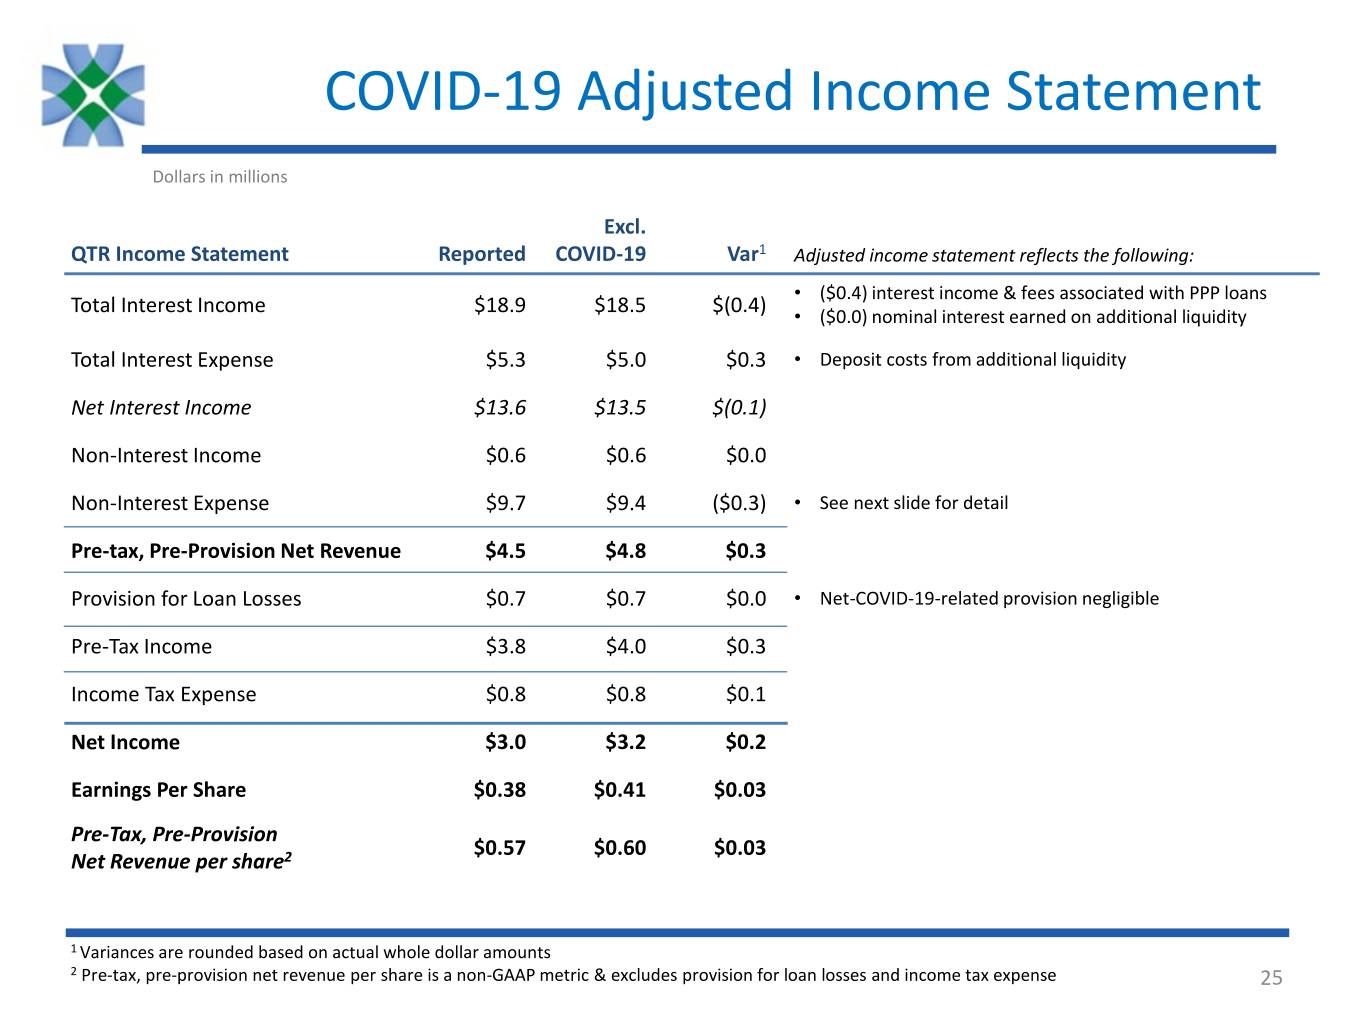
COVID-19 Adjusted Income Statement Dollars in millions Excl. QTR Income Statement Reported COVID-19 Var1 Adjusted income statement reflects the following: • ($0.4) interest income & fees associated with PPP loans Total Interest Income $18.9 $18.5 $(0.4) • ($0.0) nominal interest earned on additional liquidity Total Interest Expense $5.3 $5.0 $0.3 • Deposit costs from additional liquidity Net Interest Income $13.6 $13.5 $(0.1) Non-Interest Income $0.6 $0.6 $0.0 Non-Interest Expense $9.7 $9.4 ($0.3) • See next slide for detail Pre-tax, Pre-Provision Net Revenue $4.5 $4.8 $0.3 Provision for Loan Losses $0.7 $0.7 $0.0 • Net-COVID-19-related provision negligible Pre-Tax Income $3.8 $4.0 $0.3 Income Tax Expense $0.8 $0.8 $0.1 Net Income $3.0 $3.2 $0.2 Earnings Per Share $0.38 $0.41 $0.03 Pre-Tax, Pre-Provision $0.57 $0.60 $0.03 Net Revenue per share2 1 Variances are rounded based on actual whole dollar amounts 2 Pre-tax, pre-provision net revenue per share is a non-GAAP metric & excludes provision for loan losses and income tax expense 25
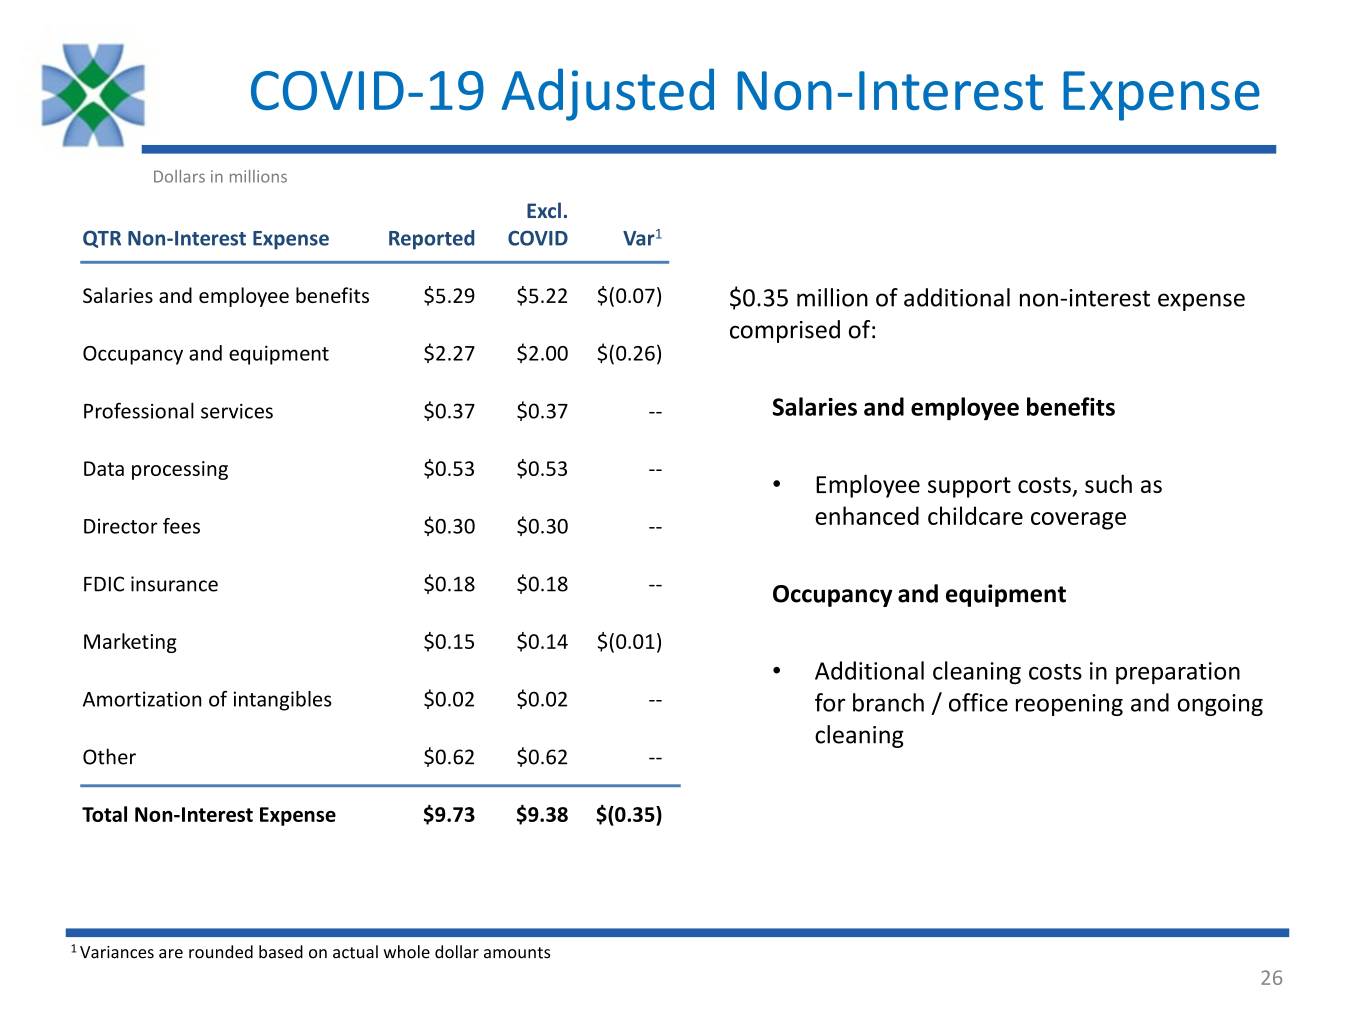
COVID-19 Adjusted Non-Interest Expense Dollars in millions Excl. QTR Non-Interest Expense Reported COVID Var1 Salaries and employee benefits $5.29 $5.22 $(0.07) $0.35 million of additional non-interest expense comprised of: Occupancy and equipment $2.27 $2.00 $(0.26) Professional services $0.37 $0.37 -- Salaries and employee benefits Data processing $0.53 $0.53 -- • Employee support costs, such as Director fees $0.30 $0.30 -- enhanced childcare coverage FDIC insurance $0.18 $0.18 -- Occupancy and equipment Marketing $0.15 $0.14 $(0.01) • Additional cleaning costs in preparation Amortization of intangibles $0.02 $0.02 -- for branch / office reopening and ongoing cleaning Other $0.62 $0.62 -- Total Non-Interest Expense $9.73 $9.38 $(0.35) 1 Variances are rounded based on actual whole dollar amounts 26

Capital
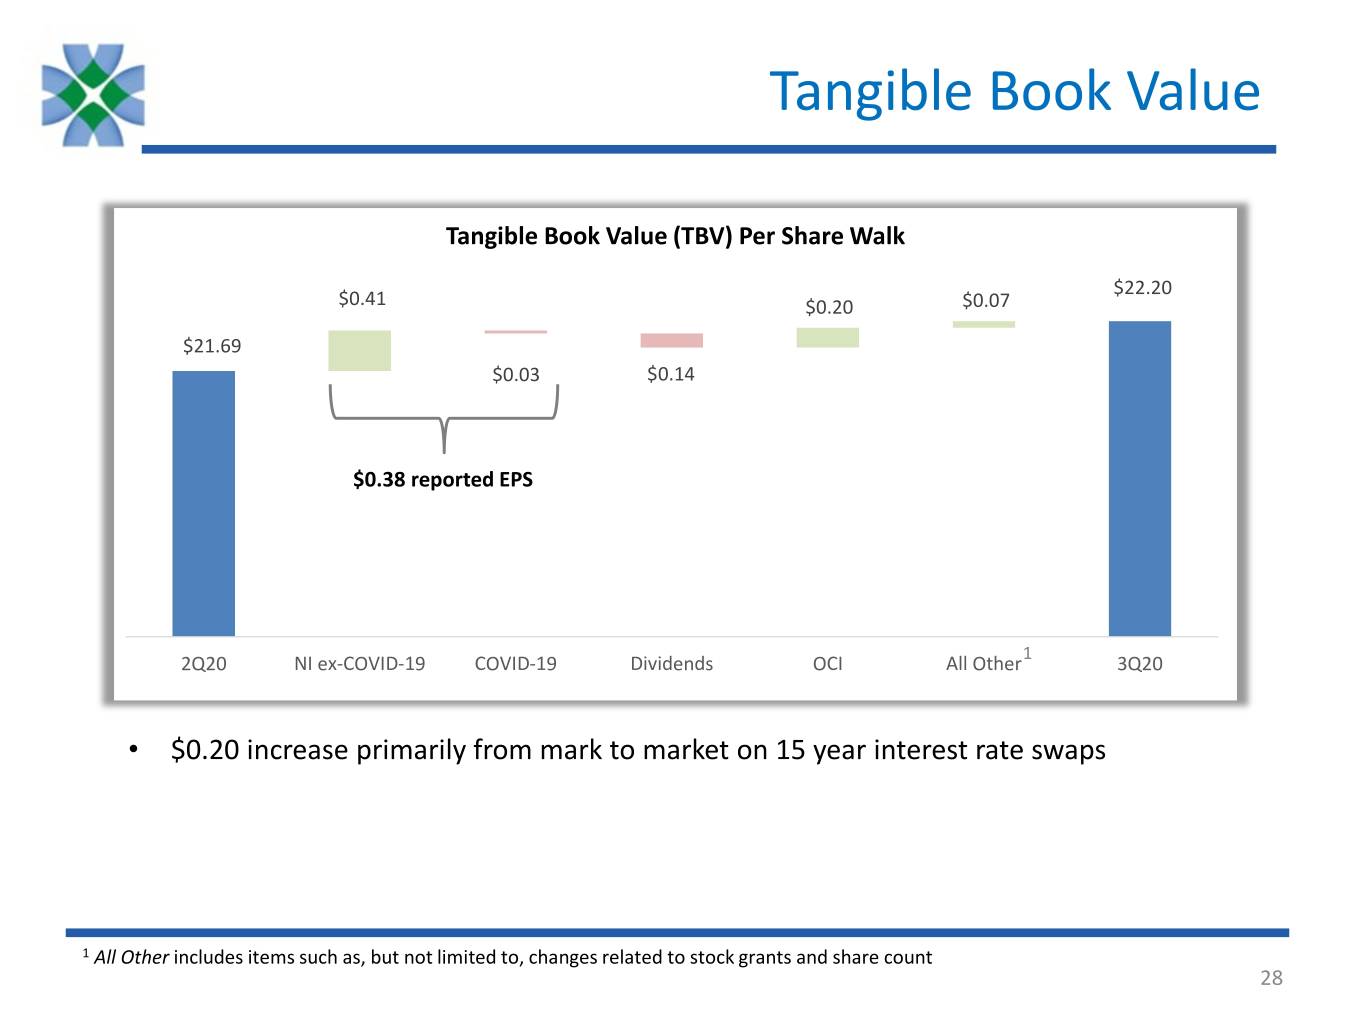
Tangible Book Value Tangible Book Value (TBV) Per Share Walk $22.20 $0.41 $0.20 $0.07 $21.69 $0.03 $0.14 $0.38 reported EPS 1 2Q20 NI ex-COVID-19 COVID-19 Dividends OCI All Other 3Q20 • $0.20 increase primarily from mark to market on 15 year interest rate swaps 1 All Other includes items such as, but not limited to, changes related to stock grants and share count 28
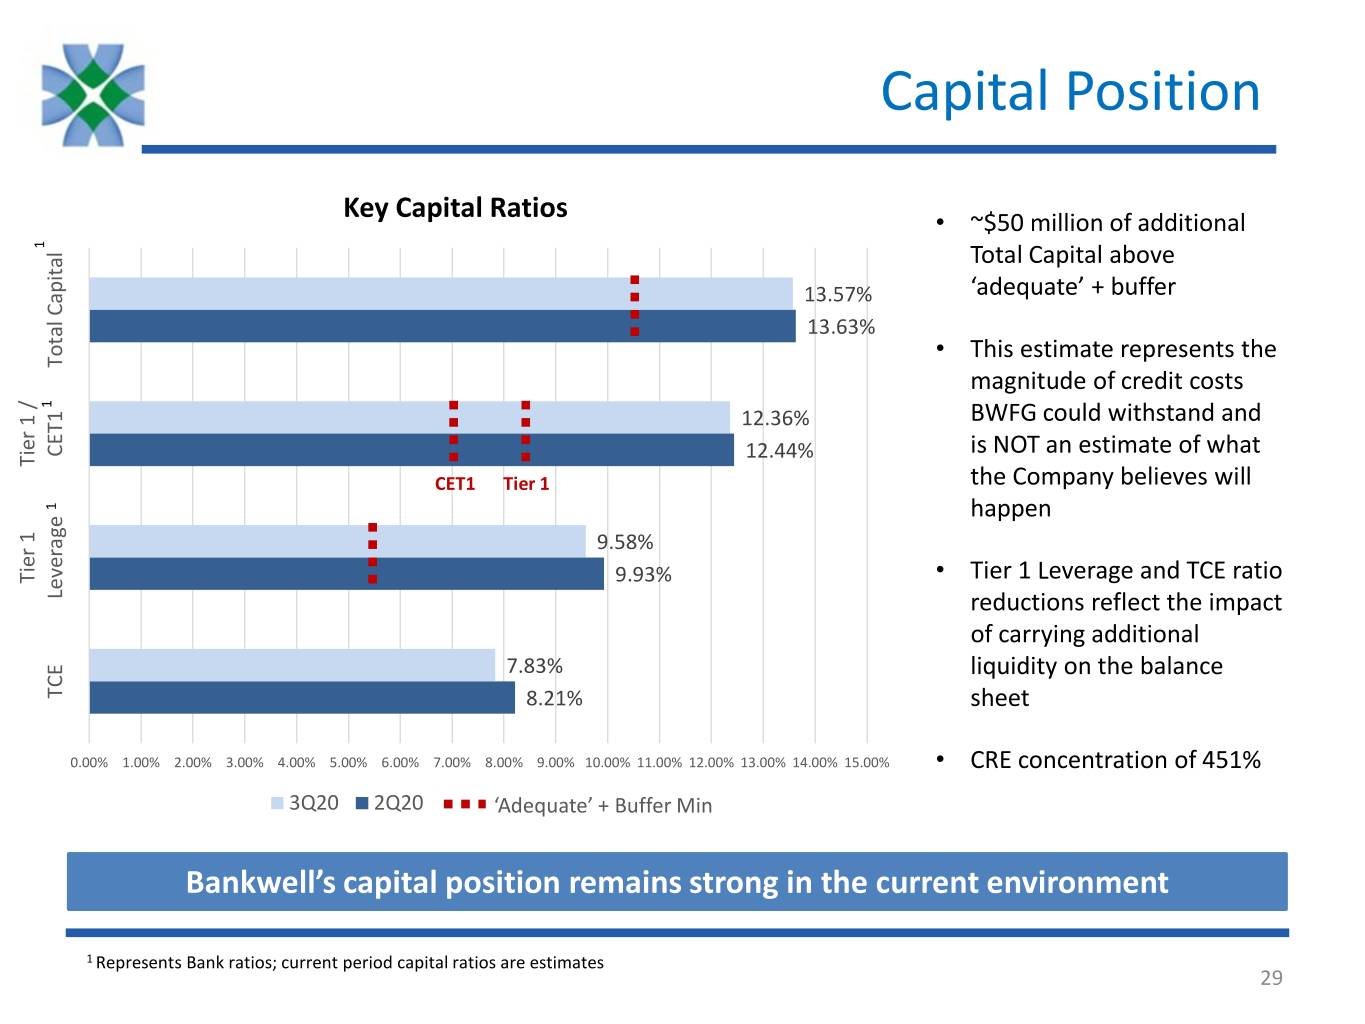
Capital Position Key Capital Ratios • ~$50 million of additional 1 Total Capital above 13.57% ‘adequate’ + buffer 13.63% • This estimate represents the Total Capital Total magnitude of credit costs 1 12.36% BWFG could withstand and CET1 12.44% is NOT an estimate of what Tier 1 Tier / CET1 Tier 1 the Company believes will 1 happen 9.58% Tier 1 Tier 9.93% • Tier 1 Leverage and TCE ratio Leverage reductions reflect the impact of carrying additional 7.83% liquidity on the balance TCE 8.21% sheet 0.00% 1.00% 2.00% 3.00% 4.00% 5.00% 6.00% 7.00% 8.00% 9.00% 10.00% 11.00% 12.00% 13.00% 14.00% 15.00% • CRE concentration of 451% 3Q20 2Q20 ‘Adequate’ + Buffer Min Bankwell’s capital position remains strong in the current environment 1 Represents Bank ratios; current period capital ratios are estimates 29

Bankwell History & Overview
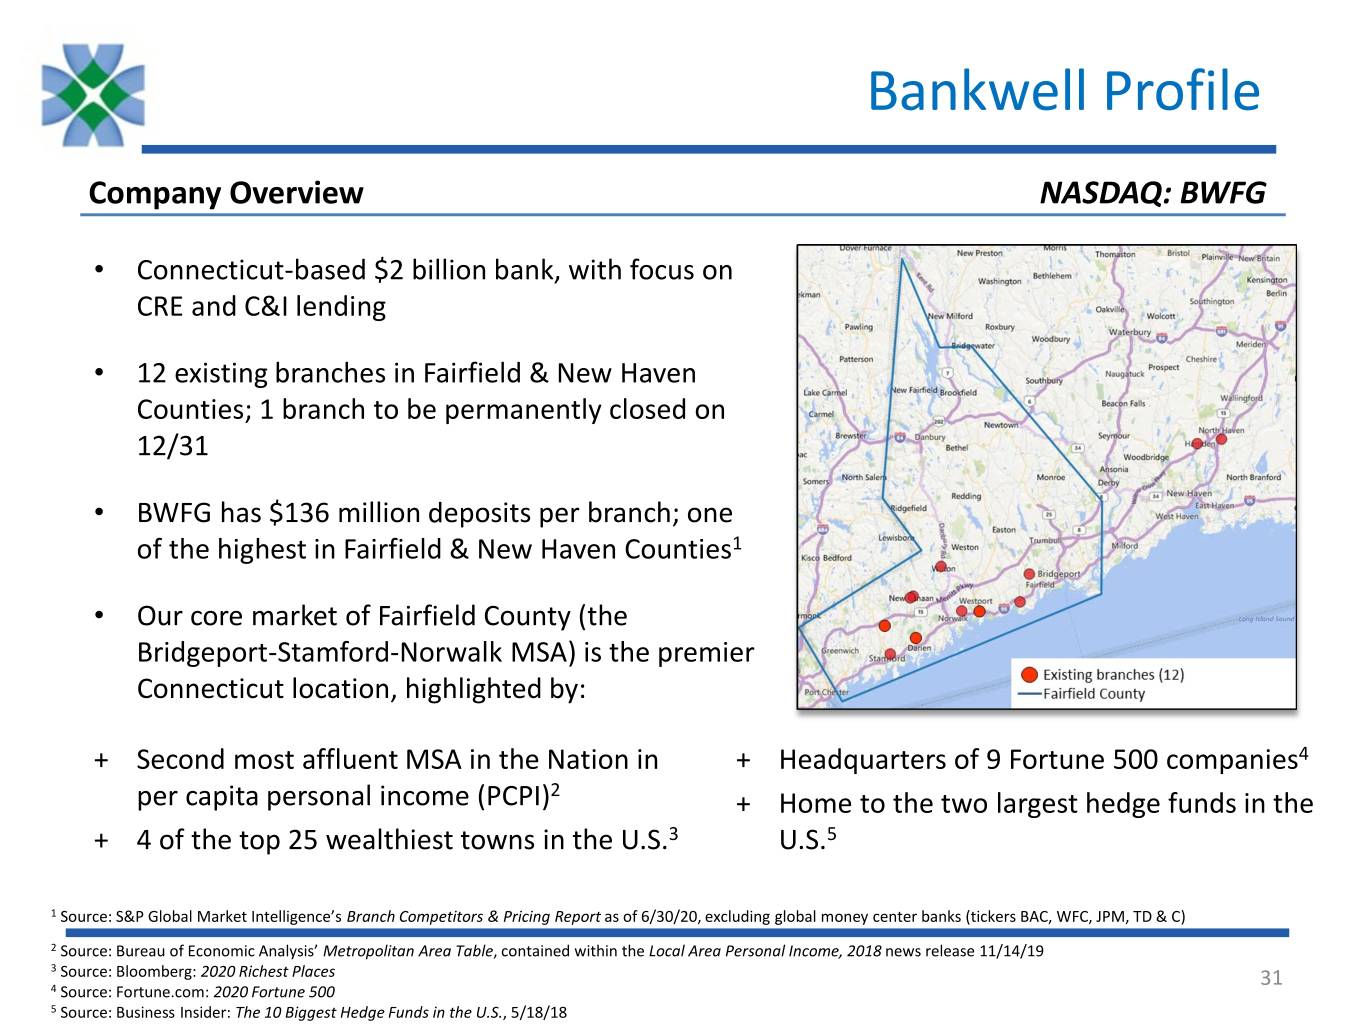
Bankwell Profile Company Overview NASDAQ: BWFG • Connecticut-based $2 billion bank, with focus on CRE and C&I lending • 12 existing branches in Fairfield & New Haven Counties; 1 branch to be permanently closed on 12/31 • BWFG has $136 million deposits per branch; one of the highest in Fairfield & New Haven Counties1 • Our core market of Fairfield County (the Bridgeport-Stamford-Norwalk MSA) is the premier Connecticut location, highlighted by: + Second most affluent MSA in the Nation in + Headquarters of 9 Fortune 500 companies4 per capita personal income (PCPI)2 + Home to the two largest hedge funds in the + 4 of the top 25 wealthiest towns in the U.S.3 U.S.5 1 Source: S&P Global Market Intelligence’s Branch Competitors & Pricing Report as of 6/30/20, excluding global money center banks (tickers BAC, WFC, JPM, TD & C) 2 Source: Bureau of Economic Analysis’ Metropolitan Area Table, contained within the Local Area Personal Income, 2018 news release 11/14/19 3 Source: Bloomberg: 2020 Richest Places 31 4 Source: Fortune.com: 2020 Fortune 500 5 Source: Business Insider: The 10 Biggest Hedge Funds in the U.S., 5/18/18
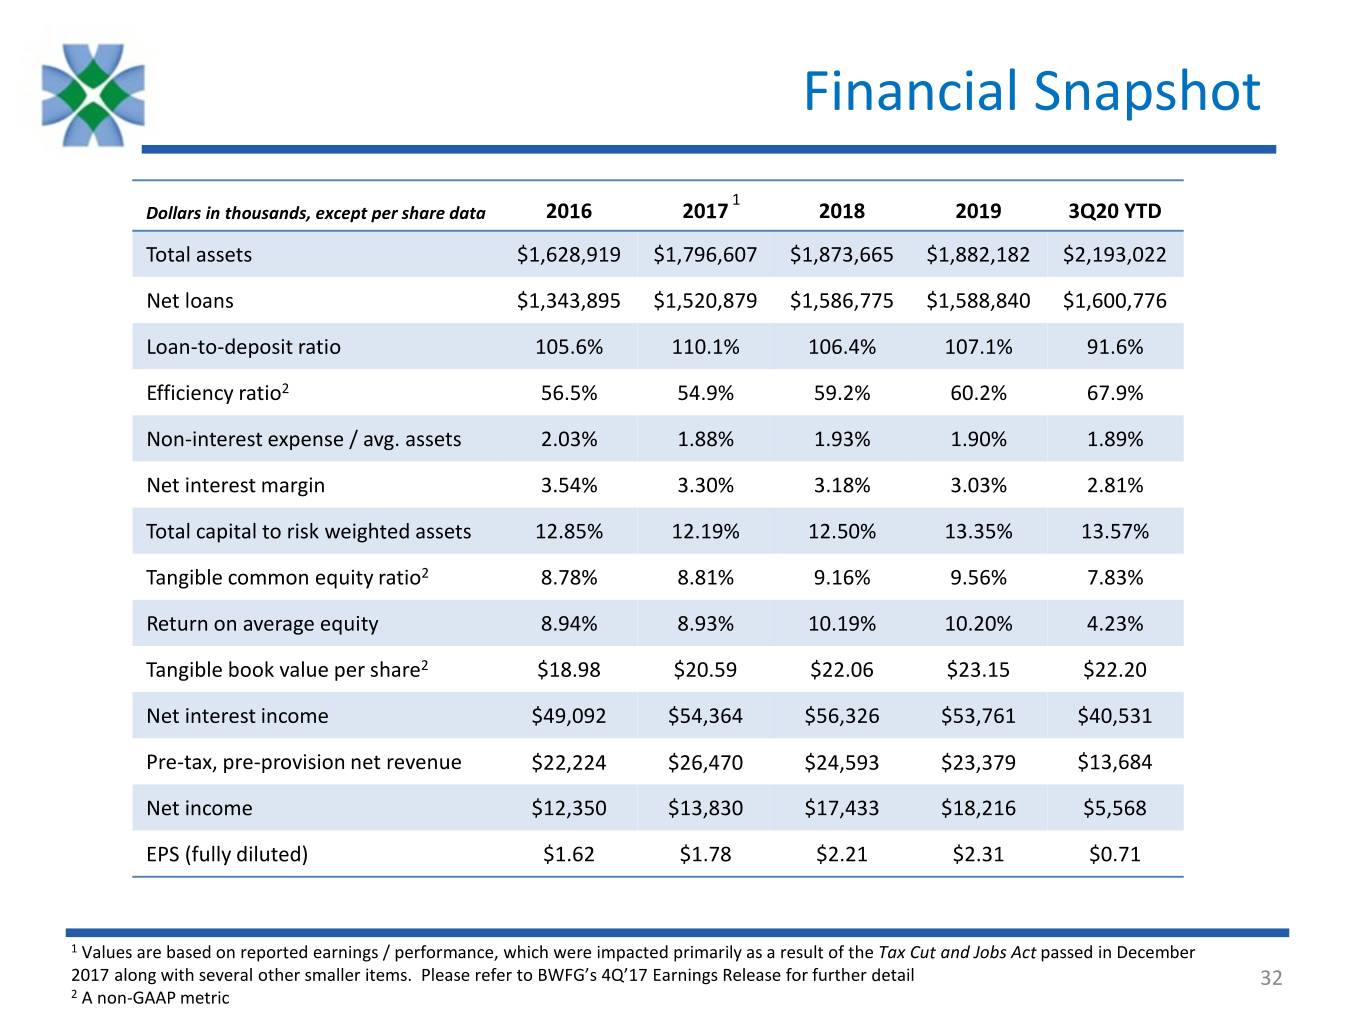
Financial Snapshot 1 Dollars in thousands, except per share data 2016 2017 2018 2019 3Q20 YTD Total assets $1,628,919 $1,796,607 $1,873,665 $1,882,182 $2,193,022 Net loans $1,343,895 $1,520,879 $1,586,775 $1,588,840 $1,600,776 Loan-to-deposit ratio 105.6% 110.1% 106.4% 107.1% 91.6% Efficiency ratio2 56.5% 54.9% 59.2% 60.2% 67.9% Non-interest expense / avg. assets 2.03% 1.88% 1.93% 1.90% 1.89% Net interest margin 3.54% 3.30% 3.18% 3.03% 2.81% Total capital to risk weighted assets 12.85% 12.19% 12.50% 13.35% 13.57% Tangible common equity ratio2 8.78% 8.81% 9.16% 9.56% 7.83% Return on average equity 8.94% 8.93% 10.19% 10.20% 4.23% Tangible book value per share2 $18.98 $20.59 $22.06 $23.15 $22.20 Net interest income $49,092 $54,364 $56,326 $53,761 $40,531 Pre-tax, pre-provision net revenue $22,224 $26,470 $24,593 $23,379 $13,684 Net income $12,350 $13,830 $17,433 $18,216 $5,568 EPS (fully diluted) $1.62 $1.78 $2.21 $2.31 $0.71 1 Values are based on reported earnings / performance, which were impacted primarily as a result of the Tax Cut and Jobs Act passed in December 2017 along with several other smaller items. Please refer to BWFG’s 4Q’17 Earnings Release for further detail 32 2 A non-GAAP metric
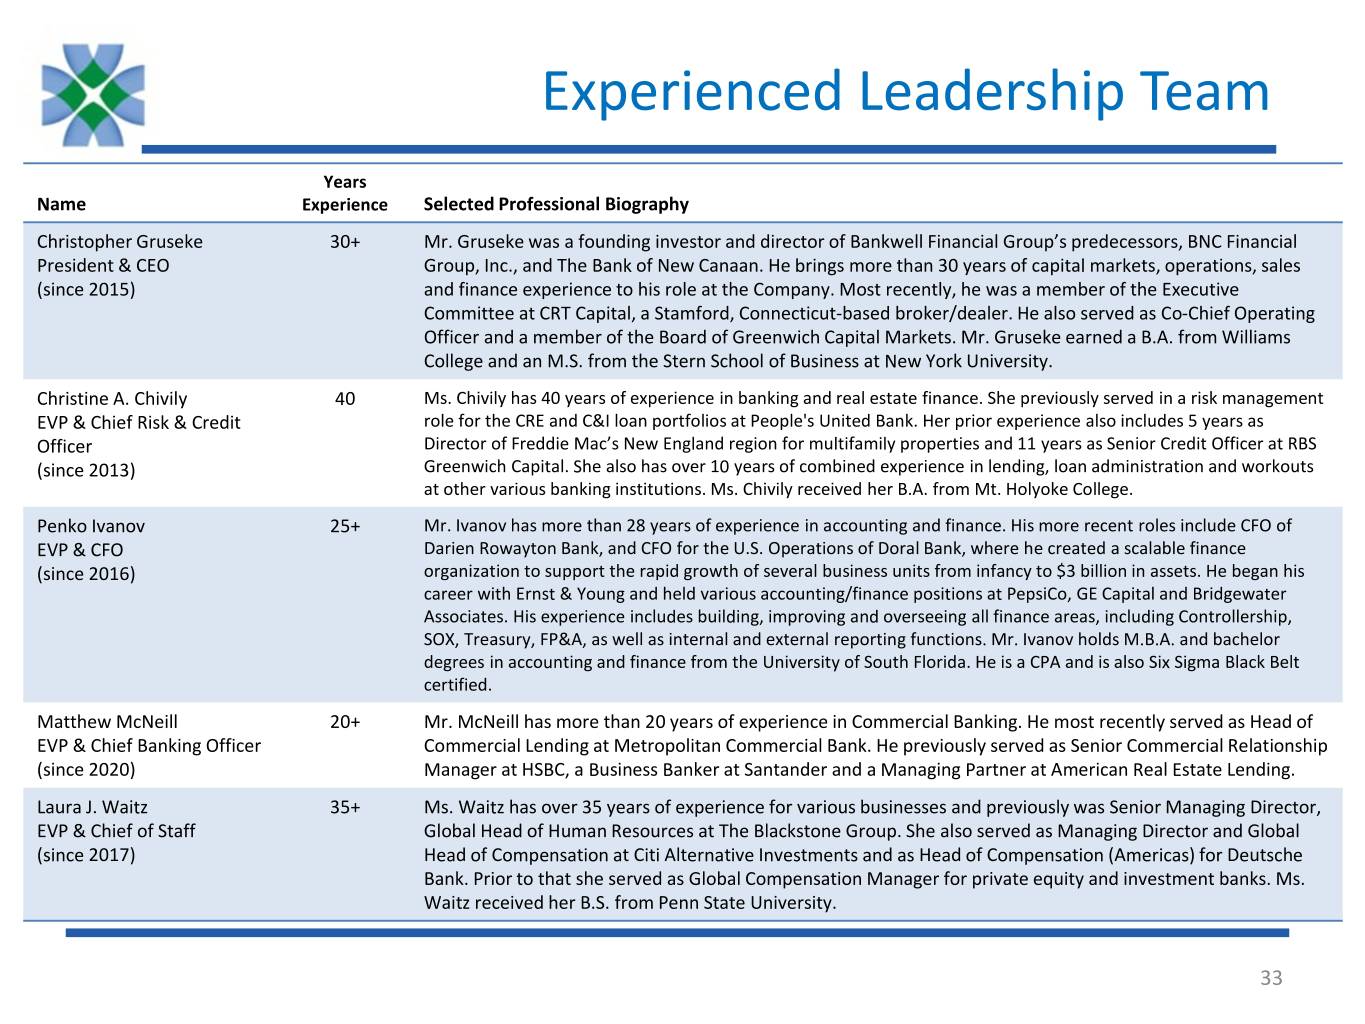
Experienced Leadership Team Years Name Experience Selected Professional Biography Christopher Gruseke 30+ Mr. Gruseke was a founding investor and director of Bankwell Financial Group’s predecessors, BNC Financial President & CEO Group, Inc., and The Bank of New Canaan. He brings more than 30 years of capital markets, operations, sales (since 2015) and finance experience to his role at the Company. Most recently, he was a member of the Executive Committee at CRT Capital, a Stamford, Connecticut-based broker/dealer. He also served as Co-Chief Operating Officer and a member of the Board of Greenwich Capital Markets. Mr. Gruseke earned a B.A. from Williams College and an M.S. from the Stern School of Business at New York University. Christine A. Chivily 40 Ms. Chivily has 40 years of experience in banking and real estate finance. She previously served in a risk management EVP & Chief Risk & Credit role for the CRE and C&I loan portfolios at People's United Bank. Her prior experience also includes 5 years as Officer Director of Freddie Mac’s New England region for multifamily properties and 11 years as Senior Credit Officer at RBS (since 2013) Greenwich Capital. She also has over 10 years of combined experience in lending, loan administration and workouts at other various banking institutions. Ms. Chivily received her B.A. from Mt. Holyoke College. Penko Ivanov 25+ Mr. Ivanov has more than 28 years of experience in accounting and finance. His more recent roles include CFO of EVP & CFO Darien Rowayton Bank, and CFO for the U.S. Operations of Doral Bank, where he created a scalable finance (since 2016) organization to support the rapid growth of several business units from infancy to $3 billion in assets. He began his career with Ernst & Young and held various accounting/finance positions at PepsiCo, GE Capital and Bridgewater Associates. His experience includes building, improving and overseeing all finance areas, including Controllership, SOX, Treasury, FP&A, as well as internal and external reporting functions. Mr. Ivanov holds M.B.A. and bachelor degrees in accounting and finance from the University of South Florida. He is a CPA and is also Six Sigma Black Belt certified. Matthew McNeill 20+ Mr. McNeill has more than 20 years of experience in Commercial Banking. He most recently served as Head of EVP & Chief Banking Officer Commercial Lending at Metropolitan Commercial Bank. He previously served as Senior Commercial Relationship (since 2020) Manager at HSBC, a Business Banker at Santander and a Managing Partner at American Real Estate Lending. Laura J. Waitz 35+ Ms. Waitz has over 35 years of experience for various businesses and previously was Senior Managing Director, EVP & Chief of Staff Global Head of Human Resources at The Blackstone Group. She also served as Managing Director and Global (since 2017) Head of Compensation at Citi Alternative Investments and as Head of Compensation (Americas) for Deutsche Bank. Prior to that she served as Global Compensation Manager for private equity and investment banks. Ms. Waitz received her B.S. from Penn State University. 33

Thank You & Questions