Exhibit 99.1
BlueLinx Announces Third Quarter 2020 Results
Net Sales of $871 million generating Net Income of $55 million
Record Adjusted EBITDA of $81 million compared to $19 million in Q3 2019
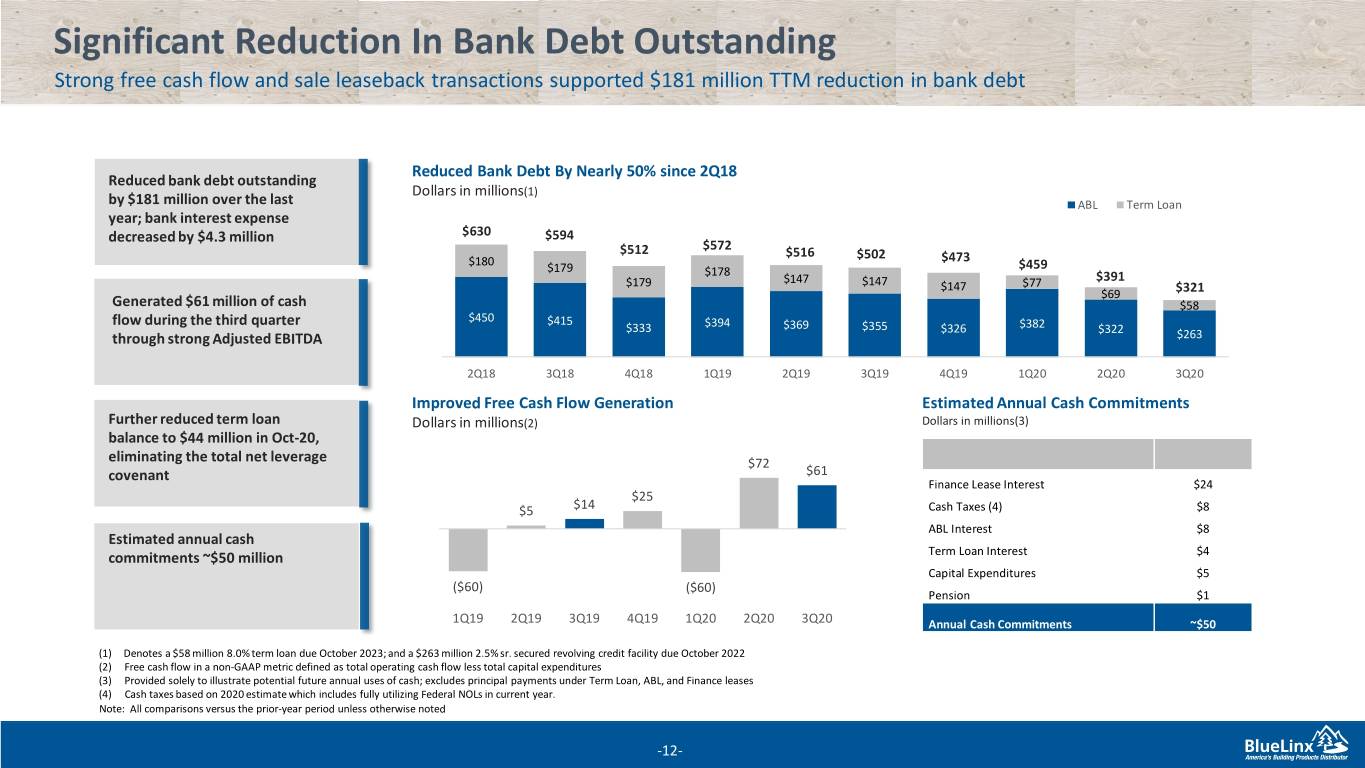
$181 million Decrease in Total Outstanding Bank Debt since Q3 2019
MARIETTA, Ga., October 28, 2020 - BlueLinx Holdings Inc. (NYSE:BXC), a leading distributor of building and industrial products, today reported financial results for the three months ended September 26, 2020.
2020 Third Quarter Financial Results Review
(all comparisons versus the prior-year period unless otherwise noted)
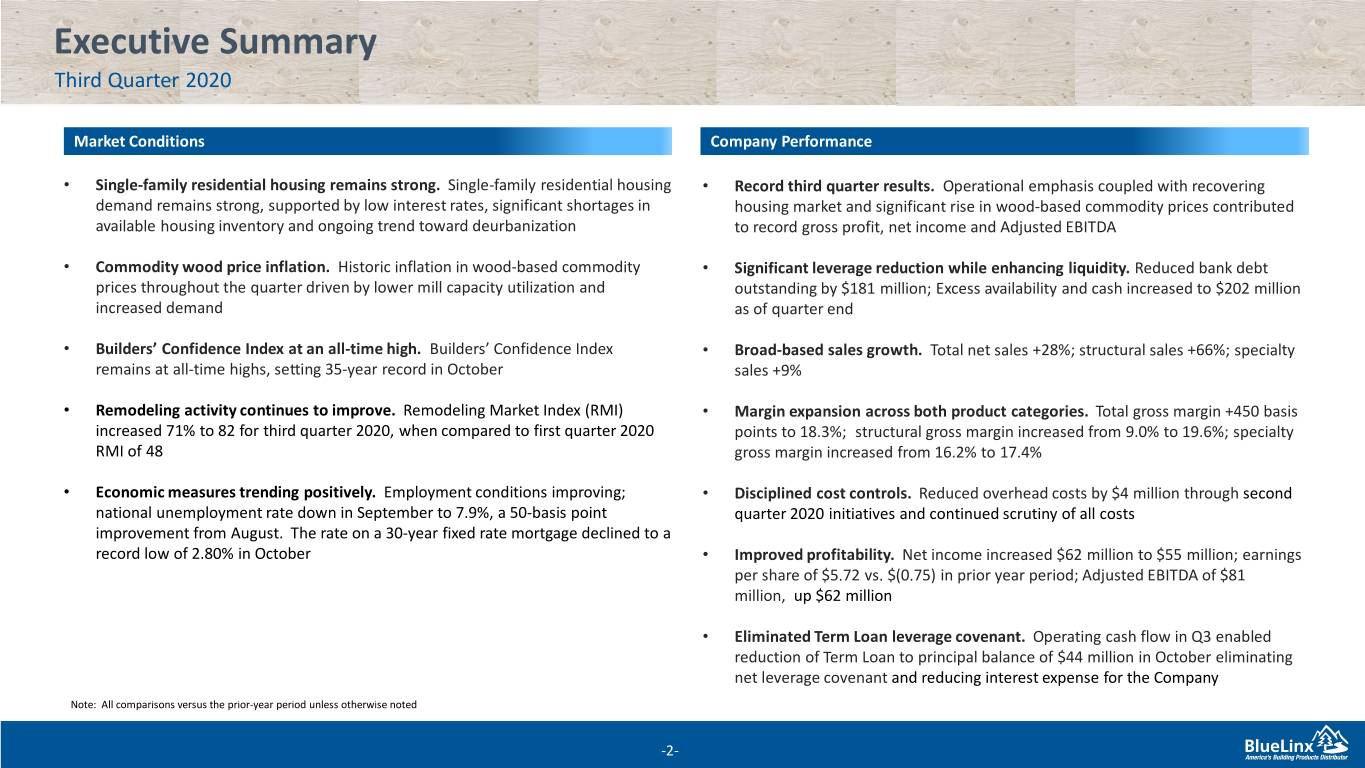
•Net sales increased $192 million, or 28.3%, to $871 million
•Gross margin increased 450 basis points to 18.3%
•Net income increased $62 million to $55 million
•Adjusted EBITDA was $81 million, increasing by $62 million
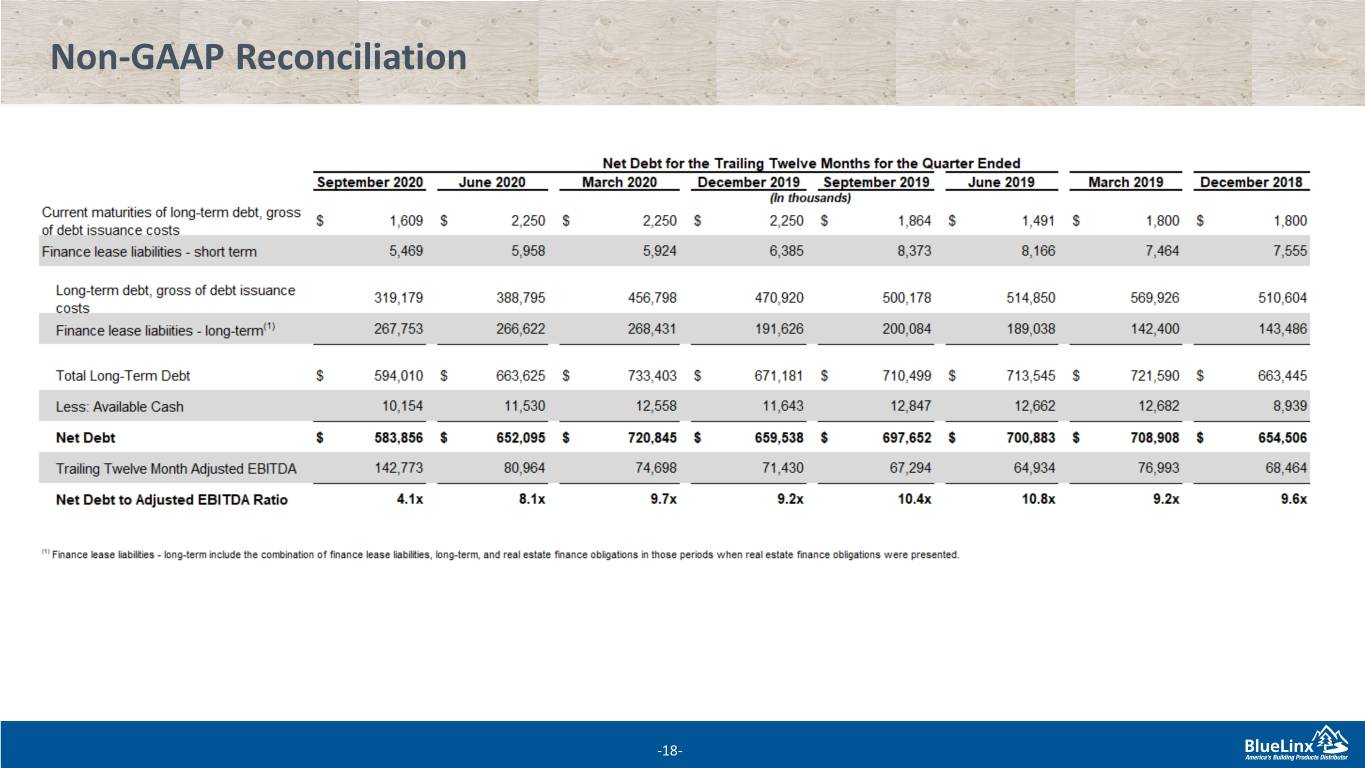
•Reduced total outstanding bank debt by $181 million
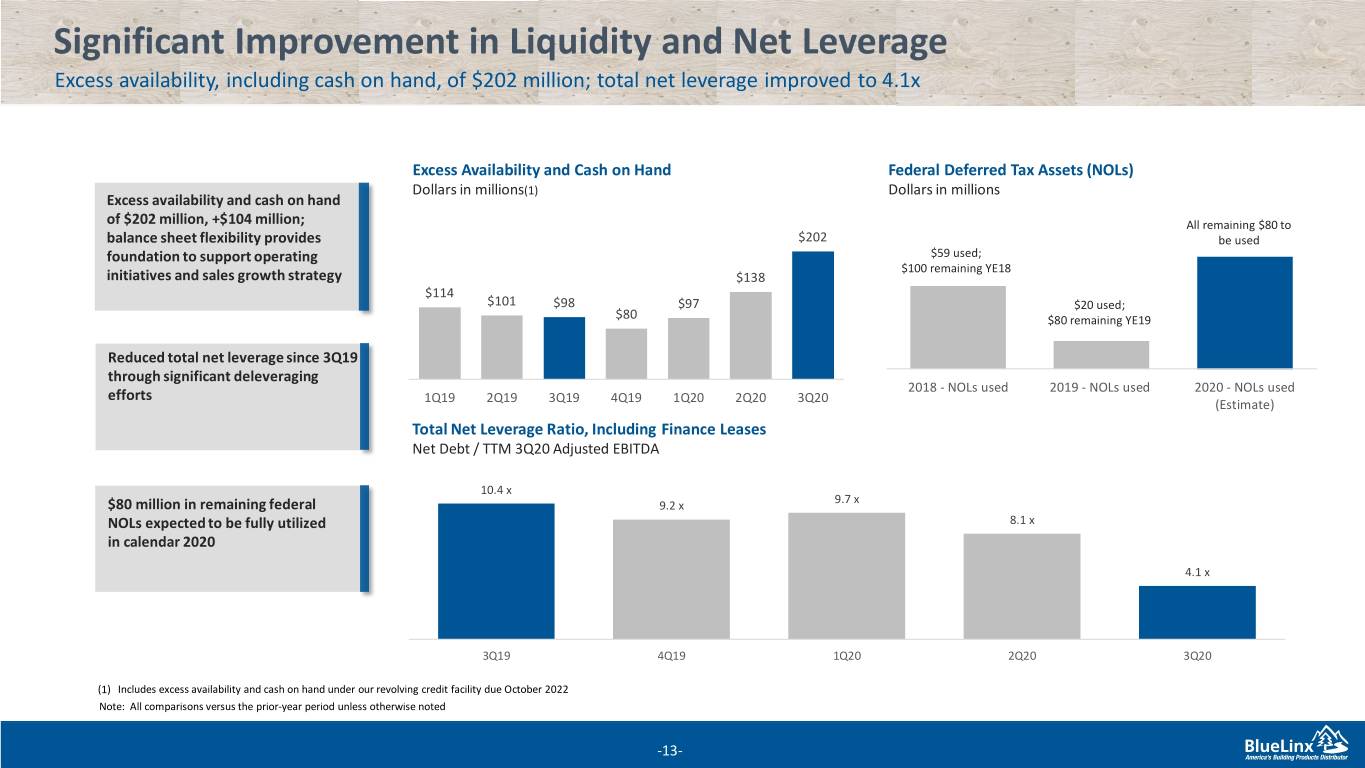
•Excess availability and cash on hand increased to $202 million
•Term Loan reduced in October to $44 million, eliminating total net leverage ratio covenant
“This was a transformative quarter for BlueLinx as we took advantage of our operational improvements over the last year to maximize our financial performance” said Mitch Lewis, President and CEO. “Although the COVID-19 pandemic continued to affect our business and the broader economy, we drove significant increases in net sales as well as historical levels of net income and Adjusted EBITDA by closely managing an improving housing market and an unprecedented inflationary environment in our wood-based structural product markets. We remain focused on our strategic imperatives, including organic sales growth, margin expansion and disciplined working capital management. We also continue to support our employees and our country’s essential infrastructure needs during the COVID-19 pandemic through strong partnerships with both our customers and suppliers.”
“During the past year, we continued to execute on our deleveraging strategy by taking decisive actions to reduce our outstanding indebtedness through cash flow from operations and sale leaseback transactions,” stated Kelly Janzen, Chief Financial Officer. “Over the past twelve months, we reduced our outstanding bank debt by more than $180 million and increased our available liquidity by ending the quarter with $202 million in excess availability under our revolving credit facility and cash on hand. In October, we further reduced our indebtedness under our term loan by an additional $14 million to approximately $44 million outstanding, which reduced our Company’s interest expense and eliminated that facility’s total net leverage ratio covenant.”
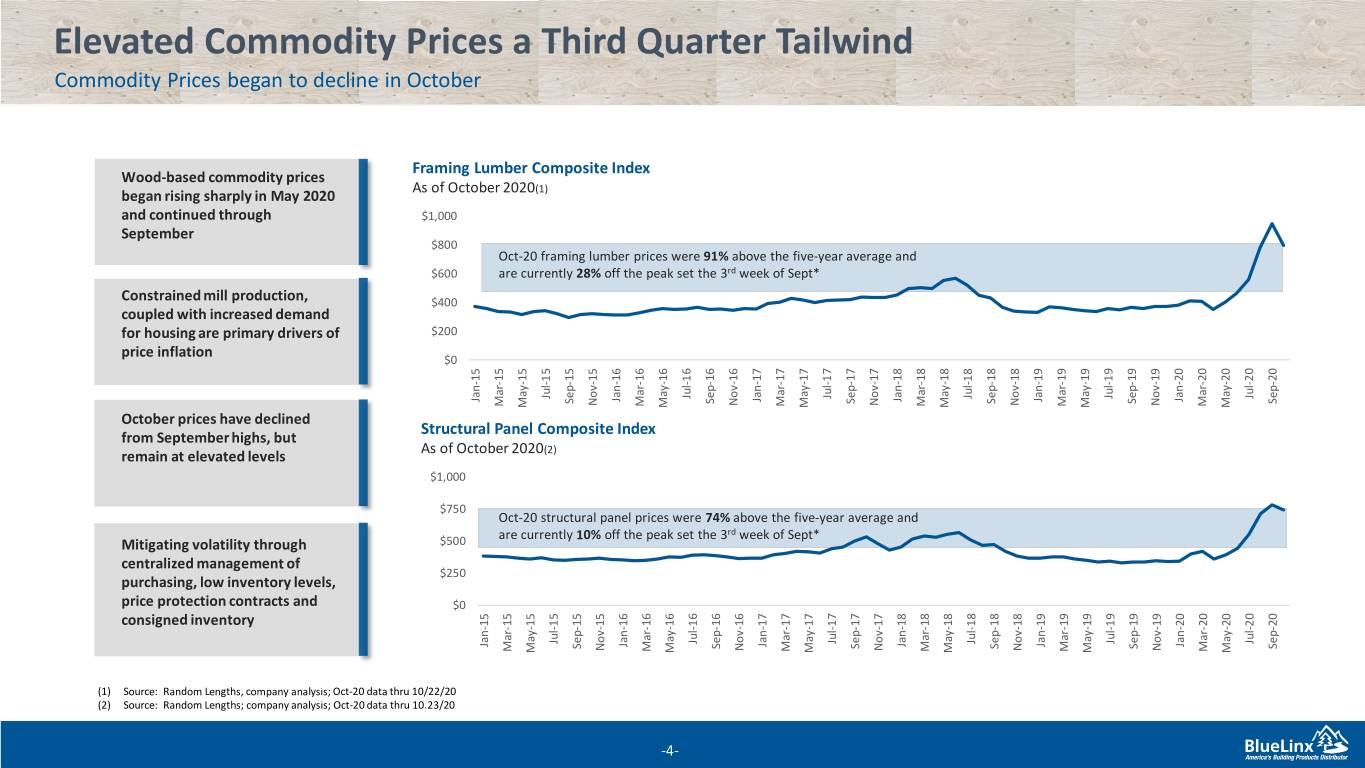
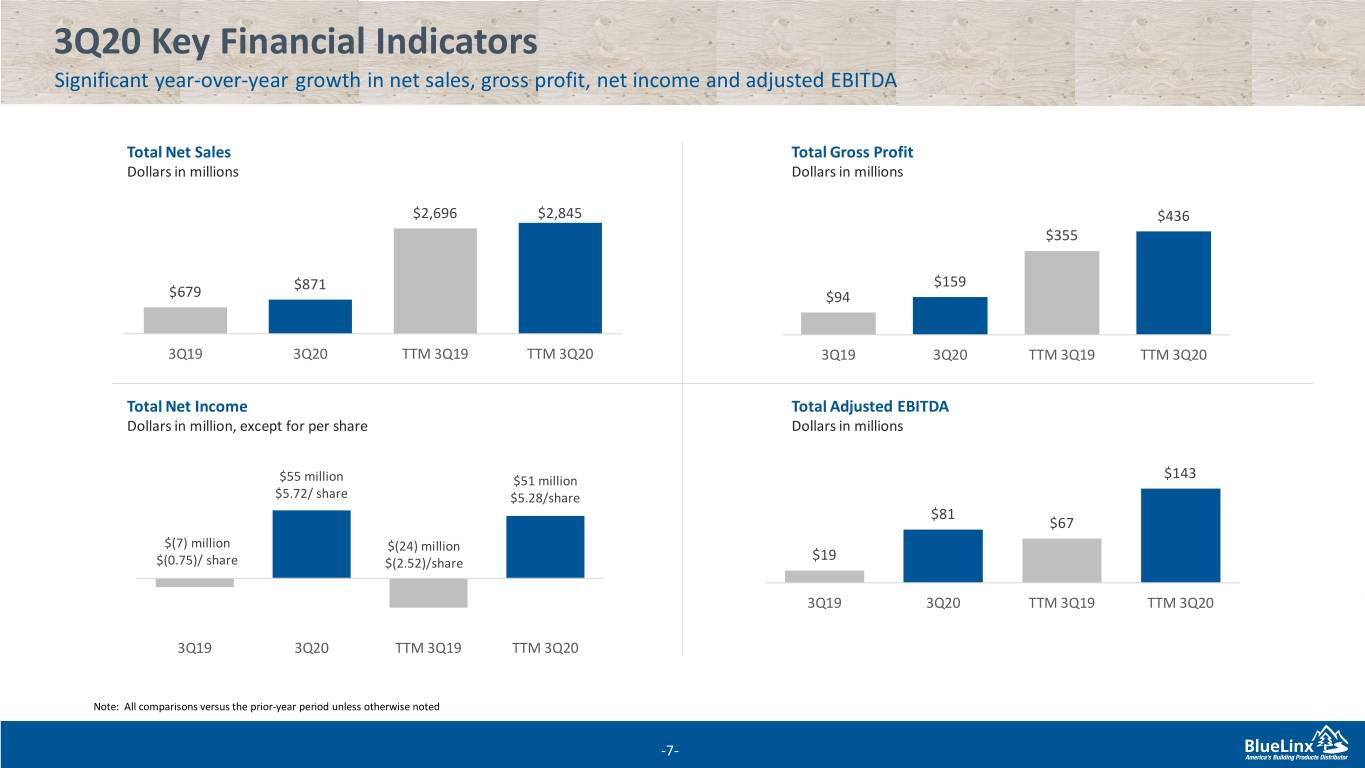
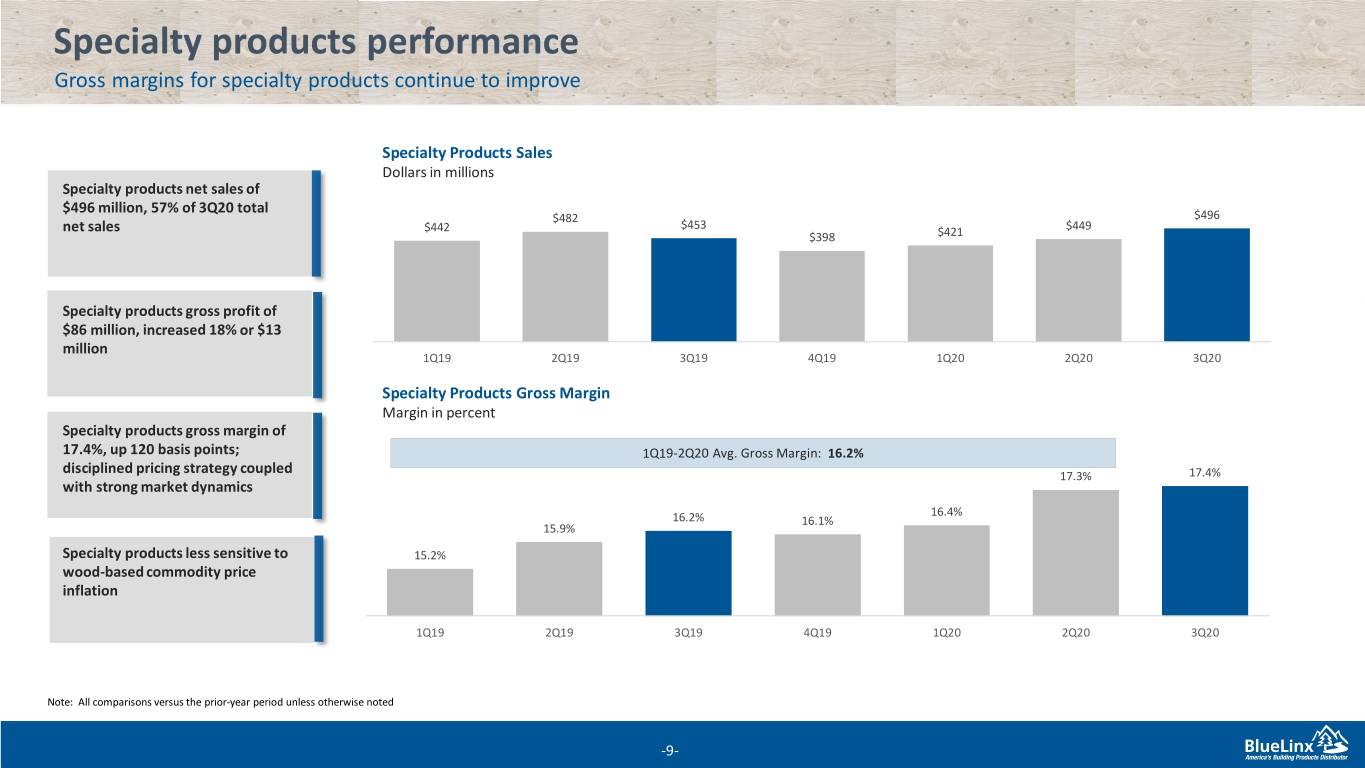
BlueLinx reported net sales of $871 million in the third quarter, compared to $679 million in the prior year period and gross profit of $159 million, compared to $94 million in the prior year period. Net sales during the quarter benefitted significantly from historic price inflation across key wood-based commodities during the period, primarily impacting net sales of structural products. The unusual impact of wood-based commodity price inflation on structural product net sales is estimated to have increased overall net sales between $105 million and $115 million for the quarter. Structural product gross margin was also favorably impacted by this price inflation as the Company reported structural product gross margin of 19.6% for the third quarter compared to 9.0% in the prior year period. Third quarter net sales of structural products, which includes products such as lumber, plywood, oriented strand board, rebar, and remesh were $375 million, while net sales for specialty products, which includes products such as engineered wood, cedar, moulding, siding, metal products and insulation, accounted for $496 million in the period.
The Company reported net income of $55 million in the third quarter, or $5.72 per diluted share, compared to a net loss of $7 million, or $(0.75) per diluted share, in the prior-year period. Third quarter 2020 net income benefited from approximately $8 million, or $0.84 per diluted share, of non-recurring items, including a gain on a sale-leaseback transaction involving our
1
Denver facility, versus a reduction of $5 million from non-recurring items, or $(0.50) per diluted share, in the prior-year period. Excluding these non-recurring items, net income increased by $49 million on a year-over-year basis in the third quarter, when compared to the third quarter 2019.
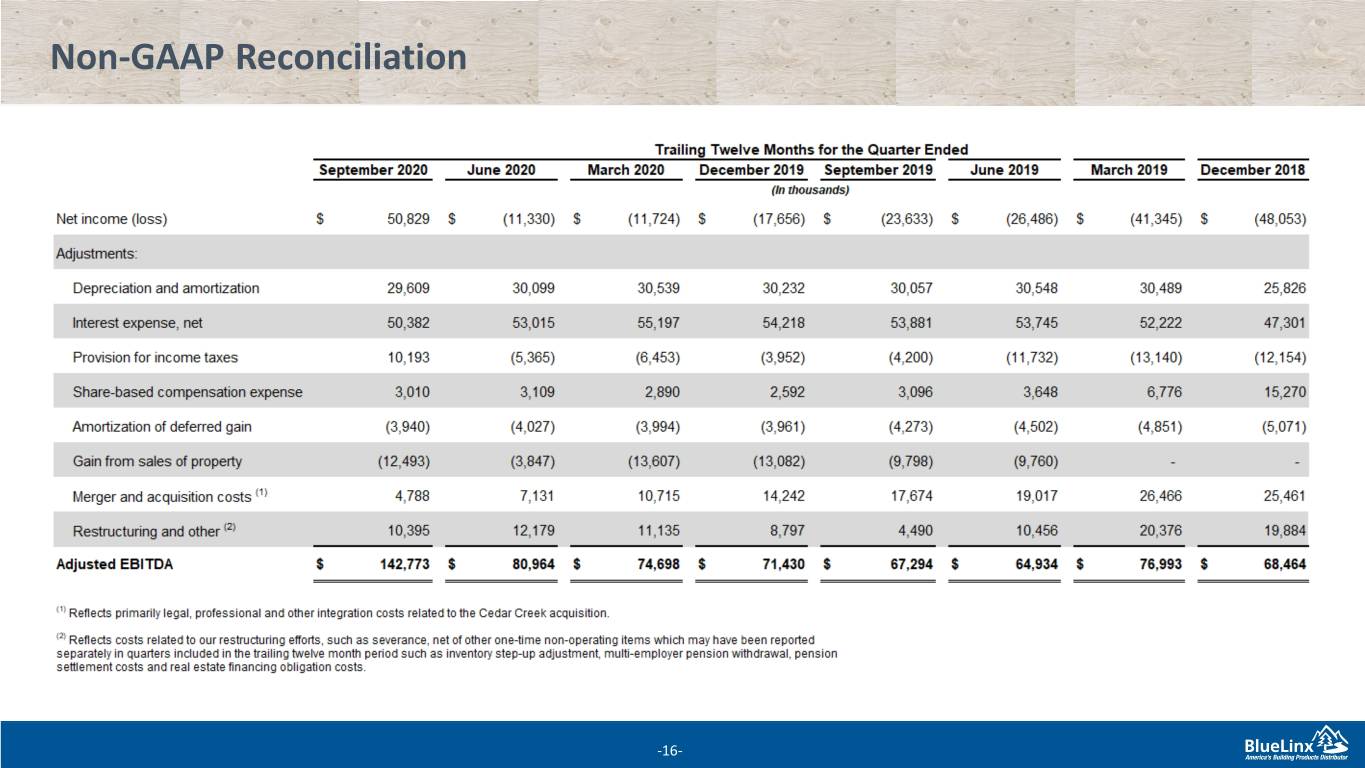
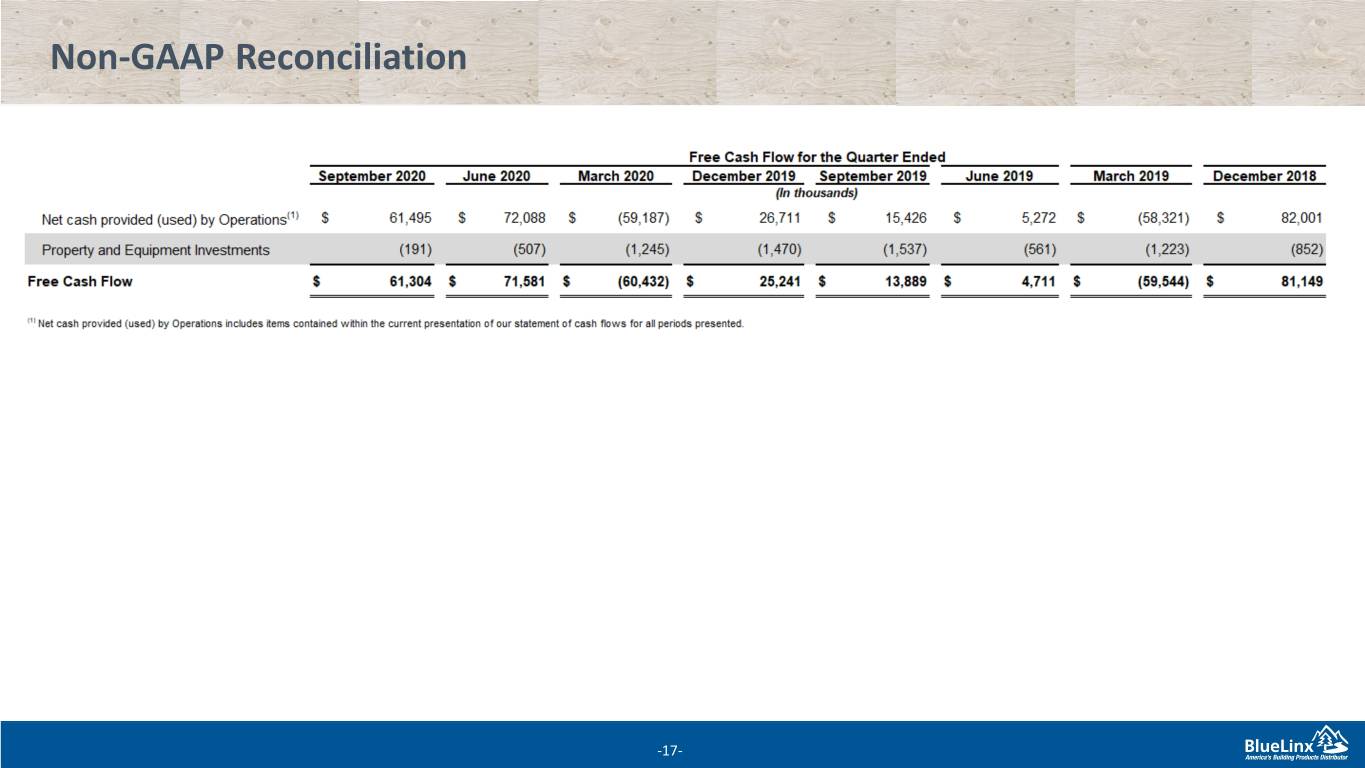
Adjusted EBITDA, a non-GAAP measure, was a record $81 million in the third quarter, compared to $19 million in the prior-year period. Cash provided by operating activities was $61 million in the third quarter, an increase of $46 million versus the prior-year period, primarily attributable to the year-over-year increase in Adjusted EBITDA.
Business Update
While the COVID-19 pandemic continued to impact many aspects of the Company’s business and operations in the 2020 third quarter, that impact was offset by the improving housing market and rapid escalation in wood-based commodity prices. BlueLinx worked to capitalize on these favorable trends by executing on its strategic priorities during the quarter:
•Sales performance. BlueLinx is focused on sales growth through several initiatives at the national, regional and local levels. The Company recently added two key leaders to run its national dealer and home center customer markets to better capitalize on the Company’s large geographic footprint. Additionally, the Company continued its strategic supplier partnerships to drive marquee brands while emphasizing high performing product categories. BlueLinx also continued its local entrepreneurial initiatives through a coordinated process to take advantage of local market strategic opportunities.
•Reduced bank debt and eliminated the Term Loan total net leverage ratio covenant. Total bank debt, which is comprised of amounts outstanding under the Company’s term loan and revolving credit facility, was reduced by $70 million in the third quarter 2020 to $321 million, and has been reduced by $181 million over the twelve months ended September 26, 2020. BlueLinx reduced outstanding bank debt through a combination of improved cash flow from operations and real estate sale leasebacks. In October, the Company paid down the term loan by an additional $14 million leaving the remaining balance at $44 million, eliminating the total net leverage ratio covenant.
•Improved operating efficiency. Recent cost reduction actions continued to support improved operating efficiency during the third quarter. Overall selling, general and administrative expense increased $3 million as compared to prior year due to higher variable incentive compensation and sales commissions of approximately $10 million, offset by reductions of overhead costs, primarily related to reduced labor. BlueLinx continues to focus on reducing non-essential costs throughout the organization, while selectively investing in resources to support strategic sales growth.
Market and Business Outlook
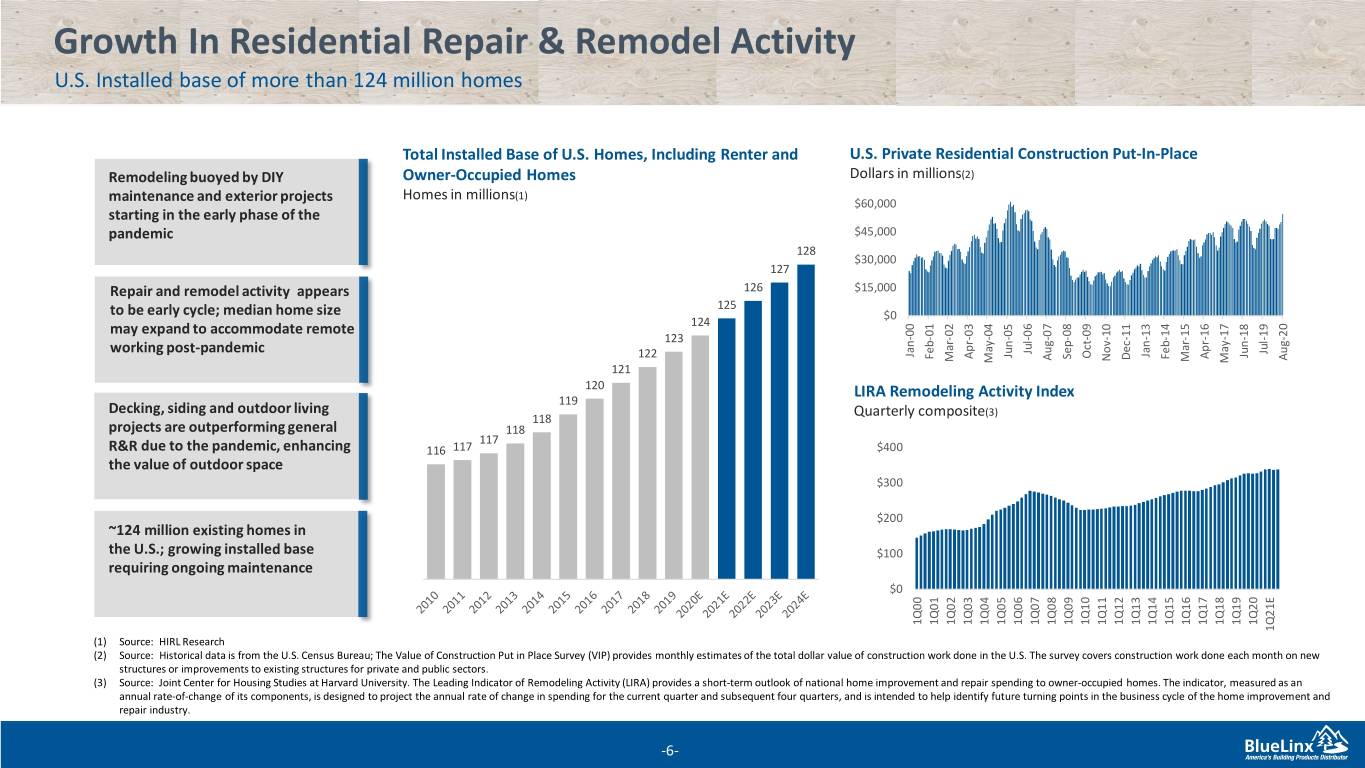
Conditions within the residential housing construction markets continued to improve during the third quarter. Within the new residential housing construction market, single-family housing starts, a key economic indicator with a high historical correlation to the Company’s business, increased by 17% in the third quarter over the prior year period, and have steadily increased each of the last four months on a year-over-year basis, with September hitting the highest level in over 13 years. Additionally, the Builders’ Confidence Index, according to the NAHB, was at an all-time high in October. Annualized single-family housing starts for 2020 are estimated to be approximately 43% below peak cyclical levels and below the 50-year average. Total U.S. monthly supply of homes also remained constrained, with housing inventory at the end of the third quarter at approximately 40% below the 20-year average. Within the residential remodel market, existing home sales and remodeling expenditures continued to increase during the third quarter versus prior-year levels. According to the NAHB, the Remodeling Market Index (RMI) increased 71% to 82 for third quarter 2020, when compared to the first quarter RMI of 48. The Company anticipates that the current apparent trend toward deurbanization, coupled with a historically low interest rate environment, should continue to benefit both new residential construction and remodel activity over the long-term.
While wood-based commodity prices have dropped dramatically since the end of the third quarter, the Company’s structural product gross margin for the month of October is anticipated to be above fourth quarter 2019 levels. The Company continues to work to manage commodity price volatility through the centralized management of purchasing and inventory levels, together with mitigation strategies to reduce the impact of commodity price declines including contract-based pricing and consigned inventory.
As of the date of this release, the rates of infection, hospitalization, and mortality associated with the COVID-19 virus continue to fluctuate, causing some state and local governmental authorities to consider new or reinstated mitigation measures, and we expect that existing and new mitigation measures have had, and will continue to have, a substantial impact on businesses around the world. While the residential building products industry has been resilient, the trajectory of the pandemic continues to
2
evolve rapidly, and we cannot predict the extent to which our financial condition, results of operations, or cash flows will ultimately be impacted. We are closely monitoring the impact of the pandemic on industry conditions, the progress of mitigation measures, and any pandemic-related restrictions that may have an impact on our business.
Third Quarter 2020 Conference Call Details
BlueLinx will host a conference call on October 29, 2020, at 10:00 a.m. Eastern Time, accompanied by a supporting slide presentation. Participants can access the live conference call via telephone at (877) 873-5864, using Conference ID # 3553476. Investors will also be able to access an archived audio recording of the conference call for one week following the live call by dialing (404) 537 3406, Conference ID # 3553476.
Investors can also listen to the live audio of the conference call and view the accompanying slide presentation by visiting the BlueLinx website, www.BlueLinxCo.com, and selecting the conference link on the Investor Relations page. After the conference call has concluded, an archived recording will be available on the BlueLinx website.
Use of Non-GAAP Measures
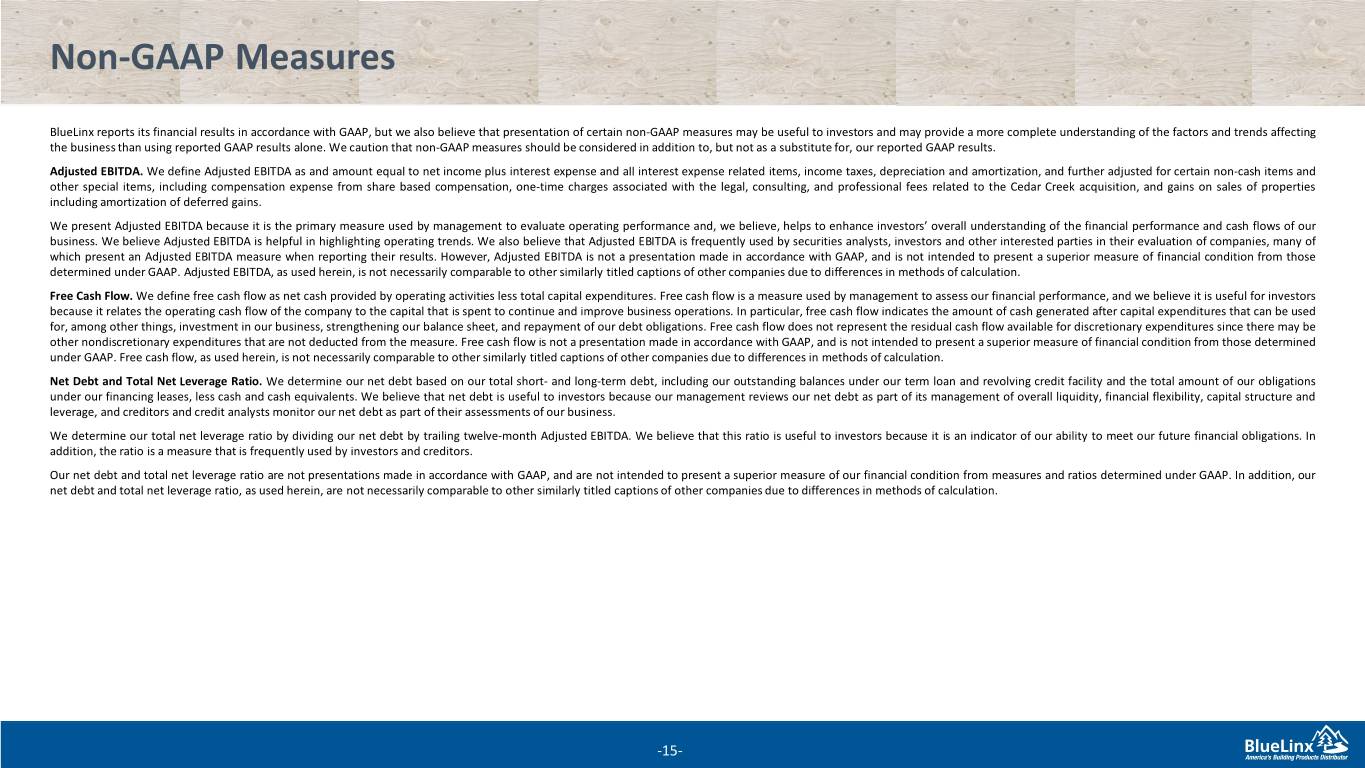
The Company reports its financial results in accordance with GAAP. The Company also believes that presentation of certain non-GAAP measures may be useful to investors and may provide a more complete understanding of the factors and trends affecting the business than using reported GAAP results alone. Any non-GAAP measures used herein are reconciled to their most directly comparable GAAP measures herein or in the financial tables accompanying this news release. The Company cautions that non-GAAP measures should be considered in addition to, but not as a substitute for, the Company’s reported GAAP results.
Adjusted EBITDA
BlueLinx defines Adjusted EBITDA as an amount equal to net income plus interest expense and all interest expense related items, income taxes, depreciation and amortization, and further adjusted for certain non-cash items and other special items, including compensation expense from share-based compensation, one-time charges associated with the legal and professional fees and integration costs related to the Cedar Creek acquisition, and gains on sales of properties including amortization of deferred gains.
The Company presents Adjusted EBITDA because it is a primary measure used by management to evaluate operating performance. Management believes this metric helps to enhance investors’ overall understanding of the financial performance and cash flows of the business. Management also believes Adjusted EBITDA is helpful in highlighting operating trends. Adjusted EBITDA is frequently used by securities analysts, investors and other interested parties in their evaluation of companies, many of which present an Adjusted EBITDA measure when reporting their results. However, Adjusted EBITDA is not a presentation made in accordance with GAAP, and is not intended to present a superior measure of our financial condition from those measures determined under GAAP. Adjusted EBITDA, as used herein, is not necessarily comparable to other similarly titled captions of other companies due to differences in methods of calculation. This non-GAAP measure is reconciled in the “Reconciliation of Non-GAAP Measurements” table later in this release.
ABOUT BLUELINX HOLDINGS
BlueLinx (NYSE: BXC) is a leading wholesale distributor of building and industrial products in the United States with over 50,000 branded and private-label SKUs, and a broad distribution footprint servicing 40 states. BlueLinx has a differentiated distribution platform, value-driven business model and extensive cache of products across the building products industry. Headquartered in Marietta, Georgia, BlueLinx has approximately 2,000 associates and distributes its comprehensive range of structural and specialty products to approximately 15,000 national, regional, and local dealers, as well as specialty distributors, national home centers, industrial, and manufactured housing customers. BlueLinx encourages investors to visit its website, www.BlueLinxCo.com, which is updated regularly with financial and other important information about BlueLinx.
CONTACT
Mary Moll
Investor Relations
(866) 671-5138
3
FORWARD-LOOKING STATEMENTS
This press release contains forward-looking statements. Forward-looking statements include, without limitation, any statement that predicts, forecasts, indicates or implies future results, performance, liquidity levels or achievements, and may contain the words “believe,” “anticipate,” “expect,” “estimate,” “intend,” “project,” “plan,” “will be,” “will likely continue,” “will likely result” or words or phrases of similar meaning. The forward-looking statements in this press release include statements about our strategic imperatives and priorities, and our focus thereon; our ability to capitalize on our geographic footprint to grow our national dealer and home center customer markets; our local entrepreneurial initiatives; our focus on reducing non-essential costs and our ability to, and the potential success of, investing in resources to support strategic sales growth; our market and business outlook, including the outlook for the residential housing construction markets, and trends in wood-based commodity prices; our product gross margin for the month of October; our efforts to manage commodity price volatility and the potential success thereof; and the COVID-19 pandemic and our response thereto, including statements about the potential trajectory of the pandemic and its potential effects.
Forward-looking statements in this press release are based on estimates and assumptions made by our management that, although believed by us to be reasonable, are inherently uncertain. Forward-looking statements involve risks and uncertainties that may cause our business, strategy, or actual results to differ materially from the forward-looking statements. These risks and uncertainties include those listed under the heading “Risk Factors” in Item 1A of our Annual Report on Form 10-K for the year ended December 28, 2019, and those discussed in our Quarterly Reports on Form 10-Q and in our periodic reports filed with the SEC from time to time. We operate in a changing environment in which new risks can emerge from time to time. It is not possible for management to predict all of these risks, nor can it assess the extent to which any factor, or a combination of factors, may cause our business, strategy, or actual results to differ materially from those contained in forward-looking statements. Factors that may cause these differences include, among other things: fluctuations in commodity prices; inventory management; changes in the prices, supply and/or demand for products that we distribute; adverse housing market conditions; levels of new residential housing starts and residential repair and remodeling activity; the COVID-19 pandemic and other contagious illness outbreaks and their potential effects on our industry, suppliers and supply chain, and customers, and our business, results of operations, cash flows, financial condition, and future prospects; our ability to integrate and realize anticipated synergies from acquisitions; loss of material customers, suppliers, or product lines in connection with acquisitions; operational disruption in connection with the integration of acquisitions; our indebtedness and its related limitations; sufficiency of cash flows and capital resources; our ability to monetize real estate assets; disintermediation by customers and suppliers; competitive industry pressures; industry consolidation; product shortages; loss of and dependence on key suppliers and manufacturers; import taxes and costs, including new or increased tariffs, anti-dumping duties, countervailing duties, or similar duties; our ability to successfully implement our strategic initiatives; fluctuations in operating results; sale-leaseback transactions and their effects; real estate leases; changes in interest rates; exposure to product liability claims; our ability to complete offerings under our shelf registration statement on favorable terms, or at all; changes in our product mix; petroleum prices; information technology security and business interruption risks; litigation and legal proceedings; natural disasters and unexpected events; activities of activist stockholders; labor and union matters; limits on net operating loss carryovers; pension plan assumptions and liabilities; risks related to our internal controls; retention of associates and key personnel; federal, state, local and other regulations, including environmental laws and regulations; and changes in accounting principles. Given these risks and uncertainties, we caution you not to place undue reliance on forward-looking statements. We expressly disclaim any obligation to update or revise any forward-looking statement as a result of new information, future events or otherwise, except as required by law.
4
BLUELINX HOLDINGS INC.
CONDENSED CONSOLIDATED STATEMENTS OF OPERATIONS
(Unaudited)
| Three Months Ended | Nine Months Ended | ||||||||||||||||||||||
| September 26, 2020 | September 28, 2019 | September 26, 2020 | September 28, 2019 | ||||||||||||||||||||
| (In thousands, except per share data) | |||||||||||||||||||||||
| Net sales | $ | 871,063 | $ | 678,665 | $ | 2,231,909 | $ | 2,023,814 | |||||||||||||||
| Cost of sales | 711,603 | 584,952 | 1,878,420 | 1,749,889 | |||||||||||||||||||
| Gross profit | 159,460 | 93,713 | 353,489 | 273,925 | |||||||||||||||||||
| Gross margin | 18.3 | % | 13.8 | % | 15.8 | % | 13.5 | % | |||||||||||||||
| Operating expenses: | |||||||||||||||||||||||
| Selling, general, and administrative | 78,992 | 76,095 | 222,306 | 215,330 | |||||||||||||||||||
| Depreciation and amortization | 7,087 | 7,577 | 21,785 | 22,408 | |||||||||||||||||||
| Gains from sales of property | (8,684) | (38) | (9,209) | (9,798) | |||||||||||||||||||
| Other operating expenses | 609 | 3,786 | 6,736 | 13,062 | |||||||||||||||||||
| Total operating expenses | 78,004 | 87,420 | 241,618 | 241,002 | |||||||||||||||||||
| Operating income | 81,456 | 6,293 | 111,871 | 32,923 | |||||||||||||||||||
| Non-operating expenses (income): | |||||||||||||||||||||||
| Interest expense, net | 10,776 | 13,409 | 36,691 | 40,527 | |||||||||||||||||||
| Other income, net | (238) | (317) | (58) | (212) | |||||||||||||||||||
| Income (loss) before provision for income taxes | 70,918 | (6,799) | 75,238 | (7,392) | |||||||||||||||||||
| Provision for income taxes | 15,802 | 244 | 14,214 | 69 | |||||||||||||||||||
| Net income (loss) | $ | 55,116 | $ | (7,043) | $ | 61,024 | $ | (7,461) | |||||||||||||||
| Basic income (loss) per share | $ | 5.83 | $ | (0.75) | $ | 6.49 | $ | (0.80) | |||||||||||||||
| Diluted income (loss) per share | $ | 5.72 | $ | (0.75) | $ | 6.48 | $ | (0.80) | |||||||||||||||
5
BLUELINX HOLDINGS INC.
CONDENSED CONSOLIDATED BALANCE SHEETS
(Unaudited)
| September 26, 2020 | December 28, 2019 | ||||||||||
| (In thousands, except share data) | |||||||||||
| ASSETS | |||||||||||
| Current assets: | |||||||||||
| Cash | $ | 10,154 | $ | 11,643 | |||||||
Receivables, less allowances of $4,158 and $3,236, respectively | 308,584 | 192,872 | |||||||||
| Inventories, net | 306,030 | 345,806 | |||||||||
| Other current assets | 23,395 | 27,718 | |||||||||
| Total current assets | 648,163 | 578,039 | |||||||||
| Property and equipment, at cost | 302,814 | 308,067 | |||||||||
| Accumulated depreciation | (119,960) | (112,299) | |||||||||
| Property and equipment, net | 182,854 | 195,768 | |||||||||
| Operating lease right-of-use assets | 53,124 | 54,408 | |||||||||
| Goodwill | 47,772 | 47,772 | |||||||||
| Intangible assets, net | 20,769 | 26,384 | |||||||||
| Deferred tax assets | 50,036 | 53,993 | |||||||||
| Other non-current assets | 20,516 | 15,061 | |||||||||
| Total assets | $ | 1,023,234 | $ | 971,425 | |||||||
| LIABILITIES AND STOCKHOLDERS' EQUITY (DEFICIT) | |||||||||||
| Current liabilities: | |||||||||||
| Accounts payable | $ | 178,948 | $ | 132,348 | |||||||
| Accrued compensation | 18,469 | 7,639 | |||||||||
Current maturities of long-term debt, net of debt issuance costs of $74 and $74, respectively | 1,535 | 2,176 | |||||||||
| Finance lease liabilities - short-term | 5,469 | 6,486 | |||||||||
| Operating lease liabilities - short-term | 6,926 | 7,317 | |||||||||
| Real estate deferred gains - short-term | 4,040 | 3,935 | |||||||||
| Other current liabilities | 18,668 | 11,222 | |||||||||
| Total current liabilities | 234,055 | 171,123 | |||||||||
| Non-current liabilities: | |||||||||||
Long-term debt, net of debt issuance costs of $9,930 and $12,481, respectively | 309,249 | 458,439 | |||||||||
| Finance lease liabilities - long-term | 267,753 | 191,525 | |||||||||
| Operating lease liabilities - long-term | 45,883 | 47,091 | |||||||||
| Real estate deferred gains - long-term | 78,998 | 81,886 | |||||||||
| Pension benefit obligation | 21,441 | 23,420 | |||||||||
| Other non-current liabilities | 27,642 | 24,024 | |||||||||
| Total liabilities | 985,021 | 997,508 | |||||||||
| Commitments and Contingencies | |||||||||||
| STOCKHOLDERS' EQUITY (DEFICIT): | |||||||||||
Common Stock, $0.01 par value, 20,000,000 shares authorized, 9,461,540 and 9,365,768 outstanding on September 26, 2020 and December 28, 2019, respectively | 95 | 94 | |||||||||
| Additional paid-in capital | 263,643 | 260,974 | |||||||||
| Accumulated other comprehensive loss | (33,961) | (34,563) | |||||||||
| Accumulated stockholders’ deficit | (191,564) | (252,588) | |||||||||
| Total stockholders’ equity (deficit) | 38,213 | (26,083) | |||||||||
| Total liabilities and stockholders’ equity (deficit) | $ | 1,023,234 | $ | 971,425 | |||||||
6
BLUELINX HOLDINGS INC.
CONDENSED CONSOLIDATED STATEMENTS OF CASH FLOWS
(Unaudited)
| Three Months Ended | Nine Months Ended | ||||||||||||||||||||||
| September 26, 2020 | September 28, 2019 | September 26, 2020 | September 28, 2019 | ||||||||||||||||||||
| (In thousands) | |||||||||||||||||||||||
| Cash flows from operating activities: | |||||||||||||||||||||||
| Net income (loss) | $ | 55,116 | $ | (7,043) | $ | 61,024 | $ | (7,461) | |||||||||||||||
| Adjustments to reconcile net income (loss) to cash provided by (used in) operations: | |||||||||||||||||||||||
| Provision for income taxes | 15,802 | 244 | 14,214 | 69 | |||||||||||||||||||
| Depreciation and amortization | 7,087 | 7,577 | 21,785 | 22,408 | |||||||||||||||||||
| Amortization of debt issuance costs | 985 | 851 | 2,888 | 2,465 | |||||||||||||||||||
| Gains from sales of property | (8,684) | (38) | (9,209) | (9,798) | |||||||||||||||||||
| Amortization of deferred gain | (984) | (1,071) | (2,951) | (2,972) | |||||||||||||||||||
| Share-based compensation | 1,057 | 1,157 | 2,915 | 2,498 | |||||||||||||||||||
| Changes in operating assets and liabilities: | |||||||||||||||||||||||
| Accounts receivable | (43,942) | 18,137 | (115,712) | (35,471) | |||||||||||||||||||
| Inventories | 7,949 | (3,738) | 39,776 | (20,538) | |||||||||||||||||||
| Accounts payable | 20,028 | 4,516 | 46,600 | 30,188 | |||||||||||||||||||
| Prepaid and other current assets | 1,820 | 3 | (1,380) | (8,075) | |||||||||||||||||||
| Other assets and liabilities | 5,261 | (5,169) | 14,446 | (10,936) | |||||||||||||||||||
| Net cash provided by (used in) operating activities | 61,495 | 15,426 | 74,396 | (37,623) | |||||||||||||||||||
| Cash flows from investing activities: | |||||||||||||||||||||||
| Acquisition of business, net of cash acquired | — | — | — | 6,009 | |||||||||||||||||||
| Proceeds from sale of assets | 10,640 | 2,941 | 10,742 | 13,699 | |||||||||||||||||||
| Property and equipment investments | (191) | (1,537) | (1,943) | (3,321) | |||||||||||||||||||
| Net cash provided by investing activities | 10,449 | 1,404 | 8,799 | 16,387 | |||||||||||||||||||
| Cash flows from financing activities: | |||||||||||||||||||||||
| Borrowings on revolving credit facilities | 191,464 | 146,860 | 541,700 | 512,379 | |||||||||||||||||||
| Repayments on revolving credit facilities | (250,712) | (161,159) | (605,221) | (490,842) | |||||||||||||||||||
| Repayments on term loan | (11,009) | — | (88,861) | (31,899) | |||||||||||||||||||
| Proceeds from real estate financing transactions | — | (97) | 78,263 | 44,725 | |||||||||||||||||||
| Debt financing costs | (318) | — | (2,983) | (2,359) | |||||||||||||||||||
| Repurchase of shares to satisfy employee tax withholdings | (1) | — | (255) | (208) | |||||||||||||||||||
| Principal payments on finance lease liabilities | (2,744) | (2,249) | (7,327) | (6,652) | |||||||||||||||||||
| Net cash (used in) provided by financing activities | (73,320) | (16,645) | (84,684) | 25,144 | |||||||||||||||||||
| Net change in cash | (1,376) | 185 | (1,489) | 3,908 | |||||||||||||||||||
| Cash at beginning of period | 11,530 | 12,662 | 11,643 | 8,939 | |||||||||||||||||||
| Cash at end of period | $ | 10,154 | $ | 12,847 | $ | 10,154 | $ | 12,847 | |||||||||||||||
7
BLUELINX HOLDINGS INC.
RECONCILIATION OF NON-GAAP MEASUREMENTS
(Unaudited)
The following schedule reconciles net income (loss) to Adjusted EBITDA:
| Quarter Ended | Nine Months Ended | ||||||||||||||||||||||
| September 26, 2020 | September 28, 2019 | September 26, 2020 | September 28, 2019 | ||||||||||||||||||||
| (In thousands) | |||||||||||||||||||||||
| Net income (loss) | $ | 55,116 | $ | (7,043) | $ | 61,024 | $ | (7,461) | |||||||||||||||
| Adjustments: | |||||||||||||||||||||||
| Depreciation and amortization | 7,087 | 7,577 | 21,785 | 22,408 | |||||||||||||||||||
| Interest expense, net | 10,776 | 13,409 | 36,691 | 40,527 | |||||||||||||||||||
| Provision for income taxes | 15,802 | 244 | 14,214 | 69 | |||||||||||||||||||
| Share-based compensation expense | 1,057 | 1,156 | 2,915 | 2,498 | |||||||||||||||||||
| Amortization of deferred gain | (984) | (1,071) | (2,951) | (2,972) | |||||||||||||||||||
Gain from sales of property (1) | (8,684) | (38) | (9,209) | (9,798) | |||||||||||||||||||
Multi-employer pension withdrawal (1) | — | 954 | — | 954 | |||||||||||||||||||
Merger and acquisition costs (1) (2) | 139 | 2,482 | 1,818 | 11,272 | |||||||||||||||||||
Restructuring and other (1) (3) | 472 | 1,302 | 5,562 | 3,015 | |||||||||||||||||||
| Adjusted EBITDA | $ | 80,781 | $ | 18,972 | $ | 131,849 | $ | 60,512 | |||||||||||||||
(1) Reflects non-recurring items of approximately $8 million in benefit to the current quarter and approximately $5 million of non-beneficial items to the same quarterly period of the prior year
(2) Reflects primarily legal, professional and other integration costs related to the Cedar Creek acquisition
(3) Reflects costs related to our restructuring efforts, such as severance, net of other one-time non-operating items
8