bxc-20220503
false000130178700013017872022-05-032022-05-03


UNITED STATES
SECURITIES AND EXCHANGE COMMISSION
Washington, D.C. 20549
 
FORM 8-K
 
CURRENT REPORT
Pursuant to Section 13 or 15(d) of
The Securities Exchange Act of 1934
 
Date of Report (Date of earliest event reported): May 3, 2022
 
BlueLinx Holdings Inc.
(Exact name of registrant specified in its charter)
 
Delaware001-3238377-0627356
(State or other(Commission(I.R.S. Employer
jurisdiction of
incorporation)
File Number)Identification No.)
  
1950 Spectrum Circle, Suite 300, Marietta, GA
30067
(Address of principal executive offices)(Zip Code)

 
Registrant's telephone number, including area code: (770) 953-7000
 _________________________________________________
(Former name or former address, if changed since last report.)
 
Check the appropriate box below if the Form 8-K filing is intended to simultaneously satisfy the filing obligation of the registrant under any of the following provisions (see General Instruction A.2. below):
Written communications pursuant to Rule 425 under the Securities Act (17 CFR 230.425)
Soliciting material pursuant to Rule 14a-12 under the Exchange Act (17 CFR 240.14a-12)
Pre-commencement communications pursuant to Rule 14d-2(b) under the Exchange Act (17 CFR 240.14d-2(b))
Pre-commencement communications pursuant to Rule 13e-4(c) under the Exchange Act (17 CFR 240.13e-4(c))
Securities registered pursuant to Section 12(b) of the Act:
Title of each classTrading Symbol(s)Name of each exchange on which registered
Common Stock, par value $0.01 per shareBXCNew York Stock Exchange


Indicate by check mark whether the registrant is an emerging growth company as defined in Rule 405 under the Securities Act of 1933 (§230.405 of this chapter) or Rule 12b-2 of the Securities Exchange Act of 1934 (§240.12b-2 of this chapter).
Emerging growth company

If an emerging growth company, indicate by check mark if the registrant has elected not to use the extended transition period for complying with any new or revised financial accounting standards provided pursuant to Section 13(a) of the Exchange Act.


Item 2.02    Results of Operations and Financial Condition         

On May 3, 2022, BlueLinx Holdings Inc. ("BlueLinx" or "the Company”) issued a press release announcing its financial results for the fiscal first quarter ended April 2, 2022. A copy of BlueLinx's press release is furnished as Exhibit 99.1 hereto.

On May 4, 2022, as previously announced, BlueLinx will hold a teleconference and audio webcast to discuss its financial results from the fiscal first quarter ended April 2, 2022. A copy of supplementary materials that will be referred to in the teleconference and webcast, and which will be posted to the Company's website, is furnished as Exhibit 99.2 hereto.

The information included in this Item 2.02, as well as Exhibits 99.1 and 99.2, shall not be deemed "filed" for purposes of Section 18 of the Securities Exchange Act of 1934, nor shall it be deemed incorporated by reference in any filing under the Securities Act of 1933.


Item 9.01     Financial Statements and Exhibits

(d)        Exhibits:

The following exhibits are attached with this Current Report on Form 8-K:
Exhibit No. Exhibit Description
 
104Cover Page Interactive Data File (embedded within the Inline XBRL document)

SIGNATURE
 
Pursuant to the requirements of the Securities Exchange Act of 1934, the Registrant has duly caused this report to be signed on its behalf by the undersigned hereunto duly authorized.
   
  BlueLinx Holdings Inc.
  (Registrant)
   
Dated: May 3, 2022By:/s/ Kelly C. Janzen
  Kelly C. Janzen
  Senior Vice President and Chief Financial Officer


Exhibit 99.1
bl2a36a.jpg

BlueLinx Announces Record First Quarter 2022 Profitability


MARIETTA, GA, May 3, 2022 - BlueLinx Holdings Inc. (NYSE:BXC) (“the company”), a leading U.S. wholesale distributor of building products, announced today results for the first quarter 2022.

FIRST QUARTER 2022 HIGHLIGHTS
(all comparisons are versus the prior-year period)

Net sales increased $277 million, or 27%, to $1.3 billion
Gross margin of 22.3%, up 470 basis points
Diluted earnings per share of $13.19, an increase of 110%
Adjusted EBITDA of $202 million, up $96 million, or 90%
Net Leverage of 0.9x and available liquidity of $421 million
Increased share repurchase authorization to $100 million, including $60 million accelerated share repurchase

“I’m extremely proud of the BlueLinx team and our continued strong execution which contributed to record first quarter profitability. Once again, we demonstrated the ability to capitalize on continued robust demand for building products while navigating on-going supply constraints and volatility in wood-based commodity prices. Net sales grew by approximately 27% year-over-year, and we delivered adjusted EBITDA of $202 million and adjusted EBITDA margin of over 15%, both all-time highs on a quarterly basis for BlueLinx.”

“Notably, our growth was led by specialty products where net sales grew 36% and gross margins improved 470 basis points to 24%. Nearly two-thirds of our gross profit was generated from sales of specialty products, consistent with our strategy to aggressively grow that part of our business.”

“We currently believe near-term fundamentals for the U.S. housing industry are healthy despite the recent rise in mortgage rates and broad-based inflation. Specifically, we believe high levels of home equity, housing turnover and aging housing stock will continue to support growth in repair and remodel activity and the low supply of available homes will continue to drive investment in both existing and new homes.”

“Following a detailed review of our multi-year capital allocation plans, our Board of Directors has increased our share repurchase authorization to $100 million, including a $60 million accelerated share repurchase agreement that will begin executing this week. These actions demonstrate confidence in our long-term growth strategy, continued improvement in our execution and commitment to delivering shareholder value through disciplined capital allocation. We remain focused on driving sustained, profitable growth and we are excited about our future,” concluded Dwight Gibson, President and CEO of BlueLinx.

Details of the company’s increased share repurchase authorization and accelerated share repurchase agreement can be found in a separate news release also issued today.

FIRST QUARTER 2022 FINANCIAL PERFORMANCE

In the first quarter, net sales were $1.3 billion, an increase of $277 million, or 27% year-over-year. Gross profit was $291 million, an increase of $111 million, or 61% over the prior year period and gross margin expanded 470 basis points to 22.3%. Selling, general and administrative (“SG&A”) expenses increased $16 million, or 21%, year-over-year to $91 million, which is 7% of net sales and flat to the prior year. The increase in SG&A was due primarily to higher variable incentive compensation and, to a lesser extent, increased delivery and logistics costs. Interest expense decreased $5 million, or 30%, to $11 million due mainly to the write off of debt issuance costs related to the extinguishment of the company’s former Term Loan Facility in the prior year period. Net income was $133 million, or $13.19 per diluted share, versus $62 million, or $6.28 per diluted share, in
1


the prior year period. Adjusted EBITDA was $202 million, or 15.5% of net sales, as compared to $107 million, or 10.4% of net sales in Q1 2021.

The increase in net sales and profitability versus the prior year period was driven by continued robust demand for building products amid on-going supply constraints, increased wood-based commodity prices and improved operating performance. Notably, the growth in net sales and gross profit was primarily attributable to specialty products, consistent with the company’s strategy to increase the percentage of net sales in specialty products categories.

Net sales of specialty products, which includes products such as engineered wood, siding, moulding and millwork, outdoor living, specialty lumber and industrial products, increased $205 million, or 36%, to $768 million in the first quarter. Gross profit from specialty product sales was $184 million, an increase of $76 million, or 70%, year-over-year. Gross margin on specialty product sales was 24.0%, an increase of 470 basis points over the prior year period. The net sales growth and improved profitability was primarily driven by continued strong demand for specialty building products in both new construction and repair and remodel projects, on-going supply constraints and strategic pricing actions.

Net sales of structural products, which includes products such as lumber, plywood, oriented strand board, rebar, and remesh, increased $72 million, or 16%, to $534 million in the first quarter due to continued strong demand for building products and increased wood-based commodity prices. Gross profit from structural product sales was $107 million, an increase of $35 million, or 49%, year-over-year. Gross margin on structural product sales increased 450 basis points to 20.0% reflecting increased pricing of wood-based commodities during the period, as well as our disciplined, lean approach to managing structural product inventory.

Net cash generated from operating activities was $2 million in the first quarter 2022 as compared to a net usage of $25 million in the prior year period. The increase in cash generated from operating activities was driven by the increase in net income, partially offset by increases in accounts receivable and inventory. During the period, the net working capital investment was $181 million, of which $157 million related to accounts receivable with the remaining related to the net impact of increasing inventory, primarily specialty products, partially offset by an increase in accounts payable. The net working capital investment in the first quarter reflects strong demand in the U.S. home building industry and also reflects the impact of increased pricing for sales of wood-based commodity products.

Cash capital investments were $2.5 million, primarily related to investments in our distribution branches and, to a lesser extent, upgrading the company’s fleet of rolling stock. Free cash flow was ($0.3) million in the first quarter of 2022 as compared to ($26) million in the prior year period.

SECOND QUARTER 2022 UPDATE

Through the first four weeks of the second quarter 2022, specialty product margins were in the range of 23% to 24% and structural product margins were in the high single digits, reflecting sequential declines in the average price of wood-based commodities. Volumes across both specialty and structural product categories were generally consistent with first quarter levels.

The majority of the company’s profitability and cash is generated from sales of specialty building products and the company expects demand for specialty building products to remain relatively stable in the coming months. It also expects to continue to efficiently manage volatility in wood-based commodities, a capability the company has demonstrated over the past five quarters.

CONFERENCE CALL INFORMATION

BlueLinx will host a conference call on May 4, 2022, at 10:00 a.m. Eastern Time, accompanied by a supporting slide presentation.

A webcast of the conference call and accompanying presentation materials will be available in the Investor Relations section of the BlueLinx website at http://bluelinxco.com/webcast-presentations, and a replay of the webcast will be available at the same site shortly after the webcast is complete.

To participate in the live teleconference:

Domestic Live: 1-877-407-4018
Passcode: 13728794
2


To listen to a replay of the teleconference, which will be available through May 18, 2022:

Domestic Replay: 1-844-512-2921
Passcode: 13728794

ABOUT BLUELINX

BlueLinx (NYSE: BXC) is a leading U.S. wholesale distributor of residential and commercial building products with both branded and private-label SKUs across product categories such as lumber, panels, engineered wood, siding, millwork, metal building products, and other construction materials. With a strong market position, broad geographic coverage footprint servicing over 40 states, and the strength of a locally focused sales force, we distribute our comprehensive range of products to approximately 15,000 national, regional, and local dealers, specialty distributors, national home centers, and manufactured housing customers. BlueLinx provides a wide range of value-added services and solutions to our customers and suppliers. We are headquartered in Georgia, with executive offices located at 1950 Spectrum Circle, Marietta, Georgia, and we operate our distribution business through a broad network of distribution centers. BlueLinx encourages investors to visit its website, www.BlueLinxCo.com, which is updated regularly with financial and other important information about BlueLinx.

INVESTOR & MEDIA CONTACTS

Ryan Taylor, VP Investor Relations & Treasury
BlueLinx Holdings Inc.
[email protected]

Seth Freeman, VP Marketing & Communications
BlueLinx Holdings Inc.
[email protected]

NON-GAAP MEASURES

The Company reports its financial results in accordance with GAAP. The Company also believes that presentation of certain non-GAAP measures may be useful to investors and may provide a more complete understanding of the factors and trends affecting the business than using reported GAAP results alone. Any non-GAAP measures used herein are reconciled to their most directly comparable GAAP measures herein or in the financial tables accompanying this news release. The Company cautions that non-GAAP measures should be considered in addition to, but not as a substitute for, the Company’s reported GAAP results.

Adjusted EBITDA and Adjusted EBITDA Margin. BlueLinx defines Adjusted EBITDA as an amount equal to net income (loss) plus interest expense and all interest expense related items, income taxes, depreciation and amortization, and further adjusted for certain non-cash items and other special items, including compensation expense from share based compensation, one-time charges associated with the legal, consulting, and professional fees related to our merger and acquisition activities, gains or losses on sales of properties, amortization of deferred gains on real estate, and expense associated with our restructuring activities, such as severance, in addition to other significant and/or one-time, nonrecurring, non-operating items

The Company presents Adjusted EBITDA because it is a primary measure used by management to evaluate operating performance. Management believes this metric helps to enhance investors’ overall understanding of the financial performance and cash flows of the business. Management also believes Adjusted EBITDA is helpful in highlighting operating trends. Adjusted EBITDA is frequently used by securities analysts, investors, and other interested parties in their evaluation of companies, many of which present an Adjusted EBITDA measure when reporting their results.

We determine our Adjusted EBITDA Margin, which we sometimes refer to as our Adjusted EBITDA as a percentage of net sales, by dividing our Adjusted EBITDA for the applicable period by our net sales for the applicable period. We believe that this ratio is useful to investors because it more clearly defines the quality of earnings and operational efficiency of translating sales to profitability.

Our Adjusted EBITDA and Adjusted EBITDA Margin are not presentations made in accordance with GAAP and are not intended to present superior measures of our financial condition from those measures determined under GAAP. Adjusted EBITDA and Adjusted EBITDA Margin, as used herein, are not necessarily comparable to other similarly titled captions of
3


other companies due to differences in methods of calculation. These non-GAAP measures are reconciled in the “Reconciliation of Non-GAAP Measurements” table later in this release.

Free Cash Flow. BlueLinx defines free cash flow as net cash provided by operating activities less total capital expenditures. Free cash flow is a measure used by management to assess our financial performance, and we believe it is useful for investors because it relates the operating cash flow of the company to the capital that is spent to continue and improve business operations. In particular, free cash flow indicates the amount of cash generated after capital expenditures that can be used for, among other things, investment in our business, strengthening our balance sheet, and repayment of our debt obligations. Free cash flow does not represent the residual cash flow available for discretionary expenditures since there may be other nondiscretionary expenditures that are not deducted from the measure. Free cash flow is not a presentation made in accordance with GAAP and is not intended to present a superior measure of financial condition from those determined under GAAP. Free cash flow, as used herein, is not necessarily comparable to other similarly titled captions of other companies due to differences in methods of calculation. This non-GAAP measure is reconciled in the “Reconciliation of Non-GAAP Measurements” table later in this release.

Net Debt and Net Leverage Ratio. BlueLinx calculates net debt as its total short- and long-term debt, including outstanding balances under our term loan and revolving credit facility and the total amount of its obligations under financing leases, less cash and cash equivalents. We believe that net debt is useful to investors because our management reviews our net debt as part of its management of overall liquidity, financial flexibility, capital structure and leverage, and creditors and credit analysts monitor our net debt as part of their assessments of our business.

We determine our overall net leverage ratio by dividing our net debt by trailing twelve-month Adjusted EBITDA. We believe that this ratio is useful to investors because it is an indicator of our ability to meet our future financial obligations. In addition, the ratio is a measure that is frequently used by investors and creditors.

Our net debt and overall net leverage ratio are not presentations made in accordance with GAAP and are not intended to present a superior measure of our financial condition from measures and ratios determined under GAAP. In addition, our net debt and overall net leverage ratio, as used herein, are not necessarily comparable to other similarly titled captions of other companies due to differences in methods of calculation. This non-GAAP measure is reconciled in the “Reconciliation of Non-GAAP Measurements” table later in this release.

FORWARD-LOOKING STATEMENTS

This press release contains forward-looking statements. Forward-looking statements include, without limitation, any statement that predicts, forecasts, indicates or implies future results, performance, liquidity levels or achievements, and may contain the words “believe,” “anticipate,” “expect,” “estimate,” “intend,” “project,” “plan,” “will be,” “will likely continue,” “will likely result” or words or phrases of similar meaning.

The forward-looking statements in this press release include statements about our confidence in the company’s long-term growth strategy; our ability to capitalize on strong demand amid supply chain constraints and wood-based commodity price volatility; our ability to capitalize on supplier-led price increases and our value-added services; our areas of focus and management initiatives; the demand outlook for construction materials and expectations regarding new home construction, repair and remodel activity and continued investment in existing and new homes; our positioning for long-term value creation; our efforts and ability to generate profitable growth; our ability to increase net sales in specialty product categories; our ability to generate profits and cash from sales of specialty products; our multi-year capital allocation plans; our ability to manage volatility in wood-based commodities; our improvement in execution; our efforts and ability to maintain a disciplined capital structure and capital allocation strategy; our ability to maintain a strong balance sheet; our ability to focus on operating improvement initiatives and commercial excellence; constraints, volatility or disruptions in the capital markets or other factors affecting the amount and timing of share repurchases; our ability to successfully execute the ASR; the number of shares that will be delivered to the Company under the ASR; whether or not the Company will continue, and the timing of, any open market repurchases.

Forward-looking statements in this press release are based on estimates and assumptions made by our management that, although believed by us to be reasonable, are inherently uncertain. Forward-looking statements involve risks and uncertainties that may cause our business, strategy, or actual results to differ materially from the forward-looking statements. These risks and uncertainties include those discussed in greater detail in our filings with the Securities and Exchange Commission. We operate in a changing environment in which new risks can emerge from time to time. It is not possible for management to predict all of these risks, nor can it assess the extent to which any factor, or a combination of factors, may cause our business, strategy, or actual results to differ materially from those contained in forward-looking statements. Factors that may cause these differences
4


include, among other things: pricing and product cost variability; volumes of product sold; competition; changes in the supply and/or demand for products that we distribute; the cyclical nature of the industry in which we operate; housing market conditions; consolidation among competitors, suppliers, and customers; disintermediation risk; loss of products or key suppliers and manufacturers; our dependence on international suppliers and manufacturers for certain products; potential acquisitions and the integration and completion of such acquisitions; business disruptions; effective inventory management relative to our sales volume or the prices of the products we produce; information technology security risks and business interruption risks; the ability to attract, train, and retain highly qualified associates and other key personnel while controlling related labor costs; exposure to product liability and other claims and legal proceedings related to our business and the products we distribute; natural disasters, catastrophes, fire, or other unexpected events; successful implementation of our strategy; wage increases or work stoppages by our union employees; costs imposed by federal, state, local, and other regulations; compliance costs associated with federal, state, and local environmental protection laws; the COVID-19 pandemic and other contagious illness outbreaks and their potential effects on our industry; regulations concerning mandatory COVID-19 vaccines; fluctuations in our operating results; our level of indebtedness and our ability to incur additional debt to fund future needs; the covenants of the instruments governing our indebtedness limiting the discretion of our management in operating the business; variable interest rate risk under certain indebtedness; the fact that we have consummated certain sale leaseback transactions with resulting long-term non-cancelable leases, many of which are or will be finance leases; the fact that we lease many of our distribution centers, and we would still be obligated under these leases even if we close a leased distribution center; inability to raise funds necessary to finance a required repurchase of our senior secured notes; inability to successfully execute the ASR; a lowering or withdrawal of debt ratings; changes in our product mix; increases in petroleum prices; shareholder activism; changes in insurance-related deductible/retention reserves based on actual loss experience; the possibility that the value of our deferred tax assets could become impaired; changes in our expected annual effective tax rate could be volatile; changes in actuarial assumptions for our pension plan; the costs and liabilities related to our participation in multi-employer pension plans could increase; the risk that our cash flows and capital resources may be insufficient to service our existing or future indebtedness; the possibility that we could be the subject of securities class action litigation due to stock price volatility; activities of activist shareholders; indebtedness terms that limit our ability to pay dividends on common stock; and changes in, or interpretation of, accounting principles.

Given these risks and uncertainties, we caution you not to place undue reliance on forward-looking statements. We expressly disclaim any obligation to update or revise any forward-looking statement as a result of new information, future events or otherwise, except as required by law.


5


BLUELINX HOLDINGS INC.
CONDENSED CONSOLIDATED STATEMENTS OF OPERATIONS
(Unaudited)

Three Months Ended
 April 2, 2022April 3, 2021
(In thousands, except per share data)
Net sales$1,302,305 $1,025,469 
Cost of sales1,011,254 845,077 
Gross profit291,051 180,392 
Gross margin22.3 %17.6 %
Operating expenses (income):  
Selling, general, and administrative91,289 75,560 
Depreciation and amortization6,746 7,465 
Amortization of deferred gains on real estate(984)(984)
Gains from sales of property— (1,287)
Other operating expenses838 112 
Total operating expenses97,889 80,866 
Operating income193,162 99,526 
Non-operating expenses (income):  
Interest expense, net11,293 16,234 
Other expense (income), net1,138 (314)
Income before provision for income taxes180,731 83,606 
Provision for income taxes47,322 21,746 
Net income$133,409 $61,860 
Basic income per share$13.72 $6.53 
Diluted income per share$13.19 $6.28 


6


BLUELINX HOLDINGS INC.
CONDENSED CONSOLIDATED BALANCE SHEETS
(Unaudited)
 April 2, 2022January 1, 2022
(In thousands, except share data)
ASSETS
Current assets:  
Cash and cash equivalents$74,438 $85,203 
Accounts receivable, less allowances of $4,965 and $4,024, respectively
497,056 339,637 
Inventories, net562,555 488,458 
Other current assets32,470 31,869 
Total current assets1,166,519 945,167 
Property and equipment, at cost319,732 318,253 
Accumulated depreciation(141,768)(137,099)
Property and equipment, net177,964 181,154 
Operating lease right-of-use assets47,330 49,568 
Goodwill47,772 47,772 
Intangible assets, net12,519 13,603 
Deferred tax assets62,279 60,285 
Other non-current assets19,822 19,905 
Total assets$1,534,205 $1,317,454 
LIABILITIES AND STOCKHOLDERS' EQUITY
Current liabilities:  
Accounts payable$230,072 $180,000 
Accrued compensation13,714 22,363 
Taxes payable53,195 6,138 
Finance lease liabilities - short-term7,264 7,864 
Operating lease liabilities - short-term5,723 5,145 
Real estate deferred gains - short-term3,935 3,934 
Other current liabilities22,503 18,347 
Total current liabilities336,406 243,791 
Non-current liabilities:  
Long-term debt, net of debt issuance costs of $4,565 and $4,701, respectively
291,534 291,271 
Finance lease liabilities - long-term264,676 266,853 
Operating lease liabilities - long-term41,698 44,526 
Real estate deferred gains - long-term73,255 74,206 
Pension benefit obligation10,813 11,605 
Other non-current liabilities23,647 21,953 
Total liabilities1,042,029 954,205 
Commitments and contingencies
STOCKHOLDERS' EQUITY:
Common Stock, $0.01 par value, 20,000,000 shares authorized,
     9,651,000 and 9,725,760 outstanding on April 2, 2022, and January 1, 2022, respectively
96 97 
Additional paid-in capital263,428 268,085 
Accumulated other comprehensive loss(29,184)(29,360)
Accumulated stockholders’ equity257,836 124,427 
Total stockholders’ equity492,176 363,249 
Total liabilities and stockholders’ equity$1,534,205 $1,317,454 
7


BLUELINX HOLDINGS INC.
CONDENSED CONSOLIDATED STATEMENTS OF CASH FLOWS
(Unaudited)
Three Months Ended
April 2, 2022April 3, 2021
 (In thousands)
Cash flows from operating activities:
Net income$133,409 $61,860 
Adjustments to reconcile net income to cash provided by (used in) operations:
Depreciation and amortization6,746 7,465 
Amortization of debt discount and issuance costs263 603 
Adjustments to debt issuance costs associated with term loan— 5,791 
Gains from sales of property— (1,287)
Deferred income tax(1,994)(3,896)
Amortization of deferred gains from real estate(984)(984)
Share-based compensation2,162 1,410 
Changes in operating assets and liabilities:
Accounts receivable(157,419)(125,172)
Inventories(74,097)(34,315)
Accounts payable50,072 53,812 
Taxes payable47,057 25,799 
Other current assets(601)(448)
Other assets and liabilities(2,377)(15,246)
Net cash provided by (used in) operating activities2,237 (24,608)
Cash flows from investing activities:
Proceeds from sale of assets49 1,810 
Property and equipment investments(2,509)(1,122)
Net cash (used in) provided by investing activities(2,460)688 
Cash flows from financing activities:
Borrowings on revolving credit facilities— 262,210 
Repayments on revolving credit facilities— (191,943)
Repayments on term loan— (43,204)
Common stock repurchase and retirement(6,427)— 
Debt financing costs— (861)
Repurchase of shares to satisfy employee tax withholdings(393)(56)
Principal payments on finance lease liabilities(3,722)(2,129)
Net cash (used in) provided by financing activities(10,542)24,017 
Net change in cash and cash equivalents(10,765)97 
Cash and cash equivalents at beginning of period85,203 82 
Cash and cash equivalents at end of period$74,438 $179 


8


BLUELINX HOLDINGS INC.
RECONCILIATION OF NON-GAAP MEASUREMENTS
(Unaudited)

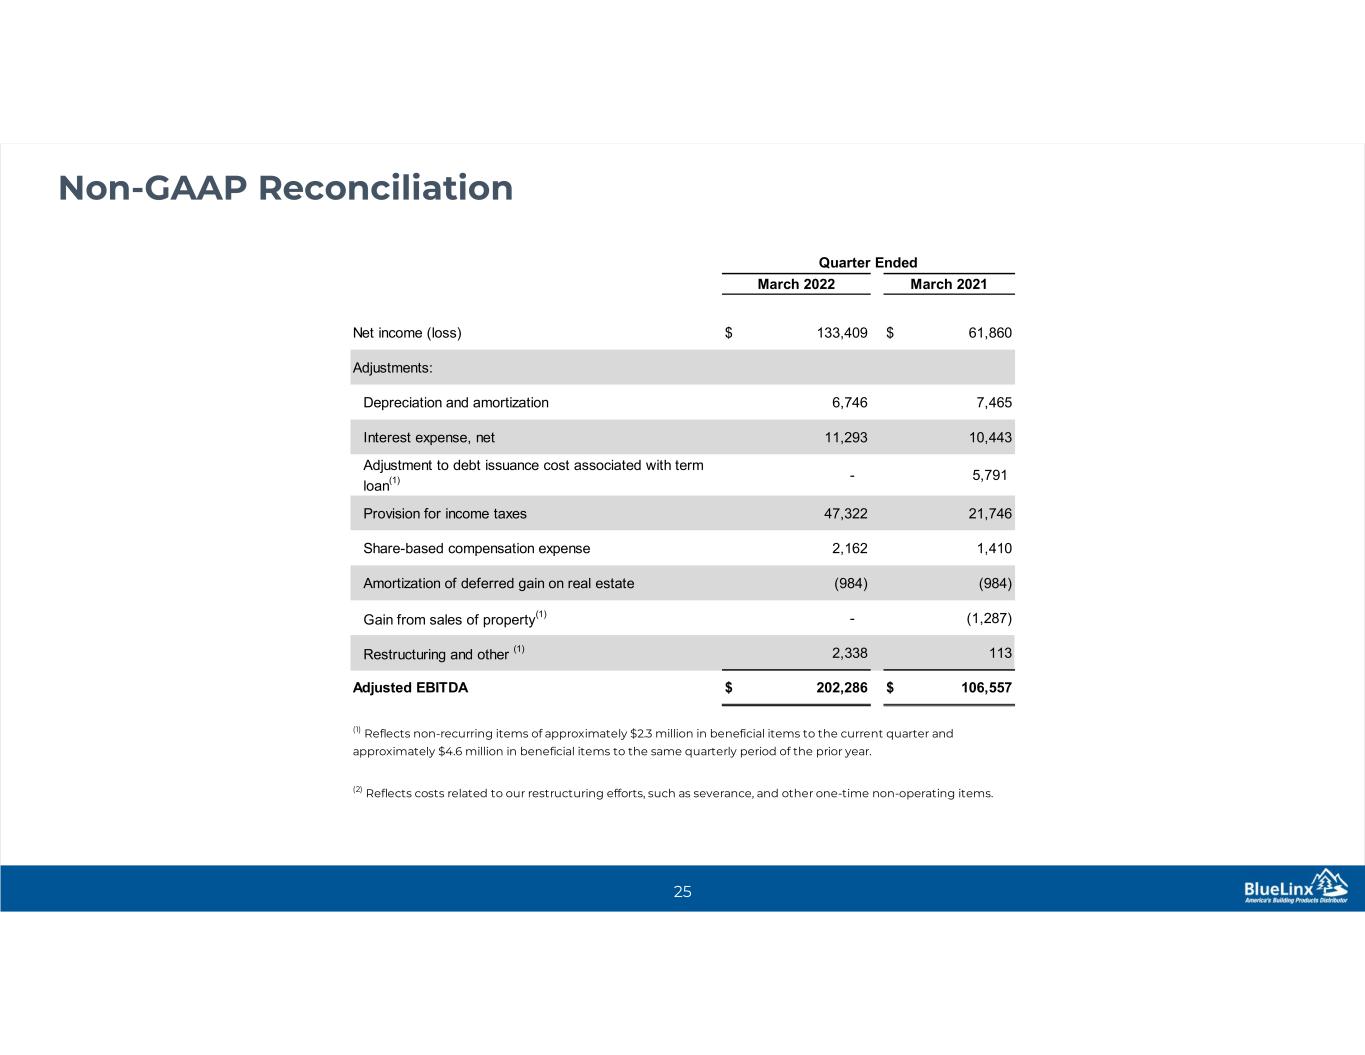
The following schedule reconciles net income to Adjusted EBITDA:
Three Months Ended
April 2, 2022April 3, 2021
(In thousands)
Net income$133,409 $61,860 
Adjustments:
Depreciation and amortization6,746 7,465 
Interest expense, net11,293 10,443 
Term loan debt issuance costs(1)
— 5,791 
Provision for income taxes47,322 21,746 
Share-based compensation expense2,162 1,410 
Amortization of deferred gains on real estate(984)(984)
Gain from sales of property(1)
— (1,287)
Restructuring and other(1)(2)
2,338 113 
Adjusted EBITDA$202,286 $106,557 
(1) Reflects non-recurring items of approximately $2.3 million in beneficial items to the current quarter and approximately $4.6 million in     
beneficial items to the same quarterly period of the prior year.

(2) Reflects costs related to our restructuring efforts, such as severance, and other one-time non-operating items.

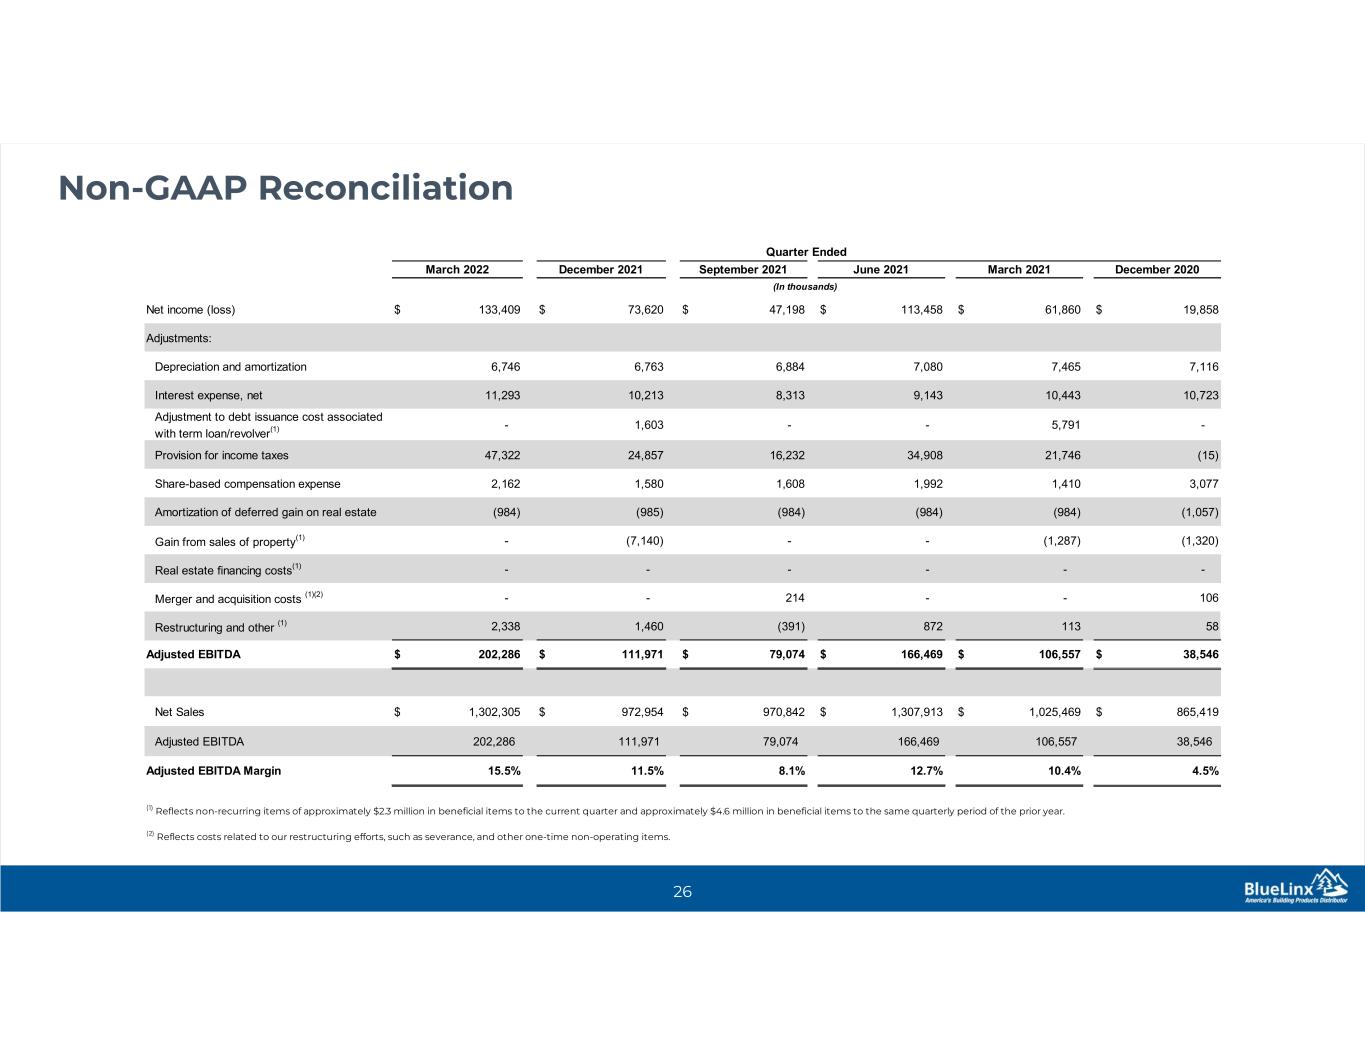
The following schedule presents our Adjusted EBITDA margin as a percentage of net sales:
Three Months Ended
April 2, 2022April 3, 2021
(In thousands)
Net sales$1,302,305 $1,025,469 
Adjusted EBITDA202,286 106,557 
Adjusted EBITDA margin15.5 %10.4 %

9


The following schedule presents our revenues disaggregated by specialty and structural product category:
Three Months Ended
April 2, 2022April 3, 2021
(In thousands)
Net sales by product category
Specialty products$767,907 $563,060 
Structural products534,398 462,409 
Total net sales$1,302,305 $1,025,469 
Gross profit dollars by product category
Specialty products$184,099 $108,535 
Structural products106,952 71,857 
Total gross profit$291,051 $180,392 
Gross margin % by product category
Specialty products24.0 %19.3 %
Structural products20.0 %15.5 %
Total gross margin %22.3 %17.6 %

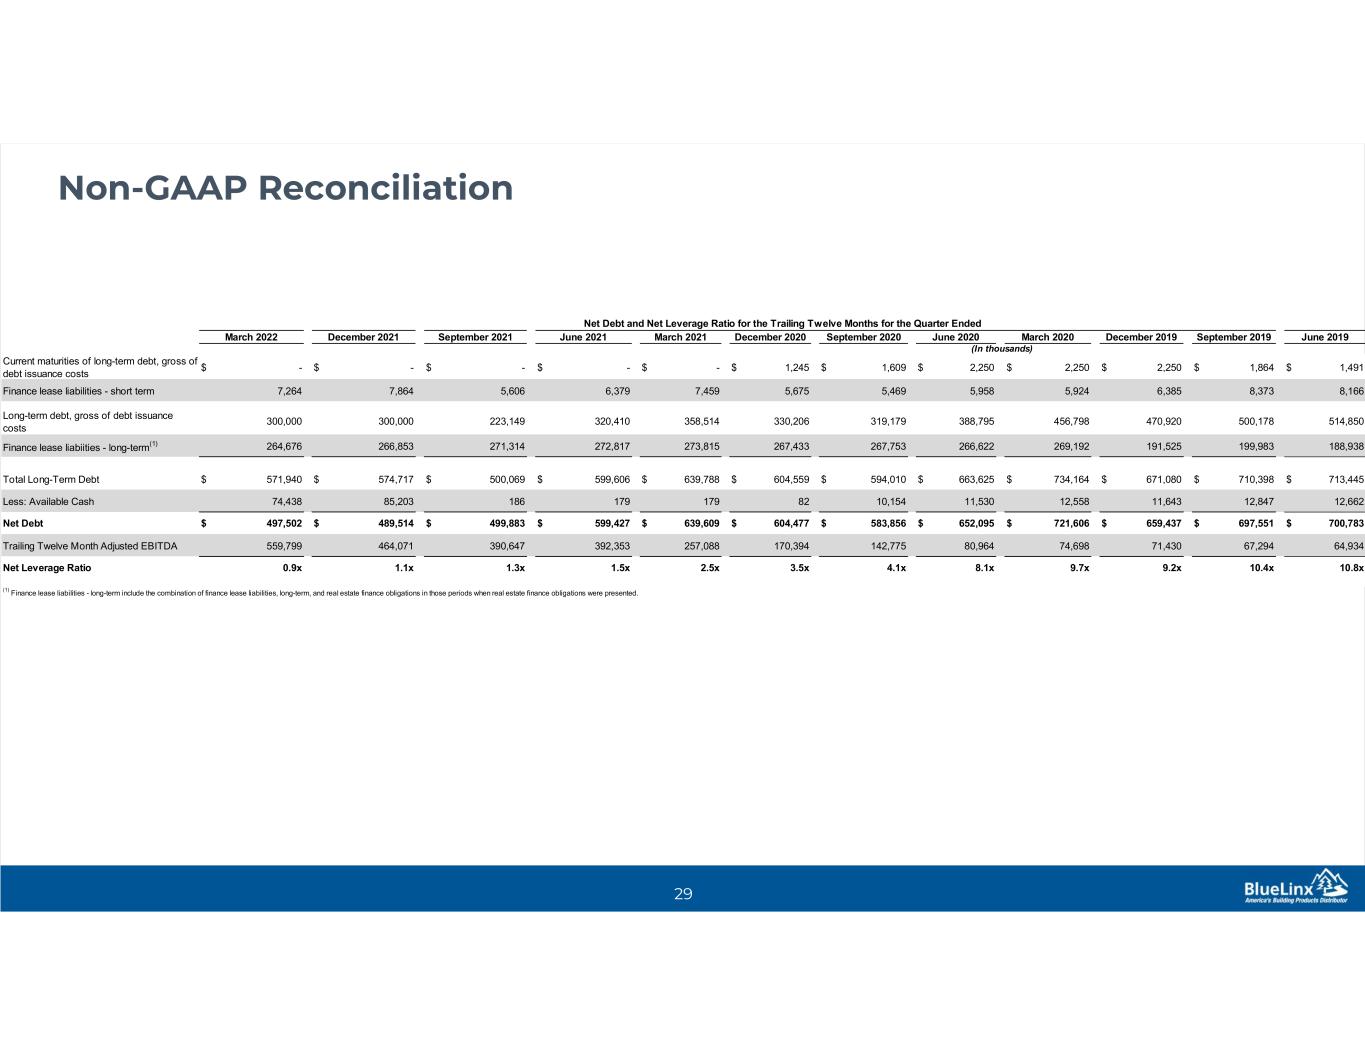
The following schedule presents Net Debt and the Net Leverage Ratio for the Trailing Twelve Months:
Three Months Ended
April 2, 2022April 3, 2021
(In thousands)
Finance lease liabilities - short term$7,264 $7,459 
Long term debt(1)
300,000 358,514 
Finance lease liabilities - long term264,676 273,815 
Total long-term debt571,940 639,788 
Less: available cash74,438 179 
Net Debt497,502 639,609 
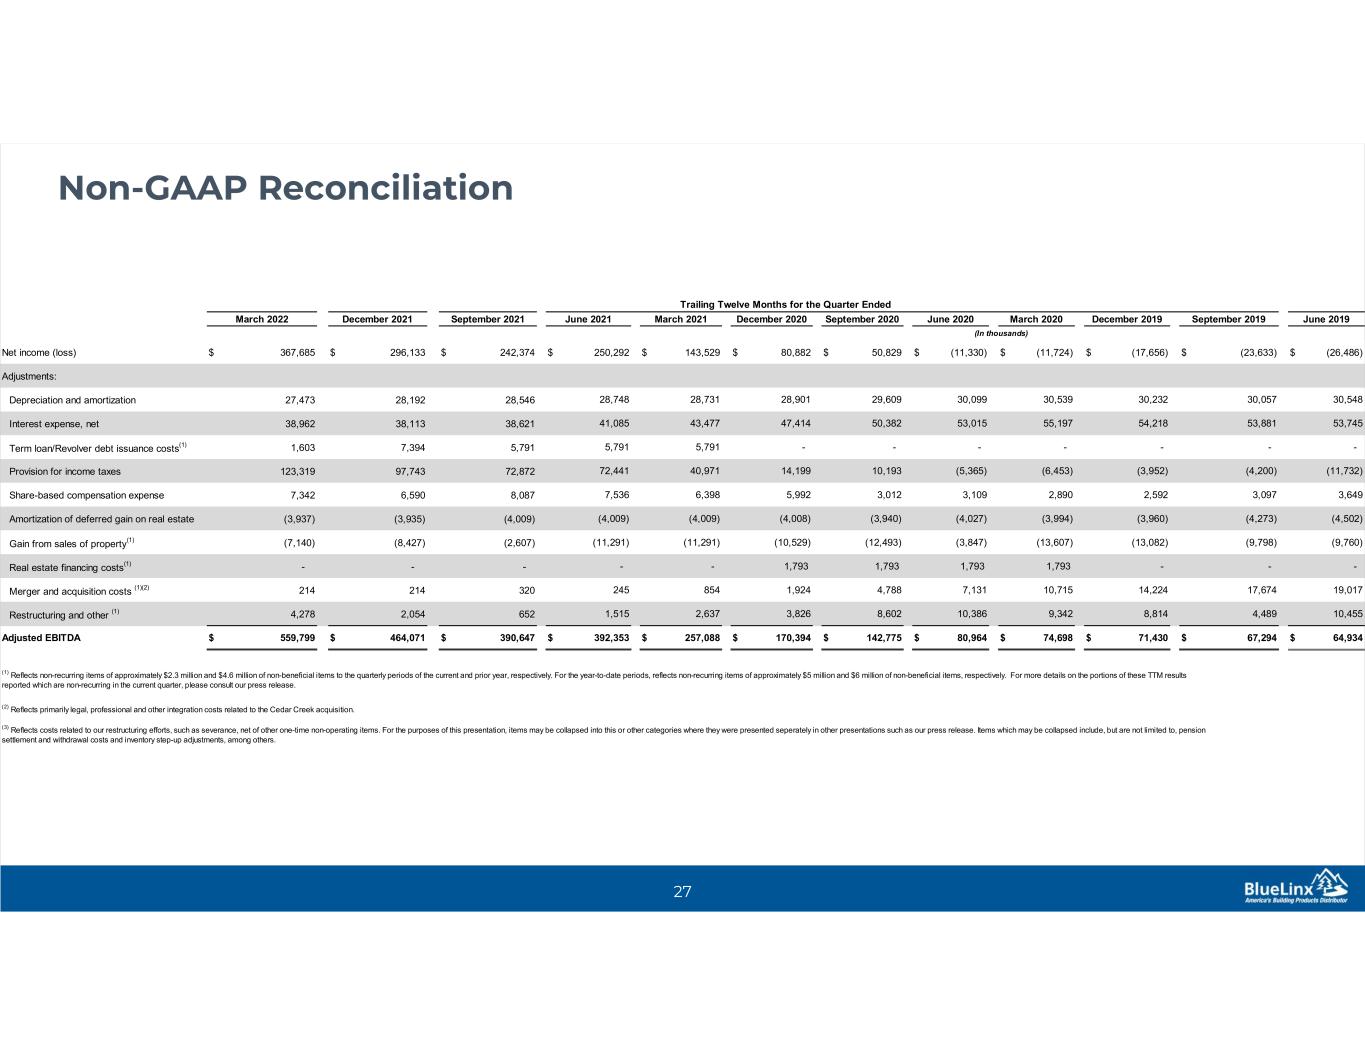
Trailing twelve month Adjusted EBITDA$559,799 $257,088 
Net Leverage Ratio0.9x2.5x

(1) For the three months ended April 2, 2022, our long-term debt is comprised of $300 million of senior-secured notes issued in October 2021. These notes are presented under the long-term debt caption of our balance sheet at $291.5 million which is net of their discount of $3.9 million and the combined carrying value of our debt issuance costs of $4.6 million. Our senior secured notes are presented in this table at their face value for the purposes of calculating our net leverage ratio. For the three months ended April 3, 2021, our long-term debt presented in this table is the balance presented on our balance sheet of $355.9 million, which was comprised of the balance of our revolving credit facility and our term loan, plus the carrying value of our debt issuance costs of $2.6 million.


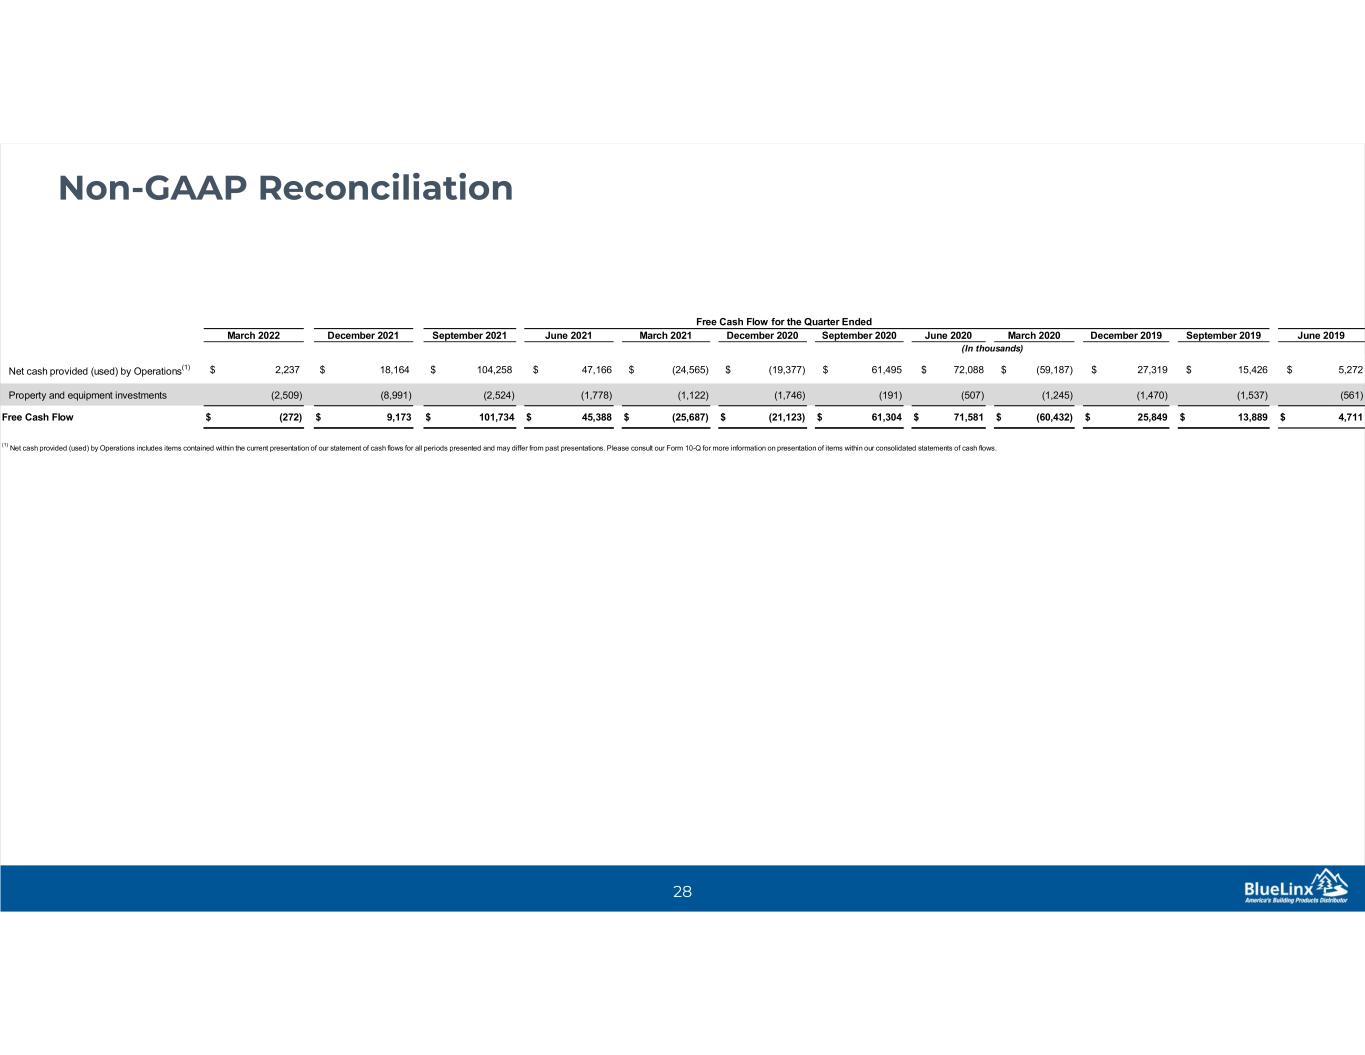
The following schedule presents free cash flow:

Three Months Ended
April 2, 2022April 3, 2021
Net cash provided by (used in) operating activities$2,237 $(24,608)
Less: Property and equipment investments(2,509)(1,122)
Free cash flow$(272)$(25,730)
10
BLUELINX Q1 2022 Results MAY 4, 2022


1 This presentation contains forward-looking statements. Forward-looking statements include, without limitation, any statement that predicts, forecasts, indicates or implies future results, performance, liquidity levels or achievements, and may contain the words “believe,” “anticipate,” “expect,” “estimate,” “intend,” “project,” “plan,” “will be,” “will likely continue,” “will likely result” or words or phrases of similar meaning. The forward-looking statements in this press release include statements about our multi-year capital allocation plans; confidence in the company’s long-term growth strategy; the demand outlook for construction materials and expectations regarding new home construction, repair and remodel activity and continued investment in existing and new homes; our positioning for long-term value creation; our efforts and ability to generate profitable growth; our efforts and ability to maintain a disciplined capital structure and capital allocation strategy; our ability to maintain a strong balance sheet and generate cash; our ability to improve operating execution; our ability to invest in organic growth initiatives; our ability to evaluate strategic acquisitions; constraints, volatility or disruptions in the capital markets or other factors affecting the amount and timing of share repurchases; our ability to successfully execute the ASR; the number of shares that will be delivered to the Company under the ASR; whether or not the Company will continue, and the timing of, any open market repurchases. Forward-looking statements in this press release are based on estimates and assumptions made by our management that, although believed by us to be reasonable, are inherently uncertain. Forward-looking statements involve risks and uncertainties that may cause our business, strategy, or actual results to differ materially from the forward-looking statements. These risks and uncertainties include those discussed in greater detail in our filings with the Securities and Exchange Commission. We operate in a changing environment in which new risks can emerge from time to time. It is not possible for management to predict all of these risks, nor can it assess the extent to which any factor, or a combination of factors, may cause our business, strategy, or actual results to differ materially from those contained in forward-looking statements. Factors that may cause these differences include, among other things: pricing and product cost variability; volumes of product sold; competition; changes in the supply and/or demand for products that we distribute; the cyclical nature of the industry in which we operate; housing market conditions; consolidation among competitors, suppliers, and customers; disintermediation risk; loss of products or key suppliers and manufacturers; our dependence on international suppliers and manufacturers for certain products; potential acquisitions and the integration and completion of such acquisitions; business disruptions; effective inventory management relative to our sales volume or the prices of the products we produce; information technology security risks and business interruption risks; the ability to attract, train, and retain highly qualified associates and other key personnel while controlling related labor costs; exposure to product liability and other claims and legal proceedings related to our business and the products we distribute; natural disasters, catastrophes, fire, or other unexpected events; successful implementation of our strategy; wage increases or work stoppages by our union employees; costs imposed by federal, state, local, and other regulations; compliance costs associated with federal, state, and local environmental protection laws; the COVID-19 pandemic and other contagious illness outbreaks and their potential effects on our industry; regulations concerning mandatory COVID-19 vaccines; fluctuations in our operating results; our level of indebtedness and our ability to incur additional debt to fund future needs; the covenants of the instruments governing our indebtedness limiting the discretion of our management in operating the business; variable interest rate risk under certain indebtedness; the fact that we have consummated certain sale leaseback transactions with resulting long-term non-cancelable leases, many of which are or will be finance leases; the fact that we lease many of our distribution centers, and we would still be obligated under these leases even if we close a leased distribution center; inability to raise funds necessary to finance a required repurchase of our senior secured notes; inability to successfully execute the ASR; a lowering or withdrawal of debt ratings; changes in our product mix; increases in petroleum prices; shareholder activism; changes in insurance-related deductible/retention reserves based on actual loss experience; the possibility that the value of our deferred tax assets could become impaired; changes in our expected annual effective tax rate could be volatile; changes in actuarial assumptions for our pension plan; the costs and liabilities related to our participation in multi-employer pension plans could increase; the risk that our cash flows and capital resources may be insufficient to service our existing or future indebtedness; the possibility that we could be the subject of securities class action litigation due to stock price volatility; activities of activist shareholders; indebtedness terms that limit our ability to pay dividends on common stock; and changes in, or interpretation of, accounting principles. Given these risks and uncertainties, we caution you not to place undue reliance on forward-looking statements. We expressly disclaim any obligation to update or revise any forward-looking statement as a result of new information, future events or otherwise, except as required by law. Non-GAAP Financial Measures. BlueLinx reports its financial results in accordance with GAAP. The Company also believes that presentation of certain non-GAAP measures may be useful to investors and may provide a more complete understanding of the factors and trends affecting the business than using reported GAAP results alone. Any non-GAAP measures used herein are reconciled to their most directly comparable GAAP measures herein or in the financial tables accompanying this news release. The Company cautions that non-GAAP measures should be considered in addition to, but not as a substitute for, the Company’s reported GAAP results. Immaterial Rounding Differences. Immaterial rounding adjustments and differences may exist between slides, press releases, and previously issued presentations. This presentation and the associated remarks made during this conference call are integrally related and are intended to be presented and understood together. Safe Harbor Statement


Opening Remarks Dwight Gibson, President and CEO MAY 4, 2022


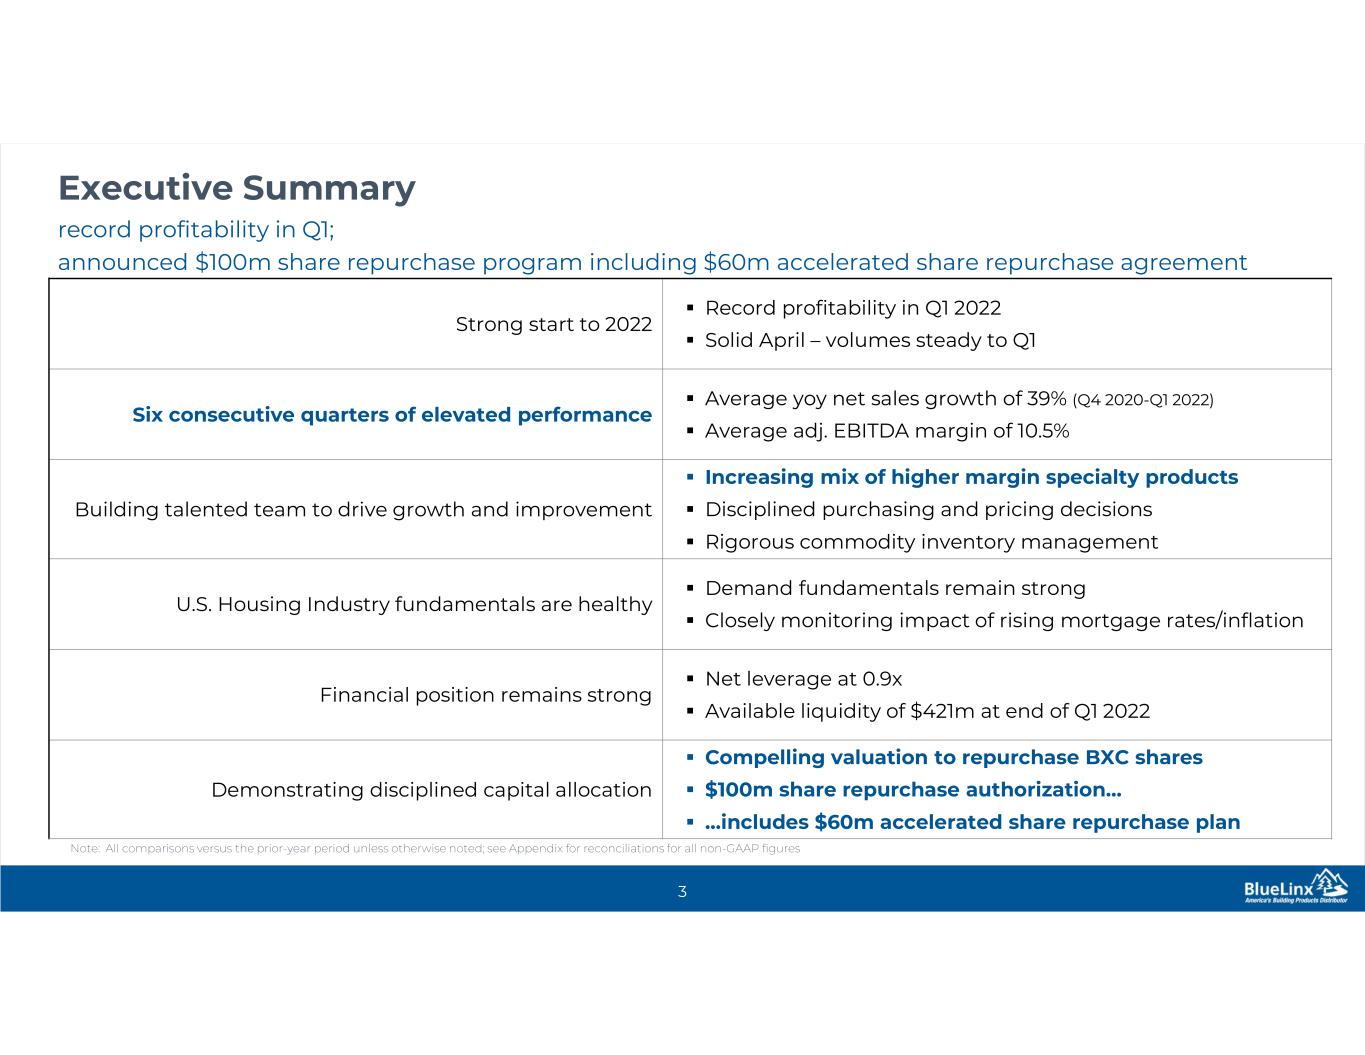
record profitability in Q1; announced $100m share repurchase program including $60m accelerated share repurchase agreement Executive Summary 3 Strong start to 2022  Record profitability in Q1 2022  Solid April – volumes steady to Q1 Six consecutive quarters of elevated performance  Average yoy net sales growth of 39% (Q4 2020-Q1 2022)  Average adj. EBITDA margin of 10.5% Building talented team to drive growth and improvement  Increasing mix of higher margin specialty products  Disciplined purchasing and pricing decisions  Rigorous commodity inventory management U.S. Housing Industry fundamentals are healthy  Demand fundamentals remain strong  Closely monitoring impact of rising mortgage rates/inflation Financial position remains strong  Net leverage at 0.9x  Available liquidity of $421m at end of Q1 2022 Demonstrating disciplined capital allocation  Compelling valuation to repurchase BXC shares  $100m share repurchase authorization…  …includes $60m accelerated share repurchase plan Note: All comparisons versus the prior-year period unless otherwise noted; see Appendix for reconciliations for all non-GAAP figures


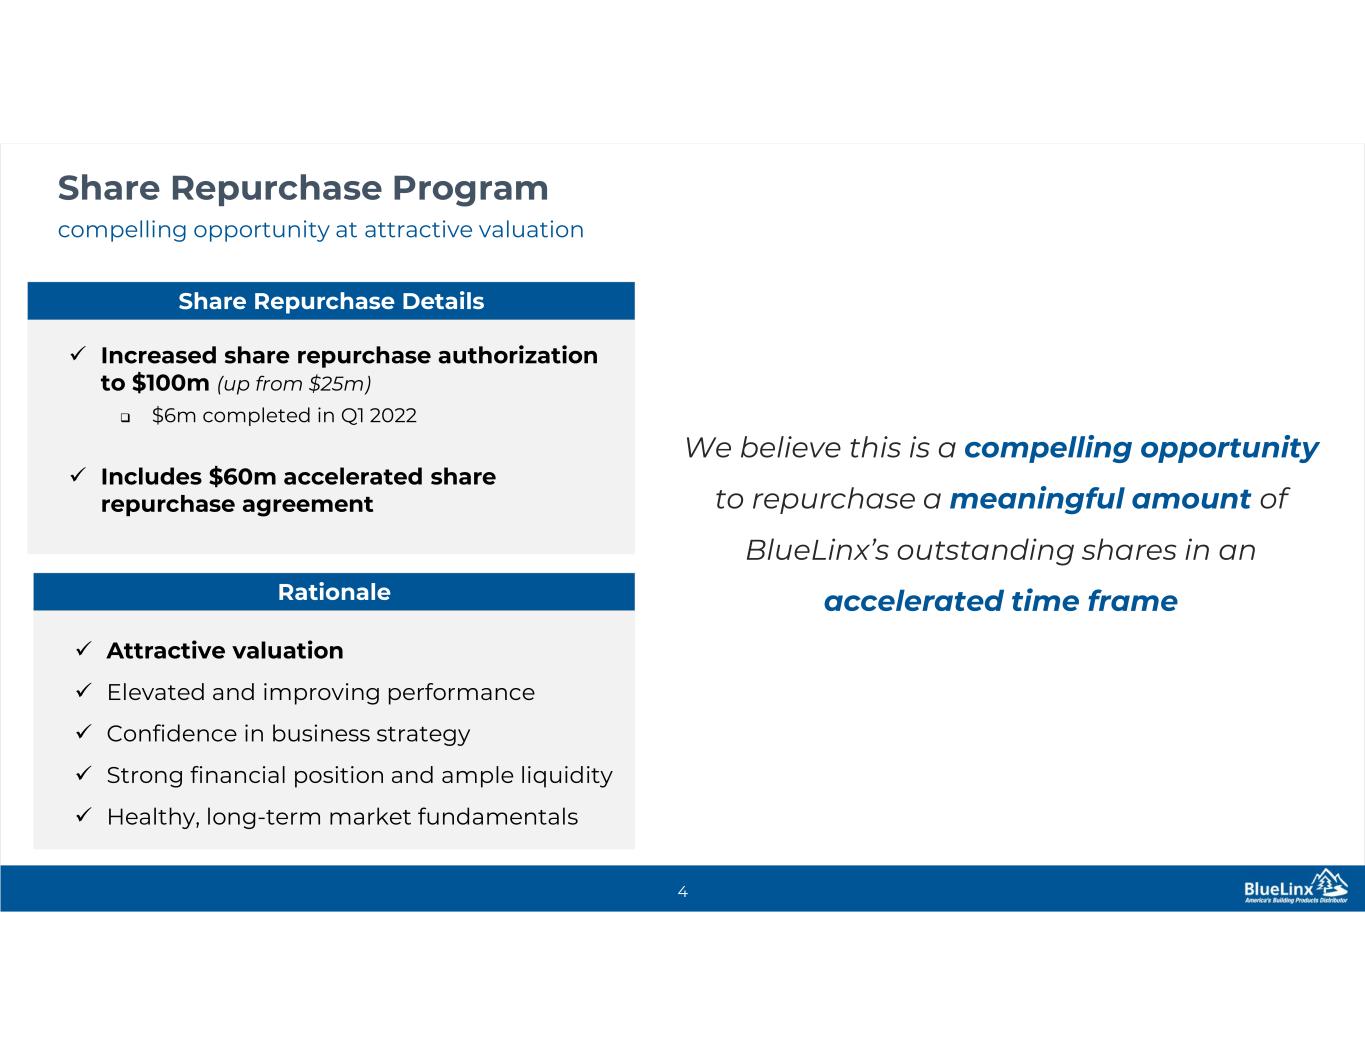
compelling opportunity at attractive valuation Share Repurchase Program 4  Attractive valuation  Elevated and improving performance  Confidence in business strategy  Strong financial position and ample liquidity  Healthy, long-term market fundamentals Rationale We believe this is a compelling opportunity to repurchase a meaningful amount of BlueLinx’s outstanding shares in an accelerated time frame  Increased share repurchase authorization to $100m (up from $25m)  $6m completed in Q1 2022  Includes $60m accelerated share repurchase agreement Share Repurchase Details


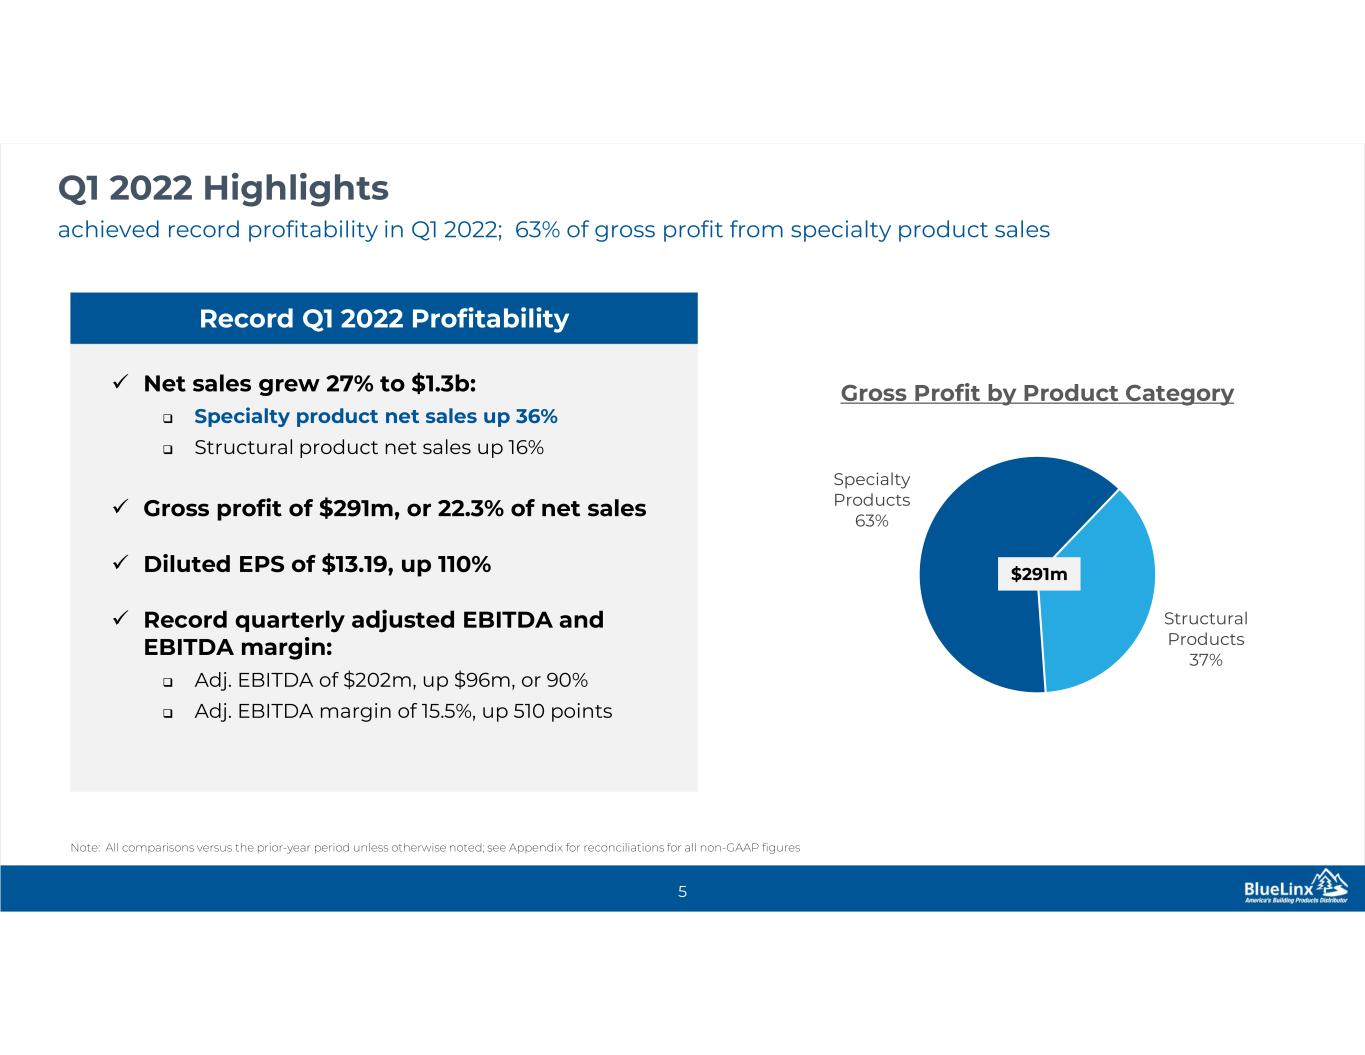
achieved record profitability in Q1 2022; 63% of gross profit from specialty product sales Q1 2022 Highlights 5 Note: All comparisons versus the prior-year period unless otherwise noted; see Appendix for reconciliations for all non-GAAP figures  Net sales grew 27% to $1.3b:  Specialty product net sales up 36%  Structural product net sales up 16%  Gross profit of $291m, or 22.3% of net sales  Diluted EPS of $13.19, up 110%  Record quarterly adjusted EBITDA and EBITDA margin:  Adj. EBITDA of $202m, up $96m, or 90%  Adj. EBITDA margin of 15.5%, up 510 points Record Q1 2022 Profitability Specialty Products 63% Structural Products 37% Gross Profit by Product Category $291m


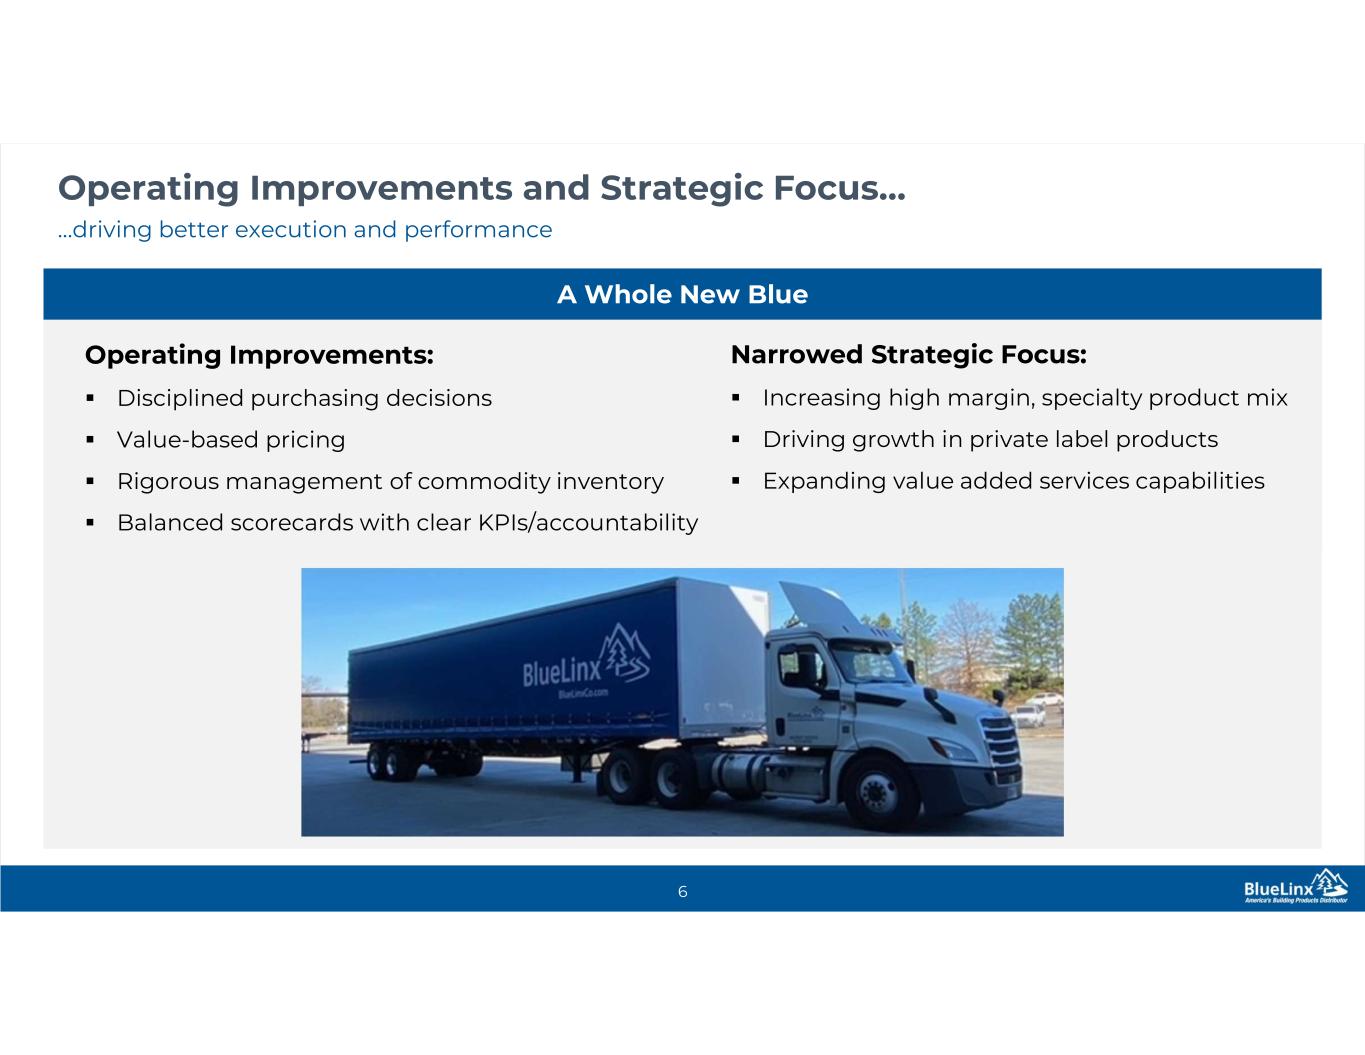
Operating Improvements:  Disciplined purchasing decisions  Value-based pricing  Rigorous management of commodity inventory  Balanced scorecards with clear KPIs/accountability …driving better execution and performance Operating Improvements and Strategic Focus… 6 Narrowed Strategic Focus:  Increasing high margin, specialty product mix  Driving growth in private label products  Expanding value added services capabilities A Whole New Blue


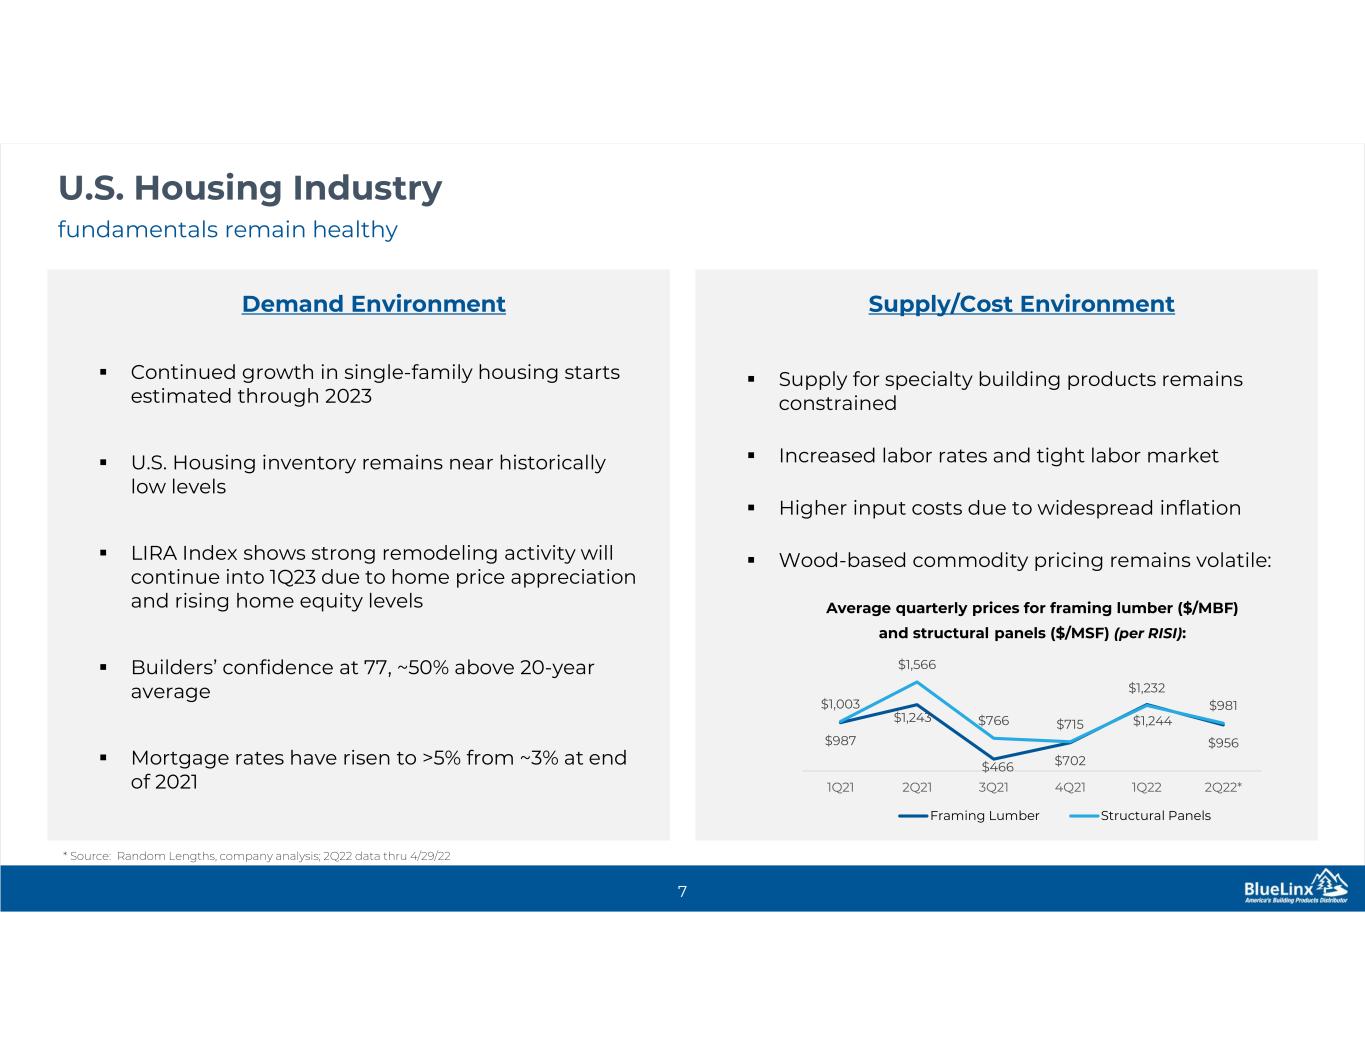
fundamentals remain healthy U.S. Housing Industry 7 Demand Environment  Continued growth in single-family housing starts estimated through 2023  U.S. Housing inventory remains near historically low levels  LIRA Index shows strong remodeling activity will continue into 1Q23 due to home price appreciation and rising home equity levels  Builders’ confidence at 77, ~50% above 20-year average  Mortgage rates have risen to >5% from ~3% at end of 2021 Supply/Cost Environment  Supply for specialty building products remains constrained  Increased labor rates and tight labor market  Higher input costs due to widespread inflation  Wood-based commodity pricing remains volatile: $987 $1,243 $466 $702 $1,244 $956 $1,003 $1,566 $766 $715 $1,232 $981 1Q21 2Q21 3Q21 4Q21 1Q22 2Q22* Framing Lumber Structural Panels Average quarterly prices for framing lumber ($/MBF) and structural panels ($/MSF) (per RISI): * Source: Random Lengths, company analysis; 2Q22 data thru 4/29/22


Q1 2022 Financial Review Kelly Janzen, Chief Financial Officer MAY 4, 2022


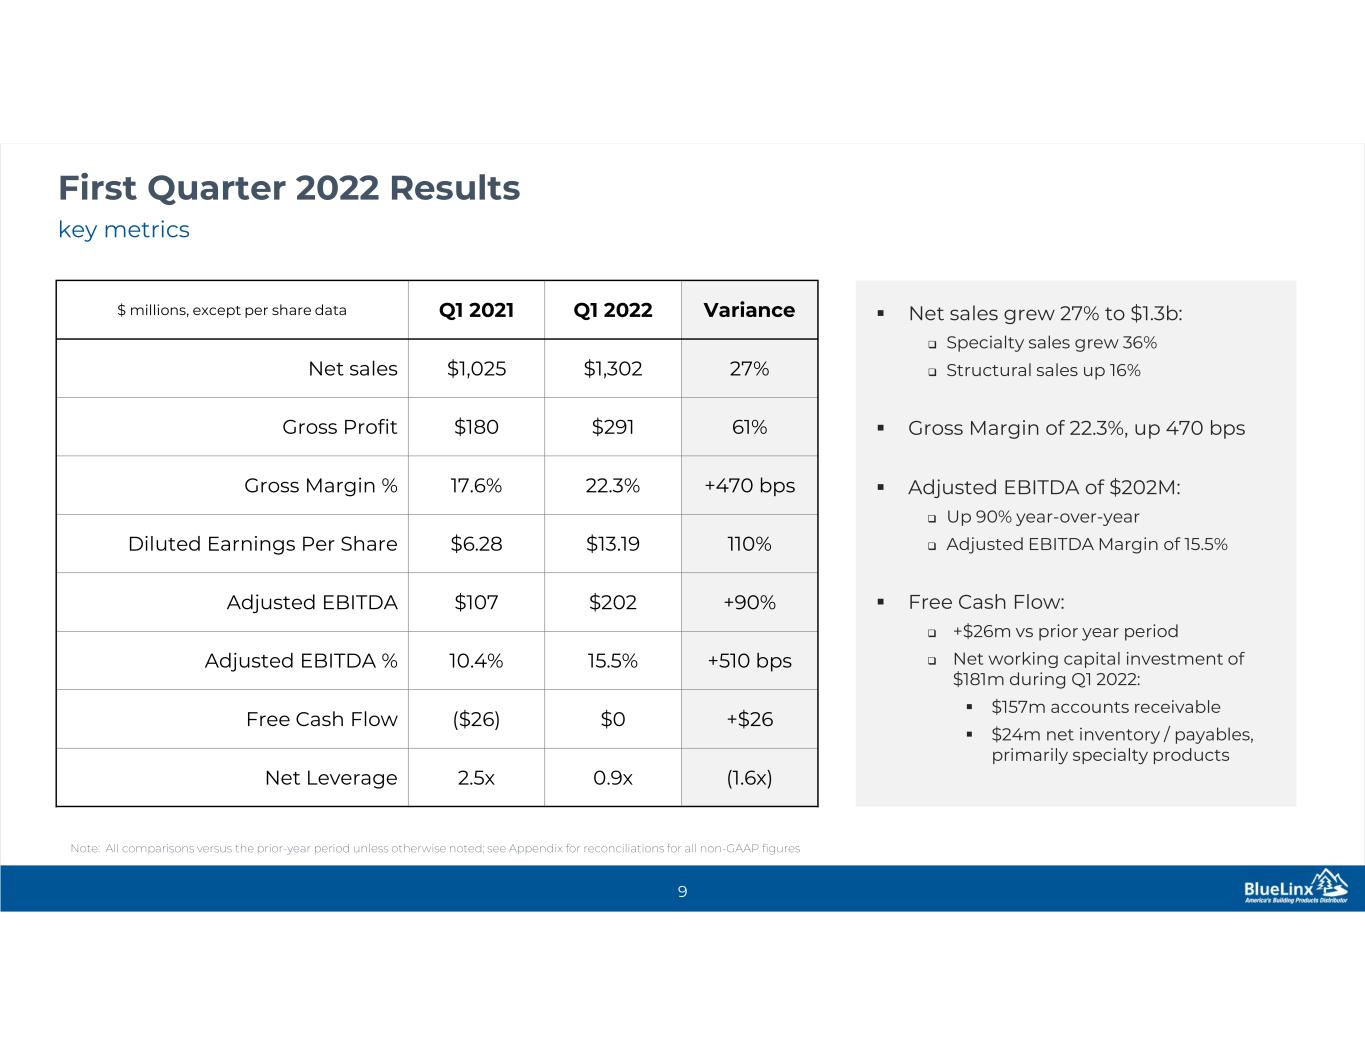
key metrics First Quarter 2022 Results 9  Net sales grew 27% to $1.3b:  Specialty sales grew 36%  Structural sales up 16%  Gross Margin of 22.3%, up 470 bps  Adjusted EBITDA of $202M:  Up 90% year-over-year  Adjusted EBITDA Margin of 15.5%  Free Cash Flow:  +$26m vs prior year period  Net working capital investment of $181m during Q1 2022:  $157m accounts receivable  $24m net inventory / payables, primarily specialty products Note: All comparisons versus the prior-year period unless otherwise noted; see Appendix for reconciliations for all non-GAAP figures $ millions, except per share data Q1 2021 Q1 2022 Variance Net sales $1,025 $1,302 27% Gross Profit $180 $291 61% Gross Margin % 17.6% 22.3% +470 bps Diluted Earnings Per Share $6.28 $13.19 110% Adjusted EBITDA $107 $202 +90% Adjusted EBITDA % 10.4% 15.5% +510 bps Free Cash Flow ($26) $0 +$26 Net Leverage 2.5x 0.9x (1.6x)


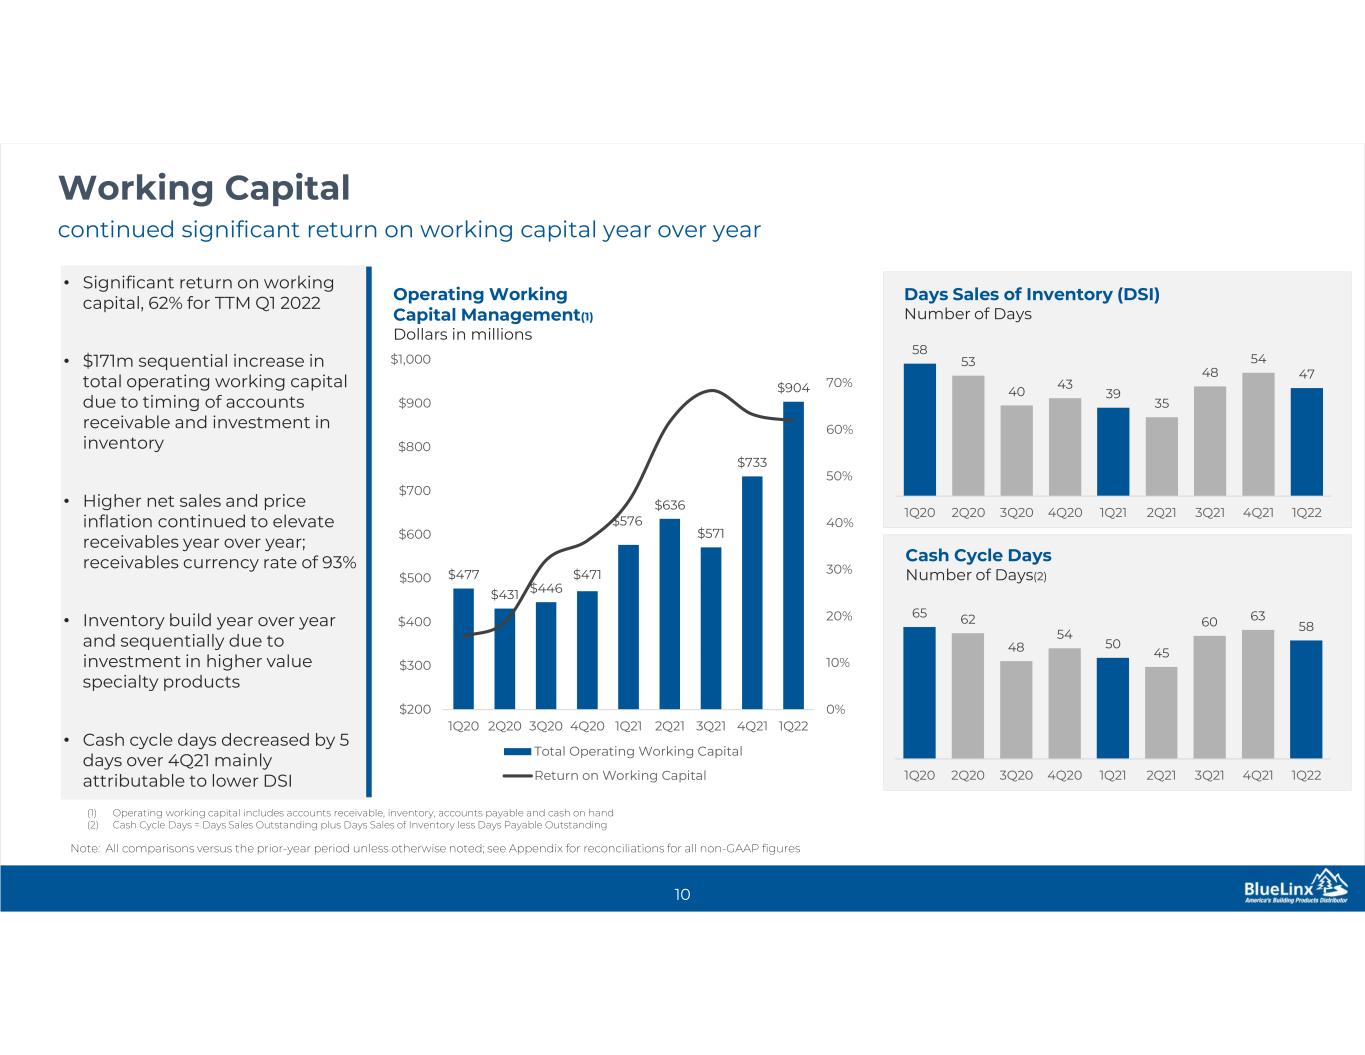
continued significant return on working capital year over year Working Capital 10 Days Sales of Inventory (DSI) Number of Days Operating Working Capital Management(1) Dollars in millions Cash Cycle Days Number of Days(2) • Significant return on working capital, 62% for TTM Q1 2022 • $171m sequential increase in total operating working capital due to timing of accounts receivable and investment in inventory • Higher net sales and price inflation continued to elevate receivables year over year; receivables currency rate of 93% • Inventory build year over year and sequentially due to investment in higher value specialty products • Cash cycle days decreased by 5 days over 4Q21 mainly attributable to lower DSI 58 53 40 43 39 35 48 54 47 1Q20 2Q20 3Q20 4Q20 1Q21 2Q21 3Q21 4Q21 1Q22 65 62 48 54 50 45 60 63 58 1Q20 2Q20 3Q20 4Q20 1Q21 2Q21 3Q21 4Q21 1Q22 $477 $431 $446 $471 $576 $636 $571 $733 $904 0% 10% 20% 30% 40% 50% 60% 70% $200 $300 $400 $500 $600 $700 $800 $900 $1,000 1Q20 2Q20 3Q20 4Q20 1Q21 2Q21 3Q21 4Q21 1Q22 Total Operating Working Capital Return on Working Capital Note: All comparisons versus the prior-year period unless otherwise noted; see Appendix for reconciliations for all non-GAAP figures (1) Operating working capital includes accounts receivable, inventory, accounts payable and cash on hand (2) Cash Cycle Days = Days Sales Outstanding plus Days Sales of Inventory less Days Payable Outstanding


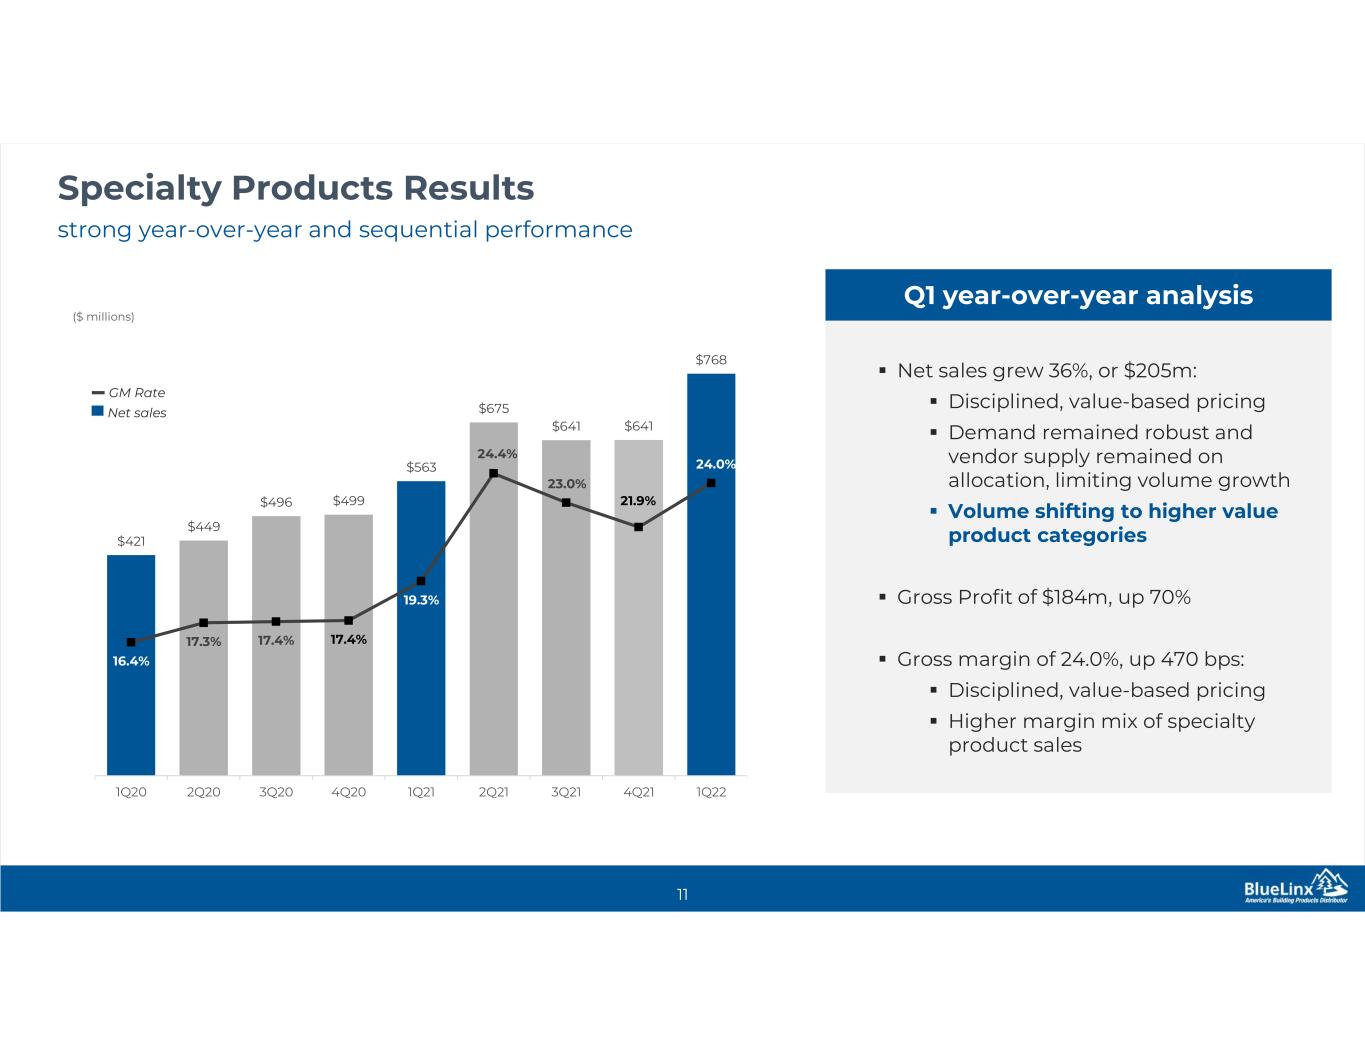
strong year-over-year and sequential performance Specialty Products Results 11 $421 $449 $496 $499 $563 $675 $641 $641 $768 16.4% 17.3% 17.4% 17.4% 19.3% 24.4% 23.0% 21.9% 24.0% 1Q20 2Q20 3Q20 4Q20 1Q21 2Q21 3Q21 4Q21 1Q22 ($ millions) GM Rate Net sales  Net sales grew 36%, or $205m:  Disciplined, value-based pricing  Demand remained robust and vendor supply remained on allocation, limiting volume growth  Volume shifting to higher value product categories  Gross Profit of $184m, up 70%  Gross margin of 24.0%, up 470 bps:  Disciplined, value-based pricing  Higher margin mix of specialty product sales Q1 year-over-year analysis


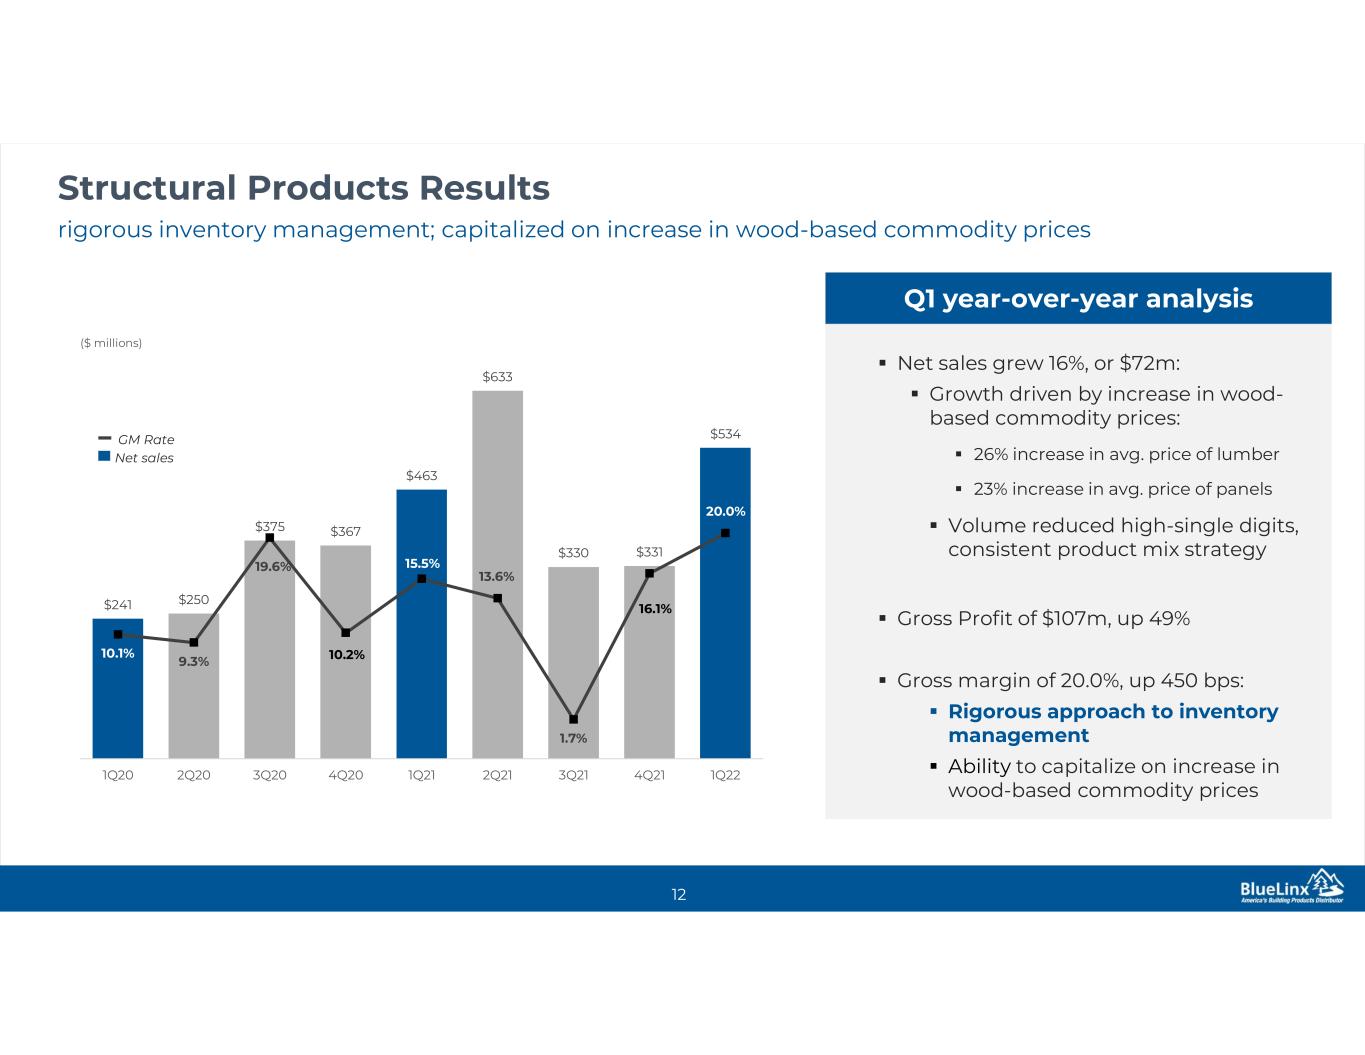
rigorous inventory management; capitalized on increase in wood-based commodity prices Structural Products Results -13- ($ millions) $241 $250 $375 $367 $463 $633 $330 $331 $534 10.1% 9.3% 19.6% 10.2% 15.5% 13.6% 1.7% 16.1% 20.0% 1Q20 2Q20 3Q20 4Q20 1Q21 2Q21 3Q21 4Q21 1Q22 GM Rate 12 Net sales  Net sales grew 16%, or $72m:  Growth driven by increase in wood- based commodity prices:  26% increase in avg. price of lumber  23% increase in avg. price of panels  Volume reduced high-single digits, consistent product mix strategy  Gross Profit of $107m, up 49%  Gross margin of 20.0%, up 450 bps:  Rigorous approach to inventory management  Ability to capitalize on increase in wood-based commodity prices Q1 year-over-year analysis


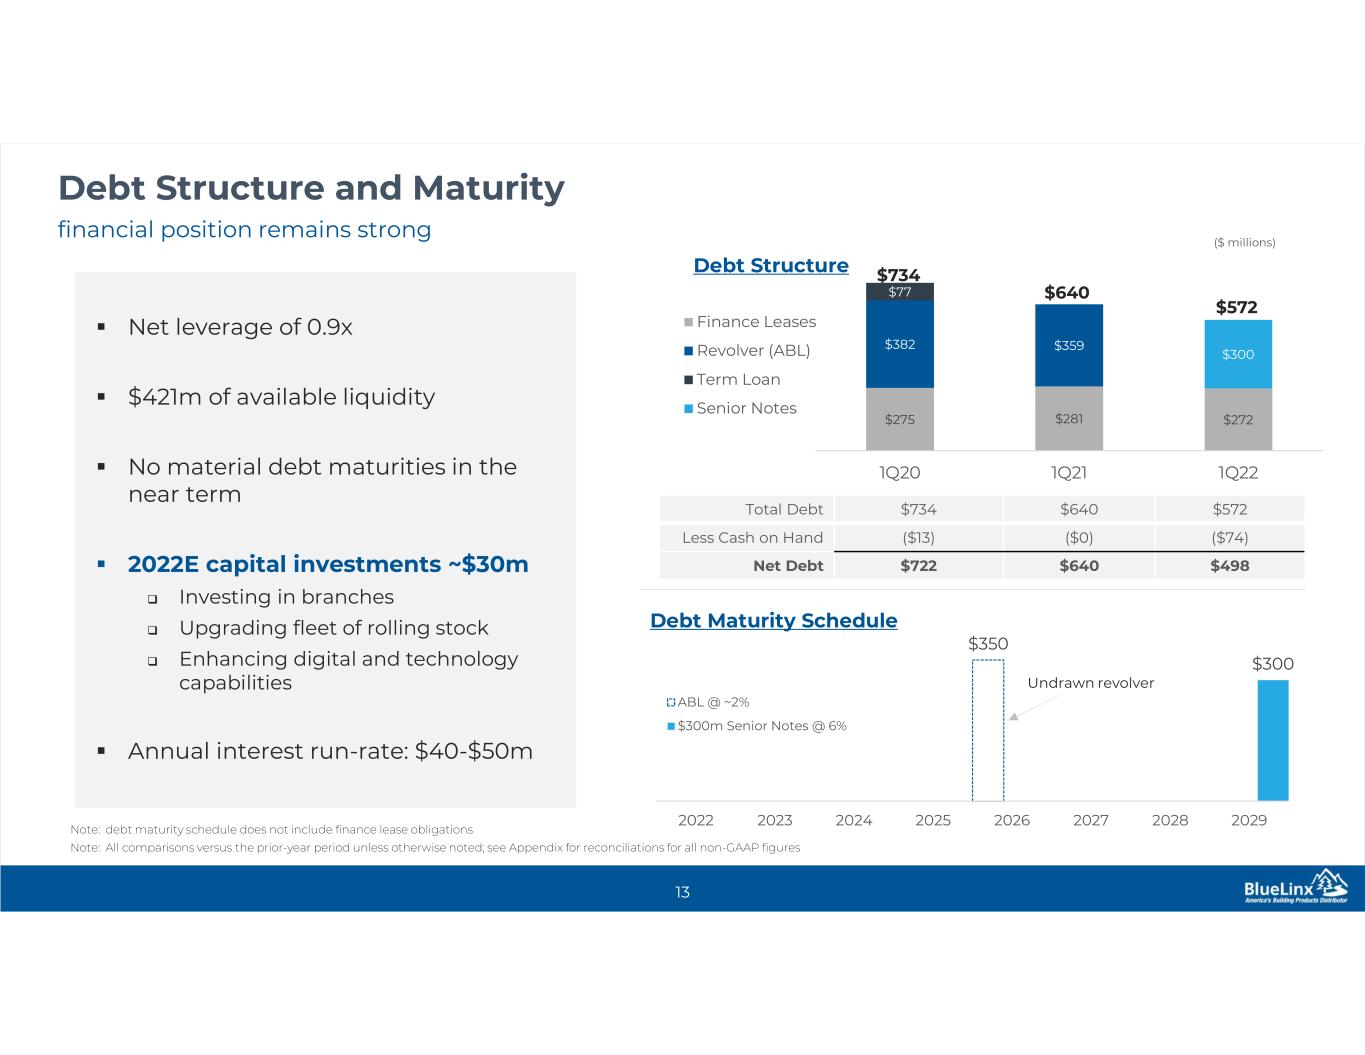
financial position remains strong Debt Structure and Maturity 13  Net leverage of 0.9x  $421m of available liquidity  No material debt maturities in the near term  2022E capital investments ~$30m  Investing in branches  Upgrading fleet of rolling stock  Enhancing digital and technology capabilities  Annual interest run-rate: $40-$50m $350 $300 2022 2023 2024 2025 2026 2027 2028 2029 Debt Maturity Schedule ABL @ ~2% $300m Senior Notes @ 6% Undrawn revolver Note: debt maturity schedule does not include finance lease obligations Total Debt $734 $640 $572 Less Cash on Hand ($13) ($0) ($74) Net Debt $722 $640 $498 $275 $281 $272 $382 $359 $77 $300 1Q20 1Q21 1Q22 Debt Structure Finance Leases Revolver (ABL) Term Loan Senior Notes $734 $640 $572 Note: All comparisons versus the prior-year period unless otherwise noted; see Appendix for reconciliations for all non-GAAP figures ($ millions)


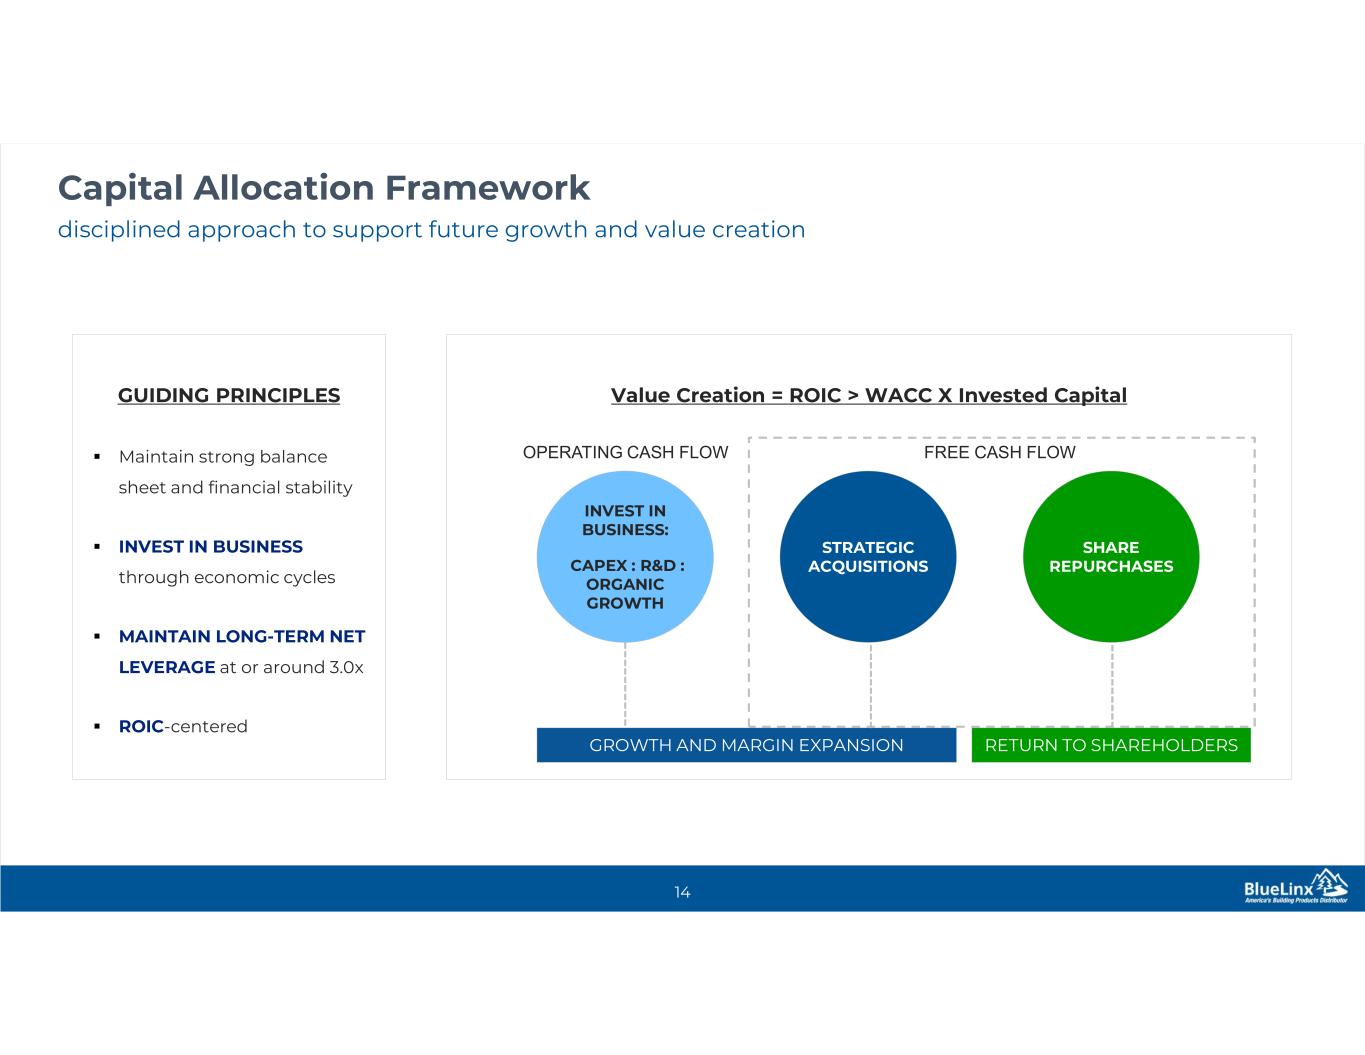
disciplined approach to support future growth and value creation Capital Allocation Framework 14 GUIDING PRINCIPLES  Maintain strong balance sheet and financial stability  INVEST IN BUSINESS through economic cycles  MAINTAIN LONG-TERM NET LEVERAGE at or around 3.0x  ROIC-centered Value Creation = ROIC > WACC X Invested Capital INVEST IN BUSINESS: CAPEX : R&D : ORGANIC GROWTH STRATEGIC ACQUISITIONS SHARE REPURCHASES GROWTH AND MARGIN EXPANSION RETURN TO SHAREHOLDERS FREE CASH FLOWOPERATING CASH FLOW


Executive Summary Dwight Gibson, President and CEO MAY 4, 2022


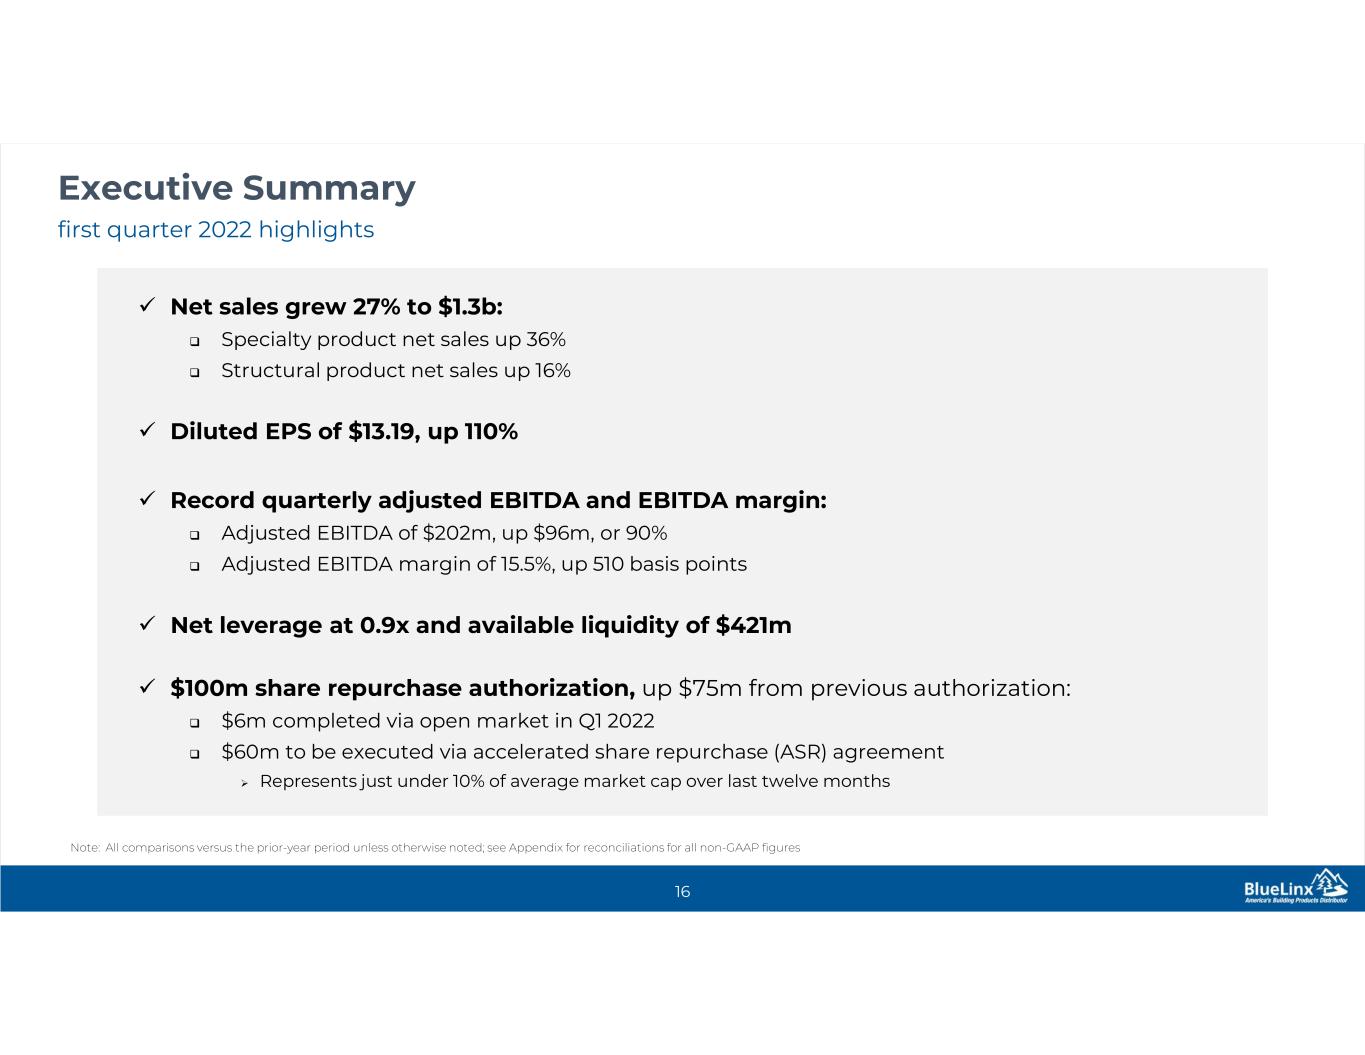
first quarter 2022 highlights Executive Summary 16 Note: All comparisons versus the prior-year period unless otherwise noted; see Appendix for reconciliations for all non-GAAP figures  Net sales grew 27% to $1.3b:  Specialty product net sales up 36%  Structural product net sales up 16%  Diluted EPS of $13.19, up 110%  Record quarterly adjusted EBITDA and EBITDA margin:  Adjusted EBITDA of $202m, up $96m, or 90%  Adjusted EBITDA margin of 15.5%, up 510 basis points  Net leverage at 0.9x and available liquidity of $421m  $100m share repurchase authorization, up $75m from previous authorization:  $6m completed via open market in Q1 2022  $60m to be executed via accelerated share repurchase (ASR) agreement  Represents just under 10% of average market cap over last twelve months


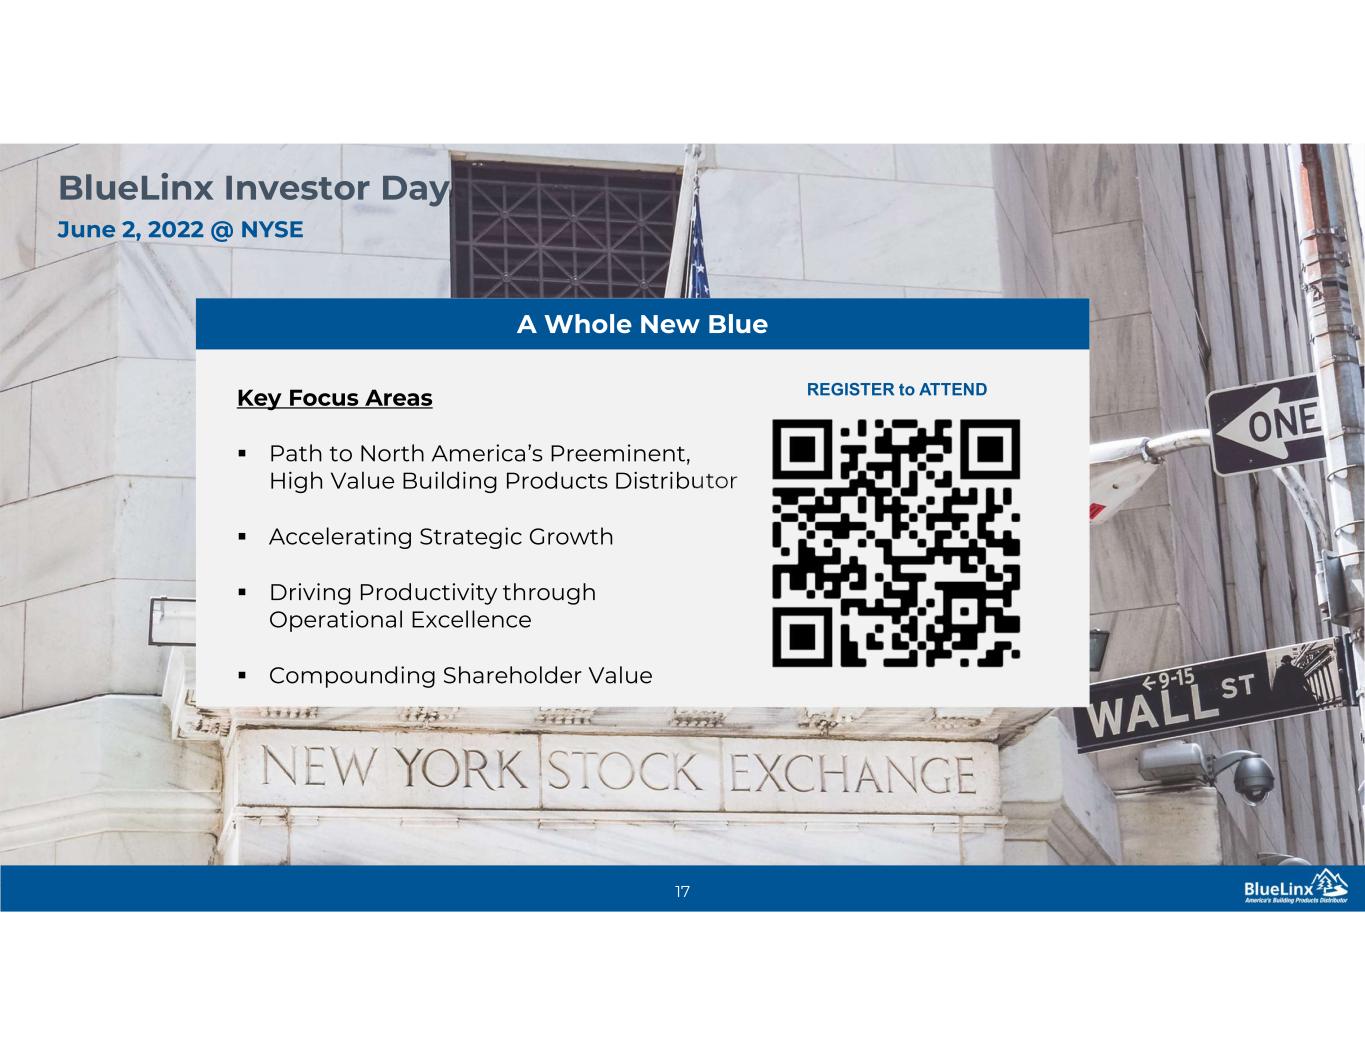
June 2, 2022 @ NYSE BlueLinx Investor Day 17 Key Focus Areas  Path to North America’s Preeminent, High Value Building Products Distributor  Accelerating Strategic Growth  Driving Productivity through Operational Excellence  Compounding Shareholder Value A Whole New Blue REGISTER to ATTEND


Appendix MAY 4, 2022


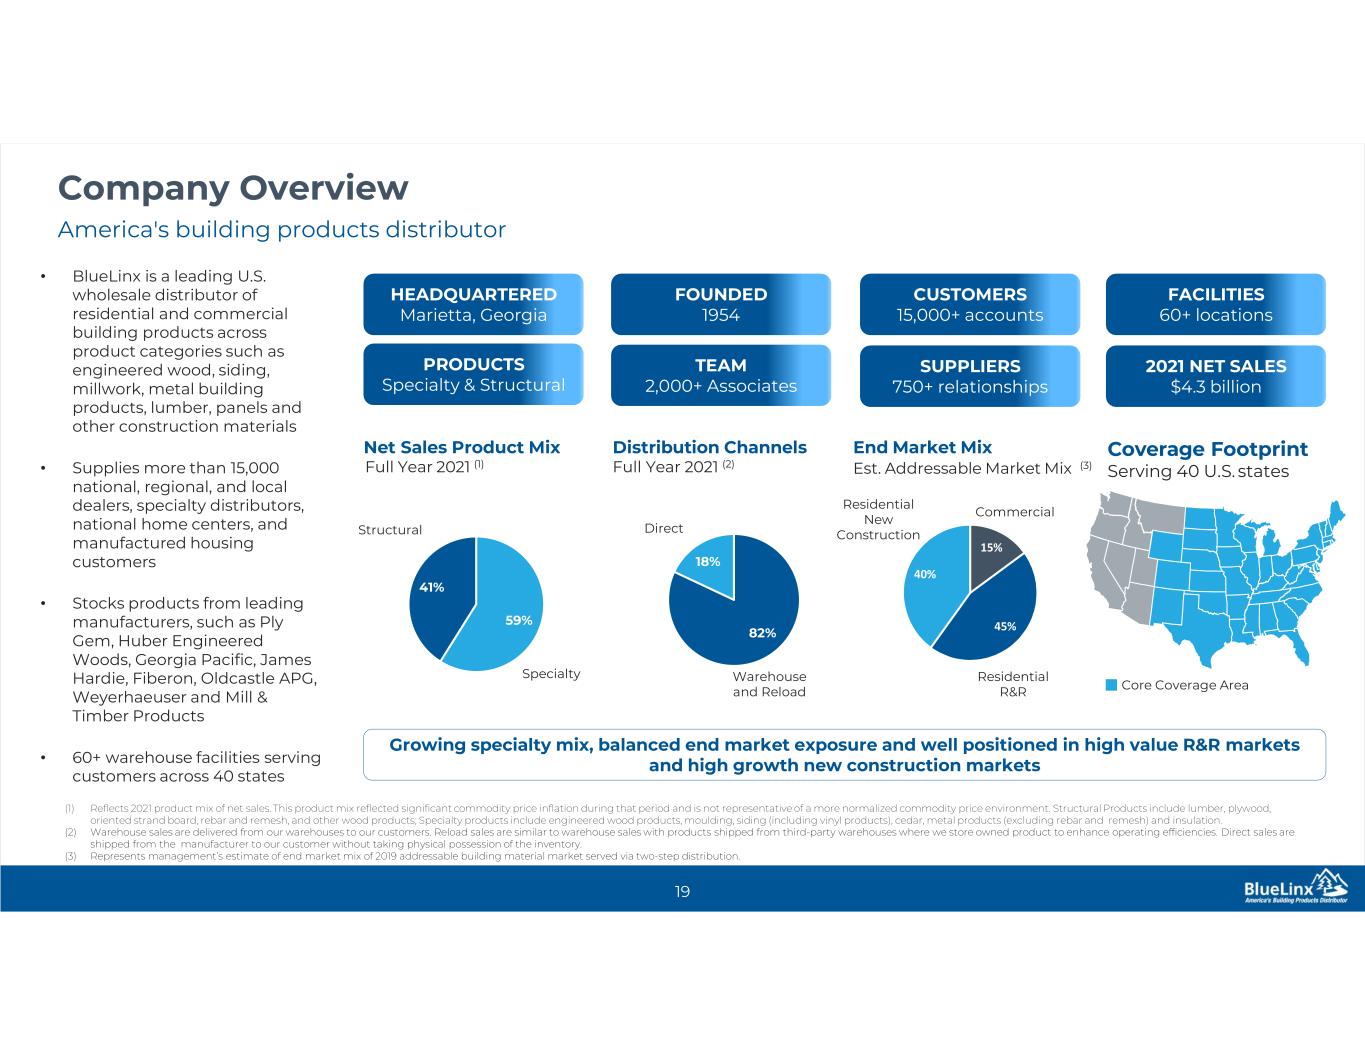
82% 18% 59% 41% • BlueLinx is a leading U.S. wholesale distributor of residential and commercial building products across product categories such as engineered wood, siding, millwork, metal building products, lumber, panels and other construction materials • Supplies more than 15,000 national, regional, and local dealers, specialty distributors, national home centers, and manufactured housing customers • Stocks products from leading manufacturers, such as Ply Gem, Huber Engineered Woods, Georgia Pacific, James Hardie, Fiberon, Oldcastle APG, Weyerhaeuser and Mill & Timber Products • 60+ warehouse facilities serving customers across 40 states HEADQUARTERED Marietta, Georgia FOUNDED 1954 CUSTOMERS 15,000+ accounts FACILITIES 60+ locations PRODUCTS Specialty & Structural TEAM 2,000+ Associates SUPPLIERS 750+ relationships 2021 NET SALES $4.3 billion Net Sales Product Mix Full Year 2021 (1) Distribution Channels Full Year 2021 (2) Coverage Footprint Serving 40 U.S. states (1) Reflects 2021 product mix of net sales. This product mix reflected significant commodity price inflation during that period and is not representative of a more normalized commodity price environment. Structural Products include lumber, plywood, oriented strand board, rebar and remesh, and other wood products; Specialty products include engineered wood products, moulding, siding (including vinyl products), cedar, metal products (excluding rebar and remesh) and insulation. (2) Warehouse sales are delivered from our warehouses to our customers. Reload sales are similar to warehouse sales with products shipped from third-party warehouses where we store owned product to enhance operating efficiencies. Direct sales are shipped from the manufacturer to our customer without taking physical possession of the inventory. (3) Represents management’s estimate of end market mix of 2019 addressable building material market served via two-step distribution. End Market Mix Est. Addressable Market Mix (3) Structural Specialty Warehouse and Reload Direct 15% 45% 40% Commercial Residential R&R Residential New Construction Growing specialty mix, balanced end market exposure and well positioned in high value R&R markets and high growth new construction markets Core Coverage Area America's building products distributor Company Overview 19


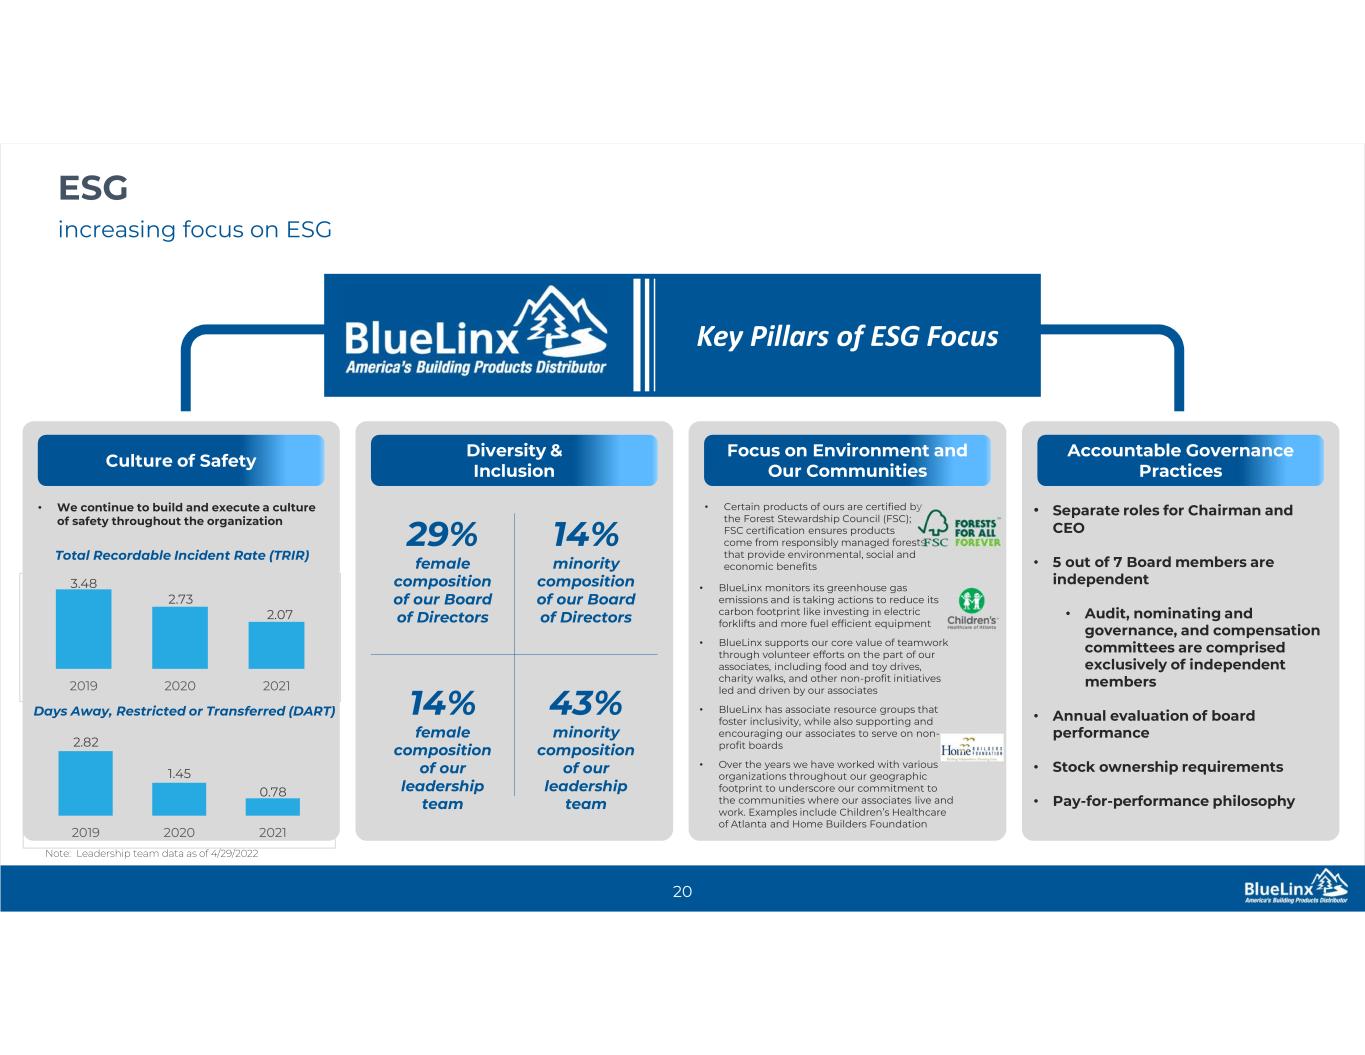
increasing focus on ESG ESG 20 Culture of Safety Diversity & Inclusion Key Pillars of ESG Focus • We continue to build and execute a culture of safety throughout the organization 29% female composition of our Board of Directors 14% female composition of our leadership team Accountable Governance Practices • Separate roles for Chairman and CEO • 5 out of 7 Board members are independent • Audit, nominating and governance, and compensation committees are comprised exclusively of independent members • Annual evaluation of board performance • Stock ownership requirements • Pay-for-performance philosophy Focus on Environment and Our Communities • Certain products of ours are certified by the Forest Stewardship Council (FSC); FSC certification ensures products come from responsibly managed forests that provide environmental, social and economic benefits Total Recordable Incident Rate (TRIR) Days Away, Restricted or Transferred (DART) 14% minority composition of our Board of Directors 43% minority composition of our leadership team • BlueLinx monitors its greenhouse gas emissions and is taking actions to reduce its carbon footprint like investing in electric forklifts and more fuel efficient equipment • BlueLinx supports our core value of teamwork through volunteer efforts on the part of our associates, including food and toy drives, charity walks, and other non-profit initiatives led and driven by our associates • BlueLinx has associate resource groups that foster inclusivity, while also supporting and encouraging our associates to serve on non- profit boards • Over the years we have worked with various organizations throughout our geographic footprint to underscore our commitment to the communities where our associates live and work. Examples include Children’s Healthcare of Atlanta and Home Builders Foundation Note: Leadership team data as of 4/29/2022 3.48 2.73 2.07 2019 2020 2021 2.82 1.45 0.78 2019 2020 2021


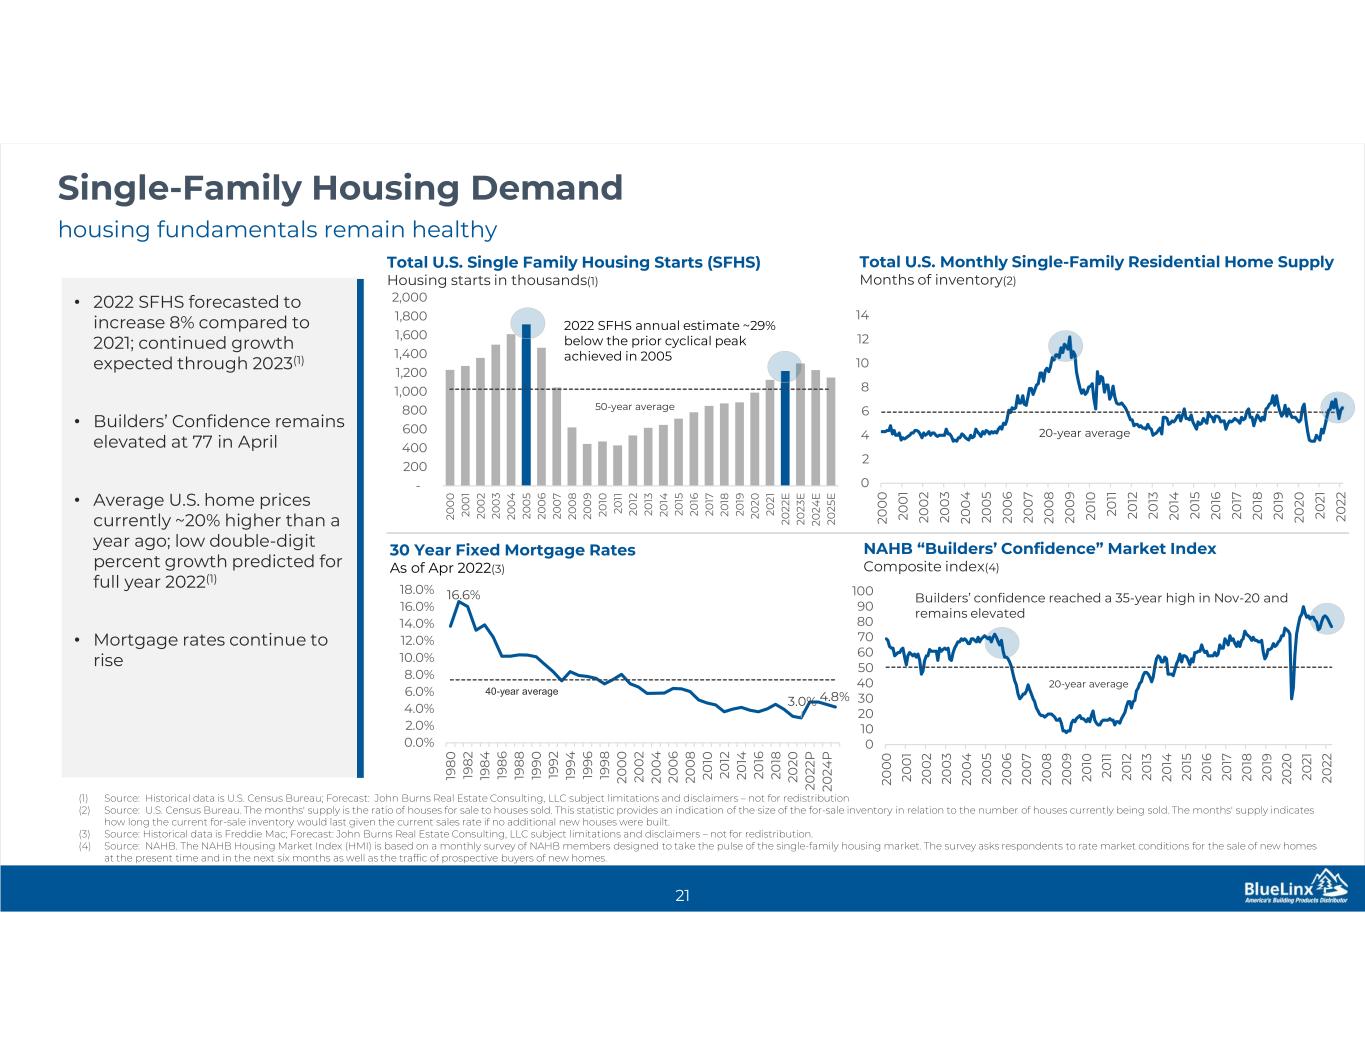
housing fundamentals remain healthy Single-Family Housing Demand 21 Total U.S. Monthly Single-Family Residential Home Supply Months of inventory(2) NAHB “Builders’ Confidence” Market Index Composite index(4) Builders’ confidence reached a 35-year high in Nov-20 and remains elevated 50-year average 20-year average 20-year average 30 Year Fixed Mortgage Rates As of Apr 2022(3) - 200 400 600 800 1,000 1,200 1,400 1,600 1,800 2,000 20 0 0 20 0 1 20 0 2 20 0 3 20 0 4 20 0 5 20 0 6 20 0 7 20 0 8 20 0 9 20 10 20 11 20 12 20 13 20 14 20 15 20 16 20 17 20 18 20 19 20 20 20 21 20 22 E 20 23 E 20 24 E 20 25 E Total U.S. Single Family Housing Starts (SFHS) Housing starts in thousands(1) 0 2 4 6 8 10 12 14 20 0 0 20 0 1 20 0 2 20 0 3 20 0 4 20 0 5 20 0 6 20 0 7 20 0 8 20 0 9 20 10 20 11 20 12 20 13 20 14 20 15 20 16 20 17 20 18 20 19 20 20 20 21 20 22 0 10 20 30 40 50 60 70 80 90 100 20 0 0 20 0 1 20 0 2 20 0 3 20 0 4 20 0 5 20 0 6 20 0 7 20 0 8 20 0 9 20 10 20 11 20 12 20 13 20 14 20 15 20 16 20 17 20 18 20 19 20 20 20 21 20 22 16.6% 3.0% 4.8% 0.0% 2.0% 4.0% 6.0% 8.0% 10.0% 12.0% 14.0% 16.0% 18.0% 19 8 0 19 8 2 19 8 4 19 8 6 19 8 8 19 9 0 19 9 2 19 9 4 19 9 6 19 9 8 20 0 0 20 0 2 20 0 4 20 0 6 20 0 8 20 10 20 12 20 14 20 16 20 18 20 20 20 22 P 20 24 P 40-year average • 2022 SFHS forecasted to increase 8% compared to 2021; continued growth expected through 2023(1) • Builders’ Confidence remains elevated at 77 in April • Average U.S. home prices currently ~20% higher than a year ago; low double-digit percent growth predicted for full year 2022(1) • Mortgage rates continue to rise 2022 SFHS annual estimate ~29% below the prior cyclical peak achieved in 2005 (1) Source: Historical data is U.S. Census Bureau; Forecast: John Burns Real Estate Consulting, LLC subject limitations and disclaimers – not for redistribution (2) Source: U.S. Census Bureau. The months' supply is the ratio of houses for sale to houses sold. This statistic provides an indication of the size of the for-sale inventory in relation to the number of houses currently being sold. The months' supply indicates how long the current for-sale inventory would last given the current sales rate if no additional new houses were built. (3) Source: Historical data is Freddie Mac; Forecast: John Burns Real Estate Consulting, LLC subject limitations and disclaimers – not for redistribution. (4) Source: NAHB. The NAHB Housing Market Index (HMI) is based on a monthly survey of NAHB members designed to take the pulse of the single-family housing market. The survey asks respondents to rate market conditions for the sale of new homes at the present time and in the next six months as well as the traffic of prospective buyers of new homes.


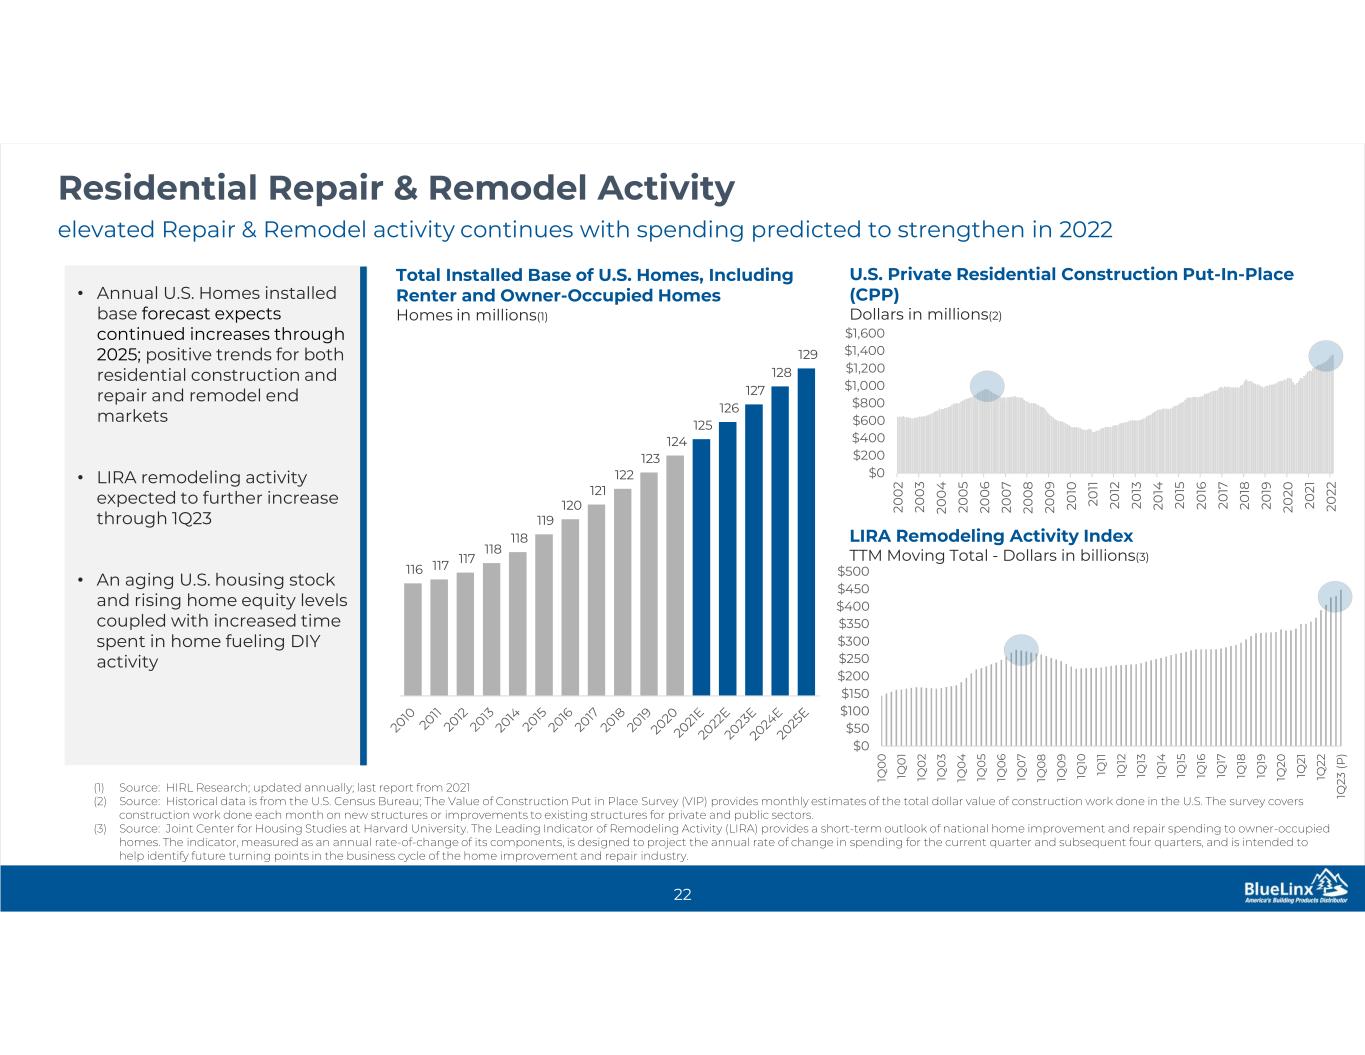
elevated Repair & Remodel activity continues with spending predicted to strengthen in 2022 Residential Repair & Remodel Activity 22 U.S. Private Residential Construction Put-In-Place (CPP) Dollars in millions(2) LIRA Remodeling Activity Index TTM Moving Total - Dollars in billions(3) Total Installed Base of U.S. Homes, Including Renter and Owner-Occupied Homes Homes in millions(1) $0 $50 $100 $150 $200 $250 $300 $350 $400 $450 $500 1Q 0 0 1Q 0 1 1Q 0 2 1Q 0 3 1Q 0 4 1Q 0 5 1Q 0 6 1Q 0 7 1Q 0 8 1Q 0 9 1Q 10 1Q 11 1Q 12 1Q 13 1Q 14 1Q 15 1Q 16 1Q 17 1Q 18 1Q 19 1Q 20 1Q 21 1Q 22 1Q 23 (P ) • Annual U.S. Homes installed base forecast expects continued increases through 2025; positive trends for both residential construction and repair and remodel end markets • LIRA remodeling activity expected to further increase through 1Q23 • An aging U.S. housing stock and rising home equity levels coupled with increased time spent in home fueling DIY activity 116 117 117 118 118 119 120 121 122 123 124 125 126 127 128 129 $0 $200 $400 $600 $800 $1,000 $1,200 $1,400 $1,600 20 0 2 20 0 3 20 0 4 20 0 5 20 0 6 20 0 7 20 0 8 20 0 9 20 10 20 11 20 12 20 13 20 14 20 15 20 16 20 17 20 18 20 19 20 20 20 21 20 22 (1) Source: HIRL Research; updated annually; last report from 2021 (2) Source: Historical data is from the U.S. Census Bureau; The Value of Construction Put in Place Survey (VIP) provides monthly estimates of the total dollar value of construction work done in the U.S. The survey covers construction work done each month on new structures or improvements to existing structures for private and public sectors. (3) Source: Joint Center for Housing Studies at Harvard University. The Leading Indicator of Remodeling Activity (LIRA) provides a short-term outlook of national home improvement and repair spending to owner-occupied homes. The indicator, measured as an annual rate-of-change of its components, is designed to project the annual rate of change in spending for the current quarter and subsequent four quarters, and is intended to help identify future turning points in the business cycle of the home improvement and repair industry.


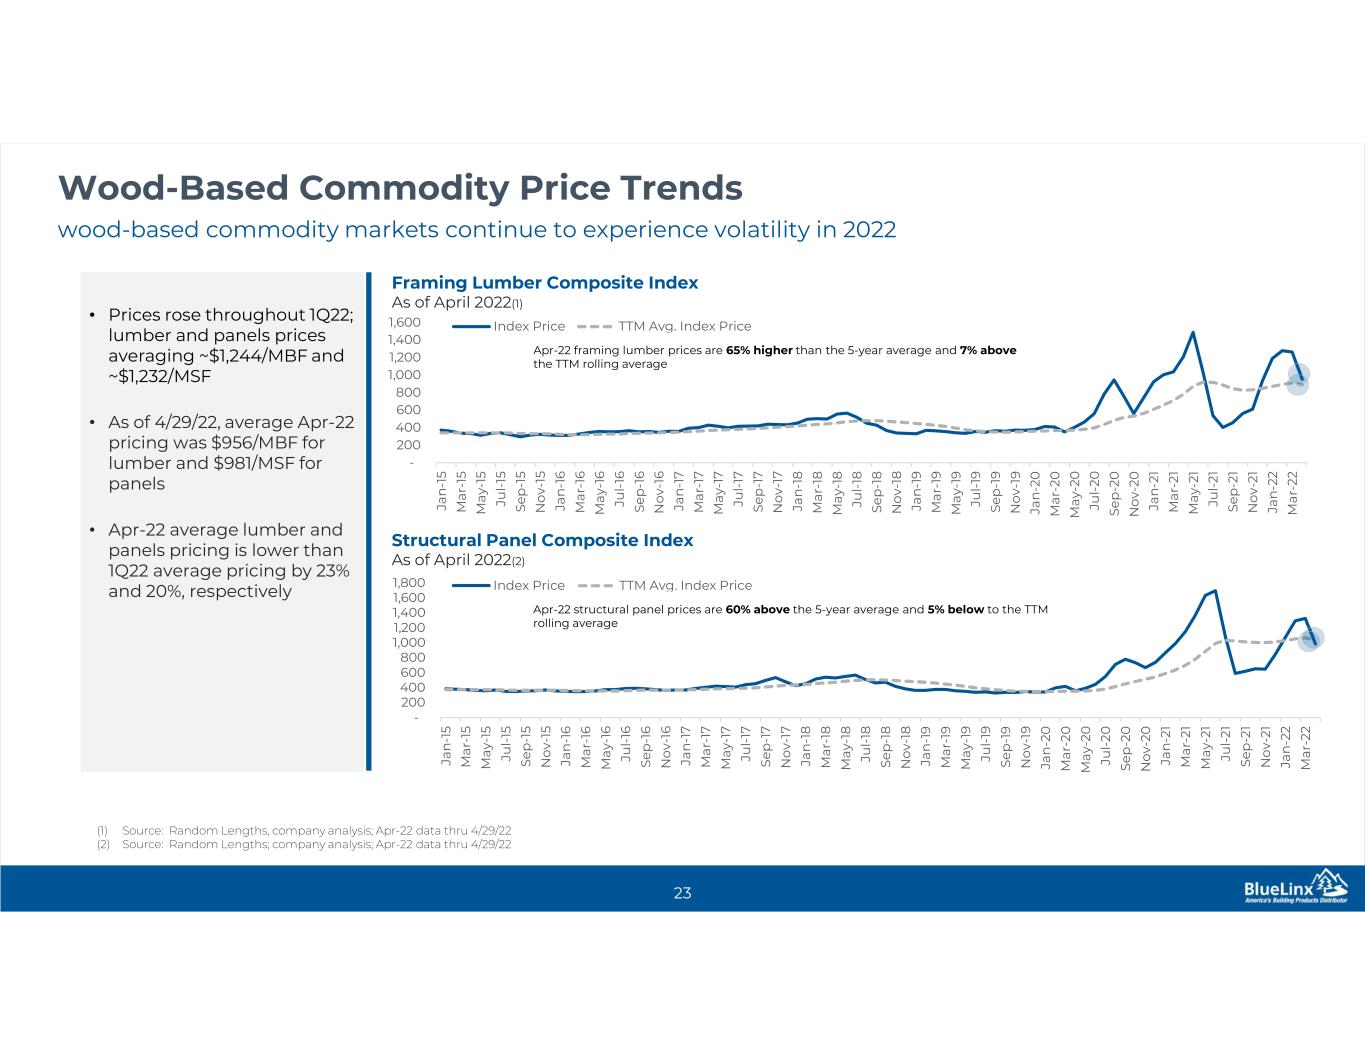
wood-based commodity markets continue to experience volatility in 2022 Wood-Based Commodity Price Trends 23 Framing Lumber Composite Index As of April 2022(1) Structural Panel Composite Index As of April 2022(2) • Prices rose throughout 1Q22; lumber and panels prices averaging ~$1,244/MBF and ~$1,232/MSF • As of 4/29/22, average Apr-22 pricing was $956/MBF for lumber and $981/MSF for panels • Apr-22 average lumber and panels pricing is lower than 1Q22 average pricing by 23% and 20%, respectively - 200 400 600 800 1,000 1,200 1,400 1,600 Ja n -1 5 M ar -1 5 M ay -1 5 Ju l- 15 S ep -1 5 N o v- 15 Ja n -1 6 M ar -1 6 M ay -1 6 Ju l- 16 S ep -1 6 N o v- 16 Ja n -1 7 M ar -1 7 M ay -1 7 Ju l- 17 S ep -1 7 N o v- 17 Ja n -1 8 M ar -1 8 M ay -1 8 Ju l- 18 S ep -1 8 N o v- 18 Ja n -1 9 M ar -1 9 M ay -1 9 Ju l- 19 S ep -1 9 N o v- 19 Ja n -2 0 M ar -2 0 M ay -2 0 Ju l- 20 S ep -2 0 N o v- 20 Ja n -2 1 M ar -2 1 M ay -2 1 Ju l- 21 S ep -2 1 N o v- 21 Ja n -2 2 M ar -2 2 Index Price TTM Avg. Index Price - 200 400 600 800 1,000 1,200 1,400 1,600 1,800 Ja n -1 5 M ar -1 5 M ay -1 5 Ju l- 15 S ep -1 5 N o v- 15 Ja n -1 6 M ar -1 6 M ay -1 6 Ju l- 16 S ep -1 6 N o v- 16 Ja n -1 7 M ar -1 7 M ay -1 7 Ju l- 17 S ep -1 7 N o v- 17 Ja n -1 8 M ar -1 8 M ay -1 8 Ju l- 18 S ep -1 8 N o v- 18 Ja n -1 9 M ar -1 9 M ay -1 9 Ju l- 19 S ep -1 9 N o v- 19 Ja n -2 0 M ar -2 0 M ay -2 0 Ju l- 20 S ep -2 0 N o v- 20 Ja n -2 1 M ar -2 1 M ay -2 1 Ju l- 21 S ep -2 1 N o v- 21 Ja n -2 2 M ar -2 2 Index Price TTM Avg. Index Price Apr-22 framing lumber prices are 65% higher than the 5-year average and 7% above the TTM rolling average Apr-22 structural panel prices are 60% above the 5-year average and 5% below to the TTM rolling average (1) Source: Random Lengths, company analysis; Apr-22 data thru 4/29/22 (2) Source: Random Lengths; company analysis; Apr-22 data thru 4/29/22


24 BlueLinx reports its financial results in accordance with GAAP. The Company also believes that presentation of certain non-GAAP measures may be useful to investors and may provide a more complete understanding of the factors and trends affecting the business than using reported GAAP results alone. Any non-GAAP measures used herein are reconciled to their most directly comparable GAAP measures herein or in the financial tables accompanying this news release. The Company cautions that non-GAAP measures should be considered in addition to, but not as a substitute for, the Company’s reported GAAP results. Adjusted EBITDA and Adjusted EBITDA Margin. BlueLinx defines Adjusted EBITDA as an amount equal to net income (loss) plus interest expense and all interest expense related items, income taxes, depreciation and amortization, and further adjusted for certain non-cash items and other special items, including compensation expense from share based compensation, one-time charges associated with the legal, consulting, and professional fees related to our merger and acquisition activities, gains or losses on sales of properties, amortization of deferred gains on real estate, and expense associated with our restructuring activities, such as severance, in addition to other significant and/or one-time, nonrecurring, non-operating items The Company presents Adjusted EBITDA because it is a primary measure used by management to evaluate operating performance. Management believes this metric helps to enhance investors’ overall understanding of the financial performance and cash flows of the business. Management also believes Adjusted EBITDA is helpful in highlighting operating trends. Adjusted EBITDA is frequently used by securities analysts, investors, and other interested parties in their evaluation of companies, many of which present an Adjusted EBITDA measure when reporting their results. We determine our Adjusted EBITDA Margin, which we sometimes refer to as our Adjusted EBITDA as a percentage of net sales, by dividing our Adjusted EBITDA for the applicable period by our net sales for the applicable period. We believe that this ratio is useful to investors because it more clearly defines the quality of earnings and operational efficiency of translating sales to profitability. Our Adjusted EBITDA and Adjusted EBITDA Margin are not presentations made in accordance with GAAP and are not intended to present superior measures of our financial condition from those measures determined under GAAP. Adjusted EBITDA and Adjusted EBITDA Margin, as used herein, are not necessarily comparable to other similarly titled captions of other companies due to differences in methods of calculation. These non-GAAP measures are reconciled in the “Reconciliation of Non-GAAP Measurements” table later in this release. Free Cash Flow. BlueLinx defines free cash flow as net cash provided by operating activities less total capital expenditures. Free cash flow is a measure used by management to assess our financial performance, and we believe it is useful for investors because it relates the operating cash flow of the company to the capital that is spent to continue and improve business operations. In particular, free cash flow indicates the amount of cash generated after capital expenditures that can be used for, among other things, investment in our business, strengthening our balance sheet, and repayment of our debt obligations. Free cash flow does not represent the residual cash flow available for discretionary expenditures since there may be other nondiscretionary expenditures that are not deducted from the measure. Free cash flow is not a presentation made in accordance with GAAP and is not intended to present a superior measure of financial condition from those determined under GAAP. Free cash flow, as used herein, is not necessarily comparable to other similarly titled captions of other companies due to differences in methods of calculation. This non-GAAP measure is reconciled in the “Reconciliation of Non-GAAP Measurements” table later in this release. Net Debt and Net Leverage Ratio. BlueLinx calculates net debt as its total short- and long-term debt, including outstanding balances under our term loan and revolving credit facility and the total amount of its obligations under financing leases, less cash and cash equivalents. We believe that net debt is useful to investors because our management reviews our net debt as part of its management of overall liquidity, financial flexibility, capital structure and leverage, and creditors and credit analysts monitor our net debt as part of their assessments of our business. We determine our overall net leverage ratio by dividing our net debt by trailing twelve-month Adjusted EBITDA. We believe that this ratio is useful to investors because it is an indicator of our ability to meet our future financial obligations. In addition, the ratio is a measure that is frequently used by investors and creditors. Our net debt and overall net leverage ratio are not presentations made in accordance with GAAP and are not intended to present a superior measure of our financial condition from measures and ratios determined under GAAP. In addition, our net debt and overall net leverage ratio, as used herein, are not necessarily comparable to other similarly titled captions of other companies due to differences in methods of calculation. This non-GAAP measure is reconciled in the “Reconciliation of Non-GAAP Measurements” table later in this presentation. Non-GAAP Measures


Non-GAAP Reconciliation 25 Net income (loss) $ 133,409 $ 61,860 Adjustments: Depreciation and amortization 6,746 7,465 Interest expense, net 11,293 10,443 Adjustment to debt issuance cost associated with term loan(1) - 5,791 Provision for income taxes 47,322 21,746 Share-based compensation expense 2,162 1,410 Amortization of deferred gain on real estate (984) (984) Gain from sales of property(1) - (1,287) Restructuring and other (1) 2,338 113 Adjusted EBITDA $ 202,286 $ 106,557 Quarter Ended March 2022 March 2021 (1) Reflects non-recurring items of approximately $2.3 million in beneficial items to the current quarter and approximately $4.6 million in beneficial items to the same quarterly period of the prior year. (2) Reflects costs related to our restructuring efforts, such as severance, and other one-time non-operating items.


Non-GAAP Reconciliation 26 Net income (loss) $ 133,409 $ 73,620 $ 47,198 $ 113,458 $ 61,860 $ 19,858 Adjustments: Depreciation and amortization 6,746 6,763 6,884 7,080 7,465 7,116 Interest expense, net 11,293 10,213 8,313 9,143 10,443 10,723 Adjustment to debt issuance cost associated with term loan/revolver(1) - 1,603 - - 5,791 - Provision for income taxes 47,322 24,857 16,232 34,908 21,746 (15) Share-based compensation expense 2,162 1,580 1,608 1,992 1,410 3,077 Amortization of deferred gain on real estate (984) (985) (984) (984) (984) (1,057) Gain from sales of property(1) - (7,140) - - (1,287) (1,320) Real estate financing costs(1) - - - - - - Merger and acquisition costs (1)(2) - - 214 - - 106 Restructuring and other (1) 2,338 1,460 (391) 872 113 58 Adjusted EBITDA $ 202,286 $ 111,971 $ 79,074 $ 166,469 $ 106,557 $ 38,546 Net Sales $ 1,302,305 $ 972,954 $ 970,842 $ 1,307,913 $ 1,025,469 $ 865,419 Adjusted EBITDA 202,286 111,971 79,074 166,469 106,557 38,546 Adjusted EBITDA Margin 15.5% 11.5% 8.1% 12.7% 10.4% 4.5% Quarter Ended (2) Reflects costs related to our restructuring efforts, such as severance, and other one-time non-operating items. (1) Reflects non-recurring items of approximately $2.3 million in beneficial items to the current quarter and approximately $4.6 million in beneficial items to the same quarterly period of the prior year. December 2021 September 2021 June 2021 March 2021 December 2020March 2022 (In thousands)


Non-GAAP Reconciliation 27 Net income (loss) $ 367,685 $ 296,133 $ 242,374 $ 250,292 $ 143,529 $ 80,882 $ 50,829 $ (11,330) $ (11,724) $ (17,656) $ (23,633) $ (26,486) Adjustments: Depreciation and amortization 27,473 28,192 28,546 Interest expense, net 38,962 38,113 38,621 Term loan/Revolver debt issuance costs(1) 1,603 7,394 5,791 Provision for income taxes 123,319 97,743 72,872 Share-based compensation expense 7,342 6,590 8,087 Amortization of deferred gain on real estate (3,937) (3,935) (4,009) Gain from sales of property(1) (7,140) (8,427) (2,607) Real estate financing costs(1) - - - Merger and acquisition costs (1)(2) 214 214 320 Restructuring and other (1) 4,278 2,054 652 Adjusted EBITDA $ 559,799 $ 464,071 $ 390,647 $ 392,353 $ 257,088 $ 170,394 $ 142,775 $ 80,964 $ 74,698 $ 71,430 $ 67,294 $ 64,934 Trailing Twelve Months for the Quarter Ended 854 2,637 (12,493) (3,847) 3,012 December 2021 1,793 3,097 - 5,791 June 2021 28,748 41,085 5,791 72,441 7,536 (4,009) - - - 10,193 (5,365) - 1,793 1,793 1,793 2,592 - (3,952) (4,200) (11,732) 2,890 3,109 - (9,760) 3,649 (6,453) (4,027) (3,960) (4,273) 30,548 50,382 53,015 10,455 4,788 7,131 10,715 14,224 17,674 19,017 - March 2021 (1) Reflects non-recurring items of approximately $2.3 million and $4.6 million of non-beneficial items to the quarterly periods of the current and prior year, respectively. For the year-to-date periods, reflects non-recurring items of approximately $5 million and $6 million of non-beneficial items, respectively. For more details on the portions of these TTM results reported which are non-recurring in the current quarter, please consult our press release. (3) Reflects costs related to our restructuring efforts, such as severance, net of other one-time non-operating items. For the purposes of this presentation, items may be collapsed into this or other categories where they were presented seperately in other presentations such as our press release. Items which may be collapsed include, but are not limited to, pension settlement and withdrawal costs and inventory step-up adjustments, among others. 5,992 (4,008) (10,529) 1,924 3,826 (2) Reflects primarily legal, professional and other integration costs related to the Cedar Creek acquisition. 8,602 10,386 9,342 8,814 4,489 6,398 (4,009) (13,607) (13,082) (9,798) - 1,515 245 (3,994) 30,232 30,057 (11,291) 14,199 June 2019December 2020 28,901 47,414 55,197 54,218 53,881 (4,502) (In thousands) March 2022 September 2020 - - - (11,291) (3,940) September 2021 28,731 43,477 40,971 June 2020 December 2019 September 2019March 2020 53,745 29,609 30,099 30,539


Non-GAAP Reconciliation 28 Net cash provided (used) by Operations(1) Property and equipment investments (2,509) (8,991) (2,524) Free Cash Flow $ (272) $ 9,173 $ 101,734 $ 45,388 $ (25,687) $ (21,123) $ 61,304 $ 71,581 $ (60,432) $ 25,849 $ 13,889 $ 4,711 (561) December 2021 $ 18,164 December 2019 September 2019 June 2019 $ 61,495 $ 72,088 $ (59,187) December 2020 $ (19,377) September 2020 June 2020 March 2020 (1) Net cash provided (used) by Operations includes items contained within the current presentation of our statement of cash flows for all periods presented and may differ from past presentations. Please consult our Form 10-Q for more information on presentation of items within our consolidated statements of cash flows. (191) (507) (1,245) (1,470) (1,537)(1,746)(1,778) (1,122) March 2022 $ 2,237 Free Cash Flow for the Quarter Ended September 2021 $ 104,258 $ 27,319 June 2021 $ 47,166 March 2021 $ (24,565) (In thousands) $ 15,426 $ 5,272


Non-GAAP Reconciliation 29 Current maturities of long-term debt, gross of debt issuance costs $ - $ - $ - $ - $ - $ 1,245 $ 1,609 $ 2,250 $ 2,250 $ 2,250 $ 1,864 $ 1,491 Finance lease liabilities - short term Long-term debt, gross of debt issuance costs Finance lease liabiities - long-term(1) Total Long-Term Debt $ 571,940 $ 574,717 $ 500,069 $ 599,606 $ 639,788 $ 604,559 $ 594,010 $ 663,625 $ 734,164 $ 671,080 $ 710,398 $ 713,445 Less: Available Cash Net Debt $ 497,502 $ 489,514 $ 499,883 $ 599,427 $ 639,609 $ 604,477 $ 583,856 $ 652,095 $ 721,606 $ 659,437 $ 697,551 $ 700,783 Trailing Twelve Month Adjusted EBITDA Net Leverage Ratio Net Debt and Net Leverage Ratio for the Trailing Twelve Months for the Quarter Ended 1.5x June 2021 6,379 320,410 272,817 December 2021 7,864 300,000 266,853 85,203 464,071 1.1x 12,558 11,643 12,847 12,662 273,815 179 392,353 (1) Finance lease liabilities - long-term include the combination of finance lease liabilities, long-term, and real estate finance obligations in those periods when real estate finance obligations were presented. 4.1x 8.1x 9.7x 9.2x 10.4x 10.8x 179 257,088 2.5x 142,775 80,964 74,698 71,430 67,294 64,934 10,154 11,530 (In thousands) March 2021 7,459 358,514 5,675 330,206 267,753 266,622 269,192 191,525 199,983 188,938 82 170,394 3.5x December 2020 267,433 8,166 September 2020 June 2020 March 2020 December 2019 September 2019 June 2019 5,469 5,958 5,924 6,385 8,373 0.9x 186 390,647 1.3x September 2021 5,606 223,149 271,314 March 2022 7,264 300,000 264,676 74,438 559,799 514,850 319,179 388,795 456,798 470,920 500,178