NEW YORK — May 12, 2022 — Blackstone Secured Lending Fund (NYSE: BXSL, or the “Company”) today reported its first quarter 2022 results. Brad Marshall, Chief Executive Officer of Blackstone Secured Lending Fund, said, “BXSL reported strong first-quarter results, delivering an attractive total return and yield for its investors. Results showcase BXSL’s high quality portfolio, which is predominantly first lien senior secured floating rate loans – all of which are performing. We declared a regular dividend in the first quarter that represents an 8% annualized yield on ending net asset value, in addition to special dividends for both the quarter and scheduled for later this year. We’re excited about the future, given a portfolio and liability structure that are well positioned for this environment.” Blackstone Secured Lending Fund issued a full detailed presentation of its first quarter 2022 results, which can be viewed at www.bxsl.com. Dividend Declaration The Company’s Board of Trustees has declared a quarterly dividend of $0.53 per share to shareholders of record as of June 30, 2022, payable on August 12, 2022. Quarterly Investor Call Details Blackstone Secured Lending Fund will host its conference call today at 9:00 a.m. ET to discuss results. To register for the webcast, please use the following link: https://event.webcasts.com/starthere.jsp?ei=1546360&tp_key=aed62de0e3. Blackstone Secured Lending Fund 345 Park Avenue New York, NY 10154 T 212 583 5000 Blackstone Secured Lending Fund Reports First Quarter 2022 Results Exhibit 99.1
2 For those unable to listen to the live broadcast, there will be a webcast replay on the Shareholders section of BXSL’s website at https://ir.bxsl.com. About Blackstone Secured Lending Fund Blackstone Secured Lending Fund (NYSE:BXSL) is a specialty finance company that invests primarily in the debt of private US companies. As of March 31, 2022, BXSL’s fair value of investments was $10.0 billion. BXSL has elected to be regulated as a business development company under the Investment Company Act of 1940, as amended. BXSL is externally managed by Blackstone Credit BDC Advisors LLC, an SEC-registered investment adviser that is an affiliate of Blackstone Inc. Blackstone Inc., together with its subsidiaries, is the world’s largest alternative investment firm with $915 billion of assets under management as of March 31, 2022. Forward-Looking Statements and Other Matters This presentation contains forward-looking statements within the meaning of Section 27A of the Securities Act of 1933, as amended, and Section 21E of the Securities Exchange Act of 1934, as amended. You can identify these forward-looking statements by the use of words such as “outlook,” “objective,” “indicator,” “believes,” “expects,” “potential,” “continues,” “may,” “will,” “should,” “seeks,” “predicts,” “intends,” “plans,” “estimates,” “anticipates” or the negative version of these words or other comparable words. Such forward-looking statements are subject to various risks and uncertainties. Accordingly, there are or will be important factors that could cause actual outcomes or results to differ materially from those indicated in these statements. The Company believes these factors include but are not limited to those described under the section entitled “Risk Factors” in its Annual Report on Form 10-K for the fiscal year ended December 31, 2021, as such factors may be updated from time to time in its periodic filings with the SEC which are accessible on the SEC’s website at www.sec.gov. These factors should not be construed as exhaustive and should be read in conjunction with the other cautionary statements that are included in this release and in the filings. The Company assumes no obligation to update or supplement forward-looking statements that become untrue because of subsequent events or circumstances. Contacts Media Mariel Seidman-Gati [email protected] +1 917-698-1674 Investors Michael Needham [email protected] +1 888-756-8443
BXSL – Quarter Ended December 31, 2021 Blackstone Secured Lending Fund First Quarter 2022 Results May 12, 2022 This presentation should be read in conjunction with BXSL’s latest quarterly report filed on Form 10-Q for the period ended March 31, 2022. Numbers are approximate and may not add up due to rounding.
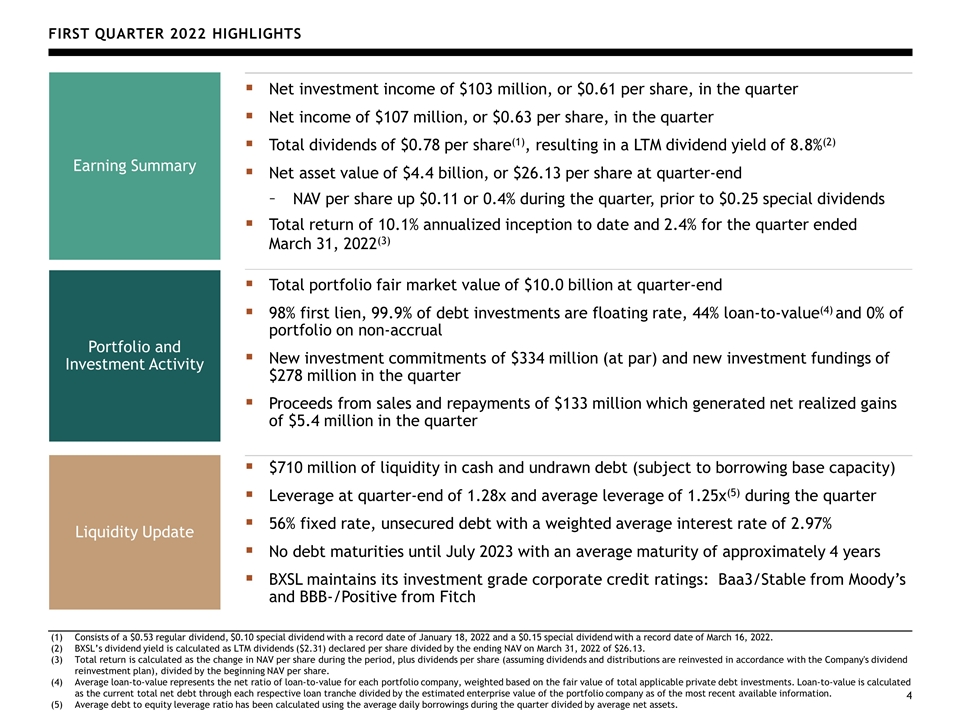
First quarter 2022 Highlights 4 Consists of a $0.53 regular dividend, $0.10 special dividend with a record date of January 18, 2022 and a $0.15 special dividend with a record date of March 16, 2022. BXSL’s dividend yield is calculated as LTM dividends ($2.31) declared per share divided by the ending NAV on March 31, 2022 of $26.13. Total return is calculated as the change in NAV per share during the period, plus dividends per share (assuming dividends and distributions are reinvested in accordance with the Company's dividend reinvestment plan), divided by the beginning NAV per share. Average loan-to-value represents the net ratio of loan-to-value for each portfolio company, weighted based on the fair value of total applicable private debt investments. Loan-to-value is calculated as the current total net debt through each respective loan tranche divided by the estimated enterprise value of the portfolio company as of the most recent available information. Average debt to equity leverage ratio has been calculated using the average daily borrowings during the quarter divided by average net assets. Earning Summary Net investment income of $103 million, or $0.61 per share, in the quarter Net income of $107 million, or $0.63 per share, in the quarter Total dividends of $0.78 per share(1), resulting in a LTM dividend yield of 8.8%(2) Net asset value of $4.4 billion, or $26.13 per share at quarter-end NAV per share up $0.11 or 0.4% during the quarter, prior to $0.25 special dividends Total return of 10.1% annualized inception to date and 2.4% for the quarter ended March 31, 2022(3) Portfolio and Investment Activity Total portfolio fair market value of $10.0 billion at quarter-end 98% first lien, 99.9% of debt investments are floating rate, 44% loan-to-value(4) and 0% of portfolio on non-accrual New investment commitments of $334 million (at par) and new investment fundings of $278 million in the quarter Proceeds from sales and repayments of $133 million which generated net realized gains of $5.4 million in the quarter Liquidity Update $710 million of liquidity in cash and undrawn debt (subject to borrowing base capacity) Leverage at quarter-end of 1.28x and average leverage of 1.25x(5) during the quarter 56% fixed rate, unsecured debt with a weighted average interest rate of 2.97% No debt maturities until July 2023 with an average maturity of approximately 4 years BXSL maintains its investment grade corporate credit ratings: Baa3/Stable from Moody’s and BBB-/Positive from Fitch
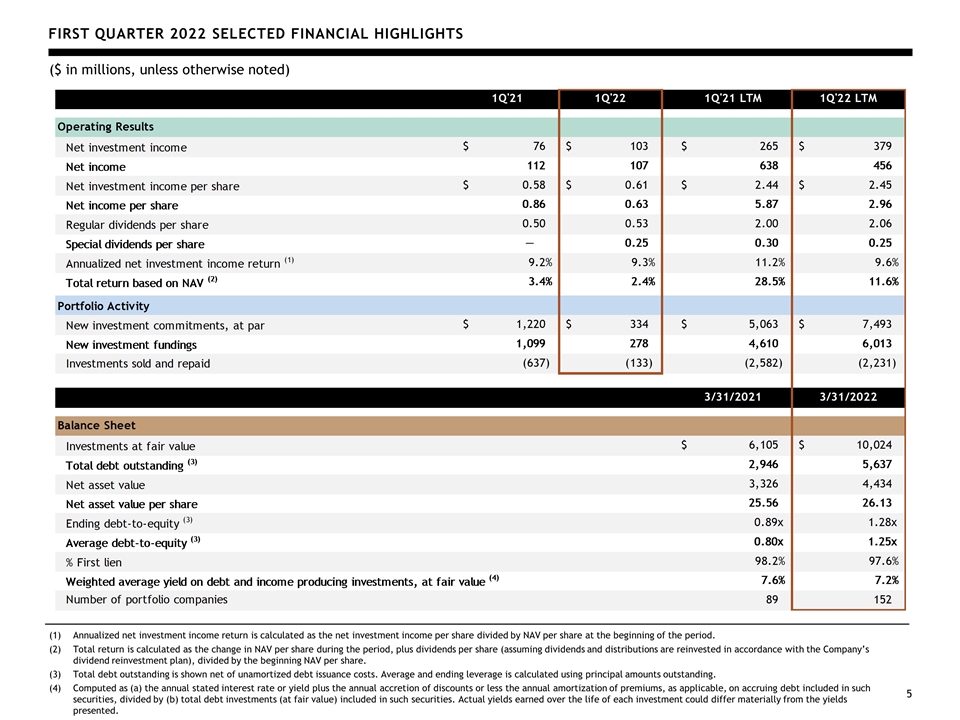
First quarter 2022 selected financial highlights ($ in millions, unless otherwise noted) Notes on page 19 5 Annualized net investment income return is calculated as the net investment income per share divided by NAV per share at the beginning of the period. Total return is calculated as the change in NAV per share during the period, plus dividends per share (assuming dividends and distributions are reinvested in accordance with the Company’s dividend reinvestment plan), divided by the beginning NAV per share. Total debt outstanding is shown net of unamortized debt issuance costs. Average and ending leverage is calculated using principal amounts outstanding. Computed as (a) the annual stated interest rate or yield plus the annual accretion of discounts or less the annual amortization of premiums, as applicable, on accruing debt included in such securities, divided by (b) total debt investments (at fair value) included in such securities. Actual yields earned over the life of each investment could differ materially from the yields presented.
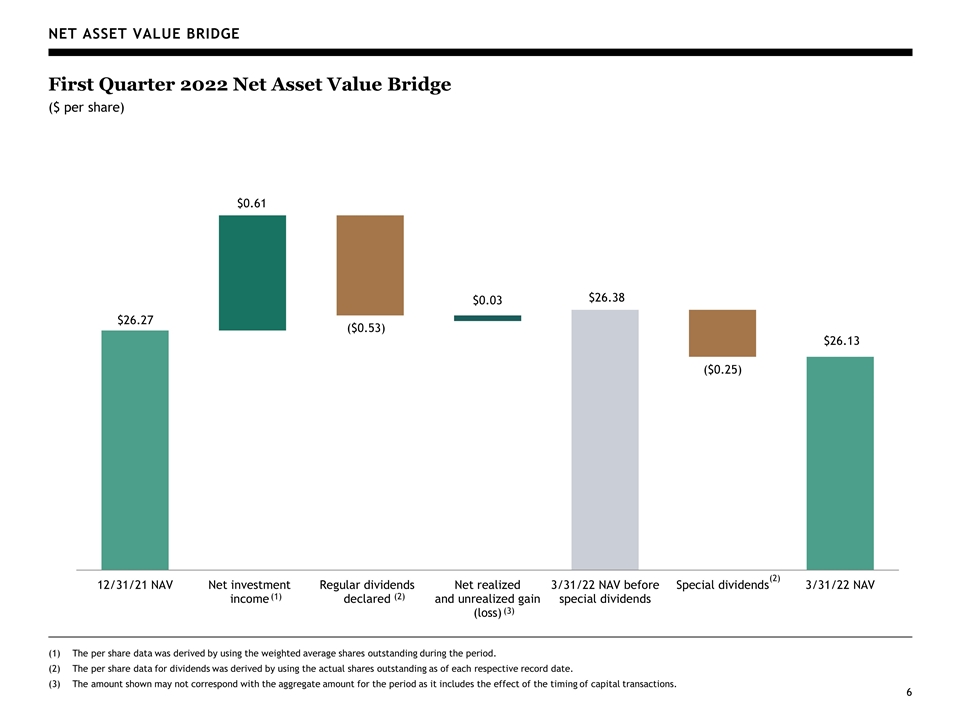
Net Asset Value Bridge First Quarter 2022 Net Asset Value Bridge ($ per share) 6 The per share data was derived by using the weighted average shares outstanding during the period. The per share data for dividends was derived by using the actual shares outstanding as of each respective record date. The amount shown may not correspond with the aggregate amount for the period as it includes the effect of the timing of capital transactions. (1) (2) (3) (2)
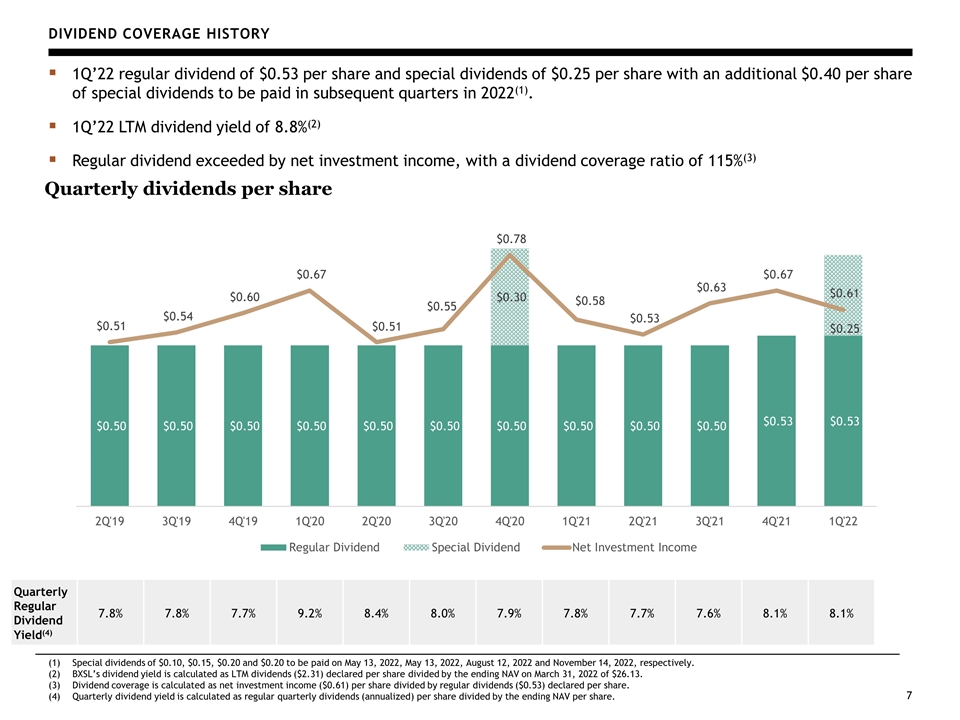
Dividend Coverage History 1Q’22 regular dividend of $0.53 per share and special dividends of $0.25 per share with an additional $0.40 per share of special dividends to be paid in subsequent quarters in 2022(1). 1Q’22 LTM dividend yield of 8.8%(2) Regular dividend exceeded by net investment income, with a dividend coverage ratio of 115%(3) Quarterly dividends per share Special dividends of $0.10, $0.15, $0.20 and $0.20 to be paid on May 13, 2022, May 13, 2022, August 12, 2022 and November 14, 2022, respectively. BXSL’s dividend yield is calculated as LTM dividends ($2.31) declared per share divided by the ending NAV on March 31, 2022 of $26.13. Dividend coverage is calculated as net investment income ($0.61) per share divided by regular dividends ($0.53) declared per share. Quarterly dividend yield is calculated as regular quarterly dividends (annualized) per share divided by the ending NAV per share. 7 Changes to Slide: Changed format to roadshow style - Added dividend yield Click icon to add SmartArt graphic Quarterly Regular Dividend Yield(4) 7.8% 7.8% 7.7% 9.2% 8.4% 8.0% 7.9% 7.8% 7.7% 7.6% 8.1% 8.1%
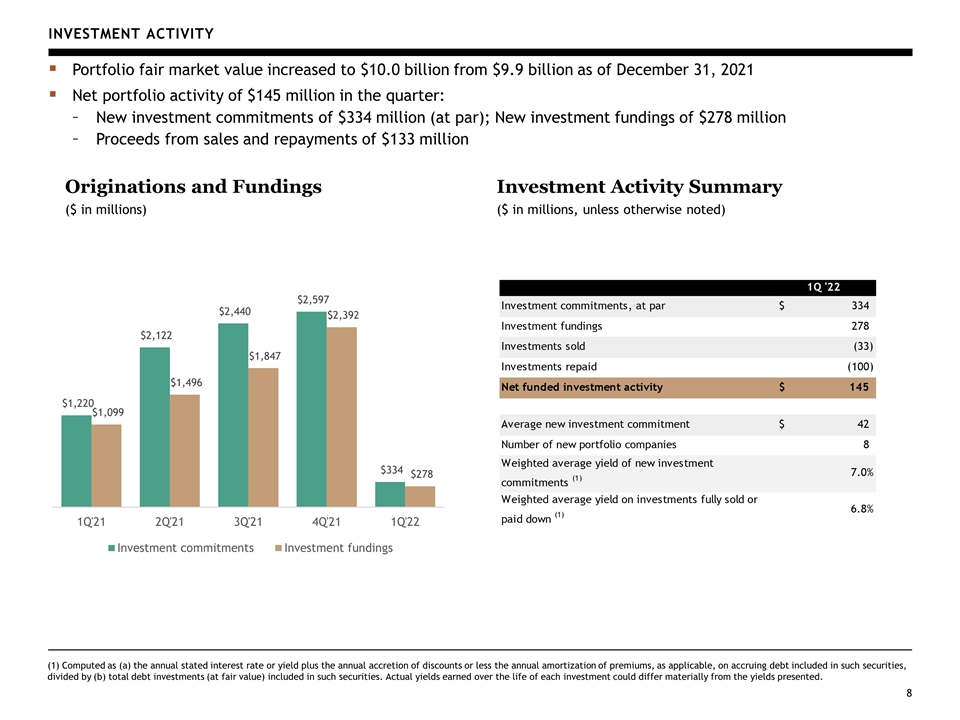
Investment Activity Portfolio fair market value increased to $10.0 billion from $9.9 billion as of December 31, 2021 Net portfolio activity of $145 million in the quarter: New investment commitments of $334 million (at par); New investment fundings of $278 million Proceeds from sales and repayments of $133 million Originations and Fundings ($ in millions) 8 Investment Activity Summary ($ in millions, unless otherwise noted) (1) Computed as (a) the annual stated interest rate or yield plus the annual accretion of discounts or less the annual amortization of premiums, as applicable, on accruing debt included in such securities, divided by (b) total debt investments (at fair value) included in such securities. Actual yields earned over the life of each investment could differ materially from the yields presented.
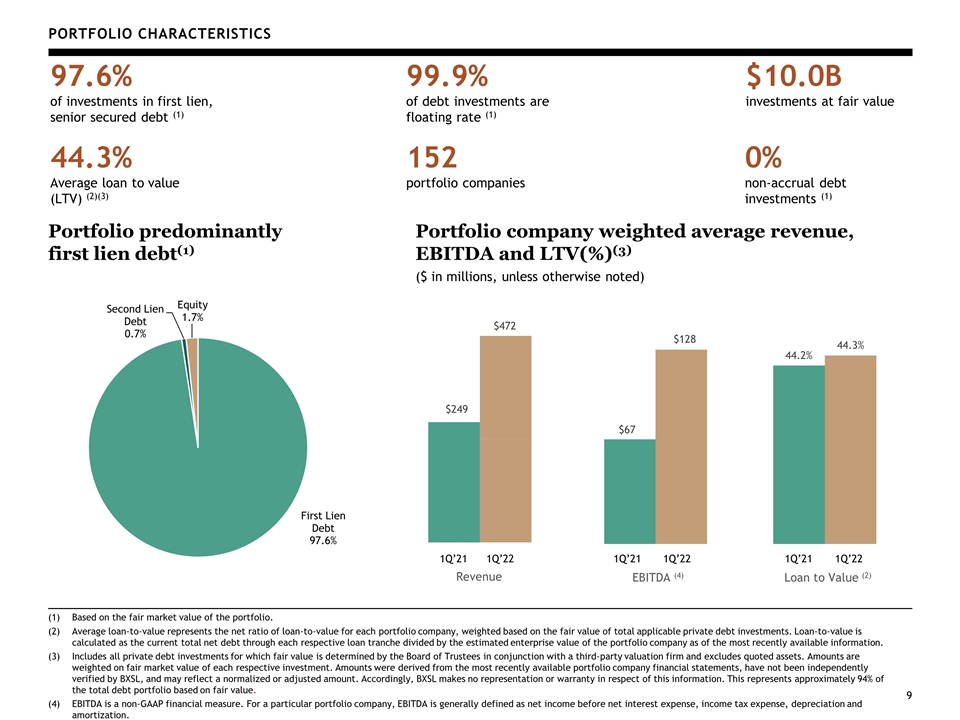
Portfolio Characteristics Portfolio predominantly first lien debt(1) 9 $10.0B investments at fair value 152 portfolio companies 0% non-accrual debt investments (1) 99.9% of debt investments are floating rate (1) 97.6% of investments in first lien, senior secured debt (1) 44.3% Average loan to value (LTV) (2)(3) Based on the fair market value of the portfolio. Average loan-to-value represents the net ratio of loan-to-value for each portfolio company, weighted based on the fair value of total applicable private debt investments. Loan-to-value is calculated as the current total net debt through each respective loan tranche divided by the estimated enterprise value of the portfolio company as of the most recently available information. Includes all private debt investments for which fair value is determined by the Board of Trustees in conjunction with a third-party valuation firm and excludes quoted assets. Amounts are weighted on fair market value of each respective investment. Amounts were derived from the most recently available portfolio company financial statements, have not been independently verified by BXSL, and may reflect a normalized or adjusted amount. Accordingly, BXSL makes no representation or warranty in respect of this information. This represents approximately 94% of the total debt portfolio based on fair value. EBITDA is a non-GAAP financial measure. For a particular portfolio company, EBITDA is generally defined as net income before net interest expense, income tax expense, depreciation and amortization. Portfolio company weighted average revenue, EBITDA and LTV(%)(3) ($ in millions, unless otherwise noted) 1Q’21 1Q’21 1Q’21 1Q’22 1Q’22 1Q’22
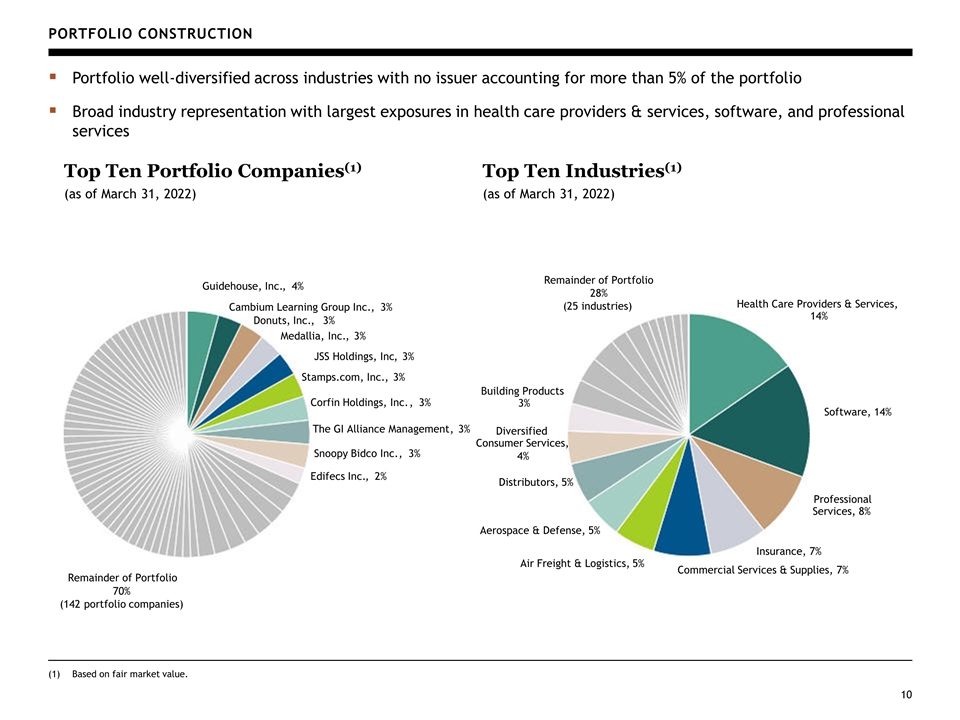
Portfolio Construction Based on fair market value. Portfolio well-diversified across industries with no issuer accounting for more than 5% of the portfolio Broad industry representation with largest exposures in health care providers & services, software, and professional services Top Ten Portfolio Companies(1) (as of March 31, 2022) Top Ten Industries(1) (as of March 31, 2022) 10 Guidehouse, Inc. , 4% Cambium Learning Group Inc. , 3% Donuts, Inc. , 3% Medallia, Inc. , 3% JSS Holdings, Inc , 3% Stamps.com, Inc. , 3% Corfin Holdings, Inc. , 3% The GI Alliance Management , 3% Snoopy Bidco Inc. , 3% Edifecs Inc. , 2% Remainder of Portfolio 70% (142 portfolio companies) Health Care Providers & Services, 14% Software, 14% Professional Services, 8% Insurance, 7% Commercial Services & Supplies, 7% Air Freight & Logistics, 5% Aerospace & Defense, 5% Distributors, 5% Diversified Consumer Services, 4% Building Products 3% Remainder of Portfolio 28% (25 industries)
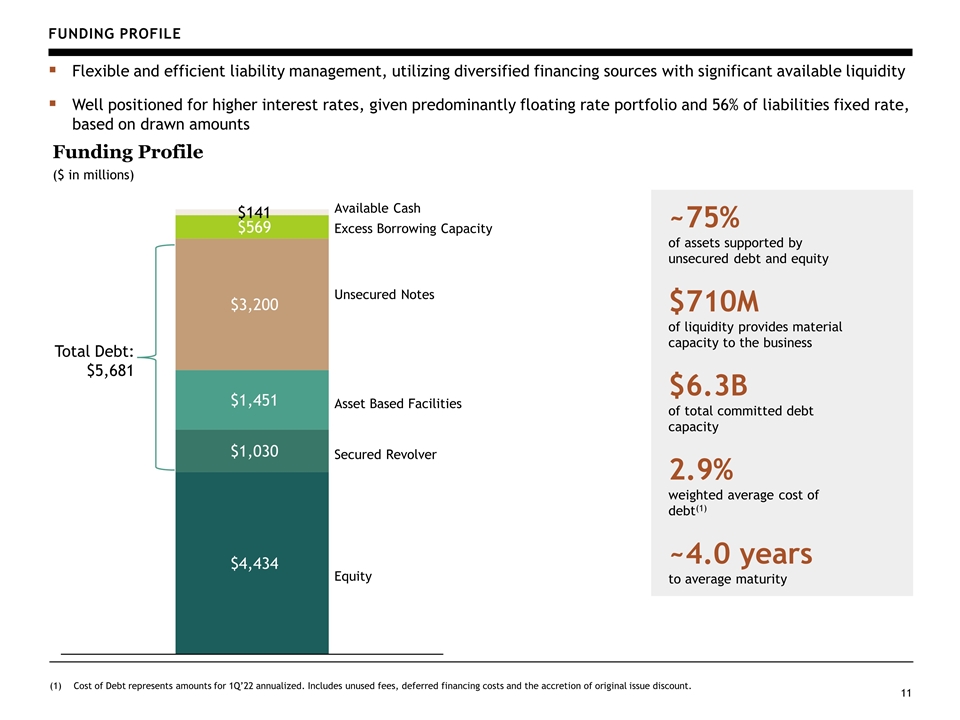
(1)Cost of Debt represents amounts for 1Q’22 annualized. Includes unused fees, deferred financing costs and the accretion of original issue discount. Funding Profile 11 Funding Profile ($ in millions) ~75% of assets supported by unsecured debt and equity ~4.0 years to average maturity Flexible and efficient liability management, utilizing diversified financing sources with significant available liquidity Well positioned for higher interest rates, given predominantly floating rate portfolio and 56% of liabilities fixed rate, based on drawn amounts 2.9% weighted average cost of debt(1) $710M of liquidity provides material capacity to the business $6.3B of total committed debt capacity Available Cash Excess Borrowing Capacity Unsecured Notes Asset Based Facilities Secured Revolver Equity Total Debt: $5,681
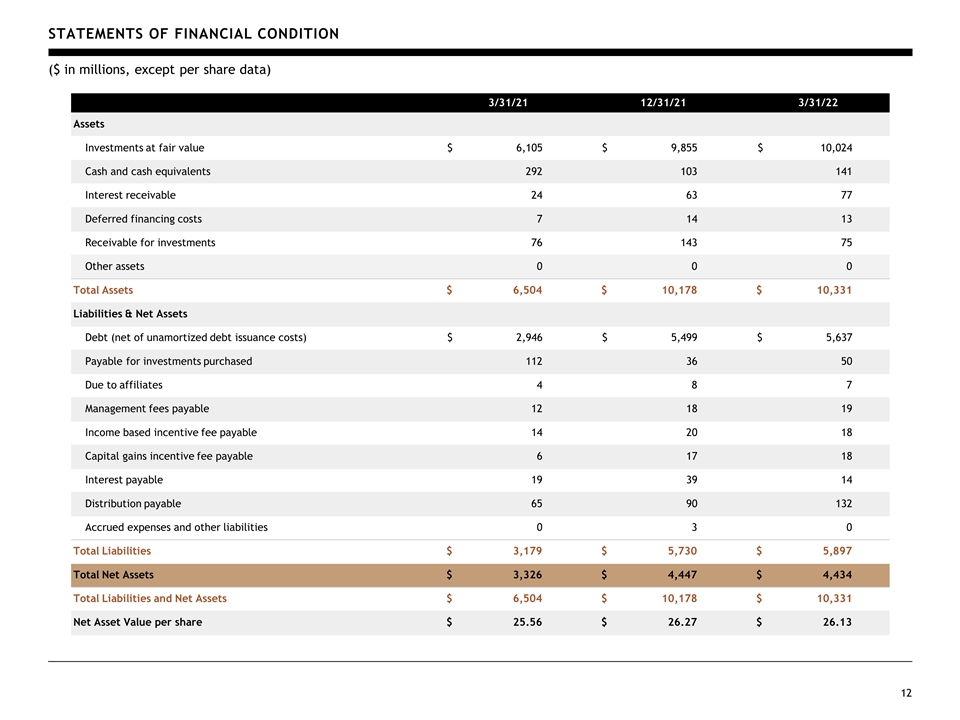
12 StatementS of Financial Condition ($ in millions, except per share data) 3/31/21 12/31/21 3/31/22 Assets Investments at fair value $ 6,105 $ 9,855 $ 10,024 Cash and cash equivalents 292 103 141 Interest receivable 24 63 77 Deferred financing costs 7 14 13 Receivable for investments 76 143 75 Other assets 0 0 0 Total Assets $ 6,504 $ 10,178 $ 10,331 Liabilities & Net Assets Debt (net of unamortized debt issuance costs) $ 2,946 $ 5,499 $ 5,637 Payable for investments purchased 112 36 50 Due to affiliates 4 8 7 Management fees payable 12 18 19 Income based incentive fee payable 14 20 18 Capital gains incentive fee payable 6 17 18 Interest payable 19 39 14 Distribution payable 65 90 132 Accrued expenses and other liabilities 0 3 0 Total Liabilities $ 3,179 $ 5,730 $ 5,897 Total Net Assets $ 3,326 $ 4,447 $ 4,434 Total Liabilities and Net Assets $ 6,504 $ 10,178 $ 10,331 Net Asset Value per share $ 25.56 $ 26.27 $ 26.13
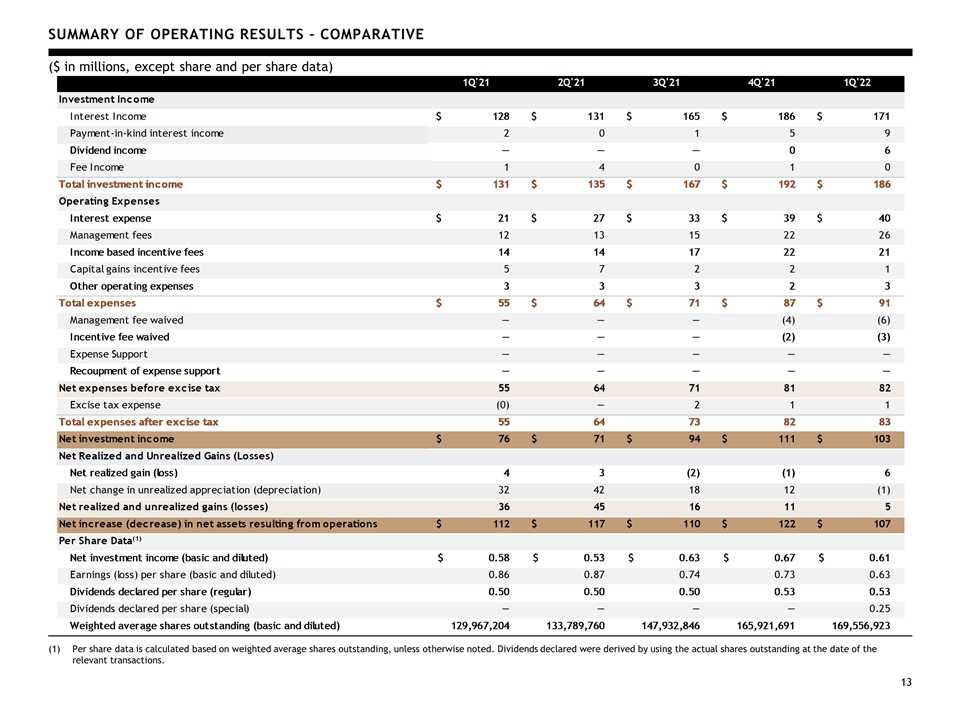
Summary of Operating Results – Comparative Per share data is calculated based on weighted average shares outstanding, unless otherwise noted. Dividends declared were derived by using the actual shares outstanding at the date of the relevant transactions. 13 ($ in millions, except share and per share data)

Supplemental Details
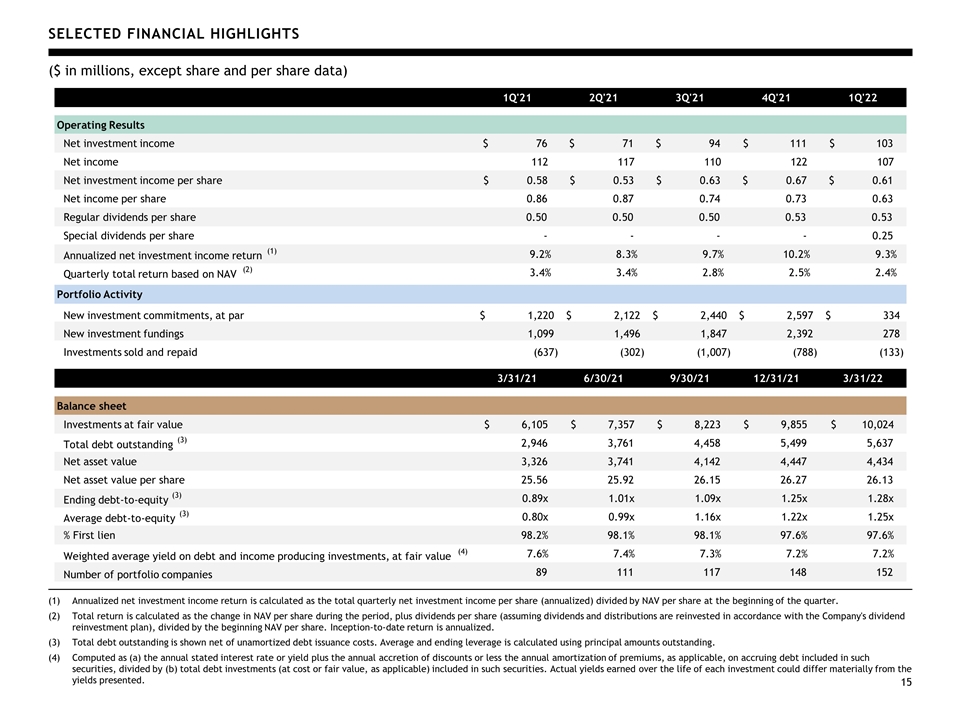
Selected Financial Highlights ($ in millions, except share and per share data) Annualized net investment income return is calculated as the total quarterly net investment income per share (annualized) divided by NAV per share at the beginning of the quarter. Total return is calculated as the change in NAV per share during the period, plus dividends per share (assuming dividends and distributions are reinvested in accordance with the Company's dividend reinvestment plan), divided by the beginning NAV per share. Inception-to-date return is annualized. Total debt outstanding is shown net of unamortized debt issuance costs. Average and ending leverage is calculated using principal amounts outstanding. Computed as (a) the annual stated interest rate or yield plus the annual accretion of discounts or less the annual amortization of premiums, as applicable, on accruing debt included in such securities, divided by (b) total debt investments (at cost or fair value, as applicable) included in such securities. Actual yields earned over the life of each investment could differ materially from the yields presented. 15 1Q'21 2Q'21 3Q'21 4Q'21 1Q'22 Operating Results Net investment income $ 76 $ 71 $ 94 $ 111 $ 103 Net income 112 117 110 122 107 Net investment income per share $ 0.58 $ 0.53 $ 0.63 $ 0.67 $ 0.61 Net income per share 0.86 0.87 0.74 0.73 0.63 Regular dividends per share 0.50 0.50 0.50 0.53 0.53 Special dividends per share - - - - 0.25 Annualized net investment income return (1) 9.2% 8.3% 9.7% 10.2% 9.3% Quarterly total return based on NAV (2) 3.4% 3.4% 2.8% 2.5% 2.4% Portfolio Activity New investment commitments, at par 1,220 $ 2,122 $ 2,440 $ 2,597 $ 334 $ New investment fundings 1,099 1,496 1,847 2,392 278 Investments sold and repaid (637) (302) (1,007) (788) (133) 3/31/21 6/30/21 9/30/21 12/31/21 3/31/22 Balance sheet Investments at fair value $ 6,105 $ 7,357 $ 8,223 $ 9,855 $ 10,024 Total debt outstanding (3) 2,946 3,761 4,458 5,499 5,637 Net asset value 3,326 3,741 4,142 4,447 4,434 Net asset value per share 25.56 25.92 26.15 26.27 26.13 Ending debt-to-equity (3) 0.89x 1.01x 1.09x 1.25x 1.28x Average debt-to-equity (3) 0.80x 0.99x 1.16x 1.22x 1.25x % First lien 98.2% 98.1% 98.1% 97.6% 97.6% Weighted average yield on debt and income producing investments, at fair value (4) 7.6% 7.4% 7.3% 7.2% 7.2% Number of portfolio companies 89 111 117 148 152
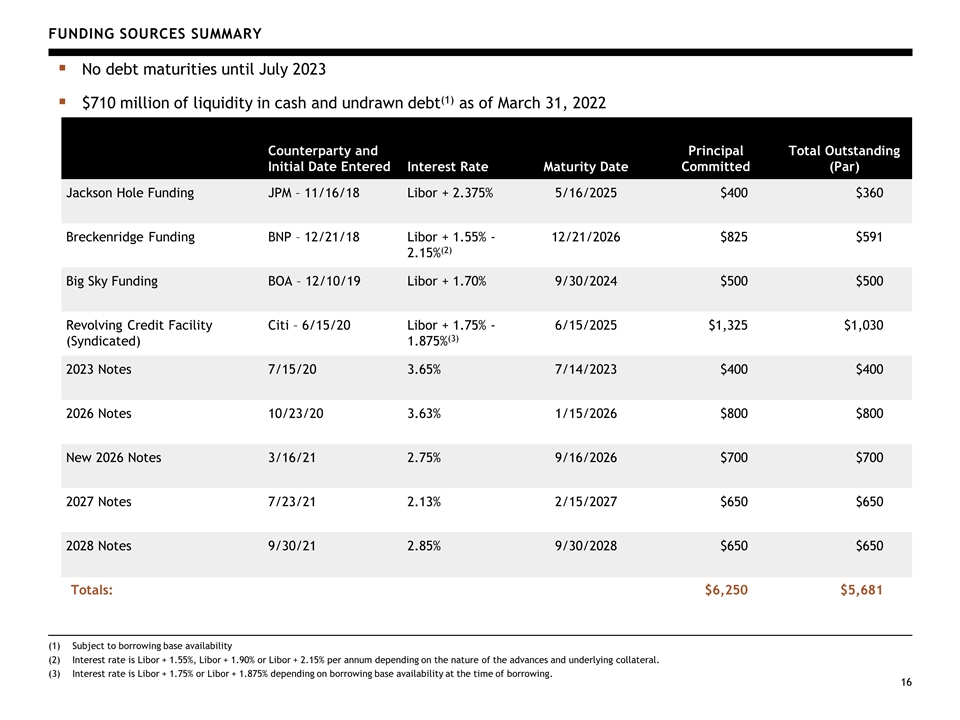
funding sources Summary Subject to borrowing base availability Interest rate is Libor + 1.55%, Libor + 1.90% or Libor + 2.15% per annum depending on the nature of the advances and underlying collateral. Interest rate is Libor + 1.75% or Libor + 1.875% depending on borrowing base availability at the time of borrowing. 16 Counterparty and Initial Date Entered Interest Rate Maturity Date Principal Committed Total Outstanding (Par) Jackson Hole Funding JPM – 11/16/18 Libor + 2.375% 5/16/2025 $400 $360 Breckenridge Funding BNP – 12/21/18 Libor + 1.55% - 2.15%(2) 12/21/2026 $825 $591 Big Sky Funding BOA – 12/10/19 Libor + 1.70% 9/30/2024 $500 $500 Revolving Credit Facility (Syndicated) Citi – 6/15/20 Libor + 1.75% - 1.875%(3) 6/15/2025 $1,325 $1,030 2023 Notes 7/15/20 3.65% 7/14/2023 $400 $400 2026 Notes 10/23/20 3.63% 1/15/2026 $800 $800 New 2026 Notes 3/16/21 2.75% 9/16/2026 $700 $700 2027 Notes 7/23/21 2.13% 2/15/2027 $650 $650 2028 Notes 9/30/21 2.85% 9/30/2028 $650 $650 Totals: $6,250 $5,681 No debt maturities until July 2023 $710 million of liquidity in cash and undrawn debt(1) as of March 31, 2022
Important Disclosure Information
18 Forward Looking Statements This presentation may contain forward-looking statements within the meaning of Section 27A of the Securities Act of 1933, as amended, and Section 21E of the Securities Exchange Act of 1934, as amended, which reflect BXSL’s current views with respect to, among other things, its operations and financial performance, its business plans and the impact of and recovery from the negative effects of the COVID-19 pandemic. You can identify these forward-looking statements by the use of words such as “outlook,” “objective,” “indicator,” “believes,” “expects,” “potential,” “continues,” “may,” “will,” “should,” “seeks,” “predicts,” “intends,” “plans,” “estimates,” “anticipates” or the negative version of these words or other comparable words. Such forward-looking statements are subject to various risks and uncertainties. Accordingly, there are or will be important factors that could cause actual outcomes or results to differ materially from those indicated in these statements. BXSL believes these factors include but are not limited to those described under the section entitled “Risk Factors” in its Annual Report on Form 10-K for the fiscal year ended December 31, 2021, as such factors may be further updated from time to time in its periodic filings with the Securities and Exchange Commission (“SEC”) which are accessible on the SEC’s website at www.sec.gov. These factors should not be construed as exhaustive and should be read in conjunction with the other cautionary statements that are included in this presentation and in the filings. BXSL assumes no obligation to update or supplement forward-looking statements that become untrue because of subsequent events or circumstances.