UNITED STATES
SECURITIES AND EXCHANGE COMMISSION
WASHINGTON, D.C. 20549
FORM
CURRENT REPORT
Pursuant to Section 13 or 15(d) of the Securities Exchange Act of 1934
Date of Report (Date of earliest event reported)
(Exact name of registrant as specified in its charter)
(State or other jurisdiction | (Commission | (IRS Employer |
(Address of principal executive offices) |
|
(
(Registrant's telephone number,
including area code)
Check the appropriate box below if the Form 8-K filing is intended to simultaneously satisfy the filing obligation of the registrant under any of the following provisions:
Securities registered pursuant to Section 12(b) of the Securities Exchange Act of 1934 formatted in Inline XBRL: See Exhibit 99.3
Indicate by check mark whether the registrant is an emerging growth company as defined in Rule 405 of the Securities Act of 1933 (§230.405 of this chapter) or Rule 12b-2 of the Securities Exchange Act of 1934 (§240.12b-2 of this chapter).
Emerging growth company
If an emerging growth company, indicate by check mark if the registrant has elected not to use the extended transition period for complying with any new or revised financial accounting standards provided pursuant to Section 13(a) of the Exchange Act. ☐
CITIGROUP INC.
Current Report on Form 8-K
Item 2.02 Results of Operations and Financial Condition.
On January 14, 2026, Citigroup Inc. announced its results for the quarter and year ended December 31, 2025. A copy of the related press release, filed as Exhibit 99.1 to this Form 8-K, is incorporated herein by reference. The quotation under the heading “CEO Commentary” on page 1 of Exhibit 99.1 shall not be deemed “filed” for purposes of Section 18 of the Securities Exchange Act of 1934 (Act) or otherwise subject to the liabilities under that Section. The information included in Exhibit 99.1, other than in the quotation, shall be deemed “filed” for purposes of the Act.
In addition, a copy of the Citigroup Inc. Quarterly Financial Data Supplement for the quarter and year ended December 31, 2025 is being furnished as Exhibit 99.2 to this Form 8-K and shall not be deemed to be “filed” for purposes of Section 18 of the Act or otherwise subject to the liabilities of that section.
Item 9.01 Financial Statements and Exhibits.
(d) Exhibits.
Exhibit Number | | |
99.1 | ||
99.2 | Citigroup Inc. Quarterly Financial Data Supplement for the quarter and year ended December 31, 2025. | |
99.3 | ||
104.1 | See the cover page of this Current Report on Form 8-K, formatted in Inline XBRL. |
SIGNATURE
Pursuant to the requirements of the Securities Exchange Act of 1934, the registrant has duly caused this report to be signed on its behalf by the undersigned hereunto duly authorized.
CITIGROUP INC. | ||
Dated: January 14, 2026 | ||
By: | /s/ Nicole Giles | |
Nicole Giles | ||
Controller and Chief Accounting Officer | ||
(Principal Accounting Officer) |
Exhibit 99.1
For Immediate Release Citigroup Inc. (NYSE: C) JANUARY 14, 2026 | |
|
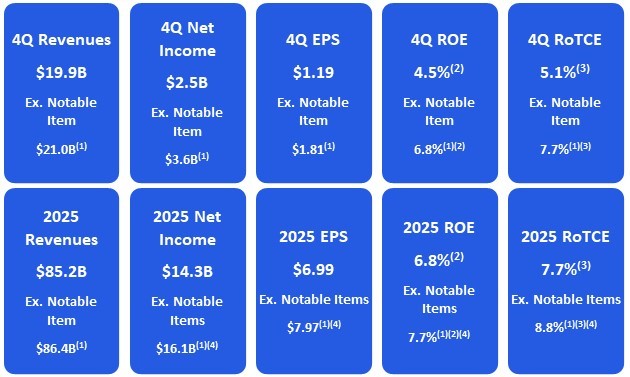
FOURTH QUARTER AND FULL YEAR 2025 RESULTS AND KEY METRICS
| | |
Citi Chair and CEO Jane Fraser said, “With record revenues and positive operating leverage for each of our five businesses, 2025 was a year of significant progress as we demonstrated that the investments we are making are driving strong top-line growth. Growth in Services was fueled by deeper client relationships and new client mandates; Markets maintained its top 3 position and improved its returns; Banking played a key role in many of the year’s major transactions; Wealth delivered strong results and launched several significant partnerships; and USPB doubled its returns through a focus on customer engagement and new, innovative products. “We returned over $17 billion of capital to our shareholders - the most since the pandemic - including $13 billion through share buybacks. We ended the year with a CET1 Ratio of 13.2%, which is 160 basis points above our regulatory requirement. We have ample capital to support our growth while continuing to return excess capital to our shareholders. “We enter 2026 with visible momentum across the firm and are committed to reaching our target of 10-11% RoTCE for the year and positioning Citi for improved returns above that level in the years ahead,” Ms. Fraser concluded. | ||
RETURNED ~$17.6 BILLION IN THE FORM OF COMMON SHARE REPURCHASES AND COMMON DIVIDENDS IN 2025 (~$5.6 BILLION IN THE QUARTER) 2025 PAYOUT RATIO OF 133%(5) COMMON EQUITY TIER 1 CAPITAL RATIO OF 13.2%(6) BOOK VALUE PER SHARE OF $110.01 TANGIBLE BOOK VALUE PER SHARE OF $97.06(7) New York, January 14, 2026 – Citigroup Inc. today reported net income for the fourth quarter 2025 of $2.5 billion, or $1.19 per diluted share, on revenues of $19.9 billion. This compares to net income of $2.9 billion, or $1.34 per diluted share, on revenues of $19.5 billion for the fourth quarter 2024. As previously disclosed(1), fourth quarter 2025 results included a notable item consisting of a loss on sale of $1.2 billion ($1.1 billion after-tax), due to the held for sale accounting treatment related to Citi's plan to sell AO Citibank in Russia, recorded in Other revenues. Revenues increased 2% from the prior-year period, on a reported basis(8), driven by growth in Banking, Services, U.S. Personal Banking (USPB) and Wealth, primarily offset by a decline in All Other. Excluding the Russia-related notable item(1), revenues were up 8%. Net income was $2.5 billion, compared to $2.9 billion in the prior-year period, driven by higher expenses, including income tax expense due to the limited tax benefit of the Russia-related notable item(1), offset by higher revenues and a lower provision for credit losses. Excluding the Russia-related notable item(1), net income was $3.6 billion. | |
1
Earnings per share of $1.19 decreased from $1.34 per diluted share in the prior-year period, reflecting lower net income, partially offset by a lower share count due to share repurchases. Excluding the Russia-related notable item(1), earnings per share was $1.81.
For the full year 2025, Citigroup reported net income of $14.3 billion on revenue of $85.2 billion, compared to net income of $12.7 billion on revenue of $80.7 billion for the full year 2024.
Excluding the Russia-related notable item(1), revenue was $86.4 billion in full year 2025. Excluding a notable item related to the Banamex goodwill impairment in the third quarter(4) and the Russia-related notable item(1), net income was $16.1 billion in full year 2025.
Percentage comparisons throughout this press release are calculated for the fourth quarter 2025 versus the fourth quarter 2024, unless otherwise specified.
Fourth Quarter Financial Results
Citigroup | | 4Q’25 | | 3Q’25 | | 4Q’24 | | QoQ% | | YoY% | | | 2025 | | 2024 | | % Δ | |||||
| | | | | | | | | | | | | | |||||||||
Total revenues, net of interest expense | | | 19,871 | | | 22,090 | | | 19,465 | | (10)% | | 2% | | | | 85,225 | | | 80,722 | | 6% |
| | | | | | | | | | | | | | |||||||||
Total operating expenses | | | 13,840 | | | 14,290 | | | 13,070 | | (3)% | | 6% | | | | 55,132 | | | 53,567 | | 3% |
| | | | | | | | | | | | | | |||||||||
Net credit losses | | | 2,190 | | | 2,214 | | | 2,242 | | (1)% | | (2)% | | | | 9,097 | | | 9,000 | | 1% |
Net ACL build / (release)(a) | | | 23 | | | 145 | | | 203 | | (84)% | | (89)% | | | | 602 | | | 607 | | (1)% |
Other provisions(b) | | | 7 | | | 91 | | | 148 | | (92)% | | (95)% | | | | 566 | | | 502 | | 13% |
Total provision for credit losses | | | 2,220 | | | 2,450 | | | 2,593 | | (9)% | | (14)% | | | | 10,265 | | | 10,109 | | 2% |
| | | | | | | | | | | | | | |||||||||
Income (loss) from continuing operations before taxes | | | 3,811 | | | 5,350 | | | 3,802 | | (29)% | | - | | | | 19,828 | | | 17,046 | | 16% |
Provision for income taxes | | | 1,288 | | | 1,559 | | | 912 | | (17)% | | 41% | | | | 5,373 | | | 4,211 | | 28% |
Income (loss) from continuing operations | | | 2,523 | | | 3,791 | | | 2,890 | | (33)% | | (13)% | | | | 14,455 | | | 12,835 | | 13% |
Income (loss) from discontinued operations, net of taxes | | | (1) | | | (1) | | | - | | - | | NM | | | | (3) | | | (2) | | (50)% |
Net income attributable to non-controlling interest | | | 51 | | | 38 | | | 34 | | 34% | | 50% | | | | 146 | | | 151 | | (3)% |
Citigroup’s net income (loss) | | $ | 2,471 | | $ | 3,752 | | $ | 2,856 | | (34)% | | (13)% | | | $ | 14,306 | | $ | 12,682 | | 13% |
| | | | | | | | | | | | | | |||||||||
| | | | | | | | | | | | | | |||||||||
EOP loans ($B) | | | 752 | | | 734 | | | 694 | | 2% | | 8% | | | | | | | |||
Average loans ($B) | | | 737 | | | 725 | | | 688 | | 2% | | 7% | | | | | | | |||
EOP assets ($B) | | | 2,657 | | | 2,642 | | | 2,353 | | 1% | | 13% | | | | | | | |||
EOP deposits ($B) | | | 1,404 | | | 1,384 | | | 1,284 | | 1% | | 9% | | | | | | | |||
Average deposits ($B) | | | 1,422 | | | 1,382 | | | 1,320 | | 3% | | 8% | | | | | | | |||
| | | | | | | | | | | | | | |||||||||
| | | | | | | | | | | | | | |||||||||
Book value per share | | $ | 110.01 | | $ | 108.41 | | $ | 101.62 | | 1% | | 8% | | | $ | 110.01 | | $ | 101.62 | | 8% |
Tangible book value per share(c) | | $ | 97.06 | | $ | 95.72 | | $ | 89.34 | | 1% | | 9% | | | $ | 97.06 | | $ | 89.34 | | 9% |
Common Equity Tier 1 (CET1) Capital ratio(d) | | | 13.2% | | | 13.3% | | | 13.6% | | | | | | 13.2% | | | 13.6% | | |||
Supplementary Leverage ratio (SLR)(d) | | | 5.5% | | | 5.5% | | | 5.8% | | | | | | 5.5% | | | 5.8% | | |||
Return on average common equity (ROE)(e) | | | 4.5% | | | 7.1% | | | 5.4% | | | | | | 6.8% | | | 6.1% | | |||
Return on average tangible common equity (RoTCE)(f) | | | 5.1% | | | 8.0% | | | 6.1% | | (290) bps | | (100) bps | | | | 7.7% | | | 7.0% | | 70 bps |
Efficiency Ratio (total operating expenses/total revenues, net) | | | 69.6% | | | 64.7% | | | 67.1% | | 490 bps | | 250 bps | | | | 64.7% | | | 66.4% | | (170) bps |
| | | | | | | | | | | | | | | | | | | | | | |
(a) Includes credit reserve build / (release) for loans and provision / (release) for credit losses on unfunded lending commitments.
(b) Includes provisions on Other Assets, policyholder benefits and claims and HTM debt securities.
(c) Tangible book value per share is a non-GAAP financial measure. For additional information, refer to footnote 7.
(d) Ratios as of December 31, 2025 are preliminary. For additional information, please refer to footnote 6.
(e) Ratios as of December 31, 2025 are preliminary. For additional information, please refer to footnote 2.
(f) Ratios as of December 31, 2025 are preliminary. RoTCE is a non-GAAP financial measure. For additional information, please refer to foonote 3.
2
Citigroup
Citigroup revenues of $19.9 billion in the fourth quarter 2025 increased 2%, on a reported basis, driven by growth in Banking, Services, USPB and Wealth, primarily offset by a decline in All Other. Excluding the Russia-related notable item(1), revenues were up 8%. Reported net interest income increased 14%, driven by Markets, Services, USPB, Legacy Franchises in All Other, Wealth and Banking, partially offset by a decline in Corporate/Other in All Other. Reported non-interest revenue decreased 27%, driven by Legacy Franchises, Markets, USPB and Wealth, partially offset by increases in Banking and Services.
Citigroup operating expenses of $13.8 billion were up 6%, driven by higher compensation and benefits expenses, increases in non-income tax charges, legal expenses and technology and communication expenses, partially offset by productivity savings and lower deposit insurance expenses.
Citigroup provision for credit losses was $2.2 billion, driven by $2.2 billion of net credit losses and a net allowance for credit losses (ACL) build of $30 million, driven by higher net lending activity, primarily offset by changes in credit quality. Net credit losses were down 2% from the prior-year period, driven by a decrease in USPB, largely offset by an increase in Legacy Franchises. The provision in the prior-year period was $2.6 billion, driven by $2.2 billion of net credit losses and a net ACL build of $351 million, driven by higher net lending activity, partially offset by changes in the macroeconomic outlook.
Citigroup net income was $2.5 billion in the fourth quarter 2025, compared to net income of $2.9 billion in the prior-year period, driven by higher expenses, including income tax expense due to the limited tax benefit of the Russia-related notable item(1), offset by higher revenues and a lower provision for credit losses. Excluding the Russia-related notable item(1), net income was $3.6 billion. Citigroup’s effective tax rate was approximately 34% in the current quarter, driven by the limited tax benefit of the Russia-related notable item, compared to 24% in the fourth quarter 2024.
Citigroup’s total allowance for credit losses was approximately $21.4 billion at quarter end, compared to $22.2 billion at the end of the prior-year period. The decrease was driven by the reclassification of AO Citibank related ACL to Other Assets, resulting from the held for sale accounting for Citi’s planned sale of AO Citibank, largely offset by ACL builds and changes in foreign exchange during the year. Total ACL on loans was approximately $19.2 billion at quarter end, compared to $18.6 billion at the end of the prior-year period, with a reserve-to-funded loans ratio of 2.6%, down from 2.7% in the prior-year period. Total non-accrual loans increased $0.9 billion, or 35% from the prior-year period to $3.6 billion. Corporate non-accrual loans increased $0.6 billion, or 45% from the prior-year period to $2.0 billion, driven by idiosyncratic downgrades in Banking and Services. Consumer non-accrual loans increased $0.3 billion, or 24% from the prior-year period to $1.6 billion, primarily driven by Legacy Franchises, primarily due to higher volumes in Mexico Consumer and Wealth, driven by residential mortgage loans impacted by the California wildfires.
Citigroup’s end-of-period loans were $752 billion at quarter end, up 8% versus the prior-year period, driven by higher loans in Markets, Services and USPB, partially offset by lower loans in Banking. Citigroup’s average loans were $737 billion in the fourth quarter 2025, up 7% versus the prior-year period, driven by higher average loans in Markets, USPB and Services.
Citigroup’s end-of-period deposits were approximately $1.4 trillion at quarter end, up 9% versus the prior-year period, driven by increases in Services. Citigroup’s average deposits were approximately $1.4 trillion in the fourth quarter 2025, up 8% versus the prior-year period, driven by higher average deposits in Services.
Citigroup’s book value per share of $110.01 at quarter end increased 8% versus the prior-year period, and tangible book value per share of $97.06 at quarter end increased 9% versus the prior-year period. The increases were driven by net income and beneficial net movements in accumulated other comprehensive income (AOCI), partially offset by the payment of common and preferred dividends and reductions in additional paid-in capital (APIC). In addition, common share repurchases were accretive to book value per share and dilutive to tangible book value per share (due to the higher average repurchase price for 2025 over the tangible book value per share as of December 31, 2024). At quarter end, Citigroup’s preliminary CET1 Capital ratio(6) was 13.2% versus 13.3% at the end of the prior quarter, primarily driven by common share repurchases, the payment of common and preferred dividends and the temporary impact of the held for sale accounting treatment related to Citi’s plan to sell AO Citibank in Russia(1), primarily offset by net income and the temporary impact from the sale of a 25% equity stake in Grupo Financiero Banamex, S.A. de C.V.(4) Citigroup’s Supplementary Leverage ratio(6) for the fourth quarter 2025 was 5.5%, unchanged from the prior quarter. During the quarter, Citigroup returned approximately $5.6 billion to common shareholders in the form of share repurchases and dividends.
3
Services | | 4Q’25 | | 3Q’25 | | 4Q’24 | | QoQ% | | YoY% | | | 2025 | | 2024 | | % Δ | |||||
| | | | | | | | | | | | | | | | | | | | | | |
Net interest income | | | 3,303 | | | 3,121 | | | 2,840 | | 6% | | 16% | | | | 12,238 | | | 10,923 | | 12% |
Non-interest revenue | | | 879 | | | 761 | | | 1,095 | | 16% | | (20)% | | | | 3,140 | | | 3,578 | | (12)% |
Treasury and Trade Solutions | | | 4,182 | | | 3,882 | | | 3,935 | | 8% | | 6% | | | | 15,378 | | | 14,501 | | 6% |
Net interest income | | | 747 | | | 702 | | | 606 | | 6% | | 23% | | | | 2,763 | | | 2,500 | | 11% |
Non-interest revenue | | | 1,013 | | | 779 | | | 624 | | 30% | | 62% | | | | 3,115 | | | 2,617 | | 19% |
Securities Services | | | 1,760 | | | 1,481 | | | 1,230 | | 19% | | 43% | | | | 5,878 | | | 5,117 | | 15% |
Total Services revenues(a) | | | 5,942 | | | 5,363 | | | 5,165 | | 11% | | 15% | | | | 21,256 | | | 19,618 | | 8% |
| | | | | | | | | | | | | | | | | | | | | | |
Total operating expenses | | | 2,843 | | | 2,707 | | | 2,601 | | 5% | | 9% | | | | 10,813 | | | 10,568 | | 2% |
| | | | | | | | | | | | | | | | | | | | | | |
Net credit losses | | | 19 | | | 11 | | | 28 | | 73% | | (32)% | | | | 56 | | | 48 | | 17% |
Net ACL build / (release)(b) | | | (15) | | | (12) | | | (75) | | (25)% | | 80% | | | | 38 | | | (113) | | NM |
Other provisions(c) | | | (15) | | | 62 | | | 159 | | NM | | NM | | | | 360 | | | 341 | | 6% |
Total provision for credit losses | | | (11) | | | 61 | | | 112 | | NM | | NM | | | | 454 | | | 276 | | 64% |
| | | | | | | | | | | | | | | | | | | | | | |
Net income | | $ | 2,246 | | $ | 1,802 | | $ | 1,871 | | 25% | | 20% | | | $ | 7,075 | | $ | 6,483 | | 9% |
| | | | | | | | | | | | | | | | | | | | | | |
| | | | | | | | | | | | | | | | | | | | | | |
Services Key Statistics and Metrics ($B) | | | | | | | | | | | | | | | | | | | | | | |
Allocated Average TCE(d) | | | 25 | | | 25 | | | 25 | | - | | (1)% | | | | 25 | | | 25 | | (1)% |
RoTCE(d) | | | 36.1% | | | 28.9% | | | 29.9% | | 720 bps | | 620 bps | | | | 28.6% | | | 26.0% | | 260 bps |
Fee revenue ($MM) | | | 1,630 | | | 1,626 | | | 1,441 | | - | | 13% | | | | 6,385 | | | 6,012 | | 6% |
Average loans | | | 96 | | | 94 | | | 87 | | 2% | | 10% | | | | 93 | | | 85 | | 9% |
Average deposits | | | 935 | | | 893 | | | 839 | | 5% | | 11% | | | | 878 | | | 819 | | 7% |
Cross border transaction value | | | 115 | | | 105 | | | 101 | | 10% | | 14% | | | | 416 | | | 380 | | 10% |
US dollar clearing volume (#MM)(e) | | | 45 | | | 45 | | | 44 | | 1% | | 3% | | | | 177 | | | 168 | | 5% |
Commercial card spend volume | | | 18 | | | 18 | | | 17 | | (4)% | | 2% | | | | 71 | | | 70 | | 1% |
Assets under custody and/or administration (AUC/AUA) ($T)(f) | | | 31 | | | 30 | | | 25 | | 6% | | 24% | | | | | | | | | |
| | | | | | | | | | | | | | | | | | | | | | |
(a) Services revenues reflect the impact of a revenue sharing agreement with Banking – Corporate Lending, for Services products sold to Corporate Lending clients. This generally results in a reduction in Services reported revenue.
(b) Includes credit reserve build / (release) for loans and provision / (release) for credit losses on unfunded lending commitments.
(c) Includes provisions on Other Assets and for HTM debt securities.
(d) TCE and RoTCE are non-GAAP financial measures. For additional information, refer to Footnote 3.
(e) U.S. dollar clearing volume is defined as the number of USD clearing payment instructions processed by Citi on behalf of U.S. and foreign-domiciled entities (primarily financial institutions). Amounts in the table are stated in millions of payment instructions processed.
(f) 4Q25 is preliminary.
Services
Services revenues of $5.9 billion were up 15%. Excluding the Russia-related notable item(1), revenues increased 8%, driven by growth in Treasury and Trade Solutions and Securities Services. Net interest income increased 18%, primarily driven by an increase in average deposit balances and deposit spreads. Non-interest revenue increased 10%. Excluding the Russia-related notable item(1), non-interest revenue decreased 11%, driven by higher lending revenue share, partially offset by fee revenue growth of 13%.
Treasury and Trade Solutions revenues of $4.2 billion were up 6%, driven by a 16% increase in net interest income, partially offset by a 20% decrease in non-interest revenue. The increase in net interest income was primarily driven by higher average deposit balances and deposit spreads. The decrease in non-interest revenue was driven by the impact of the higher lending revenue share, partially offset by growth in fees and underlying fee drivers, including an increase in cross-border transaction value of 14%, an increase in U.S. dollar clearing volume of 3% and an increase in commercial card spend volume of 2%.
Securities Services revenues of $1.8 billion were up 43%, driven by a 62% increase in non-interest revenue and a 23% increase in net interest income. The increase in non-interest revenue was driven by the Russia-related notable item(1) and higher fees, which benefited from a 24% increase in assets under custody and administration, partially offset by higher lending revenue share. The increase in net interest income was primarily driven by higher average deposit balances and deposit spreads.
Services operating expenses of $2.8 billion increased 9%, primarily driven by higher technology expenses, compensation and benefits expenses and volume-related expenses.
Services provision for credit losses was a benefit of $11 million, driven by $19 million of net credit losses and a net ACL release of $30 million. The provision in the prior-year period was $112 million, driven by a net ACL build of $84 million, driven by transfer risk, and $28 million of net credit losses.
Services net income of $2.2 billion increased 20%, driven by higher revenues, including the impact of the Russia-related notable item(1), and a lower provision for credit losses, partially offset by higher expenses.
4
Markets | | 4Q’25 | | 3Q’25 | | 4Q’24 | | QoQ% | | YoY% | | | 2025 | | 2024 | | %Δ | |||||
| | | | | | | | | | | | | | | | | | |||||
Rates and currencies | | | 2,413 | | | 2,823 | | | 2,421 | | (15)% | | - | | | | 11,418 | | | 10,152 | | 12% |
Spread products / other fixed income | | | 1,045 | | | 1,200 | | | 1,057 | | (13)% | | (1)% | | | | 4,808 | | | 4,598 | | 5% |
Fixed Income markets | | | 3,458 | | | 4,023 | | | 3,478 | | (14)% | | (1)% | | | | 16,226 | | | 14,750 | | 10% |
Equity markets | | | 1,084 | | | 1,540 | | | 1,098 | | (30)% | | (1)% | | | | 5,744 | | | 5,086 | | 13% |
Total Markets revenues(a) | | | 4,542 | | | 5,563 | | | 4,576 | | (18)% | | (1)% | | | | 21,970 | | | 19,836 | | 11% |
| | | | | | | | | | | | | | | | | | | | | | |
Total operating expenses | | | 3,609 | | | 3,491 | | | 3,174 | | 3% | | 14% | | | | 14,077 | | | 13,202 | | 7% |
| | | | | | | | | | | | | | | | | | | | | | |
Net credit losses | | | (12) | | | 68 | | | - | | NM | | NM | | | | 206 | | | 168 | | 23% |
Net ACL build / (release)(b) | | | (80) | | | (31) | | | 136 | | (158)% | | NM | | | | (9) | | | 230 | | NM |
Other provisions(c) | | | (12) | | | (5) | | | (2) | | (140)% | | (500)% | | | | 40 | | | 65 | | (38)% |
Total provision for credit losses | | | (104) | | | 32 | | | 134 | | NM | | NM | | | | 237 | | | 463 | | (49)% |
| | | | | | | | | | | | | | | | | | | | | | |
Net income | | $ | 783 | | $ | 1,562 | | $ | 1,009 | | (50)% | | (22)% | | | $ | 5,855 | | $ | 4,930 | | 19% |
| | | | | | | | | | | | | | | | | | | | | | |
| | | | | | | | | | | | | | | | | | | | | | |
Markets Key Statistics and Metrics ($B) | | | | | | | | | | | | | | | | | | | | | | |
Allocated Average TCE(d) | | | 50 | | | 50 | | | 54 | | - | | (7)% | | | | 50 | | | 54 | | (7)% |
RoTCE(d) | | | 6.2% | | | 12.3% | | | 7.4% | | (610) bps | | (120) bps | | | | 11.6% | | | 9.1% | | 250 bps |
Average trading account assets | | | 557 | | | 556 | | | 449 | | - | | 24% | | | | 535 | | | 436 | | 23% |
Average loans | | | 152 | | | 147 | | | 122 | | 3% | | 25% | | | | 141 | | | 120 | | 18% |
Average VaR ($ in MM)(e) | | | 109 | | | 117 | | | 118 | | (7)% | | (8)% | | | | 115 | | | 123 | | (6)% |
| | | | | | | | | | | | | | | | | | | | | | |
(a) Markets revenues reflect the impact of a revenue sharing agreement with Banking – Corporate Lending, for Markets products sold to Corporate Lending clients. This generally results in a reduction in Markets reported revenue.
(b) Includes credit reserve build / (release) for loans and provision / (release) for credit losses on unfunded lending commitments.
(c) Includes provisions on Other Assets and HTM debt securities.
(d) TCE and RoTCE are non-GAAP financial measures. For additional information, refer to Footnote 3.
(e) VaR estimates, at a 99% confidence level, the potential decline in the value of a position or a portfolio under normal market conditions assuming a one-day holding period. VaR statistics, which are based on historical data, can be materially different across firms due to differences in portfolio composition, VaR methodologies and model parameters.
Markets
Markets revenues of $4.5 billion decreased 1%, driven by lower Fixed Income markets and Equity markets revenues compared to a strong quarter in the prior-year period.
Fixed Income markets revenues of $3.5 billion decreased 1%, largely driven by a decline in spread products and other fixed income. Rates and currencies revenues were unchanged, as growth in foreign exchange revenue and the impact of continued optimization of the balance sheet were offset by higher lending revenue share and lower revenues in rates. Spread products and other fixed income revenues declined 1%, driven by lower commodities revenues, offset by the impact of continued optimization of the balance sheet and higher financing activity in spread products.
Equity markets revenues of $1.1 billion decreased 1%, driven by lower cash equities revenues, compared to a strong quarter in the prior-year period, primarily offset by continued momentum in prime services, with record prime balances(9) (up by more than 50%), and higher derivatives revenues.
Markets operating expenses of $3.6 billion increased 14%, primarily driven by higher legal expenses, compensation and benefits, technology expenses and volume-related expenses.
Markets provision for credit losses was a benefit of $104 million, driven by a net ACL release of $92 million, resulting from a refinement of loss assumptions for certain portfolios in spread products, and $12 million of net credit recoveries. The provision in the prior-year period was $134 million, driven by a net ACL build of $134 million, driven by changes in credit quality, partially offset by changes in the macroeconomic outlook.
Markets net income of $783 million decreased 22%, driven by higher expenses and lower revenues, largely offset by a lower provision for credit losses.
5
Banking | | 4Q’25 | | 3Q’25 | | 4Q’24 | | QoQ% | | YoY% | | | 2025 | | 2024 | | %Δ | |||||
| | | | | | | | | | | | | | | | | | |||||
Investment Banking | | | 1,272 | | | 1,146 | | | 925 | | 11% | | 38% | | | | 4,434 | | | 3,637 | | 22% |
Corporate Lending(a) | | | 964 | | | 1,030 | | | 322 | | (6)% | | 199% | | | | 3,899 | | | 2,744 | | 42% |
Total Banking revenues(a)(b) | | | 2,236 | | | 2,176 | | | 1,247 | | 3% | | 79% | | | | 8,333 | | | 6,381 | | 31% |
Gain / (loss) on loan hedges(a) | | | (26) | | | (44) | | | (6) | | 41% | | (333)% | | | | (118) | | | (180) | | 34% |
Total Banking revenues including gain/(loss) on loan hedges(a) | | | 2,210 | | | 2,132 | | | 1,241 | | 4% | | 78% | | | | 8,215 | | | 6,201 | | 32% |
| | | | | | | | | | | | | | | | | | | | | | |
Total operating expenses | | | 1,152 | | | 1,139 | | | 1,051 | | 1% | | 10% | | | | 4,462 | | | 4,477 | | - |
Net credit losses | | | 25 | | | 9 | | | 7 | | 178% | | 257% | | | | 84 | | | 149 | | (44)% |
Net ACL build / (release)(c) | | | 150 | | | 136 | | | (204) | | 10% | | NM | | | | 610 | | | (328) | | NM |
Other provisions(d) | | | 1 | | | 12 | | | (43) | | (92)% | | NM | | | | 26 | | | (45) | | NM |
Total provision for credit losses | | | 176 | | | 157 | | | (240) | | 12% | | NM | | | | 720 | | | (224) | | NM |
| | | | | | | | | | | | | | | | | | | | | | |
Net income | | $ | 685 | | $ | 638 | | $ | 356 | | 7% | | 92% | | | $ | 2,329 | | $ | 1,524 | | 53% |
| | | | | | | | | | | | | | | | | | | | | | |
| | | | | | | | | | | | | | | | | | | | | | |
Banking Key Statistics and Metrics | | | | | | | | | | | | | | | | | | | | | | |
Allocated Average TCE(e) ($B) | | | 21 | | | 21 | | | 22 | | - | | (6)% | | | | 21 | | | 22 | | (6)% |
RoTCE(e) | | | 13.2% | | | 12.3% | | | 6.5% | | 90 bps | | 670 bps | | | | 11.3% | | | 7.0% | | 430 bps |
Average loans ($B) | | | 79 | | | 81 | | | 84 | | (2)% | | (6)% | | | | 82 | | | 88 | | (7)% |
| | | | | | | | | | | | | | | | | | | | | | |
Advisory | | | 649 | | | 427 | | | 353 | | 52% | | 84% | | | | 1,908 | | | 1,245 | | 53% |
Equity underwriting | | | 180 | | | 174 | | | 214 | | 3% | | (16)% | | | | 699 | | | 688 | | 2% |
Debt underwriting | | | 458 | | | 568 | | | 384 | | (19)% | | 19% | | | | 2,011 | | | 1,924 | | 5% |
Investment Banking fees | | | 1,287 | | | 1,169 | | | 951 | | 10% | | 35% | | | | 4,618 | | | 3,857 | | 20% |
| | | | | | | | | | | | | | | | | | | | | | |
(a) Excludes gain / (loss) on credit derivatives as well as the mark-to-market on loans at fair value. For additional information, see Footnote 10.
(b) Banking revenues reflect the impact of a revenue sharing agreement with Banking – Corporate Lending, for Investment Banking, Markets and Services products sold to Corporate Lending clients. This generally results in an increase in Banking reported revenue.
(c) Includes credit reserve build / (release) for loans and provision for credit losses on unfunded lending commitments.
(d) Includes provisions on Other Assets and HTM debt securities.
(e) TCE and RoTCE are non-GAAP financial measures. For additional information, refer to Footnote 3.
Banking
Banking revenues of $2.2 billion increased 78%, driven by growth in Corporate Lending, excluding mark-to-market gain/(loss) on loan hedges(10), and Investment Banking.
Investment Banking revenues of $1.3 billion increased 38%, driven by an increase in Investment Banking fees of 35%, reflecting growth in Advisory and Debt Capital Markets (DCM), partially offset by a decline in Equity Capital Markets (ECM). Advisory fees increased 84%, driven by momentum across several sectors and continued share gains. ECM fees were down 16%, driven by lower follow-on volumes, partially offset by higher initial public offerings. DCM fees were up 19%, driven by investment grade and leveraged finance debt, partially offset by lower participation in loans.
Corporate Lending revenues of $964 million, excluding mark-to-market on loan hedges(10), increased 199%, driven by an increase in lending revenue share.
Banking operating expenses of $1.2 billion increased 10%, driven by higher compensation and benefits, including investments in the business.
Banking provision for credit losses was $176 million, driven by a net ACL build of $151 million, driven by changes in portfolio composition, including credit quality and exposure growth, and $25 million of net credit losses. The provision in the prior-year period was a benefit of $240 million, driven by a net ACL release of $247 million, primarily driven by changes in the macroeconomic outlook, changes in credit quality and transfer risk, and $7 million of net credit losses.
Banking net income of $685 million increased 92%, driven by higher revenues, largely offset by a higher provision for credit losses and higher expenses.
6
Wealth | | 4Q’25 | | 3Q’25 | | 4Q’24 | | QoQ% | | YoY% | | | 2025 | | 2024 | | % r | |||||
| | | | | | | | | | | | | | | | | | |||||
Private Bank | | 625 | | 656 | | 590 | | (5)% | | 6% | | | | 2,676 | | | 2,386 | | 12% | |||
Wealth at Work | | | 227 | | | 214 | | | 256 | | 6% | | (11)% | | | | 930 | | | 876 | | 6% |
Citigold | | | 1,281 | | | 1,294 | | | 1,148 | | (1)% | | 12% | | | | 4,953 | | | 4,221 | | 17% |
Total revenues, net of interest expense | | | 2,133 | | | 2,164 | | | 1,994 | | (1)% | | 7% | | | 8,559 | | 7,483 | | 14% | ||
| | | | | | | | | | | | | | | | | | | | | | |
Total operating expenses | | 1,650 | | 1,654 | | 1,561 | | - | | 6% | | | 6,501 | | 6,326 | | 3% | |||||
| | | | | | | | | | | | | | | | | | | | | | |
Net credit losses | | | 36 | | | 56 | | | 30 | | (36)% | | 20% | | | | 170 | | | 121 | | 40% |
Net ACL build / (release)(a) | | | 3 | | | (26) | | | (11) | | NM | | NM | | | | (29) | | | (245) | | 88% |
Other provisions(b) | | | (1) | | | - | | | 1 | | NM | | NM | | | | (1) | | | (2) | | 50% |
Total provision for credit losses | | 38 | | 30 | | 20 | | 27% | | 90% | | | 140 | | (126) | | NM | |||||
| | | | | | | | | | | | | | | | | | | | | | |
Net income | | $ | 338 | | $ | 374 | | $ | 334 | | (10)% | | 1% | | | $ | 1,490 | | $ | 1,002 | | 49% |
| | | | | | | | | | | | | | | | | | | | | | |
| | | | | | | | | | | | | | | | | | | | | | |
Wealth Key Statistics and Metrics ($B) | | | | | | | | | | | | | | | | | | | | | | |
Allocated Average TCE(c) | | | 12 | | | 12 | | | 13 | | - | | (7)% | | | | 12 | | | 13 | | (7)% |
RoTCE(c) | | | 10.9% | | | 12.1% | | | 10.1% | | (120) bps | | 80 bps | | | | 12.1% | | | 7.6% | | 450 bps |
| | | | | | | | | | | | | | | | | | | | | | |
Loans | | | 150 | | | 151 | | | 148 | | (1)% | | 2% | | | | | | | | | |
Deposits | | | 324 | | | 318 | | | 313 | | 2% | | 4% | | | | | | | | | |
Client investment assets(d) | | | 670 | | | 660 | | | 587 | | 2% | | 14% | | | | | | | | | |
EOP client balances | | | 1,144 | | | 1,129 | | | 1,048 | | 1% | | 9% | | | | | | | | | |
Net New Investment Assets (NNIA)(e) | | | 7.2 | | | 18.6 | | | 15.6 | | (61)% | | (54)% | | | | | | | | | |
| | | | | | | | | | | | | | | | | | | | | | |
(a) Includes credit reserve build / (release) for loans and provision / (release) for credit losses on unfunded lending commitments.
(b) Includes provisions on Other Assets and policyholder benefits and claims.
(c) TCE and RoTCE are non-GAAP financial measures. For additional information, refer to Footnote 3.
(d) Includes assets under management, and trust and custody assets. 4Q25 Client investment assets are preliminary.
(e) 4Q25 Net new investment assets are preliminary. Represents investment asset inflows, including dividends, interest and distributions, less investment asset outflows.
Wealth
Wealth revenues of $2.1 billion increased 7%, driven by growth in Citigold and the Private Bank, partially offset by lower revenues in Wealth at Work. Net interest income of $1.4 billion increased 12%, driven by higher deposit spreads and average deposit balances, partially offset by lower mortgage spreads. Non-interest revenue of $736 million decreased 1%, driven by the loss of fee revenue from the sale of the trust business in the third quarter 2025, largely offset by other net fee growth, with client investment assets up 14%.
Private Bank revenues of $625 million increased 6%, driven by higher deposit spreads, largely offset by lower mortgage spreads.
Wealth at Work revenues of $227 million decreased 11%, driven by lower mortgage spreads, largely offset by higher deposit spreads and higher investment fee revenues.
Citigold revenues of $1.3 billion increased 12%, primarily driven by higher deposit spreads and higher investment fee revenues.
Wealth operating expenses of $1.7 billion increased 6%, primarily driven by investments in technology and higher volume and other revenue-related expenses.
Wealth provision for credit losses was $38 million, driven by $36 million of net credit losses and a net ACL build of $2 million. The provision in the prior-year period was $20 million, driven by $30 million of net credit losses and a net ACL release of $10 million.
Wealth net income of $338 million increased 1%, driven by higher revenues, primarily offset by higher expenses and a higher provision for credit losses.
7
USPB ($ in millions, except as otherwise noted) | | 4Q’25 | | 3Q’25 | | 4Q’24 | | QoQ% | | YoY% | | | 2025 | | 2024 | | %r | |||||
| | | | | | | | | | | | | | | | | | |||||
Branded Cards | | 2,952 | | 2,970 | | 2,806 | | (1)% | | 5% | | | | 11,636 | | | 10,735 | | 8% | |||
Retail Services | | | 1,612 | | | 1,686 | | | 1,741 | | (4)% | | (7)% | | | | 6,622 | | | 7,070 | | (6)% |
Retail Banking | | | 729 | | | 675 | | | 603 | | 8% | | 21% | | | | 2,713 | | | 2,250 | | 21% |
Total revenues, net of interest expense | | | 5,293 | | | 5,331 | | | 5,150 | | (1)% | | 3% | | | 20,971 | | 20,055 | | 5% | ||
| | | | | | | | | | | | | | | | | | | | | | |
Total operating expenses | | 2,521 | | 2,365 | | 2,465 | | 7% | | 2% | | | 9,709 | | 9,646 | | 1% | |||||
| | | | | | | | | | | | | | | | | | | | | | |
Net credit losses | | | 1,783 | | | 1,776 | | | 1,920 | | - | | (7)% | | | | 7,431 | | | 7,579 | | (2)% |
Net ACL build / (release)(a) | | | (113) | | | 64 | | | 246 | | NM | | NM | | | | (225) | | | 1,006 | | NM |
Other provisions(b) | | | 3 | | | 2 | | | 4 | | 50% | | (25)% | | | | 5 | | | 13 | | (62)% |
Total provision for credit losses | | 1,673 | | 1,842 | | 2,170 | | (9)% | | (23)% | | | 7,211 | | 8,598 | | (16)% | |||||
| | | | | | | | | | | | | | | | | | | | | | |
Net income | | $ | 845 | | $ | 858 | | $ | 392 | | (2)% | | 116% | | | $ | 3,097 | | $ | 1,382 | | 124% |
| | | | | | | | | | | | | | | | | | | | | | |
| | | | | | | | | | | | | | | | | | | | | | |
USPB Key Statistics and Metrics ($B) | | | | | | | | | | | | | | | | | | | | | | |
Allocated average TCE(c) | | | 23 | | | 23 | | | 25 | | - | | (7)% | | | | 23 | | | 25 | | (7)% |
RoTCE(c) | | | 14.3% | | | 14.5% | | | 6.2% | | (20) bps | | 810 bps | | | | 13.2% | | | 5.5% | | 770 bps |
Average loans | | | 226 | | | 220 | | | 216 | | 3% | | 5% | | | | 220 | | | 209 | | 5% |
Average deposits | | | 88 | | | 90 | | | 86 | | (2)% | | 2% | | | | 89 | | | 91 | | (2)% |
US credit card average loans | | | 169 | | | 167 | | | 165 | | 1% | | 2% | | | | | | | | | |
US credit card spend volume | | | 166 | | | 157 | | | 161 | | 6% | | 4% | | | | | | | | | |
New credit cards account acquisitions (in thousands) | | | 3,687 | | | 3,211 | | | 3,520 | | 15% | | 5% | | | | | | | | | |
| | | | | | | | | | | | | | | | | | | | | | |
(a) Includes credit reserve build / (release) for loans.
(b) Includes provisions on policyholder benefits and claims and Other Assets.
(c) TCE and RoTCE are non-GAAP financial measures. For additional information, refer to Footnote 3.
U.S. Personal Banking (USPB)
USPB revenues of $5.3 billion increased 3%, driven by growth in Branded Cards and Retail Banking, partially offset by a decline in Retail Services. Net interest income increased 5%, driven by higher loan spreads and higher interest-earning balances in Branded Cards, as well as higher deposit spreads and average deposit balances in Retail Banking, partially offset by lower interest-earning balances and lower loan spreads in Retail Services. Non-interest revenue decreased 42%, driven by higher rewards costs, partially offset by higher gross interchange fees in Branded Cards.
Branded Cards revenues of $3.0 billion increased 5%, driven by higher loan spreads, higher interest-earning balances, which were up 4%, and higher gross interchange fees, largely offset by higher rewards costs.
Retail Services revenues of $1.6 billion decreased 7%, primarily driven by lower interest-earning balances and lower loan spreads.
Retail Banking revenues of $729 million increased 21%, driven by the impact of higher deposit spreads and average deposit balances.
USPB operating expenses of $2.5 billion increased 2%, driven by higher transactional and marketing expenses, partially offset by a reduction in other expenses.
USPB provision for credit losses was $1.7 billion, driven by $1.8 billion of net credit losses and a net ACL release of $110 million, driven by improvements in portfolio quality, including seasonal mix changes, primarily offset by higher volume and changes in the macroeconomic outlook. Net credit losses were down 7% from the prior-year period, driven by improved credit performance in Retail Services. The provision in the prior-year period was $2.2 billion, driven by $1.9 billion of net credit losses and a net ACL build of $250 million, driven by higher volume, partially offset by changes in credit quality.
USPB net income of $845 million increased 116%, driven by a lower provision for credit losses and higher revenues, partially offset by higher expenses.
8
All Other (Managed Basis)(a)(b) | | 4Q’25 | | 3Q’25 | | 4Q’24 | | QoQ% | | YoY% | | | 2025 | | 2024 | | %Δ | |||||
| | | | | | | | | | | | | | | | | | |||||
Legacy Franchises (managed basis) | | 329 | | 1,871 | | 1,563 | | (82)% | | (79)% | | | 5,512 | | 6,835 | | (19)% | |||||
| | | | | | | | | | | | | | | | | | | | | | |
Corporate / Other | | | (577) | | | (336) | | | (228) | | (72)% | | (153)% | | | (1,082) | | 668 | | NM | ||
| | | | | | | | | | | | | | | | | | | | | | |
Total revenues | | | (248) | | | 1,535 | | | 1,335 | | NM | | NM | | | 4,430 | | 7,503 | | (41)% | ||
| | | | | | | | | | | | | | | | | | | | | | |
| | | | | | | | | | | | | | | | | | | | | | |
Total operating expenses | | | 2,025 | | | 2,168 | | | 2,162 | | (7)% | | (6)% | | | 8,693 | | 9,030 | | (4)% | ||
| | | | | | | | | | | | | | | | | | | | | | |
| | | | | | | | | | | | | | | | | | | | | | |
Net credit losses | | | 341 | | | 297 | | | 257 | | 15% | | 33% | | | | 1,150 | | | 928 | | 24% |
| | | | | | | | | | | | | | | | | | | | | | |
Net ACL build / (release)(c) | | 77 | | 10 | | 111 | | NM | | (31)% | | | 223 | | 57 | | 291% | |||||
| | | | | | | | | | | | | | | | | | | | | | |
Other provisions(d) | | 31 | | 24 | | 29 | | 29% | | 7% | | | 140 | | 130 | | 8% | |||||
| | | | | | | | | | | | | | | | | | | | | | |
Total provision for credit losses | | | 449 | | | 331 | | | 397 | | 36% | | 13% | | | | 1,513 | | | 1,115 | | 36% |
| | | | | | | | | | | | | | | | | | | | | | |
| | | | | | | | | | | | | | | | | | | | | | |
Net (loss) | | $ | (2,316) | | $ | (705) | | $ | (1,070) | | (229)% | | (116)% | | | $ | (4,458) | | $ | (2,432) | | (83)% |
| | | | | | | | | | | | | | | | | | | | | | |
| | | | | | | | | | | | | | | | | | | | | | |
All Other Key Statistics and Metrics ($B) | | | | | | | | | | | | | | | | | | | | | | |
| | | | | | | | | | | | | | | | | | | | | | |
Allocated Average TCE(e) | | | 39 | | | 41 | | | 30 | | (5)% | | 32% | | | | 39 | | | 28 | | 42% |
| | | | | | | | | | | | | | | | | | | | | | |
(a) Includes Legacy Franchises and certain unallocated costs of global staff functions (including finance, risk, human resources, legal and compliance-related costs), other corporate expenses, and unallocated global operations and technology expenses and income taxes, as well as Corporate Treasury investment activities and discontinued operations.
(b) Reflects results on a managed basis, which excludes divestiture-related impacts related to Citi's divestitures of its Asia consumer banking businesses and the planned divestiture of Mexico Consumer/ SBMM within Legacy Franchises. For additional information, please refer to Footnote 11.
(c) Includes credit reserve build / (release) for loans and provision / (release) for credit losses on unfunded lending commitments.
(d) Includes provisions on Other Assets, policyholder benefits and claims and HTM debt securities.
(e) TCE is a non-GAAP financial measure. For additional information, refer to Footnote 3.
All Other (Managed Basis)(11)
All Other (managed basis) revenues were $(248) million, compared to $1.3 billion in the prior-year period, driven by declines in Legacy Franchises and Corporate/Other.
Legacy Franchises (managed basis)(11) revenues of $329 million decreased 79%, driven by the Russia-related notable item(1) and lower revenues related to closed exits and wind-downs, partially offset by growth in Mexico, including the impact of foreign exchange translation.
Corporate/Other revenues of $(577) million decreased from $(228) million in the prior-year period, driven by lower net interest income due to a lower benefit from cash and securities reinvestment, driven by actions taken over the last few quarters to reduce Citi’s asset sensitivity in a declining interest rate environment.
All Other (managed basis) expenses of $2.0 billion decreased 6%, driven by lower deposit insurance expenses in Corporate/Other, lower compensation and benefits and lower expenses related to closed exits and wind-downs in Legacy Franchises, largely offset by higher non-income tax charges, higher investment in technology, and the impact of foreign exchange translation.
All Other (managed basis) provision for credit losses was $449 million, driven by $341 million of net credit losses and a net ACL build of $108 million, primarily driven by higher volume, largely in Mexico. Net credit losses were up 33% from the prior-year period, driven by higher consumer volume and portfolio seasoning in Mexico Consumer. The provision in the prior-year period was $397 million, driven by $257 million of net credit losses and a net ACL build of $140 million, driven by higher consumer volume, changes in the macroeconomic outlook and changes in credit quality in Mexico Consumer.
All Other (managed basis) net loss was $(2.3) billion, compared to $(1.1) billion in the prior-year period, driven by lower revenues and a higher provision for credit losses, partially offset by lower expenses.
9
Citigroup will host a conference call today at 11:00 AM (ET). A live webcast of the presentation, as well as financial results and presentation materials, will be available at https://www.citigroup.com/global/investors. The live webcast of the presentation can also be accessed at https://www.veracast.com/webcasts/citigroup/webinars/CITI4Q25.cfm
Additional financial, statistical and business-related information, as well as business and segment trends, is included in a Quarterly Financial Data Supplement. Both this earnings release and Citigroup’s Fourth Quarter 2025 Quarterly Financial Data Supplement are available on Citigroup’s website at www.citigroup.com.
Citi is a preeminent banking partner for institutions with cross-border needs, a global leader in wealth management and a valued personal bank in its home market of the United States. Citi does business in more than 180 countries and jurisdictions, providing corporations, governments, investors, institutions and individuals with a broad range of financial products and services.
Additional information may be found at www.citigroup.com | X: @Citi | YouTube: www.youtube.com/citi | Blog: http://blog.citigroup.com | Facebook: www.facebook.com/citi | LinkedIn: www.linkedin.com/company/citi
Certain statements in this release are “forward-looking statements” within the meaning of the Private Securities Litigation Reform Act of 1995. These statements are based on management's current expectations and are subject to uncertainty and changes in circumstances. These statements are not guarantees of future results or occurrences. Actual results and capital and other financial condition may differ materially from those included in these statements due to a variety of factors. These factors include, among others: (i) macroeconomic, geopolitical and other challenges and uncertainties, including impacts related to slowing economic growth; elevated unemployment rates and inflation; changes in interest rates; any deterioration in business and consumer confidence and spending; changes in U.S. laws or policies, including those related to credit card interest rates, trade and tariffs; any U.S. government shutdown; and geopolitical tensions and hostilities; (ii) the execution and efficacy of Citi’s priorities regarding its simplification, transformation and enhanced business performance, including those related to revenues, net interest income, expenses, capital-related, credit and return expectations, as well as divestitures such as Grupo Financiero Banamex, S.A. de C.V.; (iii) changes in regulatory capital requirements, interpretations or rules; and (iv) the precautionary statements included in this release. These factors also consist of those contained in Citigroup's filings with the U.S. Securities and Exchange Commission, including without limitation the “Risk Factors” section of Citigroup’s 2024 Form 10-K. Any forward-looking statements made by or on behalf of Citigroup speak only as to the date they are made, and Citi does not undertake to update forward-looking statements to reflect the impact of circumstances or events that arise after the date the forward-looking statements were made.
Contacts: | |
| |
Investors: Jennifer Landis (212) 559-2718 | |
| |
Press: Danielle Romero-Apsilos (212) 816-2264 | |
10
(1) The impact of the Russia-related notable item includes:
($ in MM) | | Citigroup | | Services | | Markets | | Banking | | Legacy Franchises(a) | | Corporate/Other | ||||
| | | | | | | | | | | | | ||||
Total Non-interest Revenue Impact | | (1,173) | | 356 | | 19 | | 40 | | (1,556) | | (32) | ||||
Income Tax Benefit / (Expense) | | | 50 | | | - | | | - | | - | | 50 | | - | |
Total Net Income Impact | | | (1,123) | | | 356 | | | 19 | | 40 | | (1,506) | | (32) | |
(a) Includes approximately $1.6 billion related to the currency translation adjustment (CTA) losses that will remain in Accumulated Other Comprehensive Income (AOCI) until the closing of a sale.
For additional information on the Russia-related notable item in the fourth quarter 2025, see Citi’s Current Report on Form 8-K filed on December 29, 2025 with the U.S. Securities and Exchange Commission. Results of operations excluding the impact of the notable item are non-GAAP financial measures. Citi believes the presentation of its results of operations and financial condition excluding the notable item provides a meaningful depiction of the underlying fundamentals of its broader results for investors, industry analysts and others. For a reconciliation to reported results, please refer to the financial supplement included as Exhibit 99.1 to Citigroup's Current Report on Form 8-K filed with the SEC on January 14, 2026 (the 4Q25 Financial Supplement).
Services revenues and non-interest revenue, excluding the Russia-related notable item, are non-GAAP financial measures. For a reconciliation to reported results, please refer to the 4Q25 Financial Supplement.
(2) Ratios as of December 31, 2025 are preliminary. Citigroup’s return on average common stockholders’ equity (ROE) is calculated using net income less preferred stock dividends divided by average common stockholders’ equity.
(3) Ratios as of December 31, 2025 are preliminary. Citigroup’s allocated average tangible common equity (TCE) and return on average tangible common equity (RoTCE) are non-GAAP financial measures. RoTCE represents annualized net income available to common shareholders as a percentage of average TCE. For the components of these calculations, refer to the 4Q25 Financial Supplement. For a reconciliation of common equity to TCE, refer to the 4Q25 Financial Supplement.
As used herein, 2026 RoTCE is a forward-looking non-GAAP financial measure. From time to time, management may discuss forward-looking non-GAAP financial measures, such as forward-looking estimates or targets for revenue, expenses and RoTCE. Citi is unable to provide a reconciliation of forward-looking non-GAAP financial measures to their most directly comparable GAAP financial measures because Citi is unable to provide, without unreasonable effort, a meaningful or accurate calculation or estimation of amounts that would be necessary for the reconciliation due to the complexity and inherent difficulty in forecasting and quantifying future amounts or when they may occur. Such unavailable information could be significant for future results.
(4) As previously disclosed, third quarter 2025 results included a notable item consisting of a goodwill impairment of $726 million ($714 million after-tax), recorded in Other expenses, related to Citi’s agreement to sell a 25% equity stake in Grupo Financiero Banamex, S.A. de C.V. For additional information on the notable item in the third quarter 2025, see Citi’s Current Report on Form 8-K filed on September 24, 2025 with the U.S. Securities and Exchange Commission. On December 15, 2025, Citi completed the sale of the 25% equity stake in Grupo Financiero Banamex, S.A. de C.V. Results of operations excluding the impact of the notable item are non-GAAP financial measures. For a reconciliation to reported results, please refer to the 4Q25 Financial Supplement.
(5) Citigroup’s payout ratio is the sum of common dividends and common share repurchases divided by net income available to common shareholders.
(6) Ratios as of December 31, 2025 are preliminary. For the composition of Citigroup’s CET1 Capital and ratio and Citigroup’s Supplementary Leverage Ratio, refer to the 4Q25 Financial Supplement.
(7) Citigroup’s tangible book value per share is a non-GAAP financial measure. For a reconciliation of common equity to tangible common equity and resulting calculation of tangible book value per share, refer to the 4Q25 Financial Supplement.
(8) Included in Citi's reported revenues was an immaterial decrease in divestiture-related revenues of $(1) million in the fourth quarter 2025 compared to $4 million in the fourth quarter 2024. Accordingly, Citi is not adjusting for these amounts.
(9) Prime balances are defined as clients’ billable balances where Citigroup provides cash or synthetic prime brokerage services.
(10) Credit derivatives are used to economically hedge a portion of the Corporate Lending portfolio that includes both accrual loans and loans at fair value. Gain/(loss) on loan hedges includes the mark-to-market on the credit derivatives and the mark-to-market on the loans in the portfolio that are at fair value. The fixed premium costs of these hedges are netted against the Corporate Lending revenues to reflect the cost of credit protection. Citigroup’s results of operations excluding the impact of gain/(loss) on loan hedges are non-GAAP financial measures. For a reconciliation to reported results, refer to the 4Q25 Financial Supplement.
(11) All Other (managed basis) reflects results on a managed basis, which excludes divestiture-related impacts, for all periods, related to Citigroup’s divestitures of its Asia consumer banking businesses and the planned divestiture of Mexico Consumer/SBMM businesses within Legacy Franchises. Certain of the results of operations of All Other (managed basis) and Legacy Franchises (managed basis) that exclude divestiture-related impacts are non-GAAP financial measures. For additional information and a reconciliation of these results, refer to the 4Q25 Financial Supplement.
11
Exhibit 99.2

CITIGROUP—QUARTERLY FINANCIAL DATA SUPPLEMENT | 4Q25 |
| | Page | |
| Citigroup | | |
| Financial Summary | 1 | |
| Consolidated Statement of Income | 2 | |
| Consolidated Balance Sheet | 3 | |
| Segment Net Revenues and Income (Loss) | 4 | |
| | | |
| Services | 5 | |
| Markets | 6 | |
| Banking | 7 | |
| Wealth | 8 | |
| U.S. Personal Banking (USPB) | 9 | |
| Metrics | 10 | |
| All Other | 11 | |
| Legacy Franchises | 12 | |
| Corporate/Other | 13 | |
| Reconciling Items—Divestiture-Related Impacts | 14 | |
| | | |
| Citigroup Supplemental Detail | | |
| Average Balances and Interest Rates | 15 | |
| EOP (End-of-Period) Loans | 16 | |
| EOP Deposits | 17 | |
| Allowance for Credit Losses (ACL) Rollforward | 18 | |
| Allowance for Credit Losses on Loans (ACLL) and Unfunded Lending Commitments (ACLUC) | 19 - 20 | |
| Non-Accrual Assets | 21 | |
| Common Equity Tier 1 (CET1) Capital and Supplementary Leverage Ratios | 22 | |
| Tangible Common Equity, Common Equity, Book Value per Share, Tangible Book Value Per Share (TBVPS) and Returns on Common Equity (RoCE) and Tangible Common Equity (RoTCE) | 23 | |
| | | |
| Reconciliations of Adjusted Results and FX Impact | | |
| FX Impact | 24 | |
| Total Citigroup Revenues, Net Interest Income (NII) and Non-Interest Revenues (NIR), and Total Citigroup Operating Expenses | 25 | |
| Notable Items Adjustments and All Other (Managed Basis) | 26 | |
| All Other (Managed Basis),and Legacy Franchises (Managed Basis) | 27 | |
| Services and Banking-Corporate Lending Revenues | 28 | |
| 2021 - 2025 Annual - Total Citigroup Revenues, Total Operating Expenses, RoCE and RoTCE | 29 | |
| Legacy Franchises Exits Contribution | 30 | |
| | | |
(In millions of dollars, except per share amounts and as otherwise noted)
| | | | | | | | | | | 4Q25 Increase/ | | | Full | | Full | | FY 2025 vs. | ||||||||||
| | 4Q | | 1Q | | 2Q | | 3Q | | 4Q | | (Decrease) from | | | Year | | Year | | FY 2024 Increase/ | |||||||||
| | 2024 | | 2025 | | 2025 | | 2025 | | 2025 | | 3Q25 | | 4Q24 | | | 2024 | | 2025 | | (Decrease) | |||||||
| | | | | | | | | | | | | | | | | | | | | | | | | | | | |
Revenues, net of interest expense(1) | | $ | 19,465 | | $ | 21,596 | | $ | 21,668 | | $ | 22,090 | | $ | 19,871 | | (10%) | | 2% | | | $ | 80,722 | | $ | 85,225 | | 6% |
Operating expenses | | | 13,070 | | | 13,425 | | | 13,577 | | | 14,290 | | | 13,840 | | (3%) | | 6% | | | | 53,567 | | | 55,132 | | 3% |
Net credit losses (NCLs) | | | 2,242 | | | 2,459 | | | 2,234 | | | 2,214 | | | 2,190 | | (1%) | | (2%) | | | | 9,000 | | | 9,097 | | 1% |
Credit reserve build (release) for loans | | | 321 | | | 102 | | | 243 | | | 45 | | | 10 | | (78%) | | (97%) | | | | 726 | | | 400 | | (45%) |
Provision / (release) for unfunded lending commitments | | | (118) | | | 108 | | | (19) | | | 100 | | | 13 | | (87%) | | NM | | | | (119) | | | 202 | | NM |
Provisions for benefits and claims, other assets and HTM debt securities | | | 148 | | | 54 | | | 414 | | | 91 | | | 7 | | (92%) | | (95%) | | | | 502 | | | 566 | | 13% |
Provisions for credit losses and for benefits and claims | | | 2,593 | | | 2,723 | | | 2,872 | | | 2,450 | | | 2,220 | | (9%) | | (14%) | | | | 10,109 | | | 10,265 | | 2% |
Income (loss) from continuing operations before income taxes | | | 3,802 | | | 5,448 | | | 5,219 | | | 5,350 | | | 3,811 | | (29%) | | - | | | | 17,046 | | | 19,828 | | 16% |
Income taxes (benefits) | | | 912 | | | 1,340 | | | 1,186 | | | 1,559 | | | 1,288 | | (17%) | | 41% | | | | 4,211 | | | 5,373 | | 28% |
Income (loss) from continuing operations | | | 2,890 | | | 4,108 | | | 4,033 | | | 3,791 | | | 2,523 | | (33%) | | (13%) | | | | 12,835 | | | 14,455 | | 13% |
Income (loss) from discontinued operations, net of taxes | | | - | | | (1) | | | - | | | (1) | | | (1) | | - | | NM | | | | (2) | | | (3) | | (50%) |
Net income (loss) before noncontrolling interests | | | 2,890 | | | 4,107 | | | 4,033 | | | 3,790 | | | 2,522 | | (33%) | | (13%) | | | | 12,833 | | | 14,452 | | 13% |
Net income (loss) attributable to noncontrolling interests | | | 34 | | | 43 | | | 14 | | | 38 | | | 51 | | 34% | | 50% | | | | 151 | | | 146 | | (3%) |
Citigroup’s net income (loss) | | $ | 2,856 | | $ | 4,064 | | $ | 4,019 | | $ | 3,752 | | $ | 2,471 | | (34%) | | (13%) | | | $ | 12,682 | | $ | 14,306 | | 13% |
| | | | | | | | | | | | | | | | | | |||||||||||
Diluted earnings per share: | | | | | | | | | | | | | | | | | | | ||||||||||
Income (loss) from continuing operations | | $ | 1.34 | | $ | 1.96 | | $ | 1.96 | | $ | 1.86 | | $ | 1.19 | | (36%) | | (11%) | | | $ | 5.95 | | $ | 6.99 | | 17% |
Net income (loss) | | $ | 1.34 | | $ | 1.96 | | $ | 1.96 | | $ | 1.86 | | $ | 1.19 | | (36%) | | (11%) | | | $ | 5.94 | | $ | 6.99 | | 18% |
| | | | | | | | | | | | | | | | | | |||||||||||
Preferred dividends | | $ | 256 | | $ | 269 | | $ | 287 | | $ | 274 | | $ | 284 | | 4% | | 11% | | | $ | 1,054 | | $ | 1,114 | | 6% |
| | | | | | | | | | | | | | | | | | |||||||||||
Income allocated to unrestricted common shareholders—basic | | | | | | | | | | | | | | | | | | | ||||||||||
Income (loss) from continuing operations (for EPS purposes) | | | 2,563 | | | 3,752 | | | 3,683 | | | 3,439 | | | 2,150 | | (37%) | | (16%) | | | | 11,460 | | | 13,024 | | 14% |
Net income (loss) (for EPS purposes) | | | 2,563 | | | 3,751 | | | 3,683 | | | 3,438 | | | 2,149 | | (37%) | | (16%) | | | | 11,458 | | | 13,021 | | 14% |
| | | | | | | | | | | | | | | | | | |||||||||||
Income allocated to unrestricted common shareholders—diluted | | | | | | | | | | | | | | | | | | | ||||||||||
Income (loss) from continuing operations (for EPS purposes) | | | 2,583 | | | 3,769 | | | 3,702 | | | 3,459 | | | 2,170 | | (37%) | | (16%) | | | | 11,534 | | | 13,100 | | 14% |
Net income (loss) (for EPS purposes) | | | 2,583 | | | 3,768 | | | 3,702 | | | 3,458 | | | 2,169 | | (37%) | | (16%) | | | | 11,532 | | | 13,097 | | 14% |
| | | | | | | | | | | | | | | | | | |||||||||||
Shares (in millions): | | | | | | | | | | | | | | | | | | | ||||||||||
Average basic | | | 1,887.6 | | | 1,879.0 | | | 1,855.9 | | | 1,820.3 | | | 1,772.8 | | (3%) | | (6%) | | | | 1,901.4 | | | 1,832.0 | | (4%) |
Average diluted | | | 1,931.0 | | | 1,919.6 | | | 1,893.1 | | | 1,862.6 | | | 1,816.9 | | (2%) | | (6%) | | | | 1,940.1 | | | 1,873.1 | | (3%) |
Common shares outstanding, at period end | | | 1,877.1 | | | 1,867.7 | | | 1,840.9 | | | 1,789.3 | | | 1,747.5 | | (2%) | | (7%) | | | | | | | |||
| | | | | | | | | | | | | | | | | | |||||||||||
| | | | | | | | | | | | | | | | | | |||||||||||
Regulatory capital ratios and performance metrics: | | | | | | | | | | | | | | | | | | | ||||||||||
Common Equity Tier 1 (CET1) Capital ratio(2)(3)(4) | | | 13.63% | | | 13.41% | | | 13.48% | | | 13.27% | | | 13.2% | | | | | | | | | |||||
Tier 1 Capital ratio(2)(3)(4) | | | 15.31% | | | 15.10% | | | 14.98% | | | 14.97% | | | 13.7% | | | | | | | | | |||||
Total Capital ratio(2)(3)(4) | | | 15.42% | | | 15.41% | | | 15.28% | | | 15.31% | | | 15.7% | | | | | | | | | |||||
Supplementary Leverage ratio (SLR)(2)(4)(5) | | | 5.85% | | | 5.79% | | | 5.53% | | | 5.52% | | | 5.5% | | | | | | | | | |||||
Return on average assets | | | 0.46% | | | 0.65% | | | 0.61% | | | 0.55% | | | 0.36% | | (19) bps | | (10) bps | | | | 0.51% | | | 0.54% | | 3 bps |
Return on average common equity (RoCE) | | | 5.4% | | | 8.0% | | | 7.7% | | | 7.1% | | | 4.5% | | (260) bps | | (90) bps | | | | 6.1% | | | 6.8% | | 70 bps |
Average tangible common equity (TCE) (in billions of dollars)(6) | | $ | 168.6 | | $ | 169.3 | | $ | 172.1 | | $ | 172.3 | | $ | 170.4 | | (1%) | | 1% | | | $ | 166.7 | | $ | 170.6 | | 2% |
Return on tangible common equity (RoTCE)(6) | | | 6.1% | | | 9.1% | | | 8.7% | | | 8.0% | | | 5.1% | | (290) bps | | (100) bps | | | | 7.0% | | | 7.7% | | 70 bps |
Operating leverage(7) | | | 3,002 bps | | | 759 bps | | | 567 bps | | | 59 bps | | | (381) bps | | (440) bps | | (3,383) bps | | | | 770 bps | | | 266 bps | | (504) bps |
Efficiency ratio (total operating expenses/total revenues, net) | | | 67.1% | | | 62.2% | | | 62.7% | | | 64.7% | | | 69.6% | | 490 bps | | 250 bps | | | | 66.4% | | | 64.7% | | (170) bps |
| | | | | | | | | | | | | | | | | | |||||||||||
Balance sheet data (in billions of dollars, except per share amounts)(2): | | | | | | | | | | | | | | | | | | | ||||||||||
Total assets | | $ | 2,352.9 | | $ | 2,571.5 | | $ | 2,622.8 | | $ | 2,642.5 | | $ | 2,657.2 | | 1% | | 13% | | | | | | | |||
Total average assets | | | 2,474.8 | | | 2,517.1 | | | 2,647.8 | | | 2,688.8 | | | 2,722.5 | | 1% | | 10% | | | | 2,468.4 | | | 2,644.1 | | 7% |
Total loans | | | 694.5 | | | 702.1 | | | 725.3 | | | 733.9 | | | 752.2 | | 2% | | 8% | | | | | | | |||
Total deposits | | | 1,284.5 | | | 1,316.4 | | | 1,357.7 | | | 1,383.9 | | | 1,403.6 | | 1% | | 9% | | | | | | | |||
Citigroup’s stockholders’ equity | | | 208.6 | | | 212.4 | | | 213.2 | | | 213.0 | | | 212.3 | | - | | 2% | | | | | | | |||
Book value per share | | | 101.62 | | | 103.90 | | | 106.94 | | | 108.41 | | | 110.01 | | 1% | | 8% | | | | | | | |||
Tangible book value per share(6) | | | 89.34 | | | 91.52 | | | 94.16 | | | 95.72 | | | 97.06 | | 1% | | 9% | | | | | | | |||
| | | | | | | | | | | | | | | | | | |||||||||||
Direct staff (in thousands) | | | 229 | | | 229 | | | 230 | | | 227 | | | 226 | | - | | (1%) | | | | | | | |||
| | | | | | | | | | | | | | | | | | |||||||||||
| (1) | Effective January 1, 2025, certain transaction processing fees paid by Citi, primarily to credit card networks, reported within USPB, Services, Wealth, and All Other—Legacy Franchises (Mexico Consumer/SBMM and Asia Consumer), which were previously presented within Other operating expenses, are presented as contra-revenue within Commissions and fees reported in Non-interest revenue. Prior periods were conformed to reflect this change in presentation. |
| (2) | 4Q25 is preliminary. |
| (3) | Citi’s binding CET1 Capital ratio was derived under the Basel III Standardized Approach, whereas Citi’s binding Tier 1 Capital and Total Capital ratios were derived under the Basel III Advanced Approaches framework for December 31, 2025. In prior quarters, the binding Tier 1 Capital ratios were derived under the Basel III Standardized Approach For the composition of Citi’s CET1 Capital and ratio, see page 22. |
| (4) | Commencing January 1, 2025, the capital effects resulting from adoption of the Current Expected Credit Losses (CECL) methodology have been fully reflected in Citi’s regulatory capital. For additional information, see “Capital Resources—Regulatory Capital Treatment—Modified Transition of the Current Expected Credit Losses Methodology” in Citigroup’s 2024 Annual Report on Form 10-K. |
| (5) | For the composition of Citi’s SLR, see page 22. |
| (6) | TCE, RoTCE and Tangible book value per share are non-GAAP financial measures. See page 23 for a reconciliation of Tangible book value per share and Citi’s average TCE to Citi’s total average stockholders’ equity. |
| (7) | Represents the year-over-year growth rate in basis points (bps) of Total revenues, net of interest expense less the year-over-year growth rate of Total operating expenses. Positive operating leverage indicates that the revenue growth rate was greater than the expense growth rate. |
Note: Ratios and variance percentages are calculated based on the displayed amounts.
NM Not meaningful.
Reclassified to conform to the current period’s presentation.
Page 1
CITIGROUP CONSOLIDATED STATEMENT OF INCOME
(In millions of dollars)
| | | | | | | | | | | | | | | | 4Q25 Increase/ | | | Full | | Full | | FY 2025 vs. | |||||
| | 4Q | | 1Q | | 2Q | | 3Q | | 4Q | | (Decrease) from | | | Year | | Year | | FY 2024 Increase/ | |||||||||
| | 2024 | | 2025 | | 2025 | | 2025 | | 2025 | | 3Q25 | | 4Q24 | | | 2024 | | 2025 | | (Decrease) | |||||||
Revenues | | | | | | | | | | | | | | | | | | | | | | | | | | | | |
Interest income (including dividends) | | $ | 35,047 | | $ | 33,666 | | $ | 35,859 | | $ | 36,690 | | $ | 36,649 | | - | | 5% | | | $ | 143,713 | | $ | 142,864 | | (1%) |
Interest expense | | | 21,314 | | | 19,654 | | | 20,684 | | | 21,750 | | | 20,984 | | (4%) | | (2%) | | | | 89,618 | | | 83,072 | | (7%) |
Net interest income (NII) | | | 13,733 | | | 14,012 | | | 15,175 | | | 14,940 | | | 15,665 | | 5% | | 14% | | | | 54,095 | | | 59,792 | | 11% |
| | | | | | | | | | | | | | | | | | | | | | | | | | | | |
Commissions and fees(1) | | | 2,456 | | | 2,707 | | | 2,745 | | | 2,888 | | | 2,829 | | (2%) | | 15% | | | | 10,236 | | | 11,169 | | 9% |
Principal transactions(2) | | | 2,453 | | | 3,510 | | | 2,503 | | | 2,772 | | | 1,450 | | (48%) | | (41%) | | | | 11,109 | | | 10,235 | | (8%) |
Administration and other fiduciary fees | | | 992 | | | 1,045 | | | 1,123 | | | 1,117 | | | 1,129 | | 1% | | 14% | | | | 4,134 | | | 4,414 | | 7% |
Realized gains (losses) on sales of investments, net | | | 118 | | | 121 | | | 138 | | | 105 | | | 107 | | 2% | | (9%) | | | | 328 | | | 471 | | 44% |
Net impairment losses on investments recognized in earnings | | | (338) | | | (58) | | | (35) | | | (25) | | | (234) | | NM | | 31% | | | | (430) | | | (352) | | 18% |
Other revenue (loss)(2) | | | 51 | | | 259 | | | 19 | | | 293 | | | (1,075) | | NM | | NM | | | | 1,250 | | | (504) | | NM |
Total non-interest revenues (NIR) | | | 5,732 | | | 7,584 | | | 6,493 | | | 7,150 | | | 4,206 | | (41%) | | (27%) | | | | 26,627 | | | 25,433 | | (4%) |
Total revenues, net of interest expense(1) | | | 19,465 | | | 21,596 | | | 21,668 | | | 22,090 | | | 19,871 | | (10%) | | 2% | | | | 80,722 | | | 85,225 | | 6% |
| | | | | | | | | | | | | | | | | | |||||||||||
Provisions for credit losses and for benefits and claims | | | | | | | | | | | | | | | | | | | ||||||||||
Net credit losses on loans | | | 2,242 | | | 2,459 | | | 2,234 | | | 2,214 | | | 2,190 | | (1%) | | (2%) | | | | 9,000 | | | 9,097 | | 1% |
Credit reserve build / (release) for loans | | | 321 | | | 102 | | | 243 | | | 45 | | | 10 | | (78%) | | (97%) | | | | 726 | | | 400 | | (45%) |
Provision for credit losses on loans | | | 2,563 | | | 2,561 | | | 2,477 | | | 2,259 | | | 2,200 | | (3%) | | (14%) | | | | 9,726 | | | 9,497 | | (2%) |
Provision for credit losses on held-to-maturity (HTM) debt securities | | | (5) | | | (5) | | | 7 | | | (5) | | | 15 | | NM | | NM | | | | 50 | | | 12 | | (76%) |
Provision for credit losses on other assets | | | 136 | | | 39 | | | 381 | | | 79 | | | (32) | | NM | | NM | | | | 362 | | | 467 | | 29% |
Policyholder benefits and claims | | | 17 | | | 20 | | | 26 | | | 17 | | | 24 | | 41% | | 41% | | | | 90 | | | 87 | | (3%) |
Provision for credit losses on unfunded lending commitments | | | (118) | | | 108 | | | (19) | | | 100 | | | 13 | | (87%) | | NM | | | | (119) | | | 202 | | NM |
Total provisions for credit losses and for benefits and claims | | | 2,593 | | | 2,723 | | | 2,872 | | | 2,450 | | | 2,220 | | (9%) | | (14%) | | | | 10,109 | | | 10,265 | | 2% |
| | | | | | | | | | | | | | | | | | |||||||||||
Operating expenses | | | | | | | | | | | | | | | | | | | ||||||||||
Compensation and benefits | | | 6,923 | | | 7,464 | | | 7,633 | | | 7,474 | | | 7,068 | | (5%) | | 2% | | | | 28,542 | | | 29,639 | | 4% |
Technology / communication | | | 2,278 | | | 2,379 | | | 2,290 | | | 2,325 | | | 2,429 | | 4% | | 7% | | | | 9,035 | | | 9,423 | | 4% |
Transactional and product servicing | | | 1,102 | | | 1,102 | | | 1,184 | | | 1,110 | | | 1,179 | | 6% | | 7% | | | | 4,438 | | | 4,575 | | 3% |
Premises and equipment | | | 650 | | | 574 | | | 615 | | | 607 | | | 681 | | 12% | | 5% | | | | 2,438 | | | 2,477 | | 2% |
Professional services | | | 650 | | | 476 | | | 510 | | | 514 | | | 573 | | 11% | | (12%) | | | | 2,016 | | | 2,073 | | 3% |
Advertising and marketing | | | 323 | | | 250 | | | 269 | | | 260 | | | 318 | | 22% | | (2%) | | | | 1,113 | | | 1,097 | | (1%) |
Restructuring | | | (11) | | | (3) | | | (2) | | | (5) | | | (4) | | 20% | | 64% | | | | 259 | | | (14) | | NM |
Other operating(1) | | | 1,155 | | | 1,183 | | | 1,078 | | | 2,005 | | | 1,596 | | (20%) | | 38% | | | | 5,726 | | | 5,862 | | 2% |
Total operating expenses(1) | | | 13,070 | | | 13,425 | | | 13,577 | | | 14,290 | | | 13,840 | | (3%) | | 6% | | | | 53,567 | | | 55,132 | | 3% |
| | | | | | | | | | | | | | | | | | |||||||||||
| | | | | | | | | | | | | | | | | | |||||||||||
Income (loss) from continuing operations before income taxes | | | 3,802 | | | 5,448 | | | 5,219 | | | 5,350 | | | 3,811 | | (29%) | | - | | | | 17,046 | | | 19,828 | | 16% |
Provision (benefit) for income taxes | | | 912 | | | 1,340 | | | 1,186 | | | 1,559 | | | 1,288 | | (17%) | | 41% | | | | 4,211 | | | 5,373 | | 28% |
| | | | | | | | | | | | | | | | | | |||||||||||
Income (loss) from continuing operations | | | 2,890 | | | 4,108 | | | 4,033 | | | 3,791 | | | 2,523 | | (33%) | | (13%) | | | | 12,835 | | | 14,455 | | 13% |
Discontinued operations | | | | | | | | | | | | | | | | | | | ||||||||||
Income (loss) from discontinued operations | | | - | | | (1) | | | - | | | (1) | | | (1) | | - | | NM | | | | (2) | | | (3) | | (50%) |
Provision (benefit) for income taxes | | | - | | | - | | | - | | | - | | | - | | - | | - | | | | - | | | - | | - |
Income (loss) from discontinued operations, net of taxes | | | - | | | (1) | | | - | | | (1) | | | (1) | | - | | NM | | | | (2) | | | (3) | | (50%) |
| | | | | | | | | | | | | | | | | | |||||||||||
Net income (loss) before attribution to noncontrolling interests | | | 2,890 | | | 4,107 | | | 4,033 | | | 3,790 | | | 2,522 | | (33%) | | (13%) | | | | 12,833 | | | 14,452 | | 13% |
Noncontrolling interests | | | 34 | | | 43 | | | 14 | | | 38 | | | 51 | | 34% | | 50% | | | | 151 | | | 146 | | (3%) |
| | | | | | | | | | | | | | | | | | | | | | | | | | | | |
Citigroup’s net income (loss) | | $ | 2,856 | | $ | 4,064 | | $ | 4,019 | | $ | 3,752 | | $ | 2,471 | | (34%) | | (13%) | | | $ | 12,682 | | $ | 14,306 | | 13% |
| | | | | | | | | | | | | | | | | | | | | | | | | | | | |
| (1) | See footnote 1 on page 1. |
| (2) | Effective July 1, 2025, gains and losses on certain economic and qualifying hedging derivatives and foreign currency transaction gains and losses related to non-U.S. dollar debt and certain foreign operations in countries with highly inflationary economies with the U.S. dollar as their functional currency, which were previously presented within Other revenue, are presented within Principal transactions. Prior periods were conformed to reflect this change in presentation. |
NM Not meaningful.
Reclassified to conform to the current period’s presentation.
Page 2
CITIGROUP CONSOLIDATED BALANCE SHEET
(In millions of dollars)
| | | | | | | | | | | | | | | | 4Q25 Increase/ | |||
| | December 31, | | March 31, | | June 30, | | September 30, | | December 31, | | (Decrease) from | |||||||
| | 2024 | | 2025 | | 2025 | | 2025 | | 2025(1) | | 3Q25 | | 4Q24 | |||||
Assets | | | | | | | | | | | | | | | | | | | |
Cash and due from banks (including segregated cash and other deposits) | | $ | 22,782 | | $ | 24,463 | | $ | 24,991 | | $ | 23,545 | | $ | 23,717 | | 1% | | 4% |
Deposits with banks, net of allowance | | | 253,750 | | | 283,868 | | | 312,482 | | | 324,515 | | | 325,862 | | - | | 28% |
Securities borrowed and purchased under agreements to resell, net of allowance | | | 274,062 | | | 390,215 | | | 323,892 | | | 321,347 | | | 356,195 | | 11% | | 30% |
Brokerage receivables, net of allowance | | | 50,841 | | | 57,440 | | | 64,029 | | | 75,992 | | | 62,679 | | (18%) | | 23% |
Trading account assets | | | 442,747 | | | 518,577 | | | 568,558 | | | 562,254 | | | 537,139 | | (4%) | | 21% |
Investments | | | | | | | | | | | | | | | | | | | |
Available-for-sale debt securities | | | 226,876 | | | 225,180 | | | 235,802 | | | 246,227 | | | 246,720 | | - | | 9% |
Held-to-maturity debt securities, net of allowance | | | 242,382 | | | 220,385 | | | 206,094 | | | 197,092 | | | 189,831 | | (4%) | | (22%) |
Equity securities | | | 7,399 | | | 7,323 | | | 7,504 | | | 7,413 | | | 7,678 | | 4% | | 4% |
Total investments | | | 476,657 | | | 452,888 | | | 449,400 | | | 450,732 | | | 444,229 | | (1%) | | (7%) |
Loans | | | | | | | | | | | | | | | | | | | |
Consumer(2) | | | 393,102 | | | 386,312 | | | 395,759 | | | 398,628 | | | 408,533 | | 2% | | 4% |
Corporate(3) | | | 301,386 | | | 315,744 | | | 329,586 | | | 335,277 | | | 343,697 | | 3% | | 14% |
Loans, net of unearned income | | | 694,488 | | | 702,056 | | | 725,345 | | | 733,905 | | | 752,230 | | 2% | | 8% |
Allowance for credit losses on loans (ACLL) | | | (18,574) | | | (18,726) | | | (19,123) | | | (19,206) | | | (19,247) | | - | | (4%) |
Total loans, net | | | 675,914 | | | 683,330 | | | 706,222 | | | 714,699 | | | 732,983 | | 3% | | 8% |
Goodwill | | | 19,300 | | | 19,422 | | | 19,878 | | | 19,126 | | | 19,098 | | - | | (1%) |
Intangible assets (including MSRs) | | | 4,494 | | | 4,430 | | | 4,409 | | | 4,330 | | | 4,284 | | (1%) | | (5%) |
Premises and equipment, net of depreciation and amortization | | | 30,192 | | | 30,814 | | | 32,312 | | | 32,819 | | | 33,339 | | 2% | | 10% |
Other assets, net of allowance | | | 102,206 | | | 106,067 | | | 116,599 | | | 113,116 | | | 117,677 | | 4% | | 15% |
Total assets | | $ | 2,352,945 | | $ | 2,571,514 | | $ | 2,622,772 | | $ | 2,642,475 | | $ | 2,657,202 | | 1% | | 13% |
| | | | | | | | | | | | ||||||||
Liabilities | | | | | | | | | | | | | |||||||
Non-interest-bearing deposits in U.S. offices | | $ | 123,338 | | $ | 122,472 | | $ | 119,898 | | $ | 116,921 | | $ | 121,610 | | 4% | | (1%) |
Interest-bearing deposits in U.S. offices | | | 551,547 | | | 562,628 | | | 575,709 | | | 592,728 | | | 613,052 | | 3% | | 11% |
Total U.S. deposits | | | 674,885 | | | 685,100 | | | 695,607 | | | 709,649 | | | 734,662 | | 4% | | 9% |
Non-interest-bearing deposits in offices outside the U.S. | | | 84,349 | | | 82,215 | | | 86,458 | | | 83,920 | | | 87,041 | | 4% | | 3% |
Interest-bearing deposits in offices outside the U.S. | | | 525,224 | | | 549,095 | | | 575,668 | | | 590,360 | | | 581,870 | | (1%) | | 11% |
Total international deposits | | | 609,573 | | | 631,310 | | | 662,126 | | | 674,280 | | | 668,911 | | (1%) | | 10% |
| | | | | | | | | | | | ||||||||
Total deposits | | | 1,284,458 | | | 1,316,410 | | | 1,357,733 | | | 1,383,929 | | | 1,403,573 | | 1% | | 9% |
Securities loaned and sold under agreements to repurchase | | | 254,755 | | | 403,959 | | | 347,913 | | | 349,726 | | | 348,098 | | - | | 37% |
Brokerage payables | | | 66,601 | | | 78,302 | | | 90,949 | | | 89,596 | | | 74,836 | | (16%) | | 12% |
Trading account liabilities | | | 133,846 | | | 148,688 | | | 163,952 | | | 160,243 | | | 162,798 | | 2% | | 22% |
Short-term borrowings | | | 48,505 | | | 49,139 | | | 55,560 | | | 54,760 | | | 51,878 | | (5%) | | 7% |
Long-term debt | | | 287,300 | | | 295,684 | | | 317,761 | | | 315,846 | | | 315,827 | | - | | 10% |
Other liabilities, plus allowances(4) | | | 68,114 | | | 66,074 | | | 74,774 | | | 74,498 | | | 86,370 | | 16% | | 27% |
Total liabilities | | $ | 2,143,579 | | $ | 2,358,256 | | $ | 2,408,642 | | $ | 2,428,598 | | $ | 2,443,380 | | 1% | | 14% |
| | | | | | | | | | | | ||||||||
| | | | | | | | | | | | ||||||||
Stockholders’ equity | | | | | | | | | | | | | |||||||
Preferred stock | | $ | 17,850 | | $ | 18,350 | | $ | 16,350 | | $ | 19,050 | | $ | 20,050 | | 5% | | 12% |
| | | | | | | | | | | | | | | | | | | |
Common stock | | | 31 | | | 31 | | | 31 | | | 31 | | | 31 | | - | | - |
Additional paid-in capital(5) | | | 109,117 | | | 108,616 | | | 108,839 | | | 109,010 | | | 108,452 | | (1%) | | (1%) |
Retained earnings | | | 206,294 | | | 209,013 | | | 211,674 | | | 214,034 | | | 215,128 | | 1% | | 4% |
Treasury stock, at cost | | | (76,842) | | | (77,880) | | | (79,886) | | | (84,932) | | | (89,473) | | (5%) | | (16%) |
Accumulated other comprehensive income (loss) (AOCI)(5)(6) | | | (47,852) | | | (45,722) | | | (43,786) | | | (44,170) | | | (41,897) | | 5% | | 12% |
Total common equity | | $ | 190,748 | | $ | 194,058 | | $ | 196,872 | | $ | 193,973 | | $ | 192,241 | | (1%) | | 1% |
| | | | | | | | | | | | ||||||||
Total Citigroup stockholders’ equity | | $ | 208,598 | | $ | 212,408 | | $ | 213,222 | | $ | 213,023 | | $ | 212,291 | | - | | 2% |
Noncontrolling interests(5) | | | 768 | | | 850 | | | 908 | | | 854 | | | 1,531 | | 79% | | 99% |
Total equity | | | 209,366 | | | 213,258 | | | 214,130 | | | 213,877 | | | 213,822 | | - | | 2% |
Total liabilities and equity | | $ | 2,352,945 | | $ | 2,571,514 | | $ | 2,622,772 | | $ | 2,642,475 | | $ | 2,657,202 | | 1% | | 13% |
| | | | | | | | | | | | ||||||||
| (1) | December 31, 2025 is preliminary. |
| (2) | Consumer loans include loans managed by USPB, Wealth, and All Other—Legacy Franchises (other than Mexico small business and middle-market banking (Mexico SBMM), and the Assets Finance Group (AFG)). |
| (3) | Corporate loans include loans managed by Services, Markets, Banking, and All Other—Legacy Franchises—Mexico SBMM, and the AFG. |
| (4) | Includes allowance for credit losses for unfunded lending commitments. See page 19. |
| (5) | The December 31, 2025 balances includes the impact from the sale of the 25% equity stake in Grupo Financiero Banamex, S.A. de C.V. |
| (6) | Included within AOCI is the Cumulative Translation Adjustment (CTA), net of hedges and taxes, attributable to Grupo Financiero Banamex, S.A. de C.V. and its consolidated subsidiaries as of June 30, 2025 and September 30, 2025. During the quarter of deconsolidation, the CTA loss will be recognized through earnings, impacting EPS and RoTCE, and reversing the temporary capital benefit from prior sales; the cumulative impact of CTA will ultimately be regulatory capital neutral. |
NM Not meaningful.
Reclassified to conform to the current period’s presentation.
Page 3
OPERATING SEGMENT, REPORTING UNIT, AND COMPONENT DETAILS
(In millions of dollars)
| | | | | | | | | | | | 4Q25 Increase/ | | | Full | | Full | | FY 2025 vs. | | |||||||||
| | 4Q | | 1Q | | 2Q | | 3Q | | 4Q | | (Decrease) from | | | Year | | Year | | FY 2024 Increase/ | | |||||||||
| | 2024 | | 2025 | | 2025 | | 2025 | | 2025 | | 3Q25 | | 4Q24 | | | 2024 | | 2025 | | (Decrease) | | |||||||
Revenues, net of interest expense(1) | | | | | | | | | | | | | | | | | | | | | | | |||||||
Services | | $ | 5,165 | | $ | 4,889 | | $ | 5,062 | | $ | 5,363 | | $ | 5,942 | | 11% | | 15% | | | $ | 19,618 | | $ | 21,256 | | 8% | |
Markets | | | 4,576 | | | 5,986 | | | 5,879 | | | 5,563 | | | 4,542 | | (18%) | | (1%) | | | | 19,836 | | | 21,970 | | 11% | |
Banking | | | 1,241 | | | 1,952 | | | 1,921 | | | 2,132 | | | 2,210 | | 4% | | 78% | | | | 6,201 | | | 8,215 | | 32% | |
Wealth | | | 1,994 | | | 2,096 | | | 2,166 | | | 2,164 | | | 2,133 | | (1%) | | 7% | | | | 7,483 | | | 8,559 | | 14% | |
U.S. Personal Banking (USPB) | | | 5,150 | | | 5,228 | | | 5,119 | | | 5,331 | | | 5,293 | | (1%) | | 3% | | | | 20,055 | | | 20,971 | | 5% | |
All Other—managed basis(2)(3) | | | 1,335 | | | 1,445 | | | 1,698 | | | 1,535 | | | (248) | | NM | | NM | | | | 7,503 | | | 4,430 | | (41%) | |
Reconciling Items—divestiture-related impacts(4) | | | 4 | | | - | | | (177) | | | 2 | | | (1) | | NM | | NM | | | | 26 | | | (176) | | NM | |
Total net revenues—reported | | $ | 19,465 | | $ | 21,596 | | $ | 21,668 | | $ | 22,090 | | $ | 19,871 | | (10%) | | 2% | | | $ | 80,722 | | $ | 85,225 | | 6% | |
| | | | | | | | | | | | | | | | | | | |||||||||||
Income (loss) from continuing operations | | | | | | | | | | | | | | | | | | | | ||||||||||
Services | | $ | 1,888 | | $ | 1,610 | | $ | 1,448 | | $ | 1,819 | | $ | 2,262 | | 24% | | 20% | | | $ | 6,584 | | $ | 7,139 | | 8% | |
Markets | | | 1,026 | | | 1,795 | | | 1,749 | | | 1,583 | | | 801 | | (49%) | | (22%) | | | | 5,005 | | | 5,928 | | 18% | |
Banking | | | 357 | | | 542 | | | 461 | | | 635 | | | 686 | | 8% | | 92% | | | | 1,529 | | | 2,324 | | 52% | |
Wealth | | | 334 | | | 284 | | | 494 | | | 374 | | | 338 | | (10%) | | 1% | | | | 1,002 | | | 1,490 | | 49% | |
USPB | | | 392 | | | 745 | | | 649 | | | 858 | | | 845 | | (2%) | | 116% | | | | 1,382 | | | 3,097 | | 124% | |
All Other—managed basis(2)(3) | | | (1,071) | | | (853) | | | (588) | | | (701) | | | (2,299) | | (228%) | | (115%) | | | | (2,460) | | | (4,441) | | (81%) | |
Reconciling Items—divestiture-related impacts(4) | | | (36) | | | (15) | | | (180) | | | (777) | | | (110) | | 86% | | (206%) | | | | (207) | | | (1,082) | | (423%) | |
Income (loss) from continuing operations—reported | | | 2,890 | | | 4,108 | | | 4,033 | | | 3,791 | | | 2,523 | | (33%) | | (13%) | | | | 12,835 | | | 14,455 | | 13% | |
| | | | | | | | | | | | | | | | | | | |||||||||||
Discontinued operations | | | - | | | (1) | | | - | | | (1) | | | (1) | | - | | NM | | | | (2) | | | (3) | | (50%) | |
| | | | | | | | | | | | | | | | | | | |||||||||||
Net income (loss) attributable to noncontrolling interests | | | 34 | | | 43 | | | 14 | | | 38 | | | 51 | | 34% | | 50% | | | | 151 | | | 146 | | (3%) | |
Net income (loss) | | $ | 2,856 | | $ | 4,064 | | $ | 4,019 | | $ | 3,752 | | $ | 2,471 | | (34%) | | (13%) | | | $ | 12,682 | | $ | 14,306 | | 13% | |
| | | | | | | | | | | | | | | | | | | |||||||||||
| (1) | See footnote 1 on page 1. |
| (2) | Includes Legacy Franchises and certain unallocated costs of global staff functions (including finance, risk, human resources, legal, and compliance-related costs), other corporate expenses, and unallocated global operations and technology expenses, and income taxes, as well as Corporate Treasury investment activities and discontinued operations. |
| (3) | Reflects results on a managed basis, which excludes divestiture-related impacts related to Citi’s divestitures of its Asia consumer banking businesses and the planned divestiture of Mexico Consumer/SBMM (consists of Mexico consumer banking (Mexico Consumer) and Small Business and Middle-Market Banking (SBMM), collectively (Mexico Consumer/SBMM)) within Legacy Franchises. See pages 12 and 14 for additional information. |
| (4) | Reconciling Items consist of the divestiture-related impacts excluded from All Other on a managed basis. See page 14 for additional information. The Reconciling Items are fully reflected in the various line items in Citi’s Consolidated Statement of Income (page 2). See page 14 for additional information. |
NM Not meaningful.
Reclassified to conform to the current period’s presentation.
Page 4
SERVICES
(In millions of dollars, except as otherwise noted)
| | | | | | | | | | | | 4Q25 Increase/ | | | Full | | Full | | FY 2025 vs. | | |||||||||
| | 4Q | | 1Q | | 2Q | | 3Q | | 4Q | | (Decrease) from | | | Year | | Year | | FY 2024 Increase/ | | |||||||||
| | 2024 | | 2025 | | 2025 | | 2025 | | 2025 | | 3Q25 | | 4Q24 | | | 2024 | | 2025 | | (Decrease) | | |||||||
| | | | | | | | | | | | | | | | | | | | | | | | | | | | | |
Net interest income (including dividends) | | $ | 3,446 | | $ | 3,498 | | $ | 3,630 | | $ | 3,823 | | $ | 4,050 | | 6% | | 18% | | | $ | 13,423 | | $ | 15,001 | | 12% | |
Fee revenue | | | | | | | | | | | | | | | | | | | | ||||||||||
Commissions and fees(1) | | | 806 | | | 815 | | | 904 | | | 880 | | | 879 | | - | | 9% | | | | 3,296 | | | 3,478 | | 6% | |
Administration and other fiduciary fees | | | 635 | | | 658 | | | 752 | | | 746 | | | 751 | | 1% | | 18% | | | | 2,716 | | | 2,907 | | 7% | |
Total fee revenue | | | 1,441 | | | 1,473 | | | 1,656 | | | 1,626 | | | 1,630 | | - | | 13% | | | | 6,012 | | | 6,385 | | 6% | |
Principal transactions(2) | | | 212 | | | 233 | | | 124 | | | 190 | | | 257 | | 35% | | 21% | | | | 753 | | | 804 | | 7% | |
All other(2)(3) | | | 66 | | | (315) | | | (348) | | | (276) | | | 5 | | NM | | (92%) | | | | (570) | | | (934) | | (64%) | |
Total non-interest revenue | | | 1,719 | | | 1,391 | | | 1,432 | | | 1,540 | | | 1,892 | | 23% | | 10% | | | | 6,195 | | | 6,255 | | 1% | |
Total revenues, net of interest expense(1) | | | 5,165 | | | 4,889 | | | 5,062 | | | 5,363 | | | 5,942 | | 11% | | 15% | | | | 19,618 | | | 21,256 | | 8% | |
Total operating expenses(1) | | | 2,601 | | | 2,584 | | | 2,679 | | | 2,707 | | | 2,843 | | 5% | | 9% | | | | 10,568 | | | 10,813 | | 2% | |
Net credit losses (recoveries) on loans | | | 28 | | | 6 | | | 20 | | | 11 | | | 19 | | 73% | | (32%) | | | | 48 | | | 56 | | 17% | |
Credit reserve build (release) for loans | | | (71) | | | 24 | | | 53 | | | (4) | | | (18) | | (350%) | | 75% | | | | (130) | | | 55 | | NM | |
Provision (release) for credit losses on unfunded lending commitments | | | (4) | | | (6) | | | (6) | | | (8) | | | 3 | | NM | | NM | | | | 17 | | | (17) | | NM | |
Provisions for credit losses for other assets and HTM debt securities | | | 159 | | | 27 | | | 286 | | | 62 | | | (15) | | NM | | NM | | | | 341 | | | 360 | | 6% | |
Provision for credit losses | | | 112 | | | 51 | | | 353 | | | 61 | | | (11) | | NM | | NM | | | | 276 | | | 454 | | 64% | |
Income from continuing operations before taxes | | | 2,452 | | | 2,254 | | | 2,030 | | | 2,595 | | | 3,110 | | 20% | | 27% | | | | 8,774 | | | 9,989 | | 14% | |
Income taxes | | | 564 | | | 644 | | | 582 | | | 776 | | | 848 | | 9% | | 50% | | | | 2,190 | | | 2,850 | | 30% | |
Income from continuing operations | | | 1,888 | | | 1,610 | | | 1,448 | | | 1,819 | | | 2,262 | | 24% | | 20% | | | | 6,584 | | | 7,139 | | 8% | |
Noncontrolling interests | | | 17 | | | 15 | | | 16 | | | 17 | | | 16 | | (6%) | | (6%) | | | | 101 | | | 64 | | (37%) | |
Net income | | $ | 1,871 | | $ | 1,595 | | $ | 1,432 | | $ | 1,802 | | $ | 2,246 | | 25% |
| 20% | | | $ | 6,483 | | $ | 7,075 | | 9% | |
EOP assets (in billions) | | $ | 584 | | $ | 589 | | $ | 618 | | $ | 627 | | $ | 628 | | - | | 8% | | | | | | | | |||
Average assets (in billions) | | | 596 | | | 578 | | | 593 | | | 616 | | | 630 | | 2% | | 6% | | | $ | 586 | | $ | 604 | | 3% | |
Efficiency ratio | | | 50% | | | 53% | | | 53% | | | 50% | | | 48% | | (200) bps | | (200) bps | | | | 54% | | | 51% | | (300) bps | |
Average allocated TCE (in billions)(4) | | $ | 24.9 | | $ | 24.7 | | $ | 24.7 | | $ | 24.7 | | $ | 24.7 | | - | | (1%) | | | $ | 24.9 | | $ | 24.7 | | (1%) | |
RoTCE(4) | | | 29.9% | | | 26.2% | | | 23.3% | | | 28.9% | | | 36.1% | | 720 bps | | 620 bps | | | | 26.0% | | | 28.6% | | 260 bps | |
| | | | | | | | | | | | | | | | | | | |||||||||||
Revenue by line of business | | | | | | | | | | | | | | | | | | | | ||||||||||
Net interest income | | $ | 2,840 | | $ | 2,865 | | $ | 2,949 | | $ | 3,121 | | $ | 3,303 | | 6% | | 16% | | | $ | 10,923 | | $ | 12,238 | | 12% | |
Non-interest revenue | | | 1,095 | | | 775 | | | 725 | | | 761 | | | 879 | | 16% | | (20%) | | | | 3,578 | | | 3,140 | | (12%) | |
Treasury and Trade Solutions (TTS) | | | 3,935 | | | 3,640 | | | 3,674 | | | 3,882 | | | 4,182 | | 8% | | 6% | | | | 14,501 | | | 15,378 | | 6% | |
Net interest income | | | 606 | | | 633 | | | 681 | | | 702 | | | 747 | | 6% | | 23% | | | | 2,500 | | | 2,763 | | 11% | |
Non-interest revenue | | | 624 | | | 616 | | | 707 | | | 779 | | | 1,013 | | 30% | | 62% | | | | 2,617 | | | 3,115 | | 19% | |
Securities Services | | | 1,230 | | | 1,249 | | | 1,388 | | | 1,481 | | | 1,760 | | 19% | | 43% | | | | 5,117 | | | 5,878 | | 15% | |
Total Services | | $ | 5,165 | | $ | 4,889 | | $ | 5,062 | | $ | 5,363 | | $ | 5,942 | | 11% | | 15% | | | $ | 19,618 | | $ | 21,256 | | 8% | |
| | | | | | | | | | | | | | | | | | | |||||||||||
Revenue by geography | | | | | | | | | | | | | | | | | | | | ||||||||||
North America | | $ | 1,504 | | $ | 1,445 | | $ | 1,539 | | $ | 1,637 | | $ | 1,829 | | 12% | | 22% | | | $ | 5,402 | | $ | 6,450 | | 19% | |
International | | | 3,661 | | | 3,444 | | | 3,523 | | | 3,726 | | | 4,113 | | 10% | | 12% | | | | 14,216 | | | 14,806 | | 4% | |
Total | | $ | 5,165 | | $ | 4,889 | | $ | 5,062 | | $ | 5,363 | | $ | 5,942 | | 11% | | 15% | | | $ | 19,618 | | $ | 21,256 | | 8% | |
| | | | | | | | | | | | | | | | | | | |||||||||||
Key drivers(5) (in billions of dollars, except as otherwise noted) | | | | | | | | | | | | | | | | | | | | ||||||||||
Average loans by line of business | | | | | | | | | | | | | | | | | | | | ||||||||||
TTS | | $ | 85 | | $ | 86 | | $ | 93 | | $ | 93 | | $ | 95 | | 2% | | 12% | | | $ | 84 | | $ | 92 | | 10% | |
Securities Services | | | 2 | | | 1 | | | 1 | | | 1 | | | 1 | | - | | (50%) | | | | 1 | | | 1 | | - | |
Total | | $ | 87 | | $ | 87 | | $ | 94 | | $ | 94 | | $ | 96 | | 2% | | 10% | | | $ | 85 | | $ | 93 | | 9% | |
| | | | | | | | | | | | | | | | | | | |||||||||||
ACLL as a % of EOP loans(6) | | | 0.30% | | | 0.30% | | | 0.36% | | | 0.35% | | | 0.33% | | (2) bps | | 3 bps | | | | | | | | |||
| | | | | | | | | | | | | | | | | | | |||||||||||
Average deposits by line of business | | | | | | | | | | | | | | | | | | | | ||||||||||
TTS | | $ | 704 | | $ | 690 | | $ | 713 | | $ | 744 | | $ | 780 | | 5% | | 11% | | | $ | 689 | | $ | 732 | | 6% | |
Securities Services | | | 135 | | | 136 | | | 144 | | | 149 | | | 155 | | 4% | | 15% | | | | 130 | | | 146 | | 12% | |
Total | | $ | 839 | | $ | 826 | | $ | 857 | | $ | 893 | | $ | 935 | | 5% | | 11% | | | $ | 819 | | $ | 878 | | 7% | |
| | | | | | | | | | | | | | | | | | | |||||||||||
AUC/AUA (in trillions of dollars)(7) | | $ | 25.4 | | $ | 26.1 | | $ | 28.2 | | $ | 29.7 | | $ | 31.4 | | 6% | | 24% | | | | | | | | |||
Cross-border transaction value(8) | | $ | 101.3 | | $ | 95.1 | | $ | 101.3 | | $ | 104.8 | | $ | 115.2 | | 10% | | 14% | | | $ | 379.7 | | $ | 416.4 | | 10% | |
U.S. dollar clearing volume (in millions)(9) | | | 44.1 | | | 42.7 | | | 44.3 | | | 44.8 | | | 45.3 | | 1% | | 3% | | | | 168.0 | | | 177.1 | | 5% | |
Commercial card spend volume | | $ | 17.3 | | $ | 17.2 | | $ | 17.9 | | $ | 18.4 | | $ | 17.7 | | (4%) | | 2% | | | $ | 70.4 | | $ | 71.2 | | 1% | |
| | | | | | | | | | | | | | | | | | | |||||||||||
| (1) | See footnote 1 on page 1. |
| (2) | See footnote 2 on page 2. |
| (3) | Services revenues reflect the impact of a revenue sharing arrangement with Banking – Corporate Lending, for Services products sold to Corporate Lending clients. This generally results in a reduction in Services reported revenue. |
| (4) | TCE and RoTCE are non-GAAP financial measures. See page 23 for a reconciliation of the summation of the segments’ and component’s average allocated TCE to Citigroup’s total average TCE and Citi’s total average stockholders’ equity. |
| (5) | Management uses this information in reviewing the segment’s results and believes it is useful to investors concerning underlying segment performance and trends. |
| (6) | Excludes loans that are carried at fair value for all periods. |
| (7) | 4Q25 is preliminary. |
| (8) | Represents the total value of cross-border foreign exchange payments processed through Citi platforms. |
| (9) | Represents the number of U.S. dollar Clearing Payment instructions processed on behalf of U.S. and foreign-domiciled entities (primarily financial institutions). |
NM Not meaningful.
Reclassified to conform to the current period’s presentation.
Page 5
MARKETS
(In millions of dollars, except as otherwise noted)
| | | | | | | | | | | 4Q25 Increase/ | | | Full | | Full | | FY 2025 vs. | ||||||||||
| | 4Q | | 1Q | | 2Q | | 3Q | | 4Q | | (Decrease) from | | | Year | | Year | | FY 2024 Increase/ | |||||||||
| | 2024 | | 2025 | | 2025 | | 2025 | | 2025 | | 3Q25 | | 4Q24 | | | 2024 | | 2025 | | (Decrease) | |||||||
| | | | | | | | | | | | | | | | | | | | | | |||||||
Net interest income (including dividends) | | $ | 1,856 | | $ | 2,013 | | $ | 2,902 | | $ | 2,251 | | $ | 2,843 | | 26% | | 53% | | | $ | 7,005 | | $ | 10,009 | | 43% |
Fee revenue | | | | | | | | | | | | | | | | | | | ||||||||||
Brokerage and fees | | | 329 | | | 400 | | | 399 | | | 400 | | | 364 | | (9%) | | 11% | | | | 1,402 | | | 1,563 | | 11% |
Investment banking fees(1) | | | 104 | | | 135 | | | 106 | | | 163 | | | 120 | | (26%) | | 15% | | | | 426 | | | 524 | | 23% |
Other(2) | | | 50 | | | 52 | | | 51 | | | 63 | | | 57 | | (10%) | | 14% | | | | 238 | | | 223 | | (6%) |
Total fee revenue | | | 483 | | | 587 | | | 556 | | | 626 | | | 541 | | (14%) | | 12% | | | | 2,066 | | | 2,310 | | 12% |
| | | | | | | | | | | | | | | | | | | | | | | | | | | | |
Principal transactions(3) | | | 2,341 | | | 3,270 | | | 2,335 | | | 2,746 | | | 1,200 | | (56%) | | (49%) | | | | 10,822 | | | 9,551 | | (12%) |
All other(3)(4) | | | (104) | | | 116 | | | 86 | | | (60) | | | (42) | | 30% | | 60% | | | | (57) | | | 100 | | NM |
Total non-interest revenue | | | 2,720 | | | 3,973 | | | 2,977 | | | 3,312 | | | 1,699 | | (49%) | | (38%) | | | | 12,831 | | | 11,961 | | (7%) |
| | | | | | | | | | | | | | | | | | | | | | | | | | | | |
Total revenues, net of interest expense | | | 4,576 | | | 5,986 | | | 5,879 | | | 5,563 | | | 4,542 | | (18%) | | (1%) | | | | 19,836 | | | 21,970 | | 11% |
Total operating expenses | | | 3,174 | | | 3,468 | | | 3,509 | | | 3,491 | | | 3,609 | | 3% | | 14% | | | | 13,202 | | | 14,077 | | 7% |
| | | | | | | | | | | | | | | | | | | | | | | | | | | | |
Net credit losses (recoveries) on loans | | | - | | | 142 | | | 8 | | | 68 | | | (12) | | NM | | NM | | | | 168 | | | 206 | | 23% |
Credit reserve build (release) for loans | | | 167 | | | 48 | | | 53 | | | (44) | | | (73) | | (66%) | | NM | | | | 213 | | | (16) | | NM |
Provision (release) for credit losses on unfunded lending commitments | | | (31) | | | 9 | | | (8) | | | 13 | | | (7) | | NM | | 77% | | | | 17 | | | 7 | | (59%) |
Provisions for credit losses for other assets and HTM debt securities | | | (2) | | | 2 | | | 55 | | | (5) | | | (12) | | (140%) | | (500%) | | | | 65 | | | 40 | | (38%) |
Provision for credit losses | | | 134 | | | 201 | | | 108 | | | 32 | | | (104) | | NM | | NM | | | | 463 | | | 237 | | (49%) |
Income (loss) from continuing operations before taxes | | | 1,268 | | | 2,317 | | | 2,262 | | | 2,040 | | | 1,037 | | (49%) | | (18%) | | | | 6,171 | | | 7,656 | | 24% |
Income taxes (benefits) | | | 242 | | | 522 | | | 513 | | | 457 | | | 236 | | (48%) | | (2%) | | | | 1,166 | | | 1,728 | | 48% |
Income (loss) from continuing operations | | | 1,026 | | | 1,795 | | | 1,749 | | | 1,583 | | | 801 | | (49%) | | (22%) | | | | 5,005 | | | 5,928 | | 18% |
Noncontrolling interests | | | 17 | | | 13 | | | 21 | | | 21 | | | 18 | | (14%) | | 6% | | | | 75 | | | 73 | | (3%) |
Net income (loss) | | $ | 1,009 | | $ | 1,782 | | $ | 1,728 | | $ | 1,562 | | $ | 783 | | (50%) | | (22%) | | | $ | 4,930 | | $ | 5,855 | | 19% |
EOP assets (in billions) | | $ | 949 | | $ | 1,165 | | $ | 1,166 | | $ | 1,182 | | $ | 1,187 | | - | | 25% | | | | | | | |||
Average assets (in billions) | | | 1,058 | | | 1,121 | | | 1,222 | | | 1,231 | | | 1,249 | | 1% | | 18% | | | $ | 1,063 | | $ | 1,206 | | 13% |
Efficiency ratio | | | 69% | | | 58% | | | 60% | | | 63% | | | 79% | | 1,600 bps | | 1,000 bps | | | | 67% | | | 64% | | (300) bps |
Average allocated TCE (in billions)(5) | | $ | 54.0 | | $ | 50.4 | | $ | 50.4 | | $ | 50.4 | | $ | 50.4 | | - | | (7%) | | | $ | 54.0 | | $ | 50.4 | | (7%) |
RoTCE(5) | | | 7.4% | | | 14.3% | | | 13.8% | | | 12.3% | | | 6.2% | | (610) bps | | (120) bps | | | | 9.1% | | | 11.6% | | 250 bps |
| | | | | | | | | | | | | | | | | | |||||||||||
Revenue by line of business | | | | | | | | | | | | | | | | | | | ||||||||||
Fixed Income Markets | | $ | 3,478 | | $ | 4,477 | | $ | 4,268 | | $ | 4,023 | | $ | 3,458 | | (14%) | | (1%) | | | $ | 14,750 | | $ | 16,226 | | 10% |
Equity Markets | | | 1,098 | | | 1,509 | | | 1,611 | | | 1,540 | | | 1,084 | | (30%) | | (1%) | | | | 5,086 | | | 5,744 | | 13% |
Total | | $ | 4,576 | | $ | 5,986 | | $ | 5,879 | | $ | 5,563 | | $ | 4,542 | | (18%) | | (1%) | | | $ | 19,836 | | $ | 21,970 | | 11% |
| | | | | | | | | | | | | | | | | | |||||||||||
Rates and Currencies | | $ | 2,421 | | $ | 3,048 | | $ | 3,134 | | $ | 2,823 | | $ | 2,413 | | (15%) | | - | | | $ | 10,152 | | $ | 11,418 | | 12% |
Spread Products / Other Fixed Income | | | 1,057 | | | 1,429 | | | 1,134 | | | 1,200 | | | 1,045 | | (13%) | | (1%) | | | | 4,598 | | | 4,808 | | 5% |
Total Fixed Income Markets revenues | | $ | 3,478 | | $ | 4,477 | | $ | 4,268 | | $ | 4,023 | | $ | 3,458 | | (14%) | | (1%) | | | $ | 14,750 | | $ | 16,226 | | 10% |
| | | | | | | | | | | | | | | | | | |||||||||||
Revenue by geography | | | | | | | | | | | | | | | | | | | ||||||||||
North America | | $ | 1,691 | | $ | 2,176 | | $ | 2,130 | | $ | 2,195 | | $ | 1,856 | | (15%) | | 10% | | | $ | 7,562 | | $ | 8,357 | | 11% |
International | | | 2,885 | | | 3,810 | | | 3,749 | | | 3,368 | | | 2,686 | | (20%) | | (7%) | | | | 12,274 | | | 13,613 | | 11% |
Total | | $ | 4,576 | | $ | 5,986 | | $ | 5,879 | | $ | 5,563 | | $ | 4,542 | | (18%) | | (1%) | | | $ | 19,836 | | $ | 21,970 | | 11% |
| | | | | | | | | | | | | | | | | | |||||||||||
Key drivers(6) (in billions of dollars) | | | | | | | | | | | | | | | | | | | ||||||||||
Average loans | | $ | 122 | | $ | 128 | | $ | 136 | | $ | 147 | | $ | 152 | | 3% | | 25% | | | $ | 120 | | $ | 141 | | 18% |
NCLs as a % of average loans | | | 0.00% | | | 0.45% | | | 0.02% | | | 0.18% | | | (0.03%) | | (21) bps | | (3) bps | | | | 0.14% | | | 0.15% | | 1 bps |
ACLL as a % of EOP loans(7) | | | 0.88% | | | 0.89% | | | 0.85% | | | 0.78% | | | 0.67% | | (11) bps | | (21) bps | | | | | | | |||
Average trading account assets | | $ | 449 | | $ | 476 | | $ | 549 | | $ | 556 | | $ | 557 | | - | | 24% | | | $ | 436 | | $ | 535 | | 23% |
| | | | | | | | | | | | | | | | | | |||||||||||
| | | | | | | | | | | | | | | | | | |||||||||||
| (1) | Investment banking fees are primarily composed of underwriting, advisory, loan syndication structuring, and other related financing activity. |
| (2) | Primarily includes other non-brokerage and investment banking fees from customer-driven activities. |
| (3) | See footnote 2 on page 2. |
| (4) | Markets revenues reflect the impact of a revenue sharing arrangement with Banking – Corporate Lending, for Markets products sold to Corporate Lending clients. This generally results in a reduction in Markets reported revenue. |
| (5) | TCE and RoTCE are non-GAAP financial measures. See page 23 for a reconciliation of the summation of the segments’ and component’s average allocated TCE to Citigroup’s total average TCE and Citi’s total average stockholders’ equity. |
| (6) | Management uses this information in reviewing the segment’s results and believes it is useful to investors concerning underlying segment performance and trends. |
| (7) | Excludes loans that are carried at fair value for all periods. |
NM Not meaningful.
Reclassified to conform to the current period’s presentation.
Page 6
BANKING
(In millions of dollars, except as otherwise noted)
4Q25 Increase/ | | Full | Full | FY 2025 vs. | ||||||||||||||||||||||||
4Q | 1Q | 2Q | 3Q | 4Q | (Decrease) from | | Year | Year | FY 2024 Increase/ | |||||||||||||||||||
| 2024 | | 2025 | | 2025 | | 2025 | | 2025 | | 3Q25 | | 4Q24 | | | 2024 | | 2025 | | (Decrease) | ||||||||
| ||||||||||||||||||||||||||||
Net interest income (including dividends) | $ | 521 | | $ | 491 | | $ | 530 | | $ | 562 | | $ | 549 | | (2%) | | 5% | | $ | 2,157 | | $ | 2,132 | | (1%) | ||
Fee revenue |
|
| |
| ||||||||||||||||||||||||
Investment banking fees(1) | 951 | 1,104 | 1,058 | 1,169 | 1,287 |
| 10% | 35% | | 3,857 | 4,618 |
| 20% | |||||||||||||||
Other(2) | 51 | 49 | 59 | 65 | 60 |
| (8%) |
| 18% | | 174 | 233 |
| 34% | ||||||||||||||
Total fee revenue | 1,002 | 1,153 | 1,117 | 1,234 | 1,347 |
| 9% | 34% | | 4,031 | 4,851 |
| 20% | |||||||||||||||
Principal transactions(3) | (212) | (90) | (179) | (164) | (119) |
| 27% | 44% | | (787) | (552) |
| 30% | |||||||||||||||
All other(3)(4) | (70) | 398 | 453 | 500 | 433 |
| (13%) | NM | | 800 | 1,784 |
| 123% | |||||||||||||||
Total non-interest revenue | 720 | 1,461 | 1,391 | 1,570 | 1,661 |
| 6% | 131% | | 4,044 | 6,083 |
| 50% | |||||||||||||||
| | | | | | | | | | | | | | | | | | | | | | | | | | | | |
Total revenues, net of interest expense | 1,241 | 1,952 | 1,921 | 2,132 | 2,210 |
| 4% | 78% | | 6,201 | 8,215 |
| 32% | |||||||||||||||
Total operating expenses | 1,051 | 1,034 | 1,137 | 1,139 | 1,152 |
| 1% | 10% | | 4,477 | 4,462 |
| - | |||||||||||||||
| | | | | | | | | | | | | | | | | | | | | | | | | | | | |
Net credit losses on loans | 7 | 34 | 16 | 9 | 25 |
| 178% | 257% | | 149 | 84 |
| (44%) | |||||||||||||||
Credit reserve build (release) for loans | (122) | 78 | 137 | 38 | 136 |
| 258% | NM | | (200) | 389 |
| NM | |||||||||||||||
Provision (release) for credit losses on unfunded lending commitments | (82) | 107 | 2 | 98 | 14 |
| (86%) | NM | | (128) | 221 |
| NM | |||||||||||||||
Provisions for credit losses for other assets and HTM debt securities | (43) | (5) | 18 | 12 | 1 |
| (92%) | NM | | (45) | 26 |
| NM | |||||||||||||||
Provision for credit losses | (240) | 214 | 173 | 157 | 176 |
| 12% | NM | | (224) | 720 |
| NM | |||||||||||||||
Income (loss) from continuing operations before taxes | 430 | 704 | 611 | 836 | 882 |
| 6% | 105% | | 1,948 | 3,033 |
| 56% | |||||||||||||||
Income taxes (benefits) | 73 | 162 | 150 | 201 | 196 |
| (2%) | 168% | | 419 | 709 |
| 69% | |||||||||||||||
Income (loss) from continuing operations | 357 | 542 | 461 | 635 | 686 |
| 8% | 92% | | 1,529 | 2,324 |
| 52% | |||||||||||||||
Noncontrolling interests | 1 | (1) | (2) | (3) | 1 |
| NM | - | | 5 | (5) |
| NM | |||||||||||||||
Net income (loss) | $ | 356 | $ | 543 | $ | 463 | $ | 638 | $ | 685 |
| 7% | 92% | | $ | 1,524 | $ | 2,329 |
| 53% | ||||||||
EOP assets (in billions) | $ | 143 | $ | 147 | $ | 148 | $ | 141 | $ | 140 |
| (1%) | (2%) | |
| |||||||||||||
Average assets (in billions) | 149 | 144 | 150 | 149 | 146 |
| (2%) | (2%) | | $ | 152 | $ | 147 |
| (3%) | |||||||||||||
Efficiency ratio | 85% | 53% | 59% | 53% | 52% | (100) bps | (3,300) bps | | 72% | 54% | (1,800) bps | |||||||||||||||||
Average allocated TCE (in billions)(5) | $ | 21.8 | $ | 20.6 | $ | 20.6 | $ | 20.6 | $ | 20.6 |
| - | (6%) | | $ | 21.8 | $ | 20.6 |
| (6%) | ||||||||
RoTCE(5) | 6.5% | 10.7% | 9.0% | 12.3% | 13.2% | 90 bps | 670 bps | | 7.0% | 11.3% | 430 bps | |||||||||||||||||
| ||||||||||||||||||||||||||||
Revenue by line of business |
| |
| |||||||||||||||||||||||||
Total Investment Banking | $ | 925 | $ | 1,035 | $ | 981 | $ | 1,146 | $ | 1,272 |
| 11% | 38% | | $ | 3,637 | $ | 4,434 |
| 22% | ||||||||
Corporate Lending (excluding gain (loss) on loan hedges)(4)(6) | 322 | 903 | 1,002 | 1,030 | 964 |
| (6%) | 199% | | 2,744 | 3,899 |
| 42% | |||||||||||||||
Total Banking revenues (ex-gain (loss) on loan hedges)(4)(6) | 1,247 | 1,938 | 1,983 | 2,176 | 2,236 |
| 3% | 79% | | 6,381 | 8,333 |
| 31% | |||||||||||||||
Gain (loss) on loan hedges(4)(6) | (6) | 14 | (62) | (44) | (26) |
| 41% | (333%) | | (180) | (118) |
| 34% | |||||||||||||||
Total Banking revenues including gain/(loss) on loan hedges(4)(6) | $ | 1,241 | $ | 1,952 | $ | 1,921 | $ | 2,132 | $ | 2,210 |
| 4% | 78% | | $ | 6,201 | $ | 8,215 |
| 32% | ||||||||
| ||||||||||||||||||||||||||||
Business metrics—investment banking fees |
| |
| |||||||||||||||||||||||||
Advisory | $ | 353 | $ | 424 | $ | 408 | $ | 427 | $ | 649 |
| 52% | 84% | | $ | 1,245 | $ | 1,908 |
| 53% | ||||||||
Equity underwriting (Equity Capital Markets (ECM)) | 214 | 127 | 218 | 174 | 180 |
| 3% | (16%) | | 688 | 699 |
| 2% | |||||||||||||||
Debt underwriting (Debt Capital Markets (DCM)) | 384 | 553 | 432 | 568 | 458 |
| (19%) | 19% | | 1,924 | 2,011 |
| 5% | |||||||||||||||
Total | $ | 951 | $ | 1,104 | $ | 1,058 | $ | 1,169 | $ | 1,287 |
| 10% | 35% | | $ | 3,857 | $ | 4,618 |
| 20% | ||||||||
| ||||||||||||||||||||||||||||
Revenue by geography |
| |
| |||||||||||||||||||||||||
North America | $ | 738 | $ | 989 | $ | 781 | $ | 995 | $ | 1,143 |
| 15% | 55% | | $ | 3,097 | $ | 3,908 |
| 26% | ||||||||
International | 503 | 963 | 1,140 | 1,137 | 1,067 |
| (6%) | 112% | | 3,104 | 4,307 |
| 39% | |||||||||||||||
Total | $ | 1,241 | $ | 1,952 | $ | 1,921 | $ | 2,132 | $ | 2,210 |
| 4% | 78% | | $ | 6,201 | $ | 8,215 |
| 32% | ||||||||
| ||||||||||||||||||||||||||||
Key drivers(7) (in billions of dollars) |
|
| |
| ||||||||||||||||||||||||
Average loans | $ | 84 | $ | 82 | $ | 84 | $ | 81 | $ | 79 |
| (2%) |
| (6%) | | $ | 88 | $ | 82 |
| (7%) | |||||||
NCLs as a % of average loans | 0.03% | 0.17% | 0.08% | 0.04% | 0.13% | 9 bps |
| 10 bps | | 0.17% | 0.10% | (7) bps | ||||||||||||||||
ACLL as a % of EOP loans(8) | 1.42% | 1.54% | 1.72% | 1.83% | 2.04% | 21 bps |
| 62 bps | | | |
| ||||||||||||||||
| | | | | | | | | | | | | | | | | | | | | | | | | | | | |
| (1) | Investment banking fees are primarily composed of underwriting, advisory, loan syndication structuring, and other related financing activity. |
| (2) | Primarily includes other non-investment banking fees from customer-driven activities. |
| (3) | See footnote 2 on page 2. |
| (4) | Banking revenues reflect the impact of a revenue sharing arrangement with Banking – Corporate Lending, for Investment Banking, Markets and Services products sold to Corporate Lending clients. This generally results in an increase in Banking reported revenue. |
| (5) | TCE and RoTCE are non-GAAP financial measures. See page 23 for a reconciliation of the summation of the segments’ and component’s average allocated TCE to Citigroup’s total average TCE and Citi’s total average stockholders’ equity. |
| (6) | Credit derivatives are used to economically hedge a portion of the corporate loan portfolio that includes both accrual loans and loans at fair value. Gain (loss) on loan hedges includes the mark-to-market on the credit derivatives, partially offset by the mark-to-market on the loans in the portfolio that are at fair value. Hedges on accrual loans reflect the mark-to-market on credit derivatives used to economically hedge the corporate loan accrual portfolio. The fixed premium costs of these hedges are netted against the corporate lending revenues to reflect the cost of credit protection. Citigroup’s results of operations excluding the impact of gain (loss) on loan hedges are non-GAAP financial measures. |
| (7) | Management uses this information in reviewing the segment’s results and believes it is useful to investors concerning underlying segment performance and trends. |
| (8) | Excludes loans that are carried at fair value for all periods. |
NM Not meaningful.
Reclassified to conform to the current period’s presentation.
Page 7
WEALTH
(In millions of dollars, except as otherwise noted)
| | | | | | | | | | | | 4Q25 Increase/ | | | Full | | Full | | FY 2025 vs. | |||||||||
| | 4Q | | 1Q | | 2Q | | 3Q | | 4Q | | (Decrease) from | | | Year | | Year | | FY 2024 Increase/ | |||||||||
| | 2024 | | 2025 | | 2025 | | 2025 | | 2025 | | 3Q25 | | 4Q24 | | | 2024 | | 2025 | | (Decrease) | |||||||
| | | | | | | | | | | | | | | | | | | | | | | | | | | | |
Net interest income | | $ | 1,247 | | $ | 1,274 | | $ | 1,278 | | $ | 1,332 | | $ | 1,397 | | 5% | | 12% | | | $ | 4,508 | | $ | 5,281 | | 17% |
Fee revenue | | | | | | | | | | | | | | | | | | | | | | | | | | | | |
Commissions and fees(1) | | | 358 | | | 399 | | | 370 | | | 406 | | | 376 | | (7%) | | 5% | | | | 1,380 | | | 1,551 | | 12% |
Other(2) | | | 245 | | | 247 | | | 245 | | | 232 | | | 238 | | 3% | | (3%) | | | | 949 | | | 962 | | 1% |
Total fee revenue | | | 603 | | | 646 | | | 615 | | | 638 | | | 614 | | (4%) | | 2% | | | | 2,329 | | | 2,513 | | 8% |
All other(3) | | | 144 | | | 176 | | | 273 | | | 194 | | | 122 | | (37%) | | (15%) | | | | 646 | | | 765 | | 18% |
Total non-interest revenue | | | 747 | | | 822 | | | 888 | | | 832 | | | 736 | | (12%) | | (1%) | | | | 2,975 | | | 3,278 | | 10% |
| | | | | | | | | | | | | | | | | | | | | | | | | | | | |
Total revenues, net of interest expense(1) | | | 1,994 | | | 2,096 | | | 2,166 | | | 2,164 | | | 2,133 | | (1%) | | 7% | | | | 7,483 | | | 8,559 | | 14% |
| | | | | | | | | | | | | | | | | | | | | | | | | | | | |
Total operating expenses(1) | | | 1,561 | | | 1,639 | | | 1,558 | | | 1,654 | | | 1,650 | | - | | 6% | | | | 6,326 | | | 6,501 | | 3% |
Net credit losses on loans | | | 30 | | | 38 | | | 40 | | | 56 | | | 36 | | (36%) | | 20% | | | | 121 | | | 170 | | 40% |
Credit reserve build (release) for loans | | | (11) | | | 61 | | | (64) | | | (25) | | | 2 | | NM | | NM | | | | (236) | | | (26) | | 89% |
Provision (release) for credit losses on unfunded lending commitments | | | - | | | (1) | | | (2) | | | (1) | | | 1 | | NM | | NM | | | | (9) | | | (3) | | 67% |
Provisions for benefits and claims (PBC), and other assets | | | 1 | | | - | | | - | | | - | | | (1) | | NM | | NM | | | | (2) | | | (1) | | 50% |
Provisions for credit losses and for PBC | | | 20 | | | 98 | | | (26) | | | 30 | | | 38 | | 27% | | 90% | | | | (126) | | | 140 | | NM |
Income from continuing operations before taxes | | | 413 | | | 359 | | | 634 | | | 480 | | | 445 | | (7%) | | 8% | | | | 1,283 | | | 1,918 | | 49% |
Income taxes | | | 79 | | | 75 | | | 140 | | | 106 | | | 107 | | 1% | | 35% | | | | 281 | | | 428 | | 52% |
Income from continuing operations | | | 334 | | | 284 | | | 494 | | | 374 | | | 338 | | (10%) | | 1% | | | | 1,002 | | | 1,490 | | 49% |
Noncontrolling interests | | | - | | | - | | | - | | | - | | | - | | - | | - | | | | - | | | - | | - |
Net income | | $ | 334 | | $ | 284 | | $ | 494 | | $ | 374 | | $ | 338 | | (10%) | | 1% | | | $ | 1,002 | | $ | 1,490 | | 49% |
EOP assets (in billions) | | $ | 224 | | $ | 224 | | $ | 228 | | $ | 232 | | $ | 230 | | (1%) | | 3% | | | | | | | | | |
Average assets (in billions) | | | 227 | | | 223 | | | 226 | | | 233 | | | 240 | | 3% | | 6% | | | $ | 231 | | $ | 231 | | - |
Efficiency ratio | | | 78% | | | 78% | | | 72% | | | 76% | | | 77% | | 100 bps | | (100) bps | | | | 85% | | | 76% | | (900) bps |
Average allocated TCE (in billions)(4) | | $ | 13.2 | | $ | 12.3 | | $ | 12.3 | | $ | 12.3 | | $ | 12.3 | | - | | (7%) | | | $ | 13.2 | | $ | 12.3 | | (7%) |
RoTCE(4) | | | 10.1% | | | 9.4% | | | 16.1% | | | 12.1% | | | 10.9% | | (120) bps | | 80 bps | | | | 7.6% | | | 12.1% | | 450 bps |
| | | | | | | | | | | | | | | | | | | | | | | | | | | | |
Revenue by line of business | | | | | | | | | | | | | | | | | | | | | | | | | | | | |
Private Bank | | $ | 590 | | $ | 664 | | $ | 731 | | $ | 656 | | $ | 625 | | (5%) | | 6% | | | $ | 2,386 | | $ | 2,676 | | 12% |
Citigold | | | 1,148 | | | 1,164 | | | 1,214 | | | 1,294 | | | 1,281 | | (1%) | | 12% | | | | 4,221 | | | 4,953 | | 17% |
Wealth at Work | | | 256 | | | 268 | | | 221 | | | 214 | | | 227 | | 6% | | (11%) | | | | 876 | | | 930 | | 6% |
Total | | $ | 1,994 | | $ | 2,096 | | $ | 2,166 | | $ | 2,164 | | $ | 2,133 | | (1%) | | 7% | | | $ | 7,483 | | $ | 8,559 | | 14% |
| | | | | | | | | | | | | | | | | | | | | | | | | | | | |
Revenue by geography | | | | | | | | | | | | | | | | | | | | | | | | | | | | |
North America | | $ | 1,008 | | $ | 1,073 | | $ | 1,081 | | $ | 1,066 | | $ | 1,096 | | 3% | | 9% | | | $ | 3,628 | | $ | 4,316 | | 19% |
International | | | 986 | | | 1,023 | | | 1,085 | | | 1,098 | | | 1,037 | | (6%) | | 5% | | | | 3,855 | | | 4,243 | | 10% |
Total | | $ | 1,994 | | $ | 2,096 | | $ | 2,166 | | $ | 2,164 | | $ | 2,133 | | (1%) | | 7% | | | $ | 7,483 | | $ | 8,559 | | 14% |
| | | | | | | | | | | | | | | | | | | | | | | | | | | | |
Key drivers(5) (in billions of dollars) | | | | | | | | | | | | | | | | | | | | | | | | | | | | |
| | | | | | | | | | | | | | | | | | | | | | | | | | | | |
EOP client balances | | | | | | | | | | | | | | | | | | | | | | | | | | | | |
Client investment assets(6)(7) | | $ | 587 | | $ | 595 | | $ | 635 | | $ | 660 | | $ | 670 | | 2% | | 14% | | | | | | | | | |
Deposits | | | 313 | | | 309 | | | 310 | | | 318 | | | 324 | | 2% | | 4% | | | | | | | | | |
Loans | | | 148 | | | 147 | | | 151 | | | 151 | | | 150 | | (1%) | | 2% | | | | | | | | | |
Total | | $ | 1,048 | | $ | 1,051 | | $ | 1,096 | | $ | 1,129 | | $ | 1,144 | | 1% | | 9% | | | | | | | | | |
| | | | | | | | | | | | | | | | | | | | | | | | | | | | |
Net new investment assets (NNIA)(7)(8) | | $ | 15.6 | | $ | 16.5 | | $ | 2.0 | | $ | 18.6 | | $ | 7.2 | | (61%) | | (54%) | | | $ | 42.5 | | $ | 44.3 | | 4% |
Average deposits | | | 315 | | | 310 | | | 308 | | | 315 | | | 319 | | 1% | | 1% | | | | 316 | | | 313 | | (1%) |
Average loans | | | 148 | | | 147 | | | 149 | | | 151 | | | 149 | | (1%) | | 1% | | | | 149 | | | 149 | | - |
ACLL as a % of EOP loans | | | 0.36% | | | 0.40% | | | 0.36% | | | 0.34% | | | 0.34% | | 0 bps | | (2) bps | | | | | | | | | |
| | | | | | | | | | | | | | | | | | | | | | | | | | | | |
| (1) | See footnote 1 on page 1. |
| (2) | Primarily related to fiduciary and administrative fees. |
| (3) | Primarily related to principal transactions revenue including FX translation. |
| (4) | TCE and RoTCE are non-GAAP financial measures. See page 23 for a reconciliation of the summation of the segments’ and component’s average allocated TCE to Citigroup’s total average TCE and Citi’s total average stockholders’ equity. |
| (5) | Management uses this information in reviewing the segment’s results and believes it is useful to investors concerning underlying segment performance and trends. |
| (6) | Includes assets under management, and trust and custody assets. |
| (7) | 4Q25 is preliminary. |
| (8) | Represents investment asset inflows, including dividends, interest and distributions, less investment asset outflows. |
NM Not meaningful.
Reclassified to conform to the current period’s presentation.
Page 8
U.S. PERSONAL BANKING (USPB)
(In millions of dollars, except as otherwise noted)
| | | | | | | | | | | 4Q25 Increase/ | | | Full | | Full | | FY 2025 vs. | ||||||||||
| | 4Q | | 1Q | | 2Q | | 3Q | | 4Q | | (Decrease) from | | | Year | | Year | | FY 2024 Increase/ | |||||||||
| | 2024 | | 2025 | | 2025 | | 2025 | | 2025 | | 3Q25 | | 4Q24 | | | 2024 | | 2025 | | (Decrease) | |||||||
| | | | | | | | | | | | | | | | | | | | | | |||||||
Net interest income | | $ | 5,481 | | $ | 5,541 | | $ | 5,471 | | $ | 5,694 | | $ | 5,764 | | 1% | | 5% | | | $ | 21,103 | | $ | 22,470 | | 6% |
Fee revenue | | | | | | | | | | | | | | | | | | | ||||||||||
Interchange fees(1)(2) | | | 2,483 | | | 2,324 | | | 2,499 | | | 2,488 | | | 2,567 | | 3% | | 3% | | | | 9,591 | | | 9,878 | | 3% |
Card rewards and partner payments | | | (2,960) | | | (2,821) | | | (3,008) | | | (3,031) | | | (3,215) | | (6%) | | (9%) | | | | (11,226) | | | (12,075) | | (8%) |
Other(2) | | | 139 | | | 143 | | | 147 | | | 162 | | | 162 | | - | | 17% | | | | 468 | | | 614 | | 31% |
Total fee revenue | | | (338) | | | (354) | | | (362) | | | (381) | | | (486) | | (28%) | | (44%) | | | | (1,167) | | | (1,583) | | (36%) |
All other(3) | | | 7 | | | 41 | | | 10 | | | 18 | | | 15 | | (17%) | | 114% | | | | 119 | | | 84 | | (29%) |
Total non-interest revenue | | | (331) | | | (313) | | | (352) | | | (363) | | | (471) | | (30%) | | (42%) | | | | (1,048) | | | (1,499) | | (43%) |
| | | | | | | | | | | | | | | | | | | | | | | | | | | | |
Total revenues, net of interest expense(1) | | | 5,150 | | | 5,228 | | | 5,119 | | | 5,331 | | | 5,293 | | (1%) | | 3% | | | | 20,055 | | | 20,971 | | 5% |
| | | | | | | | | | | | | | | | | | | | | | | | | | | | |
Total operating expenses(1) | | | 2,465 | | | 2,442 | | | 2,381 | | | 2,365 | | | 2,521 | | 7% | | 2% | | | | 9,646 | | | 9,709 | | 1% |
Net credit losses on loans | | | 1,920 | | | 1,983 | | | 1,889 | | | 1,776 | | | 1,783 | | - | | (7%) | | | | 7,579 | | | 7,431 | | (2%) |
Credit reserve build (release) for loans | | | 246 | | | (171) | | | (6) | | | 64 | | | (113) | | NM | | NM | | | | 1,006 | | | (226) | | NM |
Provision (release) for credit losses on unfunded lending commit. | | | - | | | - | | | 1 | | | - | | | - | | - | | - | | | | - | | | 1 | | NM |
Provisions for benefits and claims (PBC), and other assets | | | 4 | | | (1) | | | 1 | | | 2 | | | 3 | | 50% | | (25%) | | | | 13 | | | 5 | | (62%) |
Provisions for credit losses and for PBC | | | 2,170 | | | 1,811 | | | 1,885 | | | 1,842 | | | 1,673 | | (9%) | | (23%) | | | | 8,598 | | | 7,211 | | (16%) |
Income from continuing operations before taxes | | | 515 | | | 975 | | | 853 | | | 1,124 | | | 1,099 | | (2%) | | 113% | | | | 1,811 | | | 4,051 | | 124% |
Income taxes | | | 123 | | | 230 | | | 204 | | | 266 | | | 254 | | (5%) | | 107% | | | | 429 | | | 954 | | 122% |
Income from continuing operations | | | 392 | | | 745 | | | 649 | | | 858 | | | 845 | | (2%) | | 116% | | | | 1,382 | | | 3,097 | | 124% |
Noncontrolling interests | | | - | | | - | | | - | | | - | | | - | | - | | - | | | | - | | | - | | - |
Net income | | $ | 392 | | $ | 745 | | $ | 649 | | $ | 858 | | $ | 845 | | (2%) | | 116% | | | $ | 1,382 | | $ | 3,097 | | 124% |
EOP assets (in billions) | | $ | 252 | | $ | 244 | | $ | 251 | | $ | 252 | | $ | 264 | | 5% | | 5% | | | | | | | |||
Average assets (in billions) | | | 249 | | | 247 | | | 247 | | | 253 | | | 258 | | 2% | | 4% | | | $ | 241 | | $ | 251 | | 4% |
Efficiency ratio | | | 48% | | | 47% | | | 47% | | | 44% | | | 48% | | 400 bps | | 0 bps | | | | 48% | | | 46% | | (200) bps |
Average allocated TCE (in billions)(4) | | $ | 25.2 | | $ | 23.4 | | $ | 23.4 | | $ | 23.4 | | $ | 23.4 | | - | | (7%) | | | $ | 25.2 | | $ | 23.4 | | (7%) |
RoTCE(4) | | | 6.2% | | | 12.9% | | | 11.1% | | | 14.5% | | | 14.3% | | (20) bps | | 810 bps | | | | 5.5% | | | 13.2% | | 770 bps |
| | | | | | | | | | | | | | | | | | |||||||||||
Revenue by line of business(1)(5) | | | | | | | | | | | | | | | | | | | ||||||||||
Branded Cards | | $ | 2,806 | | $ | 2,892 | | $ | 2,822 | | $ | 2,970 | | $ | 2,952 | | (1%) | | 5% | | | $ | 10,735 | | $ | 11,636 | | 8% |
Retail Services | | | 1,741 | | | 1,675 | | | 1,649 | | | 1,686 | | | 1,612 | | (4%) | | (7%) | | | | 7,070 | | | 6,622 | | (6%) |
Retail Banking | | | 603 | | | 661 | | | 648 | | | 675 | | | 729 | | 8% | | 21% | | | | 2,250 | | | 2,713 | | 21% |
Total | | $ | 5,150 | | $ | 5,228 | | $ | 5,119 | | $ | 5,331 | | $ | 5,293 | | (1%) | | 3% | | | $ | 20,055 | | $ | 20,971 | | 5% |
| | | | | | | | | | | | | | | | | | |||||||||||
Key drivers(6) (in billions) | | | | | | | | | | | | | | | | | | | ||||||||||
Average loans | | $ | 216 | | $ | 216 | | $ | 217 | | $ | 220 | | $ | 226 | | 3% | | 5% | | | $ | 209 | | $ | 220 | | 5% |
ACLL as a % of EOP loans(7) | | | 6.38% | | | 6.51% | | | 6.34% | | | 6.33% | | | 6.00% | | (33) bps | | (38) bps | | | | | | | |||
NCLs as a % of average loans | | | 3.54% | | | 3.72% | | | 3.49% | | | 3.20% | | | 3.13% | | (7) bps | | (41) bps | | | | 3.62% | | | 3.38% | | (24) bps |
Average deposits | | | 86 | | | 89 | | | 90 | | | 90 | | | 88 | | (2%) | | 2% | | | | 91 | | | 89 | | (2%) |
| | | | | | | | | | | | | | | | | | |||||||||||
| | | | | | | | | | | | | | | | | | |||||||||||
| (1) | See footnote 1 on page 1. |
| (2) | Primarily related to retail banking and credit card-related fees. |
| (3) | Primarily related to revenue incentives from card networks and partners. |
| (4) | TCE and RoTCE are non-GAAP financial measures. See page 23 for a reconciliation of the summation of the segments’ and component’s average allocated TCE to Citigroup’s total average TCE and Citi’s total average stockholders’ equity. |
| (5) | Effective January 1, 2025, USPB changed its reporting for certain installment lending products that were transferred from Retail Banking to Branded Cards and Retail Services to reflect where these products are managed. Prior periods were conformed to reflect this change. |
| (6) | Management uses this information in reviewing the segment’s results and believes it is useful to investors concerning underlying segment performance and trends. |
| (7) | Excludes loans that are carried at fair value for all periods. |
NM Not meaningful.
Reclassified to conform to the current period’s presentation.
Page 9
U.S. PERSONAL BANKING
Metrics
| | | | | | | | | | | | 4Q25 Increase/ | |||||||
| | 4Q | | 1Q | | 2Q | | 3Q | | 4Q | | (Decrease) from | |||||||
Key Drivers(1)(2) (in billions of dollars, except as otherwise noted) | | 2024 | | 2025 | | 2025 | | 2025 | | 2025 | | 3Q25 | | 4Q24 | |||||
| | | | | | ||||||||||||||
New credit cards account acquisitions (in thousands) | | |
| |
| |
| |
| | | | | ||||||
Branded Cards | | 1,129 | | 1,300 | | 1,194 | | 1,343 | | 1,355 | | 1% | | 20% | |||||
Retail Services | | 2,391 | | 1,540 | | 2,061 | | 1,868 | | 2,332 | | 25% | | (2%) | |||||
Credit card spend volume | | | | | | | | ||||||||||||
Branded Cards | | $ | 135.4 | | $ | 125.1 | | $ | 135.8 | | $ | 135.6 | | $ | 141.9 | | 5% | | 5% |
Retail Services | |
| 25.2 | |
| 19.0 | |
| 22.9 | |
| 21.5 | |
| 24.4 | | 13% | | (3%) |
Average loans(3) | |
| |
| |
| |
| |
| | | |||||||
Branded Cards | | $ | 116.9 | | $ | 116.7 | | $ | 118.0 | | $ | 120.2 | | $ | 121.8 | | 1% | | 4% |
Credit cards | |
| 113.1 | |
| 112.9 | |
| 114.3 | |
| 116.5 | |
| 118.0 | | 1% | | 4% |
Personal installment loans (PIL) | |
| 3.8 | |
| 3.8 | |
| 3.7 | |
| 3.7 | |
| 3.8 | | 3% | | - |
Retail Services | |
| 51.9 | |
| 51.3 | |
| 50.2 | |
| 50.3 | |
| 50.5 | | - | | (3%) |
Retail Banking | |
| 46.8 | |
| 47.9 | |
| 48.7 | |
| 49.8 | |
| 53.7 | | 8% | | 15% |
EOP loans(3) | |
| |
| |
| |
| |
| | | |||||||
Branded Cards | | $ | 121.1 | | $ | 116.3 | | $ | 120.2 | | $ | 121.2 | | $ | 125.3 | | 3% | | 3% |
Credit cards | |
| 117.3 | |
| 112.6 | |
| 116.6 | |
| 117.4 | |
| 121.5 | | 3% | | 4% |
PIL | |
| 3.8 | |
| 3.7 | |
| 3.6 | |
| 3.8 | |
| 3.8 | | - | | - |
Retail Services | |
| 53.8 | |
| 50.2 | |
| 50.7 | |
| 50.1 | |
| 52.2 | | 4% | | (3%) |
Retail Banking | |
| 46.8 | |
| 48.2 | |
| 49.3 | |
| 50.3 | |
| 54.3 | | 8% | | 16% |
Total revenues, net of interest expenses as a % of average loans | |
| |
| |
| |
| |
| | | |||||||
Branded Cards | |
| 9.55% | |
| 10.05% | |
| 9.59% | |
| 9.80% | |
| 9.62% | | (18) bps | | 7 bps |
Retail Services | |
| 13.35% | |
| 13.24% | |
| 13.18% | |
| 13.30% | |
| 12.66% | | (64) bps | | (69) bps |
NII as a % of average loans(4) | |
| |
| |
| |
| |
| | | |||||||
Branded Cards | |
| 9.36% | |
| 9.79% | |
| 9.53% | |
| 9.67% | |
| 9.84% | | 17 bps | | 48 bps |
Retail Services | |
| 17.06% | |
| 17.13% | |
| 16.89% | |
| 17.31% | |
| 16.66% | | (65) bps | | (40) bps |
NCLs as a % of average loans | |
| |
| |
| |
| |
| | | |||||||
Branded Cards | |
| 3.63% | |
| 3.97% | |
| 3.80% | |
| 3.54% | |
| 3.45% | | (9) bps | | (18) bps |
Credit cards | |
| 3.55% | |
| 3.89% | |
| 3.73% | |
| 3.45% | |
| 3.37% | | (8) bps | | (18) bps |
PIL | |
| 6.18% | |
| 6.19% | |
| 6.18% | |
| 6.43% | |
| 6.06% | | (37) bps | | (12) bps |
Retail Services | |
| 6.21% | |
| 6.43% | |
| 5.89% | |
| 5.28% | |
| 5.33% | | 5 bps | | (88) bps |
Retail Banking | |
| 0.36% | |
| 0.25% | |
| 0.27% | |
| 0.28% | |
| 0.33% | | 5 bps | | (3) bps |
Loans 90+ days past due as a % of EOP loans | |
| |
| |
| |
| |
| | | |||||||
Branded Cards | |
| 1.16% | |
| 1.18% | |
| 1.09% | |
| 1.07% | |
| 1.13% | | 6 bps | | (3) bps |
Credit cards | |
| 1.18% | |
| 1.20% | |
| 1.11% | |
| 1.08% | |
| 1.15% | | 7 bps | | (3) bps |
PIL | |
| 0.55% | |
| 0.49% | |
| 0.58% | |
| 0.55% | |
| 0.58% | | 3 bps | | 3 bps |
Retail Services | |
| 2.46% | |
| 2.38% | |
| 2.15% | |
| 2.21% | |
| 2.20% | | (1) bps | | (26) bps |
Retail Banking(5) | |
| 0.31% | |
| 0.33% | |
| 0.40% | |
| 0.40% | |
| 0.36% | | (4) bps | | 5 bps |
Loans 30-89 days past due as a % of EOP loans | |
| |
| |
| |
| |
| | | |||||||
Branded Cards | |
| 1.04% | |
| 1.03% | |
| 0.97% | |
| 1.05% | |
| 1.10% | | 5 bps | | 6 bps |
Credit cards | |
| 1.03% | |
| 1.02% | |
| 0.96% | |
| 1.04% | |
| 1.09% | | 5 bps | | 6 bps |
PIL | |
| 1.34% | |
| 1.38% | |
| 1.39% | |
| 1.24% | |
| 1.34% | | 10 bps | | 0 bps |
Retail Services | |
| 2.09% | |
| 2.12% | |
| 1.96% | |
| 2.11% | |
| 2.00% | | (11) bps | | (9) bps |
Retail Banking(5) | |
| 0.48% | |
| 0.56% | |
| 0.45% | |
| 0.39% | |
| 0.46% | | 7 bps | | (2) bps |
Branches (actual) | |
| 642 | |
| 644 | |
| 650 | |
| 653 | |
| 655 | | - | | 2% |
Mortgage originations | | $ | 4.2 | | $ | 2.8 | | $ | 4.7 | | $ | 4.6 | | $ | 5.4 | | 17% | | 29% |
| | | | | | | | | | | | | | | | | | | |
| (1) | Management uses this information in reviewing the segment’s results and believes it is useful to investors concerning underlying segment performance and trends. |
| (2) | See footnote 5 on page 9. |
| (3) | Average loans, EOP loans and the related consumer delinquency amounts and ratios include interest and fees receivables balances. |
| (4) | Net interest income includes certain fees that are recorded as interest revenue. |
| (5) | Excludes U.S. government-sponsored agency guaranteed loans. |
Reclassified to conform to the current period’s presentation.
Page 10
ALL OTHER—MANAGED BASIS(1)(2)(3)
(In millions of dollars, except as otherwise noted)
| | | | | | | | | | | | 4Q25 Increase/ | | | Full | | Full | | FY 2025 vs. | |||||||||
| | 4Q | | 1Q | | 2Q | | 3Q | | 4Q | | (Decrease) from | | | Year | | Year | | FY 2024 Increase/ | |||||||||
| | 2024 | | 2025 | | 2025 | | 2025 | | 2025 | | 3Q25 | | 4Q24 | | | 2024 | | 2025 | | (Decrease) | |||||||
| | | | | | | | | | | | | | | | | | | | | | |||||||
Net interest income | | $ | 1,182 | | $ | 1,195 | | $ | 1,364 | | $ | 1,278 | | $ | 1,062 | | (17%) | | (10%) | | | $ | 5,899 | | $ | 4,899 | | (17%) |
Non-interest revenue(4)(5)(6) | | | 153 | | | 250 | | | 334 | | | 257 | | | (1,310) | | NM | | NM | | | | 1,604 | | | (469) | | NM |
Total revenues, net of interest expense | | | 1,335 | | | 1,445 | | | 1,698 | | | 1,535 | | | (248) | | NM | | NM | | | | 7,503 | | | 4,430 | | (41%) |
Total operating expenses(4)(6)(7)(8)(9)(10) | | | 2,162 | | | 2,224 | | | 2,276 | | | 2,168 | | | 2,025 | | (7%) | | (6%) | | | | 9,030 | | | 8,693 | | (4%) |
Net credit losses on loans | | | 257 | | | 256 | | | 256 | | | 297 | | | 341 | | 15% | | 33% | | | | 928 | | | 1,150 | | 24% |
Credit reserve build (release) for loans | | | 112 | | | 73 | | | 70 | | | 16 | | | 75 | | 369% | | (33%) | | | | 73 | | | 234 | | 221% |
Provision (release) for credit losses on unfunded lending commitments | | | (1) | | | (1) | | | (6) | | | (6) | | | 2 | | NM | | NM | | | | (16) | | | (11) | | 31% |
Provisions for benefits and claims (PBC), other assets and HTM debt securities | | | 29 | | | 31 | | | 54 | | | 24 | | | 31 | | 29% | | 7% | | | | 130 | | | 140 | | 8% |
Provisions for credit losses and for PBC | | | 397 | | | 359 | | | 374 | | | 331 | | | 449 | | 36% | | 13% | | | | 1,115 | | | 1,513 | | 36% |
Income (loss) from continuing operations before taxes | | | (1,224) | | | (1,138) | | | (952) | | | (964) | | | (2,722) | | (182%) | | (122%) | | | | (2,642) | | | (5,776) | | (119%) |
Income taxes (benefits) | | | (153) | | | (285) | | | (364) | | | (263) | | | (423) | | (61%) | | (176%) | | | | (182) | | | (1,335) | | NM |
Income (loss) from continuing operations | | | (1,071) | | | (853) | | | (588) | | | (701) | | | (2,299) | | (228%) | | (115%) | | | | (2,460) | | | (4,441) | | (81%) |
Income (loss) from discontinued operations, net of taxes | | | - | | | (1) | | | - | | | (1) | | | (1) | | - | | NM | | | | (2) | | | (3) | | (50%) |
Noncontrolling interests | | | (1) | | | 16 | | | (21) | | | 3 | | | 16 | | 433% | | NM | | | | (30) | | | 14 | | NM |
Net income (loss) | | $ | (1,070) | | $ | (870) | | $ | (567) | | $ | (705) | | $ | (2,316) | | (229%) | | (116%) | | | $ | (2,432) | | $ | (4,458) | | (83%) |
EOP assets (in billions) | | $ | 201 | | $ | 203 | | $ | 212 | | $ | 208 | | $ | 208 | | - | | 3% | | | | | | | |||
Average assets (in billions) | | | 196 | | | 204 | | | 210 | | | 207 | | | 200 | | (3%) | | 2% | | | $ | 195 | | $ | 205 | | 5% |
Efficiency ratio | | | 162% | | | 154% | | | 134% | | | 141% | | | (817%) | | NM | | NM | | | | 120% | | | 196% | | 7,600 bps |
Average allocated TCE (in billions)(11) | | $ | 29.5 | | $ | 37.9 | | $ | 40.7 | | $ | 40.9 | | $ | 39.0 | | (5%) | | 32% | | | $ | 27.6 | | $ | 39.2 | | 42% |
| | | | | | | | | | | | | | | | | | |||||||||||
Revenue by line of business | | | | | | | | | | | | | | | | | | | ||||||||||
Mexico Consumer/SBMM | | $ | 1,422 | | $ | 1,467 | | $ | 1,536 | | $ | 1,722 | | $ | 1,775 | | 3% | | 25% | | | $ | 6,141 | | $ | 6,500 | | 6% |
Asia Consumer(5)(12) | | | 150 | | | 135 | | | 155 | | | 149 | | | (1,434) | | NM | | NM | | | | 812 | | | (995) | | NM |
Legacy Holdings Assets (LHA) | | | (9) | | | 19 | | | - | | | - | | | (12) | | NM | | (33%) | | | | (118) | | | 7 | | NM |
Corporate/Other | | | (228) | | | (176) | | | 7 | | | (336) | | | (577) | | (72%) | | (153%) | | | | 668 | | | (1,082) | | NM |
Total | | $ | 1,335 | | $ | 1,445 | | $ | 1,698 | | $ | 1,535 | | $ | (248) | | NM | | NM | | | $ | 7,503 | | $ | 4,430 | | (41%) |
| | | | | | | | | | | | | | | | | | |||||||||||
Mexico Consumer/SBMM—key indicators (in billions of dollars) | | | | | | | | | | | | | | | | | | | ||||||||||
EOP loans | | $ | 23.1 | | $ | 24.1 | | $ | 26.8 | | $ | 28.5 | | $ | 30.0 | | 5% | | 30% | | | | | | | |||
EOP deposits | | | 34.1 | | | 35.3 | | | 38.4 | | | 40.6 | | | 43.8 | | 8% | | 28% | | | | | | | |||
Average loans | | | 23.4 | | | 23.7 | | | 25.5 | | | 27.2 | | | 29.2 | | 7% | | 25% | | | | | | | |||
NCLs as a % of average loans (Mexico Consumer only) | | | 4.81% | | | 5.51% | | | 5.28% | | | 5.46% | | | 5.91% | | 45 bps | | 110 bps | | | | | | | |||
Loans 90+ days past due as a % of EOP loans (Mexico Consumer only) | | | 1.43% | | | 1.41% | | | 1.58% | | | 1.60% | | | 1.72% | | 12 bps | | 29 bps | | | | | | | |||
Loans 30-89 days past due as a % of EOP loans (Mexico Consumer only) | | | 1.41% | | | 1.46% | | | 1.52% | | | 1.58% | | | 1.59% | | 1 bps | | 18 bps | | | | | | | |||
| | | | | | | | | | | | | | | | | | |||||||||||
Asia Consumer—key indicators (in billions of dollars)(13)(14) | | | | | | | | | | | | | | | | | | | ||||||||||
EOP loans | | $ | 4.7 | | $ | 4.5 | | $ | 3.0 | | $ | 2.7 | | $ | 2.5 | | (7%) | | (47%) | | | | | | | |||
EOP deposits | | | 7.5 | | | 7.4 | | | 1.5 | | | 1.3 | | | 1.1 | | (15%) | | (85%) | | | | | | | |||
Average loans | | | 5.1 | | | 4.7 | | | 4.0 | | | 2.8 | | | 2.6 | | (7%) | | (49%) | | | | | | | |||
| | | | | | | | | | | | | | | | | | |||||||||||
Legacy Holdings Assets—key indicators (in billions of dollars) | | | | | | | | | | | | | | | | | | | ||||||||||
EOP loans | | $ | 2.2 | | $ | 2.2 | | $ | 2.1 | | $ | 1.8 | | $ | 1.8 | | - | | (18%) | | | | | | | |||
| | | | | | | | | | | | | | | | | | |||||||||||
(1) | Includes Legacy Franchises (see page 12 for details) and certain unallocated costs of global staff functions (including finance, risk, human resources, legal and compliance-related costs), other corporate expenses, and unallocated global operations and technology expenses and income taxes, as well as Corporate Treasury investment activities and discontinued operations. The results of operations, as well as certain disclosed balance sheet information, for Mexico Consumer/SBMM are presented on a managerial view and include certain intercompany allocations, managerial charges and offshore expenses that reflect the Mexico Consumer/SBMM operations as a component of Citi’s consolidated operations. The Mexico Consumer/SBMM results are therefore not intended to reflect, and may differ (significantly) from, Banamex’s results and operations as a standalone legal entity. |
(2) | Reflects results on a managed basis, which excludes divestiture-related impacts related to Citi’s divestitures of its Asia consumer banking businesses and the planned divestiture of Mexico Consumer/SBMM within Legacy Franchises. See page 14 for additional information. |
(3) | Certain of the results of operations of All Other—managed basis are non-GAAP financial measures. See page 14 for additional information. |
(4) | See footnote 1 on page 1. |
(5) | In 4Q25, Citigroup recognized an approximately $1.2 billion loss recorded in revenue (approximately $1.1 billion after tax) related to the loss on sale of the announced move to held-for-sale of A.O. Citibank (Russia). The loss on sale consists of ($1.556 billion) ($1.506 billion after-tax) in Legacy Franchises and ($32 million) in Corp/Other, partially offset by $356 million in Services, $19 million in Markets and $40 million in Banking. The only tax impact ($50 million tax benefit) was recorded in Legacy Franchises. For additional information, see Citi’s Form 8-K filed on December 29, 2025. |
(6) | See footnote 2 on page 14. |
(7) | See footnote 3 on page 14. |
(8) | See footnote 4 on page 14. |
(9) | See footnote 5 on page 14. |
(10) | See footnote 6 on page 14. |
(11) | TCE is a non-GAAP financial measure. See page 23 for a reconciliation of the summation of the segments’ and component’s average allocated TCE. |
(12) | Asia Consumer includes revenues from the Poland and Russia consumer banking businesses. |
(13) | Asia Consumer also includes loans and deposits in Poland (through 1Q25) and Russia. |
(14) | The key indicators for Asia Consumer also reflect the reclassification of loans and deposits to Other assets and Other liabilities under HFS accounting on Citi’s Consolidated Balance Sheet beginning in 2Q25. |
NM Not meaningful.
Reclassified to conform to the current period’s presentation.
Page 11
ALL OTHER—MANAGED BASIS(1)(2)
Legacy Franchises(3)
(In millions of dollars, except as otherwise noted)
| | | | | | | | | | | | 4Q25 Increase/ | | | Full | | Full | | FY 2025 vs. | |||||||||
| | 4Q | | 1Q | | 2Q | | 3Q | | 4Q | | (Decrease) from | | | Year | | Year | | FY 2024 Increase/ | |||||||||
| | 2024 | | 2025 | | 2025 | | 2025 | | 2025 | | 3Q25 | | 4Q24 | | | 2024 | | 2025 | | (Decrease) | |||||||
| | | | | | | | | | | | | | | | | | | | | | |||||||
Net interest income | | $ | 1,160 | | $ | 1,167 | | $ | 1,271 | | $ | 1,338 | | $ | 1,379 | | 3% | | 19% | | | $ | 4,887 | | $ | 5,155 | | 5% |
Non-interest revenue(4)(5)(6) | | | 403 | | | 454 | | | 420 | | | 533 | | | (1,050) | | NM | | NM | | | | 1,948 | | | 357 | | (82%) |
Total revenues, net of interest expense | | | 1,563 | | | 1,621 | | | 1,691 | | | 1,871 | | | 329 | | (82%) | | (79%) | | | | 6,835 | | | 5,512 | | (19%) |
Total operating expenses(4)(6)(7)(8)(9)(10) | | | 1,381 | | | 1,334 | | | 1,287 | | | 1,320 | | | 1,222 | | (7%) | | (12%) | | | | 6,011 | | | 5,163 | | (14%) |
Net credit losses on loans | | | 257 | | | 256 | | | 256 | | | 297 | | | 341 | | 15% | | 33% | | | | 928 | | | 1,150 | | 24% |
Credit reserve build (release) for loans | | | 112 | | | 73 | | | 70 | | | 16 | | | 75 | | 369% | | (33%) | | | | 73 | | | 234 | | 221% |
Provision (release) for credit losses on unfunded lending commitments | | | (1) | | | (1) | | | (6) | | | (6) | | | 2 | | NM | | NM | | | | (16) | | | (11) | | 31% |
Provisions for benefits and claims (PBC), other assets and HTM debt securities | | | 25 | | | 30 | | | 51 | | | 20 | | | 29 | | 45% | | 16% | | | | 125 | | | 130 | | 4% |
Provisions for credit losses and for PBC | | | 393 | | | 358 | | | 371 | | | 327 | | | 447 | | 37% | | 14% | | | | 1,110 | | | 1,503 | | 35% |
Income (loss) from continuing operations before taxes | | | (211) | | | (71) | | | 33 | | | 224 | | | (1,340) | | NM | | NM | | | | (286) | | | (1,154) | | (303%) |
Income taxes (benefits) | | | (53) | | | (25) | | | (5) | | | 66 | | | 147 | | 123% | | NM | | | | (42) | | | 183 | | NM |
Income (loss) from continuing operations | | | (158) | | | (46) | | | 38 | | | 158 | | | (1,487) | | NM | | NM | | | | (244) | | | (1,337) | | (448%) |
Noncontrolling interests | | | 3 | | | 14 | | | (22) | | | 3 | | | 9 | | 200% | | 200% | | | | 5 | | | 4 | | (20%) |
Net income (loss) | | $ | (161) | | $ | (60) | | $ | 60 | | $ | 155 | | $ | (1,496) | | NM | | NM | | | $ | (249) | | $ | (1,341) | | (439%) |
EOP assets (in billions) | | $ | 74 | | $ | 77 | | $ | 83 | | $ | 86 | | $ | 86 | | - | | 16% | | | | | | | |||
Average assets (in billions) | | | 72 | | | 77 | | | 81 | | | 85 | | | 87 | | 2% | | 21% | | | $ | 74 | | $ | 83 | | 12% |
Efficiency ratio | | | 88% | | | 82% | | | 76% | | | 71% | | | 371% | | NM | | NM | | | | 88% | | | 94% | | 600 bps |
Allocated TCE (in billions)(11) | | $ | 6.2 | | $ | 5.1 | | $ | 5.1 | | $ | 5.1 | | $ | 5.1 | | - | | (18%) | | | $ | 6.2 | | $ | 5.1 | | (18%) |
| | | | | | | | | | | | | | | | | | |||||||||||
Revenue by reporting unit and line of business | | | | | | | | | | | | | | | | | | | ||||||||||
Mexico Consumer/SBMM(3) | | $ | 1,422 | | $ | 1,467 | | $ | 1,536 | | $ | 1,722 | | $ | 1,775 | | 3% | | 25% | | | $ | 6,141 | | $ | 6,500 | | 6% |
Asia Consumer(5)(12) | | | 150 | | | 135 | | | 155 | | | 149 | | | (1,434) | | NM | | NM | | | | 812 | | | (995) | | NM |
Legacy Holdings Assets (LHA) | | | (9) | | | 19 | | | - | | | - | | | (12) | | NM | | (33%) | | | | (118) | | | 7 | | NM |
Total | | $ | 1,563 | | $ | 1,621 | | $ | 1,691 | | $ | 1,871 | | $ | 329 | | (82%) | | (79%) | | | $ | 6,835 | | $ | 5,512 | | (19%) |
| | | | | | | | | | | | | | | | | | |||||||||||
Mexico Consumer/SBMM(3)—key indicators (in billions of dollars) | | | | | | | | | | | | | | | | | | | ||||||||||
EOP loans | | $ | 23.1 | | $ | 24.1 | | $ | 26.8 | | $ | 28.5 | | $ | 30.0 | | 5% | | 30% | | | | | | | |||
EOP deposits | | | 34.1 | | | 35.3 | | | 38.4 | | | 40.6 | | | 43.8 | | 8% | | 28% | | | | | | | |||
Average loans | | | 23.4 | | | 23.7 | | | 25.5 | | | 27.2 | | | 29.2 | | 7% | | 25% | | | | | | | |||
NCLs as a % of average loans (Mexico Consumer only) | | | 4.81% | | | 5.51% | | | 5.28% | | | 5.46% | | | 5.91% | | 45 bps | | 110 bps | | | | | | | |||
Loans 90+ days past due as a % of EOP loans (Mexico Consumer only) | | | 1.43% | | | 1.41% | | | 1.58% | | | 1.60% | | | 1.72% | | 12 bps | | 29 bps | | | | | | | |||
Loans 30-89 days past due as a % of EOP loans (Mexico Consumer only) | | | 1.41% | | | 1.46% | | | 1.52% | | | 1.58% | | | 1.59% | | 1 bps | | 18 bps | | | | | | | |||
| | | | | | | | | | | | | | | | | | |||||||||||
Asia Consumer—key indicators (in billions of dollars)(13)(14) | | | | | | | | | | | | | | | | | | | ||||||||||
EOP loans | | $ | 4.7 | | $ | 4.5 | | $ | 3.0 | | $ | 2.7 | | $ | 2.5 | | (7%) | | (47%) | | | | | | | |||
EOP deposits | | | 7.5 | | | 7.4 | | | 1.5 | | | 1.3 | | | 1.1 | | (15%) | | (85%) | | | | | | | |||
Average loans | | | 5.1 | | | 4.7 | | | 4.0 | | | 2.8 | | | 2.6 | | (7%) | | (49%) | | | | | | | |||
| | | | | | | | | | | | | | | | | | |||||||||||
Legacy Holdings Assets—key indicators (in billions of dollars) | | | | | | | | | | | | | | | | | | | ||||||||||
EOP loans | | $ | 2.2 | | $ | 2.2 | | $ | 2.1 | | $ | 1.8 | | $ | 1.8 | | - | | (18%) | | | | | | | |||
| | | | | | | | | | | | | | | | | | |||||||||||
(1) | Reflects results on a managed basis, which excludes divestiture-related impacts related to Citi’s divestitures of its Asia consumer banking businesses and the planned divestiture of Mexico Consumer/SBMM within Legacy Franchises. See page 14 for additional information. The results of operations, as well as certain disclosed balance sheet information, for Mexico Consumer/SBMM are presented on a managerial view and include certain intercompany allocations, managerial charges and offshore expenses that reflect the Mexico Consumer/SBMM operations as a component of Citi’s consolidated operations. The Mexico Consumer/SBMM results are therefore not intended to reflect, and may differ (significantly) from, Banamex’s results and operations as a standalone legal entity. |
(2) | Certain of the results of operations of All Other—managed basis are non-GAAP financial measures. See page 14 for additional information. |
(3) | Legacy Franchises consists of the consumer franchises in 13 markets across Asia, Poland and Russia that Citi has exited or intends to exit (collectively Asia Consumer); Mexico Consumer/SBMM (consists of Mexico consumer banking (Mexico Consumer) and Small Business and Middle-Market Banking (SBMM), collectively (Mexico Consumer/SBMM)); and Legacy Holdings Assets (primarily North America consumer mortgage loans, Citigroup’s U.K. consumer banking business and other legacy assets). |
(4) | See footnote 1 on page 1. |
(5) | In 4Q25, Citigroup recognized an approximately $1.2 billion loss recorded in revenue (approximately $1.1 billion after tax) related to the loss on sale of the announced move to held-for-sale of A.O. Citibank (Russia). The loss on sale consists of ($1.556 billion) ($1.506 billion after-tax) in Legacy Franchises and ($32 million) in Corp/Other, partially offset by $356 million in Services, $19 million in Markets and $40 million in Banking. The only tax impact ($50 million tax benefit) was recorded in Legacy Franchises. For additional information, see Citi’s Form 8-K filed on December 29, 2025. |
(6) | See footnote 2 on page 14. |
(7) | See footnote 3 on page 14. |
(8) | See footnote 4 on page 14. |
(9) | See footnote 5 on page 14. |
(10) | See footnote 6 on page 14. |
(11) | TCE is a non-GAAP financial measure. See page 23 for a reconciliation of the summation of the segments’ and component’s average allocated TCE. |
(12) | Asia Consumer includes revenues from the Poland and Russia consumer banking businesses. |
(13) | Asia Consumer also includes loans and deposits in Poland (through 1Q25) and Russia. |
(14) | The key indicators for Asia Consumer also reflect the reclassification of loans and deposits to Other assets and Other liabilities under HFS accounting on Citi’s Consolidated Balance Sheet beginning in 2Q25. |
NM Not meaningful.
Reclassified to conform to the current period’s presentation.
Page 12
ALL OTHER
Corporate/Other(1)
(In millions of dollars, except as otherwise noted)
| | | | | | | | | | | | 4Q25 Increase/ | | | Full | | Full | | FY 2025 vs. | |||||||||
| | 4Q | | 1Q | | 2Q | | 3Q | | 4Q | | (Decrease) from | | | Year | | Year | | FY 2024 Increase/ | |||||||||
| | 2024 | | 2025 | | 2025 | | 2025 | | 2025 | | 3Q25 | | 4Q24 | | | 2024 | | 2025 | | (Decrease) | |||||||
| | | | | | | | | | | | | | | | | | | | | | |||||||
Net interest income | | $ | 22 | | $ | 28 | | $ | 93 | | $ | (60) | | $ | (317) | | (428%) | | NM | | | $ | 1,012 | | $ | (256) | | NM |
Non-interest revenue | | | (250) | | | (204) | | | (86) | | | (276) | | | (260) | | 6% | | (4%) | | | | (344) | | | (826) | | (140%) |
Total revenues, net of interest expense | | | (228) | | | (176) | | | 7 | | | (336) | | | (577) | | (72%) | | (153%) | | | | 668 | | | (1,082) | | NM |
Total operating expenses | | | 781 | | | 890 | | | 989 | | | 848 | | | 803 | | (5%) | | 3% | | | | 3,019 | | | 3,530 | | 17% |
Provisions for other assets, HTM debt securities and other | | | 4 | | | 1 | | | 3 | | | 4 | | | 2 | | (50%) | | (50%) | | | | 5 | | | 10 | | 100% |
Income (loss) from continuing operations before taxes | | | (1,013) | | | (1,067) | | | (985) | | | (1,188) | | | (1,382) | | (16%) | | (36%) | | | | (2,356) | | | (4,622) | | (96%) |
Income taxes (benefits) | | | (100) | | | (260) | | | (359) | | | (329) | | | (570) | | (73%) | | (470%) | | | | (140) | | | (1,518) | | NM |
Income (loss) from continuing operations | | | (913) | | | (807) | | | (626) | | | (859) | | | (812) | | 5% | | 11% | | | | (2,216) | | | (3,104) | | (40%) |
Income (loss) from discontinued operations, net of taxes | | | - | | | (1) | | | - | | | (1) | | | (1) | | - | | NM | | | | (2) | | | (3) | | (50%) |
Noncontrolling interests | | | (4) | | | 2 | | | 1 | | | - | | | 7 | | NM | | NM | | | | (35) | | | 10 | | NM |
Net income (loss) | | $ | (909) | | $ | (810) | | $ | (627) | | $ | (860) | | $ | (820) | | 5% | | 10% | | | $ | (2,183) | | $ | (3,117) | | (43%) |
EOP assets (in billions) | | $ | 127 | | $ | 126 | | $ | 129 | | $ | 122 | | $ | 122 | | - | | (4%) | | | | | | | | | |
Average allocated TCE (in billions)(2) | | | 23.3 | | | 32.8 | | | 35.6 | | | 35.8 | | | 33.9 | | (5%) | | 45% | | | $ | 21.4 | | $ | 34.1 | | 59% |
| | | | | | | | | | | | | | | | | | | | | | | | | | | | |
(1) | Includes certain unallocated costs of global staff functions (including finance, risk, human resources, legal and compliance-related costs), other corporate expenses and unallocated global operations and technology expenses and income taxes, as well as Corporate Treasury investment activities and discontinued operations. |
(2) | TCE is a non-GAAP financial measure. See page 23 for a reconciliation of the summation of the segments’ and component’s average allocated TCE. |
NM Not meaningful.
Reclassified to conform to the current period’s presentation.
Page 13
ALL OTHER
RECONCILING ITEMS(1)
Divestiture-Related Impacts
(In millions of dollars, except as otherwise noted)
| | | | | | | | | | | | 4Q25 Increase/ | | | Full | | Full | | FY 2025 vs. | |||||||||
| | 4Q | | 1Q | | 2Q | | 3Q | | 4Q | | (Decrease) from | | | Year | | Year | | FY 2024 Increase/ | |||||||||
| | 2024 | | 2025 | | 2025 | | 2025 | | 2025 | | 3Q25 | | 4Q24 | | | 2024 | | 2025 | | (Decrease) | |||||||
| | | | | | | | | | | | | | | | | | | | | | |||||||
Net interest income | | $ | - | | $ | - | | $ | - | | $ | - | | $ | - | | - | | - | | | $ | - | | $ | - | | - |
Non-interest revenue(2) | | | 4 | | | - | | | (177) | | | 2 | | | (1) | | NM | | NM | | | | 26 | | | (176) | | NM |
Total revenues, net of interest expense | | | 4 | | | - | | | (177) | | | 2 | | | (1) | | NM | | NM | | | | 26 | | | (176) | | NM |
Total operating expenses(2)(3)(4)(5)(6) | | | 56 | | | 34 | | | 37 | | | 766 | | | 40 | | (95%) | | (29%) | | | | 318 | | | 877 | | 176% |
Net credit losses on loans | | | - | | | - | | | 5 | | | (3) | | | (2) | | 33% | | NM | | | | 7 | | | - | | (100%) |
Credit reserve build (release) for loans | | | - | | | (11) | | | - | | | - | | | 1 | | NM | | NM | | | | - | | | (10) | | NM |
Provision (release) for credit losses on unfunded lending commitments | | | - | | | - | | | - | | | - | | | - | | - | | - | | | | - | | | - | | - |
Provisions for benefits and claims (PBC), other assets and HTM debt securities | | | - | | | - | | | - | | | - | | | - | | - | | - | | | | - | | | - | | - |
Provisions for credit losses and for PBC | | | - | | | (11) | | | 5 | | | (3) | | | (1) | | 67% | | NM | | | | 7 | | | (10) | | NM |
Income (loss) from continuing operations before taxes | | | (52) | | | (23) | | | (219) | | | (761) | | | (40) | | 95% | | 23% | | | | (299) | | | (1,043) | | (249%) |
Income taxes (benefits) | | | (16) | | | (8) | | | (39) | | | 16 | | | 70 | | 338% | | NM | | | | (92) | | | 39 | | NM |
Income (loss) from continuing operations | | | (36) | | | (15) | | | (180) | | | (777) | | | (110) | | 86% | | (206%) | | | | (207) | | | (1,082) | | (423%) |
Income (loss) from discontinued operations, net of taxes | | | - | | | - | | | - | | | - | | | - | | - | | - | | | | - | | | - | | - |
Noncontrolling interests | | | - | | | - | | | - | | | - | | | - | | - | | - | | | | - | | | - | | - |
Net income (loss) | | $ | (36) | | $ | (15) | | $ | (180) | | $ | (777) | | $ | (110) | | 86% | | (206%) | | | $ | (207) | | $ | (1,082) | | (423%) |
| | | | | | | | | | | | | | | | | | | | | | | | | | | | |
(1) | Reconciling Items consist of the divestiture-related impacts excluded from the results of All Other, as well as All Other—Legacy Franchises on a managed basis. The Reconciling Items are fully reflected in Citi’s Consolidated Statement of Income on page 2 for each respective line item. |
(2) | 2Q25 includes (i) an approximately $186 million loss recorded in revenue (approximately $157 million after tax) related to the announced sale of the Poland consumer banking business; and (ii) approximately $37 million in operating expenses (approximately $26 million after tax) primarily related to separation costs in Mexico. For additional information, see Citi’s Quarterly Report on Form 10-Q for the quarterly period ended June 30, 2025. |
(3) | 4Q24 includes approximately $56 million in operating expenses (approximately $39 million after-tax), primarily related to separation costs in Mexico and severance costs in the Asia exit markets. For additional information, see Citi’s Annual Report on Form 10-K for the year ended December 31, 2024. |
(4) | 1Q25 includes approximately $34 million in operating expenses (approximately $23 million after-tax), largely related to separation costs in Mexico and severance costs in the Asia exit markets. For additional information, see Citi’s Quarterly Report on Form 10-Q for the quarterly period ended March 31, 2025. |
(5) | 3Q25 includes approximately $766 million in operating expenses (approximately $744 million after-tax), driven by a goodwill impairment charge in Mexico ($726 million ($714 million after-tax)) and separation costs in Mexico. For additional information, see Citi’s Quarterly Report on Form 10-Q for the quarterly period ended September 30, 2025. |
(6) | 4Q25 includes approximately $40 million in operating expenses (approximately $28 million after-tax), primarily related to separation costs in Mexico. |
NM Not meaningful.
Reclassified to conform to the current period’s presentation.
Page 14
AVERAGE BALANCES AND INTEREST RATES(1)(2)(3)(4)(5)
Taxable Equivalent Basis
| | Average Volumes | | Interest | | % Average Rate(4) | ||||||||||||||||||
| | | | | | | | | | | | | | | | | | | ||||||
| | | | | | | | | | | | | | | | | | | ||||||
(In millions of dollars), except as otherwise noted | | 4Q24 | | 3Q25 | | 4Q25(5) | | 4Q24 | | 3Q25 | | 4Q25(5) | | 4Q24 | | 3Q25 | | 4Q25(5) | ||||||
Assets | | | | | | | | | | | | | | | | |||||||||
Deposits with banks | | $ | 284,050 | | $ | 332,245 | | $ | 334,503 | | $ | 3,010 | | $ | 3,435 | | $ | 3,190 | | 4.22% | | 4.10% | | 3.78% |
Securities borrowed and purchased under resale agreements(6) | | | 324,484 | | | 357,804 | | | 364,353 | | | 6,847 | | | 7,003 | | | 7,047 | | 8.39% | | 7.77% | | 7.67% |
Trading account assets(7) | | | 408,741 | | | 523,334 | | | 523,690 | | | 4,494 | | | 5,289 | | | 5,317 | | 4.37% | | 4.01% | | 4.03% |
Investments | | | 484,416 | | | 449,689 | | | 447,982 | | | 4,318 | | | 4,177 | | | 4,192 | | 3.55% | | 3.69% | | 3.71% |
Consumer loans | | | 388,366 | | | 396,333 | | | 401,451 | | | 9,913 | | | 10,150 | | | 10,121 | | 10.15% | | 10.16% | | 10.00% |
Corporate loans | | | 299,641 | | | 328,686 | | | 335,263 | | | 5,378 | | | 5,263 | | | 5,286 | | 7.14% | | 6.35% | | 6.26% |
Total loans (net of unearned income)(8) | | | 688,007 | | | 725,019 | | | 736,714 | | | 15,291 | | | 15,413 | | | 15,407 | | 8.84% | | 8.43% | | 8.30% |
Other interest-earning assets | | | 71,125 | | | 83,974 | | | 96,205 | | | 1,112 | | | 1,400 | | | 1,521 | | 6.22% | | 6.61% | | 6.27% |
Total average interest-earning assets | | $ | 2,260,823 | | $ | 2,472,065 | | $ | 2,503,447 | | $ | 35,072 | | $ | 36,717 | | $ | 36,674 | | 6.17% | | 5.89% | | 5.81% |
| | | | | | | | | | | | | | | ||||||||||
Liabilities | | | | | | | | | | | | | | | | |||||||||
Deposits | | $ | 1,116,527 | | $ | 1,180,367 | | $ | 1,218,253 | | $ | 9,361 | | $ | 9,163 | | $ | 8,680 | | 3.34% | | 3.08% | | 2.83% |
Securities loaned and sold under repurchase agreements(6) | | | 317,665 | | | 401,821 | | | 384,902 | | | 6,628 | | | 7,356 | | | 7,101 | | 8.30% | | 7.26% | | 7.32% |
Trading account liabilities(7) | | | 91,601 | | | 107,815 | | | 103,820 | | | 933 | | | 755 | | | 753 | | 4.05% | | 2.78% | | 2.88% |
Short-term borrowings and other interest-bearing liabilities | | | 123,004 | | | 147,175 | | | 154,999 | | | 1,830 | | | 1,933 | | | 1,907 | | 5.92% | | 5.21% | | 4.88% |
Long-term debt(9) | | | 177,288 | | | 187,340 | | | 186,846 | | | 2,562 | | | 2,543 | | | 2,543 | | 5.75% | | 5.39% | | 5.40% |
Total average interest-bearing liabilities | | $ | 1,826,085 | | $ | 2,024,518 | | $ | 2,048,820 | | $ | 21,314 | | $ | 21,750 | | $ | 20,984 | | 4.64% | | 4.26% | | 4.06% |
| | | | | | | | | | | | | | | ||||||||||
| | | | | | | | | | | | | | | ||||||||||
Net interest income as a % of average interest-earning assets (NIM)(9) | | | | | | | | $ | 13,758 | | $ | 14,967 | | $ | 15,690 | | 2.42% | | 2.40% | | 2.49% | |||
| | | | | | | | | | | | | | | ||||||||||
4Q25 increase (decrease) from: | | | | | | | | | | | | | | 7 bps | | 9 bps | | |||||||
| | | | | | | | | | | | | | | ||||||||||
(1) | Interest income and Net interest income include the taxable equivalent adjustments (based on the U.S. federal statutory tax rate of 21%) of $25 million for 4Q24, $27 million for 3Q25 and $25 million for 4Q25. |
(2) | Citigroup average balances and interest rates include both domestic and international operations. |
(3) | Monthly averages have been used by certain subsidiaries where daily averages are unavailable. |
(4) | Average rate percentage is calculated as annualized interest over average volumes. |
(5) | 4Q25 is preliminary. |
(6) | Average volumes of securities borrowed or purchased under agreements to resell and securities loaned or sold under agreements to repurchase are reported net pursuant to FIN 41; the related interest excludes the impact of ASU 2013-01 (Topic 210). |
(7) | Interest expense on Trading account liabilities of Services, Markets, and Banking is reported as a reduction of Interest income. Interest income and Interest expense on cash collateral positions are reported in Trading account assets and Trading account liabilities, respectively. |
(8) | Nonperforming loans are included in the average loan balances. |
(9) | Excludes hybrid financial instruments with changes in fair value recorded in Principal transactions revenue. |
Reclassified to conform to the current period’s presentation.
Page 15
END-OF-PERIOD LOANS(1)(2)
(In billions of dollars)
| | | | | | | | | | | | 4Q25 Increase/ | |||||||
| | 4Q | | 1Q | | 2Q | | 3Q | | 4Q | | (Decrease) from | |||||||
| | 2024 | | 2025 | | 2025 | | 2025 | | 2025 | | 3Q25 | | 4Q24 | |||||
| | | | | | | | | | | | | | | |||||
Corporate loans by region | | | | | | | | | | | | | |||||||
North America | | $ | 130.8 | | $ | 138.7 | | $ | 146.5 | | $ | 150.1 | | $ | 155.2 | | 3% | | 19% |
International | | | 170.6 | | | 177.0 | | | 183.1 | | | 185.2 | | | 188.5 | | 2% | | 10% |
Total corporate loans | | $ | 301.4 | | $ | 315.7 | | $ | 329.6 | | $ | 335.3 | | $ | 343.7 | | 3% | | 14% |
| | | | | | | | | | | | ||||||||
Corporate loans by segment and reporting unit | | | | | | | | | | | | | |||||||
Services | | $ | 87.9 | | $ | 98.0 | | $ | 96.4 | | $ | 99.4 | | $ | 99.5 | | - | | 13% |
Markets | | | 125.3 | | | 129.8 | | | 144.3 | | | 149.7 | | | 159.4 | | 6% | | 27% |
Banking | | | 82.1 | | | 81.4 | | | 81.9 | | | 78.8 | | | 77.2 | | (2%) | | (6%) |
All Other - Legacy Franchises - Mexico SBMM & AFG(3) | | | 6.1 | | | 6.5 | | | 7.0 | | | 7.4 | | | 7.6 | | 3% | | 25% |
Total corporate loans | | $ | 301.4 | | $ | 315.7 | | $ | 329.6 | | $ | 335.3 | | $ | 343.7 | | 3% | | 14% |
| | | | | | | | | | | | ||||||||
Wealth by region | | | | | | | | | | | | | |||||||
North America | | $ | 98.0 | | $ | 96.7 | | $ | 98.0 | | $ | 97.9 | | $ | 95.9 | | (2%) | | (2%) |
International | | | 49.5 | | | 50.6 | | | 52.7 | | | 53.5 | | | 54.1 | | 1% | | 9% |
Total | | $ | 147.5 | | $ | 147.3 | | $ | 150.7 | | $ | 151.4 | | $ | 150.0 | | (1%) | | 2% |
| | | | | | | | | | | | ||||||||
USPB(4) | | | | | | | | | | | | | |||||||
Branded Cards | | $ | 121.1 | | $ | 116.3 | | $ | 120.2 | | $ | 121.2 | | $ | 125.3 | | 3% | | 3% |
Credit cards | | | 117.3 | | | 112.6 | | | 116.6 | | | 117.4 | | | 121.5 | | 3% | | 4% |
Personal installment loans (PIL) | | | 3.8 | | | 3.7 | | | 3.6 | | | 3.8 | | | 3.8 | | - | | - |
Retail Services | | | 53.8 | | | 50.2 | | | 50.7 | | | 50.1 | | | 52.2 | | 4% | | (3%) |
Retail Banking | | | 46.8 | | | 48.2 | | | 49.3 | | | 50.3 | | | 54.3 | | 8% | | 16% |
Total | | $ | 221.7 | | $ | 214.7 | | $ | 220.2 | | $ | 221.6 | | $ | 231.8 | | 5% | | 5% |
| | | | | | | | | | | | ||||||||
All Other—Consumer | | | | | | | | | | | | | |||||||
Mexico Consumer | | $ | 17.2 | | $ | 17.9 | | $ | 20.0 | | $ | 21.2 | | $ | 22.5 | | 6% | | 31% |
Asia Consumer(5) | | | 4.7 | | | 4.5 | | | 3.0 | | | 2.7 | | | 2.5 | | (7%) | | (47%) |
Legacy Holdings Assets (LHA) | | | 2.0 | | | 1.9 | | | 1.9 | | | 1.7 | | | 1.7 | | - | | (15%) |
Total | | $ | 23.9 | | $ | 24.3 | | $ | 24.9 | | $ | 25.6 | | $ | 26.7 | | 4% | | 12% |
| | | | | | | | | | | | ||||||||
Total consumer loans | | $ | 393.1 | | $ | 386.3 | | $ | 395.8 | | $ | 398.6 | | $ | 408.5 | | 2% | | 4% |
| | | | | | | | | | | | ||||||||
Total loans—EOP | | $ | 694.5 | | $ | 702.1 | | $ | 725.3 | | $ | 733.9 | | $ | 752.2 | | 2% | | 8% |
| | | | | | | | | | | | ||||||||
Total loans—average | | $ | 688.0 | | $ | 690.7 | | $ | 712.2 | | $ | 725.0 | | $ | 736.7 | | 2% | | 7% |
| | | | | | | | | | | | ||||||||
NCLs as a % of total average loans | | | 1.30% | | | 1.44% | | | 1.26% | | | 1.21% | | | 1.18% | | 0 bps | | (12) bps |
| | | | | | | | | | | | ||||||||
| (1) | Corporate loans include loans managed by Services, Markets, Banking, and All Other—Legacy Franchises—Mexico SBMM, and the AFG. |
| (2) | Consumer loans include loans managed by USPB, Wealth, and All Other—Legacy Franchises (other than Mexico SBMM, and the AFG). |
| (3) | Includes Legacy Franchises corporate loans activity related to Mexico SBMM and AFG (AFG was previously reported in Markets; all periods have been reclassified to reflect this move into Legacy Franchises), as well as other LHA corporate loans. |
| (4) | See footnote 5 on page 9. |
| (5) | Asia Consumer also includes loans in Poland (through 1Q25) and Russia. |
NM Not meaningful.
Reclassified to conform to the current period’s presentation.
Page 16
END-OF-PERIOD DEPOSITS
(In billions of dollars)
| | | | | | | | | | | | | | | | | 4Q25 Increase/ | ||
| | 4Q | | 1Q | | 2Q | | 3Q | | 4Q | | (Decrease) from | |||||||
| | 2024 | | 2025 | | 2025 | | 2025 | | 2025 | | 3Q25 | | 4Q24 | |||||
| | | | | | | | | | | | | | | | | | | |
Services, Markets, and Banking by region | | | | | | | | | | | | | |||||||
North America | | $ | 397.8 | | $ | 406.2 | | $ | 414.4 | | $ | 428.4 | | $ | 452.8 | | 6% | | 14% |
International | | | 422.5 | | | 444.4 | | | 477.2 | | | 483.1 | | | 481.3 | | - | | 14% |
Total | | $ | 820.3 | | $ | 850.6 | | $ | 891.6 | | $ | 911.5 | | $ | 934.1 | | 2% | | 14% |
| | | | | | | | | | | | ||||||||
Treasury and Trade Solutions | | $ | 680.7 | | $ | 692.1 | | $ | 726.4 | | $ | 740.0 | | $ | 779.4 | | 5% | | 14% |
Securities Services | | | 126.3 | | | 140.9 | | | 148.1 | | | 151.3 | | | 138.4 | | (9%) | | 10% |
Services | | $ | 807.0 | | $ | 833.0 | | $ | 874.5 | | $ | 891.3 | | $ | 917.8 | | 3% | | 14% |
Markets(1) | | | 12.7 | | | 17.1 | | | 16.7 | | | 19.4 | | | 15.9 | | (18%) | | 25% |
Banking | | | 0.6 | | | 0.5 | | | 0.4 | | | 0.8 | | | 0.4 | | (50%) | | (33%) |
Total | | $ | 820.3 | | $ | 850.6 | | $ | 891.6 | | $ | 911.5 | | $ | 934.1 | | 2% | | 14% |
| | | | | | | | | | | | ||||||||
Wealth | | | | | | | | | | | | | |||||||
North America | | $ | 189.5 | | $ | 186.3 | | $ | 186.8 | | $ | 188.9 | | $ | 197.2 | | 4% | | 4% |
International | | | 123.3 | | | 122.4 | | | 123.1 | | | 129.2 | | | 126.9 | | (2%) | | 3% |
Total | | $ | 312.8 | | $ | 308.7 | | $ | 309.9 | | $ | 318.1 | | $ | 324.1 | | 2% | | 4% |
| | | | | | | | | | | | ||||||||
USPB | | $ | 89.4 | | $ | 92.4 | | $ | 90.5 | | $ | 89.6 | | $ | 88.4 | | (1%) | | (1%) |
| | | | | | | | | | | | ||||||||
All Other | | | | | | | | | | | | | |||||||
Legacy Franchises | | | | | | | | | | | | | |||||||
Mexico Consumer | | $ | 26.0 | | $ | 25.6 | | $ | 28.5 | | $ | 29.7 | | $ | 33.3 | | 12% | | 28% |
Mexico SBMM—corporate | | | 8.1 | | | 9.7 | | | 9.9 | | | 10.9 | | | 10.5 | | (4%) | | 30% |
Asia Consumer(2) | | | 7.5 | | | 7.4 | | | 1.5 | | | 1.3 | | | 1.1 | | (15%) | | (85%) |
Legacy Holdings Assets (LHA)(3) | | | 0.2 | | | 0.1 | | | 0.1 | | | 0.1 | | | 0.1 | | - | | (50%) |
Corporate/Other(1) | | | 20.2 | | | 21.9 | | | 25.7 | | | 22.7 | | | 12.0 | | (47%) | | (41%) |
Total | | $ | 62.0 | | $ | 64.7 | | $ | 65.7 | | $ | 64.7 | | $ | 57.0 | | (12%) | | (8%) |
| | | | | | | | | | | | ||||||||
Total deposits—EOP | | $ | 1,284.5 | | $ | 1,316.4 | | $ | 1,357.7 | | $ | 1,383.9 | | $ | 1,403.6 | | 1% | | 9% |
| | | | | | | | | | | | ||||||||
Total deposits—average | | $ | 1,320.4 | | $ | 1,305.0 | | $ | 1,342.8 | | $ | 1,382.2 | | $ | 1,422.3 | | 3% | | 8% |
| | | | | | | | | | | | ||||||||
| | | | | | | | | | | | ||||||||
| (1) | During the third quarter of 2024, approximately $9 billion of institutional deposits were moved from Markets to Corporate/Other, as they are managed by Citi Treasury. Prior periods were not impacted. |
| (2) | Asia Consumer also includes deposits in Poland (through 1Q25) and Russia. |
| (3) | LHA includes deposits from the U.K. consumer banking business. |
NM Not meaningful.
Reclassified to conform to the current period’s presentation.
Page 17
ALLOWANCE FOR CREDIT LOSSES (ACL) ROLLFORWARD
(In millions of dollars, except ratios)
| | | | | | | | | | | | | | | | | | | | | | | | | | | | | | | | | | | | | | | | | | | | | | | | | | | | | ACLL/EOP |
| | Balance | | | Builds (Releases) | | FY 2024 | | | Balance | | | Builds (Releases) | | YTD 2025 | | | Balance | | Loans | |||||||||||||||||||||||||||||||||
| | 12/31/23 | | | 1Q24 | | 2Q24 | | 3Q24 | | 4Q24 | | | FY 2024 | | FX/Other | | | 12/31/24 | | | 1Q25 | | 2Q25 | | 3Q25 | | 4Q25 | | | YTD 2025 | | FX/Other(1) | | | 12/31/25 | | 12/31/25 | |||||||||||||||
| | | | | | | | | | | | | | | | | | | | | | | | | | | | | | | | | | | | | | | | | | | | | | | | | | | | | |
Allowance for credit losses on loans (ACLL) | | | | | | | | | | | | | | | | | | | | | | | | | | | | | | | | | | | | | | | |||||||||||||||
Services | | $ | 397 | | | $ | 34 | | $ | (100) | | $ | 7 | | $ | (71) | | | $ | (130) | | $ | (3) | | | $ | 264 | | | $ | 24 | | $ | 53 | | $ | (4) | | $ | (18) | | | $ | 55 | | $ | 8 | | | $ | 327 | | |
Markets | | | 820 | | | | 120 | | | (111) | | | 37 | | | 167 | | | | 213 | | | (3) | | | | 1,030 | | | | 48 | | | 53 | | | (44) | | | (73) | | | | (16) | | | 13 | | | | 1,027 | | |
Banking | | | 1,376 | | | | (89) | | | (51) | | | 62 | | | (122) | | | | (200) | | | (9) | | | | 1,167 | | | | 78 | | | 137 | | | 38 | | | 136 | | | | 389 | | | 22 | | | | 1,578 | | |
Legacy Franchises corporate (Mexico SBMM & AFG(2)) | | | 121 | | | | (8) | | | (12) | | | (3) | | | 10 | | | | (13) | | | (13) | | | | 95 | | | | 4 | | | 16 | | | (12) | | | 6 | | | | 14 | | | 12 | | | | 121 | | |
Total corporate ACLL | | $ | 2,714 | | | $ | 57 | | $ | (274) | | $ | 103 | | $ | (16) | | | $ | (130) | | $ | (28) | | | $ | 2,556 | | | $ | 154 | | $ | 259 | | $ | (22) | | $ | 51 | | | $ | 442 | | $ | 55 | | | $ | 3,053 | | 0.91% |
U.S. Cards(3) | | $ | 12,626 | | | $ | 326 | | $ | 357 | | $ | 10 | | $ | 221 | | | $ | 914 | | $ | 20 | | | $ | 13,560 | | | $ | (169) | | $ | (12) | | $ | 44 | | $ | (102) | | | $ | (239) | | $ | 3 | | | $ | 13,324 | | 7.67% |
Installment loans(4) | | | 319 | | | | 13 | | | 30 | | | 30 | | | 32 | | | | 105 | | | 1 | | | | 425 | | | | (5) | | | 7 | | | 11 | | | (15) | | | | (2) | | | (1) | | | | 422 | | |
Retail Banking(4) | | | 157 | | | | (2) | | | (5) | | | 1 | | | (7) | | | | (13) | | | - | | | | 144 | | | | 3 | | | (1) | | | 9 | | | 4 | | | | 15 | | | - | | | | 159 | | |
Total USPB | | $ | 13,102 | | | $ | 337 | | $ | 382 | | $ | 41 | | $ | 246 | | | $ | 1,006 | | $ | 21 | | | $ | 14,129 | | | $ | (171) | | $ | (6) | | $ | 64 | | $ | (113) | | | $ | (226) | | $ | 2 | | | $ | 13,905 | | |
Wealth | | | 767 | | | | (190) | | | (43) | | | 8 | | | (11) | | | | (236) | | | (2) | | | | 529 | | | | 61 | | | (64) | | | (25) | | | 2 | | | | (26) | | | 7 | | | | 510 | | |
All Other—consumer | | | 1,562 | | | | (85) | | | 11 | | | 58 | | | 102 | | | | 86 | | | (288) | | | | 1,360 | | | | 58 | | | 54 | | | 28 | | | 70 | | | | 210 | | | 209 | | | | 1,779 | | |
Total consumer ACLL | | $ | 15,431 | | | $ | 62 | | $ | 350 | | $ | 107 | | $ | 337 | | | $ | 856 | | $ | (269) | | | $ | 16,018 | | | $ | (52) | | $ | (16) | | $ | 67 | | $ | (41) | | | $ | (42) | | $ | 218 | | | $ | 16,194 | | 3.96% |
Total ACLL | | $ | 18,145 | | | $ | 119 | | $ | 76 | | $ | 210 | | $ | 321 | | | $ | 726 | | $ | (297) | | | $ | 18,574 | | | $ | 102 | | $ | 243 | | $ | 45 | | $ | 10 | | | $ | 400 | | $ | 273 | | | $ | 19,247 | | 2.58% |
Allowance for credit losses on unfunded lending commitments (ACLUC) | | $ | 1,728 | | | $ | (98) | | $ | (8) | | $ | 105 | | $ | (118) | | | $ | (119) | | $ | (8) | | | $ | 1,601 | | | $ | 108 | | $ | (19) | | $ | 100 | | $ | 13 | | | $ | 202 | | $ | 30 | | | $ | 1,833 | | |
Total ACLL and ACLUC | | | 19,873 | | | | 21 | | | 68 | | | 315 | | | 203 | | | | 607 | | | (305) | | | | 20,175 | | | | 210 | | | 224 | | | 145 | | | 23 | | | | 602 | | | 303 | | | | 21,080 | | |
Other(5)(6) | | | 1,883 | | | | 14 | | | 107 | | | 160 | | | 131 | | | | 412 | | | (293) | | | | 2,002 | | | | 34 | | | 388 | | | 74 | | | (17) | | | | 479 | | | (2,188) | | | | 293 | | |
Total ACL | | $ | 21,756 | | | $ | 35 | | $ | 175 | | $ | 475 | | $ | 334 | | | $ | 1,019 | | $ | (598) | | | $ | 22,177 | | | $ | 244 | | $ | 612 | | $ | 219 | | $ | 6 | | | $ | 1,081 | | $ | (1,885) | | | $ | 21,373 | | |
| | | | | | | | | | | | | | | | | | | | | | | | | | | | | | | | | | | | | |||||||||||||||||
| (1) | Primarily includes FX translation on the EOP ACL balances. |
| (2) | See footnote 3 on page 16. |
| (3) | The December 31, 2024 ACLL balance includes approximately $20 million related to an acquired portfolio, which is also reflected in the FX/Other column in this table. |
| (4) | See footnote 5 on page 9. |
| (5) | Includes ACL activity on HTM securities and Other assets. |
| (6) | The decrease in the Other ACL at December 31, 2025, represents the held-for-sale accounting treatment for A.O. Citibank (Russia), wherein the assets and liabilities of A.O. Citibank were reclassified to Other assets and Other liabilities. |
Reclassified to conform to the current period’s presentation.
Page 18
ALLOWANCE FOR CREDIT LOSSES ON LOANS (ACLL) AND
UNFUNDED LENDING COMMITMENTS (ACLUC)
Page 1
(In millions of dollars)
| | | | | | | | | | | | 4Q25 Increase/ | | | Full | | Full | | FY 2025 vs. | |||||||||
| | 4Q | | 1Q | | 2Q | | 3Q | | 4Q | | (Decrease) from | | | Year | | Year | | FY 2024 Increase/ | |||||||||
| | 2024 | | 2025 | | 2025 | | 2025 | | 2025 | | 3Q25 | | 4Q24 | | | 2024 | | 2025 | | (Decrease) | |||||||
| | | | | | | | | | | | | | | | | | | | | | |||||||
Total Citigroup | | | | | | | | | | | | | | | | | | | | | | | | | | | | |
Allowance for credit losses on loans (ACLL) at beginning of period | | $ | 18,356 | | $ | 18,574 | | $ | 18,726 | | $ | 19,123 | | $ | 19,206 | | - | | 5% | | | $ | 18,145 | | $ | 18,574 | | 2% |
Gross credit (losses) on loans | | | (2,680) | | | (2,926) | | | (2,723) | | | (2,726) | | | (2,724) | | - | | (2%) | | | | (10,694) | | | (11,099) | | (4%) |
Gross recoveries on loans | | | 438 | | | 467 | | | 489 | | | 512 | | | 534 | | 4% |
| 22% | | | | 1,694 | | | 2,002 | | 18% |
Net credit (losses) / recoveries on loans (NCLs) | | | (2,242) | | | (2,459) | | | (2,234) | | | (2,214) | | | (2,190) | | (1%) | | (2%) | | | | (9,000) | | | (9,097) | | 1% |
Replenishment of NCLs | | | 2,242 | | | 2,459 | | | 2,234 | | | 2,214 | | | 2,190 | | (1%) | | (2%) | | | | 9,000 | | | 9,097 | | 1% |
Net reserve builds / (releases) for loans | | | 321 | | | 102 | | | 243 | | | 45 | | | 10 | | (78%) | | (97%) | | | | 726 | | | 400 | | (45%) |
Provision for credit losses on loans (PCLL) | | | 2,563 | | | 2,561 | | | 2,477 | | | 2,259 | | | 2,200 | | (3%) | | (14%) | | | | 9,726 | | | 9,497 | | (2%) |
Other, net(1)(2)(3)(4)(5)(6) | | | (103) | | | 50 | | | 154 | | | 38 | | | 31 | | (18%) | | NM | | | | (297) | | | 273 | | NM |
ACLL at end of period (a) | | $ | 18,574 | | $ | 18,726 | | $ | 19,123 | | $ | 19,206 | | $ | 19,247 | | - | | 4% | | | $ | 18,574 | | $ | 19,247 | | 4% |
| | | | | | | | | | | | | | | | | | |||||||||||
Allowance for credit losses on unfunded lending commitments (ACLUC)(7) (a) | | $ | 1,601 | | $ | 1,720 | | $ | 1,721 | | $ | 1,820 | | $ | 1,833 | | 1% | | 14% | | | $ | 1,601 | | $ | 1,833 | | 14% |
| | | | | | | | | | | | | | | | | | |||||||||||
Provision (release) for credit losses on unfunded lending commitments | | $ | (118) | | $ | 108 | | $ | (19) | | $ | 100 | | $ | 13 | | (87%) | | NM | | | $ | (119) | | $ | 202 | | NM |
| | | | | | | | | | | | | | | | | | |||||||||||
Total allowance for credit losses on loans, leases and unfunded lending commitments [sum of (a)] | | $ | 20,175 | | $ | 20,446 | | $ | 20,844 | | $ | 21,026 | | $ | 21,080 | | - | | 4% | | | $ | 20,175 | | $ | 21,080 | | 4% |
| | | | | | | | | | | | | | | | | | |||||||||||
Total ACLL as a percentage of total loans(8) | | | 2.71% | | | 2.70% | | | 2.67% | | | 2.65% | | | 2.58% | | (7) bps | | (13) bps | | | | | | | |||
| | | | | | | | | | | | | | | | | | |||||||||||
Consumer | | | | | | | | | | | | | | | | | | | ||||||||||
ACLL at beginning of period | | $ | 15,765 | | $ | 16,018 | | $ | 16,001 | | $ | 16,100 | | $ | 16,205 | | 1% | | 3% | | | $ | 15,431 | | $ | 16,018 | | 4% |
| | | | | | | | | | | | | | | | | | |||||||||||
NCLs | | | (2,191) | | | (2,277) | | | (2,185) | | | (2,122) | | | (2,148) | | 1% | | (2%) | | | | (8,603) | | | (8,732) | | 1% |
Replenishment of NCLs | | | 2,191 | | | 2,277 | | | 2,185 | | | 2,122 | | | 2,148 | | 1% | | (2%) | | | | 8,603 | | | 8,732 | | 1% |
Net reserve builds / (releases) for loans | | | 337 | | | (52) | | | (16) | | | 67 | | | (41) | | NM | | NM | | | | 856 | | | (42) | | NM |
Provision for credit losses on loans (PCLL) | | | 2,528 | | | 2,225 | | | 2,169 | | | 2,189 | | | 2,107 | | (4%) | | (17%) | | | | 9,459 | | | 8,690 | | (8%) |
Other, net(1)(2)(3)(4)(5)(6) | | | (84) | | | 35 | | | 115 | | | 38 | | | 30 | | (21%) | | NM | | | | (269) | | | 218 | | NM |
ACLL at end of period (b) | | $ | 16,018 | | $ | 16,001 | | $ | 16,100 | | $ | 16,205 | | $ | 16,194 | | - | | 1% | | | $ | 16,018 | | $ | 16,194 | | 1% |
| | | | | | | | | | | | | | | | | | |||||||||||
Consumer ACLUC(7) (b) | | $ | 34 | | $ | 31 | | $ | 24 | | $ | 20 | | $ | 24 | | 20% | | (29%) | | | $ | 34 | | $ | 24 | | (29%) |
| | | | | | | | | | | | | | | | | | |||||||||||
Provision (release) for credit losses on unfunded lending commitments | | $ | (2) | | $ | (3) | | $ | (1) | | $ | (4) | | $ | 3 | | NM | | NM | | | $ | (25) | | $ | (5) | | 80% |
| | | | | | | | | | | | | | | | | | |||||||||||
Total allowance for credit losses on loans, leases and unfunded lending commitments [sum of (b)] | | $ | 16,052 | | $ | 16,032 | | $ | 16,124 | | $ | 16,225 | | $ | 16,218 | | - | | 1% | | | $ | 16,052 | | $ | 16,218 | | 1% |
| | | | | | | | | | | | | | | | | | |||||||||||
Consumer ACLL as a percentage of total consumer loans | | | 4.08% | | | 4.14% | | | 4.07% | | | 4.07% | | | 3.96% | | (11) bps | | (12) bps | | | | | | | |||
| | | | | | | | | | | | | | | | | | |||||||||||
Corporate | | | | | | | | | | | | | | | | | | | ||||||||||
ACLL at beginning of period | | $ | 2,591 | | $ | 2,556 | | $ | 2,725 | | $ | 3,023 | | $ | 3,001 | | (1%) | | 16% | | | $ | 2,714 | | $ | 2,556 | | (6%) |
| | | | | | | | | | | | | | | | | | |||||||||||
NCLs | | | (51) | | | (182) | | | (49) | | | (92) | | | (42) | | (54%) | | (18%) | | | | (397) | | | (365) | | (8%) |
Replenishment of NCLs | | | 51 | | | 182 | | | 49 | | | 92 | | | 42 | | (54%) | | (18%) | | | | 397 | | | 365 | | (8%) |
Net reserve builds / (releases) for loans | | | (16) | | | 154 | | | 259 | | | (22) | | | 51 | | NM | | NM | | | | (130) | | | 442 | | NM |
Provision for credit losses on loans (PCLL) | | | 35 | | | 336 | | | 308 | | | 70 | | | 93 | | 33% | | 166% | | | | 267 | | | 807 | | 202% |
Other, net(1) | | | (19) | | | 15 | | | 39 | | | - | | | 1 | | NM | | NM | | | | (28) | | | 55 | | NM |
ACLL at end of period (c) | | $ | 2,556 | | $ | 2,725 | | $ | 3,023 | | $ | 3,001 | | $ | 3,053 | | 2% | | 19% | | | $ | 2,556 | | $ | 3,053 | | 19% |
| | | | | | | | | | | | | | | | | | |||||||||||
Corporate ACLUC(7) (c) | | $ | 1,567 | | $ | 1,689 | | $ | 1,697 | | $ | 1,800 | | $ | 1,809 | | 1% | | 15% | | | $ | 1,567 | | $ | 1,809 | | 15% |
| | | | | | | | | | | | | | | | | | |||||||||||
Provision (release) for credit losses on unfunded lending commitments | | $ | (116) | | $ | 111 | | $ | (18) | | $ | 104 | | $ | 10 | | (90%) | | NM | | | $ | (94) | | $ | 207 | | NM |
| | | | | | | | | | | | | | | | | | |||||||||||
Total allowance for credit losses on loans, leases and unfunded lending commitments [sum of (c)] | | $ | 4,123 | | $ | 4,414 | | $ | 4,720 | | $ | 4,801 | | $ | 4,862 | | 1% | | 18% | | | $ | 4,123 | | $ | 4,862 | | 18% |
| | | | | | | | | | | | | | | | | | |||||||||||
Corporate ACLL as a percentage of total corporate loans(9) | | | 0.87% | | | 0.89% | | | 0.94% | | | 0.92% | | | 0.91% | | (1) bps | | 4 bps | | | | | | | |||
| | | | | | | | | | | | | | | | | | |||||||||||
Footnotes to this table are on the following page (page 20).
Page 19
ALLOWANCE FOR CREDIT LOSSES ON LOANS (ACLL) AND
UNFUNDED LENDING COMMITMENTS (ACLUC)
Page 2
The following footnotes relate to the table on the preceding page (page 19):
(1) | Includes all adjustments to the allowance for credit losses, such as changes in the allowance from acquisitions, dispositions, securitizations, foreign currency translation (FX translation), purchase accounting adjustments, etc. |
(2) | 4Q24 primarily relates to FX translation. |
(3) | 1Q25 primarily relates to FX translation. |
(4) | 2Q25 includes an approximate $25 million reclass related to Citi’s agreement to sell its Poland consumer banking business. That ACLL was transferred to Other assets beginning June 30, 2025. 2Q25 also includes FX translation. |
(5) | 3Q25 primarily relates to FX translation. |
(6) | 4Q25 primarily relates to FX translation. |
(7) | Represents additional credit reserves recorded as other liabilities on the Consolidated Balance Sheet. |
(8) | Excludes loans that are carried at fair value of $8.0 billion, $8.2 billion, $9.3 billion, $7.9 billion, and $6.9 billion at December 31, 2024, March 31, 2025, June 30, 2025, September 30, 2025, and December 31, 2025, respectively. |
(9) | Excludes loans that are carried at fair value of $7.8 billion, $7.9 billion, $9.2 billion, $7.9 billion, and $6.9 billion at December 31, 2024, March 31, 2025, June 30, 2025, September 30, 2025, and December 31, 2025, respectively. |
NM Not meaningful.
Reclassified to conform to the current period’s presentation.
Page 20
NON-ACCRUAL ASSETS
(In millions of dollars)
| | | | | | | | | | | | 4Q25 Increase/ | |||||||
| | 4Q | | 1Q | | 2Q | | 3Q | | 4Q | | (Decrease) from | |||||||
| | 2024 | | 2025 | | 2025 | | 2025 | | 2025 | | 3Q25 | | 4Q24 | |||||
| | | | | | | | | | | | | | | |||||
Corporate non-accrual loans by region(1) | | | | | | | | | | | | | | | | | | | |
North America | | $ | 757 | | $ | 822 | | $ | 953 | | $ | 1,280 | | $ | 1,145 | | (11%) | | 51% |
International | | | 620 | | | 554 | | | 769 | | | 791 | | | 856 | | 8% | | 38% |
Total | | $ | 1,377 | | $ | 1,376 | | $ | 1,722 | | $ | 2,071 | | $ | 2,001 | | (3%) | | 45% |
| | | | | | | | | | | | | | | | | | | |
Corporate non-accrual loans(1) | | | | | | | | | | | | | | | | | | | |
Banking | | $ | 498 | | $ | 510 | | $ | 502 | | $ | 820 | | $ | 919 | | 12% | | 85% |
Services | | | 65 | | | 110 | | | 134 | | | 187 | | | 337 | | 80% | | 418% |
Markets | | | 715 | | | 631 | | | 932 | | | 926 | | | 622 | | (33%) | | (13%) |
Mexico SBMM & AFG | | | 99 | | | 125 | | | 154 | | | 138 | | | 123 | | (11%) | | 24% |
Total | | $ | 1,377 | | $ | 1,376 | | $ | 1,722 | | $ | 2,071 | | $ | 2,001 | | (3%) | | 45% |
| | | | | | | | | | | | | | | | | | | |
Consumer non-accrual loans(1) | | | | | | | | | | | | | | | | | | | |
Wealth | | $ | 404 | | $ | 415 | | $ | 637 | | $ | 583 | | $ | 526 | | (10%) | | 30% |
USPB | | | 290 | | | 305 | | | 329 | | | 325 | | | 343 | | 6% | | 18% |
Mexico Consumer | | | 411 | | | 416 | | | 485 | | | 526 | | | 585 | | 11% | | 42% |
Asia Consumer(2) | | | 19 | | | 20 | | | 16 | | | 16 | | | 15 | | (6%) | | (21%) |
Legacy Holdings Assets—Consumer | | | 186 | | | 172 | | | 165 | | | 157 | | | 149 | | (5%) | | (20%) |
Total | | $ | 1,310 | | $ | 1,328 | | $ | 1,632 | | $ | 1,607 | | $ | 1,618 | | 1% | | 24% |
| | | | | | | | | | | | | | | | | | | |
Total non-accrual loans (NAL) | | $ | 2,687 | | $ | 2,704 | | $ | 3,354 | | $ | 3,678 | | $ | 3,619 | | (2%) | | 35% |
| | | | | | | | | | | | | | | | | | | |
Other real estate owned (OREO)(3) | | $ | 18 | | $ | 21 | | $ | 26 | | $ | 29 | | $ | 22 | | (24%) | | 22% |
| | | | | | | | | | | | | | | | | | | |
| | | | | | | | | | | | | | | | | | | |
NAL as a percentage of total loans | | | 0.39% | | | 0.39% | | | 0.46% | | | 0.50% | | | 0.48% | | (2) bps | | 9 bps |
| | | | | | | | | | | | | | | | | | | |
ACLL as a percentage of NAL | | | 691% | | | 693% | | | 570% | | | 522% | | | 532% | | | | |
| | | | | | | | | | | | | | | | | | | |
| (1) | Corporate loans are placed on non-accrual status based on a review by Citigroup’s risk officers. Corporate non-accrual loans may still be current on interest payments. With limited exceptions, the following practices are applied for consumer loans: consumer loans, excluding credit cards and mortgages, are placed on non-accrual status at 90 days past due, and are charged off at 120 days past due; residential mortgage loans are placed on non-accrual status at 90 days past due and written down to net realizable value at 180 days past due. Consistent with industry conventions, Citigroup generally accrues interest on credit card loans until such loans are charged off, which typically occurs at 180 days contractual delinquency. As such, the non-accrual loan disclosures do not include credit card loans. The balances above represent non-accrual loans within Consumer loans and Corporate loans on the Consolidated Balance Sheet. |
| (2) | Asia Consumer also includes Non-accrual assets in Poland (through 1Q25) and Russia. |
| (3) | Represents the carrying value of all property acquired by foreclosure or other legal proceedings when Citigroup has taken possession of the collateral. Also includes former premises and property for use that is no longer contemplated. |
NM Not meaningful.
Reclassified to conform to the current period’s presentation.
Page 21
COMMON EQUITY TIER 1 (CET1) CAPITAL AND SUPPLEMENTARY LEVERAGE RATIOS,
(In millions of dollars or shares, except per share amounts and ratios)
| | December 31, | | March 31, | | June 30, | | September 30, | | December 31, | |||||
CET1 Capital and Ratio and Components(1) | | 2024 | | 2025 | | 2025 | | 2025 | | 2025(2) | |||||
| | | | | | | | | | | |||||
Citigroup common stockholders’ equity(3) | | $ | 190,815 | | $ | 194,125 | | $ | 196,931 | | $ | 194,038 | | $ | 192,304 |
Add: qualifying noncontrolling interests | | | 186 | | | 192 | | | 200 | | | 217 | | | 214 |
Regulatory capital adjustments and deductions: | | | | | | | | | | | | | | | |
Add: | | | | | | | | | | | | | | | |
CECL transition provision(4) | | | 757 | | | - | | | - | | | - | | | - |
Less: | | | | | | | | | | | | | | | |
Accumulated net unrealized gains (losses) on cash flow hedges, net of tax | | | (220) | | | (213) | | | (141) | | | (116) | | | 10 |
Cumulative unrealized net gain (loss) related to changes in fair value of financial liabilities attributable to own creditworthiness, net of tax | | | (910) | | | (32) | | | (408) | | | (1,443) | | | (1,919) |
Intangible assets: | | | | | | | | | | | | | | | |
Goodwill, net of related deferred tax liabilities (DTLs)(5) | | | 17,994 | | | 18,122 | | | 18,524 | | | 17,876 | | | 18,482 |
Identifiable intangible assets other than mortgage servicing rights (MSRs), net of related DTLs | | | 3,357 | | | 3,291 | | | 3,236 | | | 3,169 | | | 3,135 |
Defined benefit pension plan net assets and other | | | 1,504 | | | 1,532 | | | 1,610 | | | 1,725 | | | 1,831 |
Deferred tax assets (DTAs) arising from net operating loss, foreign tax credit and general business credit carry-forwards(6) | | | 11,628 | | | 11,517 | | | 11,163 | | | 10,807 | | | 10,784 |
Excess over 10% / 15% limitations for other DTAs, certain common stock investments and MSRs(6)(8) | | | 3,042 | | | 4,261 | | | 4,204 | | | 3,757 | | | 3,119 |
CET1 Capital | | $ | 155,363 | | $ | 155,839 | | $ | 158,943 | | $ | 158,480 | | $ | 157,076 |
Risk-Weighted Assets (RWA)(4) | | $ | 1,139,988 | | $ | 1,162,306 | | $ | 1,178,756 | | $ | 1,194,274 | | $ | 1,192,528 |
CET1 Capital ratio (CET1/RWA) | | | 13.63% | | | 13.41% | | | 13.48% | | | 13.27% | | | 13.2% |
| | | | | | | | | | | | | | | |
Supplementary Leverage Ratio and Components | | | | | | | | | | | | | | | |
CET1(4) | | $ | 155,363 | | $ | 155,839 | | $ | 158,943 | | $ | 158,480 | | $ | 157,076 |
Additional Tier 1 Capital (AT1)(7) | | | 19,164 | | | 19,675 | | | 17,676 | | | 20,313 | | | 22,660 |
Total Tier 1 Capital (T1C) (CET1 + AT1) | | $ | 174,527 | | $ | 175,514 | | $ | 176,619 | | $ | 178,793 | | $ | 179,736 |
Total Leverage Exposure (TLE)(4) | | $ | 2,985,418 | | $ | 3,033,450 | | $ | 3,195,323 | | $ | 3,236,413 | | $ | 3,275,264 |
Supplementary Leverage ratio (T1C/TLE)(4) | | | 5.85% | | | 5.79% | | | 5.53% | | | 5.52% | | | 5.5% |
| | | | | | | | | | | | | | | |
| (1) | See footnote 3 on page 1. |
| (2) | December 31, 2025 is preliminary. |
| (3) | Excludes issuance costs related to outstanding preferred stock in accordance with Federal Reserve Board regulatory reporting requirements. |
| (4) | See footnote 4 on page 1. |
| (5) | Includes goodwill “embedded” in the valuation of significant common stock investments in unconsolidated financial institutions. |
| (6) | Represents deferred tax excludable from Basel III CET1 Capital, which includes net DTAs arising from net operating loss, foreign tax credit, and general business credit tax carry-forwards and DTAs arising from temporary differences (future deductions) that are deducted from CET1 Capital exceeding the 10% limitation. |
| (7) | Additional Tier 1 Capital primarily includes qualifying noncumulative perpetual preferred stock and qualifying trust preferred securities. |
| (8) | Assets subject to 10% / 15% limitations include MSRs, DTAs arising from temporary differences, and significant common stock investments in unconsolidated financial institutions. For all periods presented, the deduction related only to DTAs arising from temporary differences that exceeded the 10% limitation. |
Reclassified to conform to the current period’s presentation.
Page 22
TANGIBLE COMMON EQUITY, COMMON EQUITY, BOOK VALUE
PER SHARE, TANGIBLE BOOK VALUE PER SHARE (TBVPS),
RETURNS ON COMMON EQUITY (RoCE) AND
TANGIBLE COMMON EQUITY (RoTCE)
(In millions of dollars or shares, except per share amounts and ratios)
| | | | | | | | | | | | 4Q25 Increase/ | | | Full | | Full | | FY 2025 vs. | |||||||||
| | 4Q | | 1Q | | 2Q | | 3Q | | 4Q | | (Decrease) from | | | Year | | Year | | FY 2024 Increase/ | |||||||||
| | 2024 | | 2025 | | 2025 | | 2025 | | 2025 | | 3Q25 | | 4Q24 | | | 2024 | | 2025 | | (Decrease) | |||||||
Tangible Common Equity, Book Value Per Share and Tangible Book Value Per Share | | | | | | | | | | | | | | | | | | | | | | | | | | | | |
Common stockholders’ equity | | $ | 190,748 | | $ | 194,058 | | $ | 196,872 | | $ | 193,973 | | $ | 192,241 | | | | | | | | | |||||
Less: | | | | | | | | | | | | | | | | | | | ||||||||||
Goodwill | | | 19,300 | | | 19,422 | | | 19,878 | | | 19,126 | | | 19,098 | | | | | | | | | |||||
Identifiable Intangible assets (other than MSRs) | | | 3,734 | | | 3,679 | | | 3,639 | | | 3,582 | | | 3,525 | | | | | | | | | |||||
Goodwill and identifiable intangible assets (other than MSRs) related to businesses HFS | | | 16 | | | 16 | | | 16 | | | - | | | - | | | | | | | | | |||||
Tangible common equity (TCE)(1) | | $ | 167,698 | | $ | 170,941 | | $ | 173,339 | | $ | 171,265 | | $ | 169,618 | | | | | | | | | |||||
Common shares outstanding (CSO) | | | 1,877.1 | | | 1,867.7 | | | 1,840.9 | | | 1,789.3 | | | 1,747.5 | | | | | | | | | |||||
Book value per share (common equity/CSO) | | $ | 101.62 | | $ | 103.90 | | $ | 106.94 | | $ | 108.41 | | $ | 110.01 | | | | | | | | | |||||
Tangible book value per share (TCE/CSO)(1) | | $ | 89.34 | | $ | 91.52 | | $ | 94.16 | | $ | 95.72 | | $ | 97.06 | | | | | | | | | |||||
| | | | | | | | | | | | | | | | | | |||||||||||
Return on Common Equity and Return on Tangible Common Equity (RoTCE) | | | | | | | | | | | | | | | | | | | ||||||||||
| | | | | | | | | | | | | | | | | | |||||||||||
Net Income | | $ | 2,856 | | $ | 4,064 | | $ | 4,019 | | $ | 3,752 | | $ | 2,471 | | | | | $ | 12,682 | | $ | 14,306 | | |||
Preferred Dividends | | | 256 | | | 269 | | | 287 | | | 274 | | | 284 | | | | | | 1,054 | | | 1,114 | | |||
Net Income Available to Common Shareholders | | | 2,600 | | | 3,795 | | | 3,732 | | | 3,478 | | | 2,187 | | | | | | 11,628 | | | 13,192 | | |||
Average Common Stockholders’ Equity | | | 191,624 | | | 191,794 | | | 195,622 | | | 195,471 | | | 193,205 | | | | | | 190,070 | | | 194,023 | | |||
Less: | | | | | | | | | | | | | | | | | | | ||||||||||
Average Goodwill & Intangibles | | | 22,981 | | | 22,474 | | | 23,482 | | | 23,169 | | | 22,763 | | | | | | 23,349 | | | 23,451 | | |||
Average TCE | | $ | 168,643 | | $ | 169,320 | | $ | 172,140 | | $ | 172,302 | | $ | 170,442 | | | | | $ | 166,721 | | $ | 170,572 | | |||
| | | | | | | | | | | | | | | | | | |||||||||||
Return on Average Common Stockholders’ Equity (RoCE) | | | 5.4% | | | 8.0% | | | 7.7% | | | 7.1% | | | 4.5% | | | | | | | 6.1% | | | 6.8% | | | |
RoTCE | | | 6.1% | | | 9.1% | | | 8.7% | | | 8.0% | | | 5.1% | | | | | | | 7.0% | | | 7.7% | | | |
| | | | | | | | | | | | | | | | | | |||||||||||
Average TCE (in billions of dollars)(1)(2) | | | | | | | | | | | | | | | | | | | ||||||||||
Services | | $ | 24.9 | | $ | 24.7 | | $ | 24.7 | | $ | 24.7 | | $ | 24.7 | | | | | $ | 24.9 | | $ | 24.7 | | (1%) | ||
Markets | | | 54.0 | | | 50.4 | | | 50.4 | | | 50.4 | | | 50.4 | | | | | | 54.0 | | | 50.4 | | (7%) | ||
Banking | | | 21.8 | | | 20.6 | | | 20.6 | | | 20.6 | | | 20.6 | | | | | | 21.8 | | | 20.6 | | (6%) | ||
Wealth | | | 13.2 | | | 12.3 | | | 12.3 | | | 12.3 | | | 12.3 | | | | | | 13.2 | | | 12.3 | | (7%) | ||
USPB | | | 25.2 | | | 23.4 | | | 23.4 | | | 23.4 | | | 23.4 | | | | | | 25.2 | | | 23.4 | | (7%) | ||
All Other | | | 29.5 | | | 37.9 | | | 40.7 | | | 40.9 | | | 39.0 | | | | | | 27.6 | | | 39.2 | | 42% | ||
Total Citi average TCE | | $ | 168.6 | | $ | 169.3 | | $ | 172.1 | | $ | 172.3 | | $ | 170.4 | | (1%) | | 1% | | | $ | 166.7 | | $ | 170.6 | | 2% |
Add: | | | | | | | | | | | | | | | | | | | ||||||||||
Average goodwill | | $ | 19.4 | | $ | 18.8 | | $ | 19.8 | | $ | 19.6 | | $ | 19.2 | | | | | $ | 20.5 | | $ | 19.8 | | (3%) | ||
Average intangible assets (other than MSRs) | | | 3.6 | | | 3.7 | | | 3.7 | | | 3.6 | | | 3.6 | | | | | | 2.9 | | | 3.6 | | 24% | ||
Average goodwill and identifiable intangible assets (other than MSRs) related to businesses HFS | | | - | | | - | | | - | | | - | | | - | | | | | | - | | | - | | - | ||
Total Citi average common stockholders’ equity (in billions of dollars) | | $ | 191.6 | | $ | 191.8 | | $ | 195.6 | | $ | 195.5 | | $ | 193.2 | | (1%) | | 1% | | | $ | 190.1 | | $ | 194.0 | | 2% |
| | | | | | | | | | | | | | | | | | |||||||||||
| | | | | | | | | | | | | | | | | | |||||||||||
Income (loss) available to common shareholders (in billions of dollars)(3) | | | | | | | | | | | | | | | | | | | ||||||||||
Services | | $ | 1.9 | | $ | 1.6 | | $ | 1.4 | | $ | 1.8 | | $ | 2.2 | | 22% | | 16% | | | $ | 6.5 | | $ | 7.1 | | 9% |
Markets | | | 1.0 | | | 1.8 | | | 1.7 | | | 1.6 | | | 0.8 | | (50%) | | (20%) | | | | 4.9 | | | 5.9 | | 20% |
Banking | | | 0.4 | | | 0.5 | | | 0.5 | | | 0.6 | | | 0.7 | | 17% | | 75% | | | | 1.5 | | | 2.3 | | 53% |
Wealth | | | 0.3 | | | 0.3 | | | 0.5 | | | 0.4 | | | 0.3 | | (25%) | | - | | | | 1.0 | | | 1.5 | | 50% |
USPB | | | 0.4 | | | 0.7 | | | 0.6 | | | 0.9 | | | 0.8 | | (11%) | | 100% | | | | 1.4 | | | 3.1 | | 121% |
All Other—managed basis(3) | | | (1.4) | | | (1.1) | | | (0.8) | | | (1.0) | | | (2.5) | | (150%) | | (79%) | | | | (3.5) | | | (5.6) | | (60%) |
Reconciling Items—divestiture-related impacts(4) | | | - | | | - | | | (0.2) | | | (0.8) | | | (0.1) | | 88% | | NM | | | | (0.2) | | | (1.1) | | (450%) |
Total Citi -- Income (loss) available to common shareholders(3) | | $ | 2.6 | | $ | 3.8 | | $ | 3.7 | | $ | 3.5 | | $ | 2.2 | | (37%) | | (15%) | | | $ | 11.6 | | $ | 13.2 | | 14% |
| | | | | | | | | | | | | | | | | | |||||||||||
| | | | | | | | | | | | | | | | | | |||||||||||
RoTCE(1) | | | | | | | | | | | | | | | | | | | ||||||||||
Services | | | 29.9% | | | 26.2% | | | 23.3% | | | 28.9% | | | 36.1% | | 720 bps | | 620 bps | | | | 26.0% | | | 28.6% | | 260 bps |
Markets | | | 7.4% | | | 14.3% | | | 13.8% | | | 12.3% | | | 6.2% | | (610) bps | | (120) bps | | | | 9.1% | | | 11.6% | | 250 bps |
Banking | | | 6.5% | | | 10.7% | | | 9.0% | | | 12.3% | | | 13.2% | | 90 bps | | 670 bps | | | | 7.0% | | | 11.3% | | 430 bps |
Wealth | | | 10.1% | | | 9.4% | | | 16.1% | | | 12.1% | | | 10.9% | | (120) bps | | 80 bps | | | | 7.6% | | | 12.1% | | 450 bps |
USPB | | | 6.2% | | | 12.9% | | | 11.1% | | | 14.5% | | | 14.3% | | (20) bps | | 810 bps | | | | 5.5% | | | 13.2% | | 770 bps |
All Other—managed basis(3) | | | (17.9%) | | | (12.2%) | | | (8.4%) | | | (9.5%) | | | (26.4%) | | (1,690) bps | | (850) bps | | | | (12.6%) | | | (14.2%) | | (160) bps |
Reconciling Items—divestiture-related impacts(4) | | | N/A | | | N/A | | | N/A | | | N/A | | | N/A | | | | | | N/A | | | N/A | | |||
| | | | | | | | | | | | | | | | | | | | | | | | | | | | |
Total Citi -- RoTCE | | | 6.1% | | | 9.1% | | | 8.7% | | | 8.0% | | | 5.1% | | (290) bps | | (100) bps | | | | 7.0% | | | 7.7% | | 70 bps |
| | | | | | | | | | | | | | | | | | |||||||||||
| (1) | TCE, TBVPS and RoTCE are non-GAAP financial measures. RoTCE represents annualized net income available to common shareholders as a percentage of average TCE. |
| (2) | Tangible Common Equity is allocated to each segment based on Citi’s allocation methodology which incorporates Basel III standardized risk-weighted assets, the global systemically important banks (GSIB) surcharge, a simulation of TCE in severe stress environments, as well as a leverage component. The allocation methodology, including underlying assumptions and judgments used to allocate TCE, are periodically reassessed and as a result, the TCE allocated to the segments may change. |
| (3) | Represents Net income (loss), less Preferred Stock dividends. See table above for dividend amounts. |
| (4) | Reconciling Items consist of the divestiture-related impacts excluded from the results of All Other, as well as All Other - Legacy Franchises on a managed basis. For a reconciliation of these results, see page 14. |
NM Not meaningful.
Reclassified to conform to the current period’s presentation.
Page 23
FX Impact
(In millions of dollars)
| | | | | | | | | | | | 4Q25 Increase/ | | | Full | | Full | | FY 2025 vs. | |||||||||
| | 4Q | | 1Q | | 2Q | | 3Q | | 4Q | | (Decrease) from | | | Year | | Year | | FY 2024 Increase/ | |||||||||
| | 2024 | | 2025 | | 2025 | | 2025 | | 2025 | | 3Q25 | | 4Q24 | | | 2024 | | 2025 | | (Decrease) | |||||||
Foreign currency (FX) translation impact | | | | | | | | | | | | | | | | | | | | | | | | | | | | |
| | | | | | | | | | | | | | | | | | |||||||||||
Total Citigroup | | | | | | | | | | | | | | | | | | | ||||||||||
| | | | | | | | | | | | | | | | | | | | | | | | | | | | |
Total revenues - as reported | | $ | 19,465 | | $ | 21,596 | | $ | 21,668 | | $ | 22,090 | | $ | 19,871 | | (10%) | | 2% | | | $ | 80,722 | | $ | 85,225 | | 6% |
Impact of FX translation(1) | | | 313 | | | 372 | | | 88 | | | 44 | | | - | | | | | | (456) | | | - | | |||
Total revenues - Ex-FX(1) | | $ | 19,778 | | $ | 21,968 | | $ | 21,756 | | $ | 22,134 | | $ | 19,871 | | (10%) | | - | | | $ | 80,266 | | $ | 85,225 | | 6% |
| | | | | | | | | | | | | | | | | | |||||||||||
Total operating expenses - as reported | | $ | 13,070 | | $ | 13,425 | | $ | 13,577 | | $ | 14,290 | | $ | 13,840 | | (3%) | | 6% | | | $ | 53,567 | | $ | 55,132 | | 3% |
Impact of FX translation(1) | | | 296 | | | 322 | | | 31 | | | 18 | | | - | | | | | | 47 | | | - | | |||
Total operating expenses - Ex-FX(1) | | $ | 13,366 | | $ | 13,747 | | $ | 13,608 | | $ | 14,308 | | $ | 13,840 | | (3%) | | 4% | | | $ | 53,614 | | $ | 55,132 | | 3% |
| | | | | | | | | | | | | | | | | | |||||||||||
Total provisions for credit losses & PBC - as reported | | $ | 2,593 | | $ | 2,723 | | $ | 2,872 | | $ | 2,450 | | $ | 2,220 | | (9%) | | (14%) | | | $ | 10,109 | | $ | 10,265 | | 2% |
Impact of FX translation(1) | | | 215 | | | 71 | | | 20 | | | 5 | | | - | | | | | | 109 | | | - | | |||
Total provisions for credit losses & PBC - Ex-FX(1) | | $ | 2,808 | | $ | 2,794 | | $ | 2,892 | | $ | 2,455 | | $ | 2,220 | | (10%) | | (21%) | | | $ | 10,218 | | $ | 10,265 | | - |
| | | | | | | | | | | | | | | | | | |||||||||||
Total EBIT - as reported | | $ | 3,802 | | $ | 5,448 | | $ | 5,219 | | $ | 5,350 | | $ | 3,811 | | (29%) | | - | | | $ | 17,046 | | $ | 19,828 | | 16% |
Impact of FX translation(1) | | | (198) | | | (21) | | | 37 | | | 21 | | | - | | | | | | (612) | | | - | | |||
Total EBIT - Ex-FX(1) | | $ | 3,604 | | $ | 5,427 | | $ | 5,256 | | $ | 5,371 | | $ | 3,811 | | (29%) | | 6% | | | $ | 16,434 | | $ | 19,828 | | 21% |
| | | | | | | | | | | | | | | | | | |||||||||||
Total EOP Loans - as reported | | $ | 695 | | $ | 702 | | $ | 725 | | $ | 734 | | $ | 752 | | 2% | | 8% | | | | | | | |||
Impact of FX translation(2) | | | 14 | | | 10 | | | 1 | | | - | | | - | | | | | | | | | |||||
Total EOP Loans - Ex-FX(2) | | $ | 709 | | $ | 712 | | $ | 726 | | $ | 734 | | $ | 752 | | 2% | | 6% | | | | | | | |||
| | | | | | | | | | | | | | | | | | |||||||||||
Total EOP Deposits - as reported | | $ | 1,285 | | $ | 1,316 | | $ | 1,358 | | $ | 1,384 | | $ | 1,404 | | 1% | | 9% | | | | | | | |||
Impact of FX translation(2) | | | 33 | | | 22 | | | - | | | 1 | | | - | | | | | | | | | |||||
Total EOP Deposits - Ex-FX(2) | | $ | 1,318 | | $ | 1,338 | | $ | 1,358 | | $ | 1,385 | | $ | 1,404 | | 1% | | 7% | | | | | | | |||
| | | | | | | | | | | | | | | | | | |||||||||||
Total Average Loans - as reported | | $ | 688 | | $ | 691 | | $ | 712 | | $ | 725 | | $ | 737 | | 2% | | 7% | | | $ | 684 | | $ | 716 | | 5% |
Impact of FX translation(2) | | | 8 | | | 10 | | | 3 | | | - | | | - | | | | | | 1 | | | - | | |||
Total Average Loans - Ex-FX(2) | | $ | 696 | | $ | 701 | | $ | 715 | | $ | 725 | | $ | 737 | | 2% | | 6% | | | $ | 685 | | $ | 716 | | 5% |
| | | | | | | | | | | | | | | | | | |||||||||||
Total Average Deposits - as reported | | $ | 1,320 | | $ | 1,305 | | $ | 1,343 | | $ | 1,382 | | $ | 1,422 | | 3% | | 8% | | | $ | 1,317 | | $ | 1,363 | | 3% |
Impact of FX translation(2) | | | 20 | | | 24 | | | 6 | | | (1) | | | - | | | | | | 3 | | | - | | |||
Total Average Deposits - Ex-FX(2) | | $ | 1,340 | | $ | 1,329 | | $ | 1,349 | | $ | 1,381 | | $ | 1,422 | | 3% | | 6% | | | $ | 1,320 | | $ | 1,363 | | 3% |
| | | | | | | | | | | | | | | | | | |||||||||||
Legacy Franchises - Mexico Consumer/SBMM | | | | | | | | | | | | | | | | | | | ||||||||||
| | | | | | | | | | | | | | | | | | |||||||||||
All Other - Legacy Franchises (LF) Mexico Consumer/SBMM Revenues - As Reported | | $ | 1,422 | | $ | 1,467 | | $ | 1,536 | | $ | 1,722 | | $ | 1,775 | | 3% | | 25% | | | $ | 6,141 | | $ | 6,500 | | 6% |
Impact of FX translation(2) | | | 143 | | | 158 | | | 68 | | | 26 | | | - | | | | | | (189) | | | - | | |||
All Other - LF Mexico Consumer/SBMM Revenues - Ex-FX | | | 1,565 | | | 1,625 | | | 1,604 | | | 1,748 | | | 1,775 | | 2% | | 13% | | | $ | 5,952 | | $ | 6,500 | | 9% |
| | | | | | | | | | | | | | | | | | |||||||||||
| | | | | | | | | | | | | | | | | | |||||||||||
All Other - Legacy Franchises (LF) Mexico Consumer/SBMM Expenses - As Reported | | $ | 1,072 | | $ | 1,060 | | $ | 984 | | $ | 1,772 | | $ | 962 | | (46%) | | (10%) | | | $ | 4,415 | | $ | 4,778 | | 8% |
Impact of FX translation(2) | | | 110 | | | 129 | | | 51 | | | 31 | | | - | | | | | | (145) | | | - | | |||
All Other - LF Mexico Consumer/SBMM Expenses - Ex-FX | | | 1,182 | | | 1,189 | | | 1,035 | | | 1,803 | | | 962 | | (47%) | | (19%) | | | $ | 4,270 | | $ | 4,778 | | 12% |
| | | | | | | | | | | | | | | | | | |||||||||||
| | | | | | | | | | | | | | | | | | |||||||||||
| | | | | | | | | | | | | | | | | | |||||||||||
| | | | | | | | | | | | | | | | | | |||||||||||
| | | | | | | | | | | | | | | | | | |||||||||||
| (1) | Reflects the impact of foreign currency (FX) translation into U.S. dollars at the fourth quarter of 2025 and year-to-date 2025 average exchange rates for all periods presented. Citigroup’s results of operations excluding the impact of FX translation are non-GAAP financial measures. |
| (2) | Reflects the impact of foreign currency (FX) translation into U.S. dollars at the December 31, 2025 end-of-period exchange rates for all periods presented. Citigroup’s results of operations excluding the impact of FX translation are non-GAAP financial measures. |
NM Not meaningful.
Reclassified to conform to the current period’s presentation.
Page 24
Reconciliation of Adjusted Results (Page 1)
(In millions of dollars, except per share amounts and as otherwise noted)
| | | | | | | | | | | | | | | | | 4Q25 Increase/ | | | Full | | Full | | FY 2025 vs. | | ||||
| | 4Q | | 1Q | | 2Q | | 3Q | | 4Q | | (Decrease) from | | | Year | | Year | | FY 2024 Increase/ | ||||||||||
| | 2024 | | 2025 | | 2025 | | 2025 | | 2025 | | 3Q25 | | 4Q24 | | | 2024 | | 2025 | | (Decrease) | ||||||||
Total Citigroup Revenues, Net Interest Income (NII) and Non-Interest Revenues (NIR) | | | | | | | | | | | | | | | | | | | | | | | | | | | | | |
| | | | | | | | | | | | | | | | | | | | | | | | | | | | | |
Total Citigroup Revenues - As Reported | | $ | 19,465 | | $ | 21,596 | | $ | 21,668 | | $ | 22,090 | | $ | 19,871 |
| (10%) |
| 2% | | | $ | 80,722 | | $ | 85,225 | | 6% | |
Less: | |
| | | | | | | | | | | | | | | | | | | | | | | |||||
Total Divestiture-related Impacts on Revenues(1) | |
| 4 | | | - | | | (177) | | | 2 | | | (1) | | | | | | | | 26 | | | (176) | | | |
Total Citigroup Revenues, Excluding Divestitures Impacts(*) | | $ | 19,461 | | $ | 21,596 | | $ | 21,845 | | $ | 22,088 | | $ | 19,872 |
| (10%) |
| 2% | | | $ | 80,696 | | $ | 85,401 | | 6% | |
| | | | | | | | | | | | | | | | | | | | | | | | | | | | | |
Total Citigroup Revenues - As Reported | | $ | 19,465 | | $ | 21,596 | | $ | 21,668 | | $ | 22,090 | | $ | 19,871 |
| (10%) |
| 2% | | | $ | 80,722 | | $ | 85,225 | | 6% | |
Less: | | | | | | | | | | | | | | | | | | | | | | | | | | | | | |
Notable Item - Russia HFS Accounting Treatment Loss Impact on Revenues(2) | |
| - | | | - | | | - | | | - | | | (1,173) |
|
| | | | - | | | (1,173) | | ||||
Total Citigroup Revenues, Excluding Notable Item(s) Impact(*) | | $ | 19,465 | | $ | 21,596 | | $ | 21,668 | | $ | 22,090 | | $ | 21,044 |
| (5%) |
| 8% | | | $ | 80,722 | | $ | 86,398 | | 7% | |
| | | | | | | | | | | | | | | | | | | | | | | | | | | | | |
Total Citigroup Net Interest Income (NII) - As Reported | | $ | 13,733 | | $ | 14,012 | | $ | 15,175 | | $ | 14,940 | | $ | 15,665 |
| 5% |
| 14% | | | $ | 54,095 | | $ | 59,792 | | 11% | |
Markets NII(3) | |
| 1,856 | | | 2,013 | | | 2,902 | | | 2,251 | | | 2,843 |
|
| | | | 7,005 | | | 10,009 | | | |||
Citigroup NII Ex-Markets(*) | | $ | 11,877 | | $ | 11,999 | | $ | 12,273 | | $ | 12,689 | | $ | 12,822 |
| 1% |
| 8% | | | $ | 47,090 | | $ | 49,783 | | 6% | |
| | | | | | | | | | | | | | | | | | | | | | | | | | | | | |
Total Citigroup Non-Interest Revenue (NIR) - As Reported | | $ | 5,732 | | $ | 7,584 | | $ | 6,493 | | $ | 7,150 | | $ | 4,206 |
| (41%) |
| (27%) | | | $ | 26,627 | | $ | 25,433 | | (4%) | |
Markets NIR(3) | | | 2,720 | | | 3,973 | | | 2,977 | | | 3,312 | | | 1,699 | | | | | | | | 12,831 | | | 11,961 | | | |
Citigroup NIR Ex-Markets(*) | | $ | 3,012 | | $ | 3,611 | | $ | 3,516 | | $ | 3,838 | | $ | 2,507 |
| (35%) |
| (17%) | | | $ | 13,796 | | $ | 13,472 | | (2%) | |
Less: | | | | | | | | | | | | | | | | | | | | | | | | | | | | | |
Notable Item - Russia HFS Accounting Treatment Loss Impact on Revenues(4) | | - | | - | | - | | - | | (1,192) |
|
| | | - | | (1,192) | | | ||||||||||
Citigroup NIR Ex-Markets, Excluding Notable Item(s) Impact(*) | | $ | 3,012 | | $ | 3,611 | | $ | 3,516 | | $ | 3,838 | | $ | 3,699 |
| (4%) |
| 23% | | | $ | 13,796 | | $ | 14,664 | | 6% | |
| | | | | | | | | | | | | | | | | | | | | | | | | | | | | |
Total Citigroup Operating Expenses | | | | | | | | | | | | | | | | | | | | | | | | | | | | | |
| | | | | | | | | | | | | | | | | | | | | | | | | | | | | |
Total Citigroup Operating Expenses - As Reported | | $ | 13,070 | | $ | 13,425 | | $ | 13,577 | | $ | 14,290 | | $ | 13,840 |
| (3%) |
| 6% | | | $ | 53,567 | | $ | 55,132 | | 3% | |
Less: | |
| | | | | | | | | | | | | | | | | | | | | | | |||||
Notable Item - Mexico Goodwill Impairment Charge Impact on Operating Expenses(5) | |
| - | | | - | | | - | | | 726 | | | - | | | | | | | | - | | | 726 | | | |
Total Citigroup Operating Expenses, Excluding Notable Item(s)(*) | | $ | 13,070 | | $ | 13,425 | | $ | 13,577 | | $ | 13,564 | | $ | 13,840 | | 2% | | 6% | | | $ | 53,567 | | $ | 54,406 | | 2% | |
| | | | | | | | | | | | | | | | | | | | | | | | | | | | | |
Total Citigroup Revenues - As Reported | |
| 19,465 | | | 21,596 | | | 21,668 | | | 22,090 | | | 19,871 |
| (10%) |
| 2% | | | | 80,722 | | | 85,225 | | 6% | |
Total Citigroup Operating Expenses - As Reported | | $ | 13,070 | | $ | 13,425 | | $ | 13,577 | | $ | 14,290 | | $ | 13,840 |
| (3%) |
| 6% | | | $ | 53,567 | | $ | 55,132 | | 3% | |
Total Citigroup Efficiency Ratio - As Reported | |
| 67.1% | | | 62.2% |
| | 62.7% | | | 64.7% |
| | 69.6% | 490 bps |
| 250 bps | | | | 66.4% | | | 64.7% | | (170) bps | ||
Less: | | | | | | | | | | | | | | | | | | | | | | | | | | | | | |
Notable Item(s) Impact(s) on Revenues(2) | |
| - | | | - | | | - | | | - | | | (1,173) |
|
| | | | - | | | (1,173) | | ||||
Total Citigroup Revenues, Excluding Notable Item(s)(*) | | $ | 19,465 | | $ | 21,596 | | $ | 21,668 | | $ | 22,090 | | $ | 21,044 |
| (5%) |
| 8% | | | $ | 80,722 | | $ | 86,398 | | 7% | |
Less: | | | | | | | | | | | | | | | | | | | | | | | | | | | | | |
Notable Item(s) Impact(s) on Operating Expenses(5) | | - | | - | | - | | 726 | | - |
|
| | | - | | 726 | | | ||||||||||
Total Citigroup Operating Expenses, Excluding Notable Item(s)(*) | | $ | 13,070 | | $ | 13,425 | | $ | 13,577 | | $ | 13,564 | | $ | 13,840 | | 2% | | 6% | | | $ | 53,567 | | $ | 54,406 | | 2% | |
Total Citigroup Efficiency Ratio, Excluding Notable Item(s)(*) | | 67.1% | | 62.2% | | 62.7% | | 61.4% | | 65.8% | 440 bps |
| (130) bps | | | 66.4% | | 63.0% | | (340) bps | |||||||||
| | | | | | | | | | | | | | | | | | | | | | | | | | | | | |
* | Represents a non-GAAP financial measure. |
(1) | See footnote 2 on page 14 for details. |
(2) | See footnote 5 on page 12 for details. |
(3) | See page 6 for details. |
(4) | See footnote 5 on page 12 for details. The amount on this line adds the $19 million impact for Markets because it is already deducted in the Citigroup Ex-Markets NIR number above. |
(5) | See footnote 5 on page 14 for details. |
Page 25
Reconciliation of Adjusted Results (Page 2)
(In millions of dollars, except per share amounts and as otherwise noted)
| | | | | | | | | | | | | | | | | 4Q25 Increase/ | | | Full | | Full | | FY 2025 vs. | | ||||
| | 4Q | | 1Q | | 2Q | | 3Q | | 4Q | | (Decrease) from | | | Year | | Year | | FY 2024 Increase/ | ||||||||||
| | 2024 | | 2025 | | 2025 | | 2025 | | 2025 | | 3Q25 | | 4Q24 | | | 2024 | | 2025 | | (Decrease) | ||||||||
Total Citigroup Operating Expenses | | | | | | | | | | | | | | | | | | | | | | | | | | | | | |
| | | | | | | | | | | | | | | | | | | | | | | | | | | | | |
Total Citigroup Other Operating Expenses(1) - As Reported | | $ | 2,778 | | $ | 2,483 | | $ | 2,472 | | $ | 3,386 | | $ | 3,168 |
| (6%) |
| 14% | | | $ | 11,293 | | $ | 11,509 | | 2% | |
Less: | |
| | | | | | | | | | | | | | | | | | | | | | | |||||
Notable Item - Mexico Goodwill Impairment Charge Impact on Other Operating Expenses(2) | |
| - | | | - | | | - | | | 726 | | | - | | | | | | | | - | | | 726 | | ||
Total Citigroup Other Operating Expenses, Excluding Notable Item(s)(*) | | $ | 2,778 | | $ | 2,483 | | $ | 2,472 | | $ | 2,660 | | $ | 3,168 |
| 19% |
| 14% | | | $ | 11,293 | | $ | 10,783 | | (5%) | |
| | | | | | | | | | | | | | | | | | | | | | | | | | | | | |
Notable Items Adjustments | | | | | | | | | | | | | | | | | | | | | | | | | | | | | |
| | | | | | | | | | | | | | | | | | | | | | | | | | | | | |
Total Citigroup Net Income - As Reported | | $ | 2,856 | | $ | 4,064 | | $ | 4,019 | | $ | 3,752 | | $ | 2,471 |
| (34%) |
| (13%) | | | $ | 12,682 | | $ | 14,306 | | 13% | |
Less Notable Items: | | | | | | | | | | | | | | | | | | | | | | | | | | | | | |
Russia HFS Accounting Treatment Loss Impact on Net Income(3) | |
| - | | | - | | | - | | | - | | | (1,123) |
|
| | | | - | | | (1,123) | | ||||
Mexico Goodwill Impairment Charge Impact on Net Income(2) | | | - | | | - | | | - | | | (714) | | | - | | | | | | | | - | | | (714) | | | |
Total Citigroup Net Income, Excluding Notable Items(*) | | $ | 2,856 | | $ | 4,064 | | $ | 4,019 | | $ | 4,466 | | $ | 3,594 |
| (20%) |
| 26% | | | $ | 12,682 | | $ | 16,143 | | 27% | |
| | | | | | | | | | | | | | | | | | | | | | | | | | | | | |
Total Citigroup Diluted EPS - As Reported | | $ | 1.34 | | $ | 1.96 | | $ | 1.96 | | $ | 1.86 | | $ | 1.19 |
| (36%) |
| (11%) | | | $ | 5.94 | | $ | 6.99 | | 18% | |
Less: | | | | | | | | | | | | | | | | | | | | | | | | | | | | | |
Notable Item(s)(2)(3) | |
| - | | | - | | | - | | | (0.38) | | | (0.62) |
|
| | | | - | | | (0.98) | | | |||
Total Citigroup Diluted EPS, Excluding Notable Items(*) | | $ | 1.34 | | $ | 1.96 | | $ | 1.96 | | $ | 2.24 | | $ | 1.81 |
| (19%) |
| 35% | | | $ | 5.94 | | $ | 7.97 | | 34% | |
| | | | | | | | | | | | | | | | | | | | | | | | | | | | | |
Total Citigroup Diluted EPS - As Reported | | $ | 1.34 | | $ | 1.96 | | $ | 1.96 | | $ | 1.86 | | $ | 1.19 |
| (36%) |
| (11%) | | | $ | 5.94 | | $ | 6.99 | | 18% | |
Less: | | | | | | | | | | | | | | | | | | | | | | | | | | | | | |
Notable Item - Russia HFS Accounting Treatment Loss Impact on Net Income(3) | | - | | - | | - | | - | | (0.62) |
|
| | | - | | (0.60) | | | ||||||||||
Total Citigroup Diluted EPS, Excluding Notable Items(*) | | $ | 1.34 | | $ | 1.96 | | $ | 1.96 | | $ | 1.86 | | $ | 1.81 |
| (3%) |
| 35% | | | $ | 5.94 | | $ | 7.59 | | 28% | |
| | | | | | | | | | | | | | | | | | | | | | | | | | | | | |
Total Citigroup RoCE - As Reported | | 5.4% | | 8.0% | | 7.7% | | 7.1% | | 4.5% | (260) bps |
| (90) bps | | | | 6.1% | | | 6.8% | | 70 bps | |||||||
Less: | | | | | | | | | | | | | | | | | | | | | | | | | | | | | |
Notable Item(s)(2)(3) | |
| 0 bps | | | 0 bps | | | 0 bps | | | (140) bps | | | (230) bps |
| | | | 0 bps | | | (90) bps | | | ||||
Total Citigroup RoCE, Excluding Notable Items(*) | | 5.4% | | 8.0% | | 7.7% | | 8.5% | | 6.8% | (170) bps |
| 140 bps | | | 6.1% | | 7.7% | | 160 bps | |||||||||
| | | | | | | | | | | | | | | | | | | | | | | | | | | | | |
Total Citigroup RoTCE - As Reported | | 6.1% | | 9.1% | | 8.7% | | 8.0% | | 5.1% | (290) bps |
| (100) bps | | | 7.0% | | 7.7% | | 70 bps | |||||||||
Less: | | | | | | | | | | | | | | | | | | | | | | | | | | | | | |
Notable Item(s)(2)(3) | | 0 bps | | 0 bps | | 0 bps | | (170) bps | | (260) bps |
| | | 0 bps | | (110) bps | | | |||||||||||
Total Citigroup RoTCE, Excluding Notable Items(*) | | 6.1% | | 9.1% | | 8.7% | | 9.7% | | 7.7% | (200) bps |
| 160 bps | | | 7.0% | | 8.8% | | 180 bps | |||||||||
| | | | | | | | | | | | | | | | | | | | | | | | | | | | | |
All Other (Managed Basis)(4)(*) | | | | | | | | | | | | | | | | | | | | | | | | | | | | | |
| | | | | | | | | | | | | | | | | | | | | | | | | | | | | |
All Other Revenues - Managed Basis(*) | | $ | 1,335 | | $ | 1,445 | | $ | 1,698 | | $ | 1,535 | | $ | (248) |
| NM |
| NM | | | $ | 7,503 | | $ | 4,430 | | (41%) | |
Add: | |
| | | | | | | | | | | | | | | | | | | | | | | |||||
Total Divestiture-related Impacts on Revenues(5) | |
| 4 | | | - | | | (177) | | | 2 | | | (1) | | | | | | | | 26 | | | (176) | | | |
All Other Revenues - U.S. GAAP | | $ | 1,339 | | $ | 1,445 | | $ | 1,521 | | $ | 1,537 | | $ | (249) | | NM | | NM | | | $ | 7,529 | | $ | 4,254 | | (43%) | |
| | | | | | | | | | | | | | | | | | | | | | | | | | | | | |
All Other Operating Expenses - Managed Basis(*) | | $ | 2,162 | | $ | 2,224 | | $ | 2,276 | | $ | 2,168 | | $ | 2,025 |
| (7%) |
| (6%) | | | $ | 9,030 | | $ | 8,693 | | (4%) | |
Add: | | | | | | | | | | | | | | | | | | | | | | | | | | | | | |
Total Divestiture-related Impacts on Operating Expenses(6) | | 56 | | 34 | | 37 | | 766 | | 40 |
|
| | | | 318 | | | 877 | | |||||||||
All Other Operating Expenses - U.S. GAAP | | $ | 2,218 | | $ | 2,258 | | $ | 2,313 | | $ | 2,934 | | $ | 2,065 | (30%) |
| (7%) | | | $ | 9,348 | | $ | 9,570 | | 2% | ||
| | | | | | | | | | | | | | | | | | | | | | | | | | | | | |
All Other Provisions For Credit Losses - Managed Basis(*) | | $ | 397 | | $ | 359 | | $ | 374 | | $ | 331 | | $ | 449 | | 36% | | 13% | | | $ | 1,115 | | $ | 1,513 | | 36% | |
Add: | | | | | | | | | | | | | | | | | | | | | | | | | | | | | |
Total Divestiture-related Impacts on Provisions For Credit Losses | |
| - | | | (11) | | | 5 | | | (3) | | | (1) |
|
| | | | 7 | | | (10) | | ||||
All Other Provisions For Credit Losses - U.S. GAAP | | $ | 397 | | $ | 348 | | $ | 379 | | $ | 328 | | $ | 448 |
| 37% |
| 13% | | | $ | 1,122 | | $ | 1,503 | | 34% | |
| | | | | | | | | | | | | | | | | | | | | | | | | | | | | |
All Other EBIT - Managed Basis(*) | | $ | (1,224) | | $ | (1,138) | | $ | (952) | | $ | (964) | | $ | (2,722) | | (182%) | | (122%) | | | $ | (2,642) | | $ | (5,776) | | (119%) | |
Add: | | | | | | | | | | | | | | | | | | | | | | | | | | | | | |
Total Divestiture-related Impacts on Revenue(5) | | | 4 | | | - | | | (177) | | | 2 | | | (1) | | | | | | | | 26 | | | (176) | | | |
Total Divestiture-related Impacts on Operating Expenses(6) | | (56) | | (34) | | (37) | | (766) | | (40) |
|
| | | (318) | | (877) | | | ||||||||||
Total Divestiture-related Impacts on Provisions For Credit Losses | | | - | | | 11 | | | (5) | | | 3 | | | 1 | | | | | | | | (7) | | | 10 | | | |
All Other EBIT - U.S. GAAP | | $ | (1,276) | | $ | (1,161) | | $ | (1,171) | | $ | (1,725) | | $ | (2,762) | (60%) |
| (116%) | | | $ | (2,941) | | $ | (6,819) | | (132%) | ||
| | | | | | | | | | | | | | | | | | | | | | | | | | | | | |
* | Represents a non-GAAP financial measure. |
(1) | Other operating expenses include the following expense line items: Premises and equipment, Professional services, Advertising and marketing, and Other operating expenses. |
(2) | See footnote 5 on page 14 for details. |
(3) | See footnote 5 on page 12 for details. |
(4) | Reflects results on a managed basis, which excludes divestiture-related impacts related to Citi’s divestitures of its Asia consumer banking businesses and the planned divestiture of Mexico Consumer/SBMM within Legacy Franchises. See page 14 for additional information. |
(5) | See footnote 2 on page 14 for details. |
(6) | See footnotes 3, 4, 5 and 6 on page 14 for details. |
Page 26
Reconciliation of Adjusted Results (Page 3)
(In millions of dollars, except as otherwise noted)
| | | | | | | | | | | | | | | | | 4Q25 Increase/ | | | Full | | Full | | FY 2025 vs. | ||||
| | 4Q | | 1Q | | 2Q | | 3Q | | 4Q | | (Decrease) from | | | Year | | Year | | FY 2024 Increase/ | |||||||||
| | 2024 | | 2025 | | 2025 | | 2025 | | 2025 | | 3Q25 | | 4Q24 | | | 2024 | | 2025 | | (Decrease) | |||||||
| | | | | | | | | | | | | | | | | | | | | | | | | | | | |
All Other (Managed Basis)(1)(*) | | | | | | | | | | | | | | | | | | | | | | | | | | | | |
| | | | | | | | | | | | | | | | | | | | | | | | | | | | |
All Other Net Income (Loss) - Managed Basis | | $ | (1,070) | | $ | (870) | | $ | (567) | | $ | (705) | | $ | (2,316) |
| (229%) | | (116%) | | | $ | (2,432) | | $ | (4,458) | | (83%) |
Add: | | | | | | | | | | | | | | | | | | | | | | | | | | | | |
Total Divestiture-related Impacts on Revenue(2) | |
| 4 | |
| - | |
| (177) | |
| 2 | |
| (1) |
| | | | | |
| 26 | |
| (176) | | |
Total Divestiture-related Impacts on Operating Expenses(3) | |
| (56) | |
| (34) | |
| (37) | |
| (766) | |
| (40) |
| | | | | |
| (318) | |
| (877) | | |
Total Divestiture-related Impacts on Provisions For Credit Losses | |
| - | |
| 11 | |
| (5) | |
| 3 | |
| 1 |
| | | | | |
| (7) | |
| 10 | | |
Total Divestiture-related Impacts on Income Taxes | |
| 16 | |
| 8 | |
| 39 | |
| (16) | |
| (70) |
| | | | | |
| 92 | |
| (39) | | |
All Other Net Income (Loss) - U.S. GAAP | | $ | (1,106) | | $ | (885) | | $ | (747) | | $ | (1,482) | | $ | (2,426) |
| (64%) | | (119%) | | | $ | (2,639) | | $ | (5,540) | | (110%) |
| |
| | |
| | |
| | |
| | |
| |
| | | | | |
| | |
| | | |
Legacy Franchises (LF) (Managed Basis)(1)(*) | |
| | |
| | |
| | |
| | |
| |
| | | | | |
| | |
| | | |
| |
| | |
| | |
| | |
| | |
| |
| | | | | |
| | |
| | | |
Legacy Franchises Revenues (Managed Basis) - As Reported | | $ | 1,563 | | $ | 1,621 | | $ | 1,691 | | $ | 1,871 | | $ | 329 |
| (82%) | | (79%) | | | $ | 6,835 | | $ | 5,512 | | (19%) |
Less: | |
| | |
| | |
| | |
| | |
| |
| | | | | |
| | |
| | | |
Notable Item - Portion of Russia Loss on Sale Impact on LF Revenues(4) | |
| - | |
| - | |
| - | |
| - | |
| (1,556) |
| | | | | |
| - | |
| (1,556) | | |
LF Revenues, Excluding Notable Item(s) Impact(*) | | $ | 1,563 | | $ | 1,621 | | $ | 1,691 | | $ | 1,871 | | $ | 1,885 |
| 1% | | 21% | | | $ | 6,835 | | $ | 7,068 | | 3% |
| | | | | | | | | | |
| | | | | | | | | | | |||||||
LF Revenues - Managed Basis(*) | | $ | 1,563 | | $ | 1,621 | | $ | 1,691 | | $ | 1,871 | | $ | 329 |
| (82%) | | (79%) | | | $ | 6,835 | | $ | 5,512 | | (19%) |
Add: | |
| | |
| | |
| | |
| | |
| |
| | | | | |
| | |
| | | |
Total Divestiture-related Impacts on Revenues(2) | |
| 4 | |
| - | |
| (177) | |
| 2 | |
| (1) | | | | | | |
| 26 | |
| (176) | | |
LF Revenues - U.S. GAAP | | $ | 1,567 | | $ | 1,621 | | $ | 1,514 | | $ | 1,873 | | $ | 328 | | (82%) | | (79%) | | | $ | 6,861 | | $ | 5,336 | | (22%) |
| | | | | | | | | | | | | | | | | | | | | | | | | | | | |
LF Operating Expenses - Managed Basis(*) | | $ | 1,381 | | $ | 1,334 | | $ | 1,287 | | $ | 1,320 | | $ | 1,222 | | (7%) | | (12%) | | | $ | 6,011 | | $ | 5,163 | | (14%) |
Add: | |
| | | | | | | | | | | | | | | | | | | | | | | | | | |
Total Divestiture-related Impacts on Operating Expenses(3) | | | 56 | | | 34 | | | 37 | | | 766 | | | 40 | | | | | | | | 318 | | | 877 | | |
LF Operating Expenses - U.S. GAAP | | $ | 1,437 | | $ | 1,368 | | $ | 1,324 | | $ | 2,086 | | $ | 1,262 | | (40%) | | (12%) | | | $ | 6,329 | | $ | 6,040 | | (5%) |
| | | | | | | | | | | | | | | | | | | | | | | | | | | | |
LF Provisions For Credit Losses - Managed Basis(*) | | $ | 393 | | $ | 358 | | $ | 371 | | $ | 327 | | $ | 447 |
| 37% | | 14% | | | $ | 1,110 | | $ | 1,503 | | 35% |
Add: | | | | | | | | | | | |
| | | | | | | | | | | ||||||
Total Divestiture-related Impacts on Provisions For Credit Losses | | | - | |
| (11) | |
| 5 | |
| (3) | |
| (1) |
| | | | | |
| 7 | |
| (10) | | |
LF Provisions For Credit Losses - U.S. GAAP | | $ | 393 | | $ | 347 | | $ | 376 | | $ | 324 | | $ | 446 |
| 38% | | 13% | | | $ | 1,117 | | $ | 1,493 | | 34% |
| | | | | | | | | | | | | | | | | | | | | | | | | | | | |
LF EBIT - Managed Basis(*) | | $ | (211) | | $ | (71) | | $ | 33 | | $ | 224 | | $ | (1,340) |
| NM | | NM | | | $ | (286) | | $ | (1,154) | | (303%) |
| | | | | | | | | | | | | | | | | | | | | | | | | | | | |
Add: | | | | | | | | | | | |
| | | | | | | | | | | | | ||||
Total Divestiture-related Impacts on Revenue(2) | |
| 4 | |
| - | |
| (177) | |
| 2 | |
| (1) |
| | | | | |
| 26 | |
| (176) | | |
Total Divestiture-related Impacts on Operating Expenses(3) | |
| (56) | |
| (34) | |
| (37) | |
| (766) | |
| (40) |
| | | | | |
| (318) | |
| (877) | | |
Total Divestiture-related Impacts on Provisions For Credit Losses | |
| - | |
| 11 | |
| (5) | |
| 3 | |
| 1 | | | | | | |
| (7) | |
| 10 | | |
LF EBIT - U.S. GAAP | | $ | (263) | | $ | (94) | | $ | (186) | | $ | (537) | | $ | (1,380) | | (157%) | | (425%) | | | $ | (585) | | $ | (2,197) | | (276%) |
| | | | | | | | | | | | | | | | | | | | | | | | | | | | |
LF Net Income (Loss) - Managed Basis(*) | | $ | (161) | | $ | (60) | | $ | 60 | | $ | 155 | | $ | (1,496) |
| NM | | NM | | | $ | (249) | | $ | (1,341) | | (439%) |
Add: | | | | | | | | | | |
| | | | | | | | | | | | | |||||
Total Divestiture-related Impacts on Revenue(2) | |
| 4 | |
| - | |
| (177) | |
| 2 | |
| (1) |
| | | | | |
| 26 | |
| (176) | | |
Total Divestiture-related Impacts on Operating Expenses(3) | |
| (56) | |
| (34) | |
| (37) | |
| (766) | |
| (40) |
| | | | | |
| (318) | |
| (877) | | |
Total Divestiture-related Impacts on Provisions For Credit Losses | | | - | | | 11 | | | (5) | | | 3 | | | 1 | | | | | | | | (7) | | | 10 | | |
Total Divestiture-related Impacts on Income Taxes | |
| 16 | |
| 8 | |
| 39 | |
| (16) | |
| (70) |
| | | | | |
| 92 | |
| (39) | | |
LF Net Income (Loss) - U.S. GAAP | | $ | (197) | | $ | (75) | | $ | (120) | | $ | (622) | | $ | (1,606) |
| (158%) | | NM | | | $ | (456) | | $ | (2,423) | | (431%) |
| | | | | | | | | | | | | | | | | | | | | | | | | | | | |
* | Represents a non-GAAP financial measure. |
(1) | Reflects results on a managed basis, which excludes divestiture-related impacts related to Citi’s divestitures of its Asia consumer banking businesses and the planned divestiture of Mexico Consumer/SBMM within Legacy Franchises. See page 14 for additional information. |
(2) | See footnote 2 on page 14 for details. |
(3) | See footnotes 3, 4, 5 and 6 on page 14 for details. |
(4) | See footnote 5 on page 12 for details. |
Page 27
Reconciliation of Adjusted Results (Page 4)
(In millions of dollars, except as otherwise noted)
| | | | | | | | | | | | | | | | | 4Q25 Increase/ | | | Full | | Full | | FY 2025 vs. | ||||
| | 4Q | | 1Q | | 2Q | | 3Q | | 4Q | | (Decrease) from | | | Year | | Year | | FY 2024 Increase/ | |||||||||
| | 2024 | | 2025 | | 2025 | | 2025 | | 2025 | | 3Q25 | | 4Q24 | | | 2024 | | 2025 | | (Decrease) | |||||||
| | | | | | | | | | | | | | | | | | | | | | | | | | | | |
Services | | | | | | | | | | | | | | | | | | | | | | | | | | | | |
| | | | | | | | | | | | | | | | | | | | | | | | | | | | |
Services Revenues - As Reported | | $ | 5,165 | | $ | 4,889 | | $ | 5,062 | | $ | 5,363 | | $ | 5,942 |
| 11% | | 15% | | | $ | 19,618 | | $ | 21,256 | | 8% |
Less: | | | | | | | | | | | | | | | | | | | | | | | | | | | | |
Notable Item - Portion of Russia HFS Impact on Sale Impact on Services Revenues(1) | |
| - | |
| - | |
| - | |
| - | |
| 356 |
| | | | | | | - | | | 356 | | |
Services Revenues, Excluding Notable Item(s) Impact(*) | | $ | 5,165 | | $ | 4,889 | | $ | 5,062 | | $ | 5,363 | | $ | 5,586 |
| 4% | | 8% | | | $ | 19,618 | | $ | 20,900 | | 7% |
| |
| | |
| | |
| | |
| | |
| | | | | | | | | | | | | | |
Services Non-Interest Revenue (NIR) - As Reported | | $ | 1,719 | | $ | 1,391 | | $ | 1,432 | | $ | 1,540 | | $ | 1,892 |
| 23% | | 10% | | | $ | 6,195 | | $ | 6,255 | | 1% |
Less: | |
| | | | | | | | | | | | | | | | | | | | | | | | | | |
Notable Item - Portion of Russia HFS Impact on Sale Impact on Services Revenues(1) | |
| - | |
| - | |
| - | |
| - | |
| 356 |
| | | | | - | | | 356 | | |||
Services NIR, Excluding Notable Item(s) Impact(*) | | $ | 1,719 | | $ | 1,391 | | $ | 1,432 | | $ | 1,540 | | $ | 1,536 |
| - | | (11%) | | | $ | 6,195 | | $ | 5,899 | | (5%) |
| | | | | | | | | | | | | | | | | | | | | | | | | ||||
Banking Corporate Lending Revenues | |
| | |
| | |
| | |
| | |
| | | | | | | | | | | | | | |
| |
| | |
| | |
| | |
| | |
| | | | | | | | | | | | | | |
Banking - Corporate Lending Revenues - As Reported | | $ | 316 | | $ | 917 | | $ | 940 | | $ | 986 | | $ | 938 |
| (5%) | | 197% | | | $ | 2,564 | | $ | 3,781 | | 47% |
Gain (loss) on loan hedges(2) | | | (6) | | | 14 | | | (62) | | | (44) | | | (26) | | | | | | | | (180) | | | (118) | | |
Banking - Corp Lending Revenues - Excluding Gain (loss) on loan hedges(*) | | $ | 322 | | $ | 903 | | $ | 1,002 | | $ | 1,030 | | $ | 964 | | (6%) | | 199% | | | $ | 2,744 | | $ | 3,899 | | 42% |
| | | | | | | | | | | | | | | | | | | | | | | | | | | | |
* | Represents a non-GAAP financial measure. |
(1) | See footnote 5 on page 12 for details. |
(2) | See page 7 for details. |
Page 28
Reconciliation of Adjusted Results (Page 5)
(In millions of dollars, or as otherwise noted)
| | Full | | Full | | Full | | Full | | Full | | FY 2025 vs. | | 2021 to | |||||
| | Year | | Year | | Year | | Year | | Year | | FY 2024 Increase/ | | 2025 | |||||
| | 2021 | | 2022 | | 2023 | | 2024 | | 2025 | | (Decrease) | | CAGR(1) | |||||
| | | | | | | | | | | | | | | |||||
Total Citigroup Revenues | | | | | | | | | | | | | | | | | | | |
| | | | | | | | | | | | | | | | | | | |
Total Citigroup Revenues - As Reported | | $ | 71,574 | | $ | 74,982 | | $ | 78,066 | | $ | 80,722 | | $ | 85,225 | | 6% | | 4% |
Less: | | | | | | | | | | | | | | | | | | | |
Total Divestiture-related Impacts on Revenues(2) | | | (670) | | | 854 | | | 1,346 | | | 26 | | | (176) | | | | |
Notable Item - Russia HFS Accounting Treatment Loss Impact on Revenues(3) | | | - | | | - | | | - | | | - | | | (1,173) | | | | |
Total Citigroup Revenues, Excluding Divestitures Impacts and Russia Loss(*) | | $ | 72,244 | | $ | 74,128 | | $ | 76,720 | | $ | 80,696 | | $ | 86,574 | | 7% | | 5% |
| | | | | | | | | | | | | | | | | | | |
| | | | | | | | | | | | | | | | | | | |
Total Citigroup Operating Expenses | | | | | | | | | | | | | | | | | | | |
| | | | | | | | | | | | | | | | | | | |
Total Citigroup Operating Expenses - As Reported | | $ | 47,883 | | $ | 50,936 | | $ | 55,970 | | $ | 53,567 | | $ | 55,132 | | 3% | | |
Less: | | | | | | | | | | | | | | | | | | | |
Total Divestiture-related Impacts on Expenses(4) | | | 1,171 | | | 696 | | | 372 | | | 318 | | | 877 | | | | |
FDIC Special Assessment(5) | | | - | | | - | | | 1,706 | | | 203 | | | (238) | | | | |
Total Citigroup Operating Expenses, Excluding Divestitures Impacts and FDIC Special Assessment(5)(*) | | $ | 46,712 | | $ | 50,240 | | $ | 53,892 | | $ | 53,046 | | $ | 54,493 | | 3% | | |
| | | | | | | | | | | | | | | | | | | |
| | | | | | | | | | | | | | | | | | | |
Total Citigroup Operating Expenses - As Reported | | $ | 47,883 | | $ | 50,936 | | $ | 55,970 | | $ | 53,567 | | $ | 55,132 | | 3% | | |
Less: | | | | | | | | | | | | | | | | | | | |
Goodwill Impairment(6) | | | - | | | 535 | | | - | | | - | | | 726 | | | | |
Total Citigroup Operating Expenses, Excluding Goodwill Impairment(*) | | $ | 47,883 | | $ | 50,401 | | $ | 55,970 | | $ | 53,567 | | $ | 54,406 | | 2% | | |
| | | | | | | | | | | | | | | | | | | |
| | | | | | | | | | | | | | | | | | | |
Total Citigroup RoCE and RoTCE | | | | | | | | | | | | | | | | | | | |
| | | | | | | | | | | | | | | | | | | |
Total Citigroup RoCE - As Reported | | | 11.5% | | | 7.7% | | | 4.3% | | | 6.1% | | | 6.8% | | 70 bps | | |
Less: | | | | | | | | | | | | | | | | | | | |
Notable Item - Russia HFS Accounting Treatment Loss Impact on Net Income(3) | | | 0 bps | | | 0 bps | | | 0 bps | | | 0 bps | | | (60) bps | | | | |
Total Citigroup RoCE, Excluding Notable Item(*) | | | 11.5% | | | 7.7% | | | 4.3% | | | 6.1% | | | 7.4% | | 130 bps | | |
| | | | | | | | | | | | | | | | | | | |
| | | | | | | | | | | | | | | | | | | |
Total Citigroup RoTCE - As Reported | | | 13.4% | | | 8.9% | | | 4.9% | | | 7.0% | | | 7.7% | | 70 bps | | |
Less: | | | | | | | | | | | | | | | | | | | |
Notable Item - Russia HFS Accounting Treatment Loss Impact on Net Income(3) | | | 0 bps | | | 0 bps | | | 0 bps | | | 0 bps | | | (70) bps | | | | |
Total Citigroup RoTCE, Excluding Notable Item(*) | | | 13.4% | | | 8.9% | | | 4.9% | | | 7.0% | | | 8.4% | | 140 bps | | |
| | | | | | | | | | | | | | | | | | | |
* | Represents a non-GAAP financial measure. |
| (1) | Compound annual growth rate (CAGR) |
| (2) | See footnote 2 on page 14, Citi’s 2024 Annual Report on Form 10-K, and Citi’s 2023 Annual Report on Form 10-K for details. |
| (3) | See footnote 5 on page 12 for details. |
| (4) | See footnotes 3, 4, 5 and 6 on page 14, Citi’s 2024 Annual Report on Form 10-K, and Citi’s 2023 Annual Report on Form 10-K for details. |
| (5) | Federal Deposit Insurance Corporation (FDIC) Special Assessment. See Citi’s 2024 Annual Report on Form 10-K, and Citi’s 2023 Annual Report on Form 10-K for details. |
| (6) | See footnote 5 on page 14 and Citi’s 2024 Annual Report on Form 10-K for details. |
Page 29
Reconciliation of Adjusted Results (Page 6)
(In millions of dollars, except as otherwise noted)
| | | | | | | | | | | | | | | | | | | | | | | | | | Full | | Full | | Full |
| ||||||||||||||||
| 1Q | | 2Q | | 3Q | | 4Q | | 1Q | | 2Q | | 3Q | | 4Q | | 1Q | | 2Q | | 3Q | | 4Q | | | Year | | Year | | Year | | ||||||||||||||||
| 2023 | | 2023 | | 2023 | | 2023 | | 2024 | | 2024 | | 2024 | | 2024 | | 2025 | | 2025 | | 2025 | | 2025 | | | 2023 | | 2024 | | 2025 | | ||||||||||||||||
| | | | | | | | | | | | | | | | | | | | | | | | | | | | | | | | ||||||||||||||||
| | | | | | | | | | | | | | | | | | | | | | | | | | | | | | | | ||||||||||||||||
Legacy Franchises (LF) Exits Contribution | | | | | | | | | | | | | | | | | | | | | | | | | | | | | | | | | | | | | | | | | | | | | | | |
| | | | | | | | | | | | | | | | | | | | | | | | | | | | | | | | ||||||||||||||||
Revenues | | | | | | | | | | | | | | | | | | | | | | | | | | | | | | | | | |||||||||||||||
| | | | | | | | | | | | | | | | | | | | | | | | | | | | | | | | ||||||||||||||||
| | | | | | | | | | | | | | | | | | | | | | | | | | | | | | | | ||||||||||||||||
Closed or Signed Markets Revenues Ex-divestitures | | $ | 374 | | $ | 368 | | $ | 205 | | $ | 184 | | $ | 183 | | $ | 164 | | $ | 138 | | $ | 106 | | $ | 104 | | $ | 105 | | $ | 112 | | $ | 90 | | | $ | 1,131 | | $ | 591 | | $ | 411 | |
Add: | | | | | | | | | | | | | | | | | | | | | | | | | | | | | | | | | |||||||||||||||
Divestiture Related Impacts on Closed or Signed Markets Revenues | | | 1,067 | | | (16) | | | 397 | | | (5) | | | - | | | 2 | | | - | | | 4 | | | - | | | (177) | | | 2 | | | (1) | | | | 1,443 | | | 6 | | | (176) | |
Closed or Signed Markets Revenues - U.S. GAAP | | $ | 1,441 | | $ | 352 | | $ | 602 | | $ | 179 | | $ | 183 | | $ | 166 | | $ | 138 | | $ | 110 | | $ | 104 | | $ | (72) | | $ | 114 | | $ | 89 | | | $ | 2,574 | | $ | 597 | | $ | 235 | |
| | | | | | | | | | | | | | | | | | | | | | | | | | | | | | | | ||||||||||||||||
| | | | | | | | | | | | | | | | | | | | | | | | | | | | | | | | ||||||||||||||||
Mexico Consumer/SBMM Revenues Ex-divestitures | | $ | 1,289 | | $ | 1,406 | | $ | 1,519 | | $ | 1,454 | | $ | 1,563 | | $ | 1,633 | | $ | 1,523 | | $ | 1,422 | | $ | 1,467 | | $ | 1,536 | | $ | 1,722 | | $ | 1,775 | | | $ | 5,668 | | $ | 6,141 | | $ | 6,500 | |
Add: | | | | | | | | | | | | | | | | | | | | | | | | | | | | | | | | | |||||||||||||||
Divestiture Related Impacts on Mexico/SBMM | | | - | | | - | | | - | | | - | | | - | | | - | | | - | | | - | | | - | | | - | | | - | | | - | | | | - | | | - | | | - | |
Mexico Consumer/SBMM Revenues - U.S. GAAP | | $ | 1,289 | | $ | 1,406 | | $ | 1,519 | | $ | 1,454 | | $ | 1,563 | | $ | 1,633 | | $ | 1,523 | | $ | 1,422 | | $ | 1,467 | | $ | 1,536 | | $ | 1,722 | | $ | 1,775 | | | $ | 5,668 | | $ | 6,141 | | $ | 6,500 | |
| | | | | | | | | | | | | | | | | | | | | | | | | | | | | | | | ||||||||||||||||
| | | | | | | | | | | | | | | | | | | | | | | | | | | | | | | | ||||||||||||||||
Wind-Downs/Sale/Other Revenues Ex-divestitures | | $ | 160 | | $ | 140 | | $ | 107 | | $ | 76 | | $ | 73 | | $ | (78) | | $ | 73 | | $ | 35 | | $ | 50 | | $ | 50 | | $ | 37 | | $ | (1,536) | | | $ | 483 | | $ | 103 | | $ | (1,399) | |
Add: | | | | | | | | | | | | | | | | | | | | | | | | | | | | | | | | | |||||||||||||||
Divestiture Related Impacts on Wind-Downs/Sale/Other Revenues | | | (49) | | | 10 | | | (1) | | | (57) | | | (12) | | | 31 | | | 1 | | | - | | | - | | | - | | | - | | | - | | | | (97) | | | 20 | | | - | |
Wind-Downs/Sale/Other Revenues - U.S. GAAP | | $ | 111 | | $ | 150 | | $ | 106 | | $ | 19 | | $ | 61 | | $ | (47) | | $ | 74 | | $ | 35 | | $ | 50 | | $ | 50 | | $ | 37 | | $ | (1,536) | | | $ | 386 | | $ | 123 | | $ | (1,399) | |
| | | | | | | | | | | | | | | | | | | | | | | | | | | | | | | | ||||||||||||||||
| | | | | | | | | | | | | | | | | | | | | | | | | | | | | | | | ||||||||||||||||
Expenses | | | | | | | | | | | | | | | | | | | | | | | | | | | | | | | | | |||||||||||||||
| | | | | | | | | | | | | | | | | | | | | | | | | | | | | | | | ||||||||||||||||
| | | | | | | | | | | | | | | | | | | | | | | | | | | | | | | | ||||||||||||||||
Closed or Signed Markets Expenses Ex-divestitures | | $ | 462 | | $ | 425 | | $ | 387 | | $ | 314 | | $ | 216 | | $ | 223 | | $ | 193 | | $ | 134 | | $ | 127 | | $ | 135 | | $ | 125 | | $ | 80 | | | $ | 1,588 | | $ | 766 | | $ | 467 | |
Add: | | | | | | | | | | | | | | | | | | | | | | | | | | | | | | | | | |||||||||||||||
Divestiture Related Impacts on Closed or Signed Markets Expenses | | | 28 | | | 23 | | | 49 | | | 35 | | | 11 | | | 10 | | | 11 | | | 8 | | | 4 | | | 3 | | | 5 | | | 8 | | | | 135 | | | 40 | | | 20 | |
Closed or Signed Markets Expenses - U.S. GAAP | | $ | 490 | | $ | 448 | | $ | 436 | | $ | 349 | | $ | 227 | | $ | 233 | | $ | 204 | | $ | 142 | | $ | 131 | | $ | 138 | | $ | 130 | | $ | 88 | | | $ | 1,723 | | $ | 806 | | $ | 487 | |
| | | | | | | | | | | | | | | | | | | | | | | | | | | | | | | | ||||||||||||||||
| | | | | | | | | | | | | | | | | | | | | | | | | | | | | | | | ||||||||||||||||
Mexico Consumer/SBMM Expenses Ex-divestitures | | $ | 939 | | $ | 980 | | $ | 1,015 | | $ | 1,068 | | $ | 1,123 | | $ | 1,049 | | $ | 1,001 | | $ | 1,036 | | $ | 1,039 | | $ | 954 | | $ | 1,013 | | $ | 928 | | | $ | 4,002 | | $ | 4,209 | | $ | 3,934 | |
Add: | | | | | | | | | | | | | | | | | | | | | | | | | | | | | | | | | |||||||||||||||
Divestiture Related Impacts on Mexico/SBMM | | | 25 | | | 48 | | | 60 | | | 62 | | | 61 | | | 67 | | | 42 | | | 36 | | | 21 | | | 30 | | | 759 | | | 34 | | | | 195 | | | 206 | | | 844 | |
Mexico Consumer/SBMM Expenses - U.S. GAAP | | $ | 964 | | $ | 1,028 | | $ | 1,075 | | $ | 1,130 | | $ | 1,184 | | $ | 1,116 | | $ | 1,043 | | $ | 1,072 | | $ | 1,060 | | $ | 984 | | $ | 1,772 | | $ | 962 | | | $ | 4,197 | | $ | 4,415 | | $ | 4,778 | |
| | | | | | | | | | | | | | | | | | | | | | | | | | | | | | | | ||||||||||||||||
| | | | | | | | | | | | | | | | | | | | | | | | | | | | | | | | ||||||||||||||||
Wind-Downs/Sale/Other Expenses Ex-divestitures | | $ | 295 | | $ | 310 | | $ | 280 | | $ | 243 | | $ | 266 | | $ | 278 | | $ | 281 | | $ | 211 | | $ | 168 | | $ | 198 | | $ | 182 | | $ | 214 | | | $ | 1,128 | | $ | 1,036 | | $ | 762 | |
Add: | | | | | | | | | | | | | | | | | | | | | | | | | | | | | | | | | |||||||||||||||
Divestiture Related Impacts on Wind-Downs/Sale/Other Expenses | | | 20 | | | 8 | | | 5 | | | 9 | | | 38 | | | 8 | | | 14 | | | 12 | | | 9 | | | 4 | | | 2 | | | (2) | | | | 42 | | | 72 | | | 13 | |
Wind-Downs/Sale/Other Expenses - U.S. GAAP | | $ | 315 | | $ | 318 | | $ | 285 | | $ | 252 | | $ | 304 | | $ | 286 | | $ | 295 | | $ | 223 | | $ | 177 | | $ | 202 | | $ | 184 | | $ | 212 | | | $ | 1,170 | | $ | 1,108 | | $ | 775 | |
| | | | | | | | | | | | | | | | | | | | | | | | | | | | | | | | | | | | | | | | | | | | | | | |
Page 30
Exhibit 99.3 | |||
Citigroup Inc. securities registered pursuant to Section 12(b) of the Securities Exchange Act of 1934: | |||
Title of each class | Ticker | Title for iXBRL | Name of each |
Common Stock, par value $.01 per share | |||
7.625% Trust Preferred Securities of Citigroup Capital III (and registrant’s guaranty with respect thereto) | |||
7.875% Fixed Rate / Floating Rate Trust Preferred Securities (TruPS®) of Citigroup Capital XIII (and registrant’s guaranty with respect thereto) | |||
Medium-Term Senior Notes, Series N, Callable Fixed Rate Notes Due April 26, 2028 of CGMHI (and registrant’s guaranty with respect thereto) | |||
Medium-Term Senior Notes, Series N, Floating Rate Notes Due September 17, 2026 of CGMHI (and registrant’s guaranty with respect thereto) | |||
Medium-Term Senior Notes, Series N, Floating Rate Notes Due September 15, 2028 of CGMHI (and registrant’s guaranty with respect thereto) | |||
Medium-Term Senior Notes, Series N, Floating Rate Notes Due October 6, 2028 of CGMHI (and registrant’s guaranty with respect thereto) | |||
Medium-Term Senior Notes, Series N, Floating Rate Notes Due March 21, 2029 of CGMHI (and registrant’s guaranty with respect thereto) | |||