CONTACT:
Michael Archer
Senior Vice President
Corporate Controller
Camden National Corporation
(800) 860-8821
FOR IMMEDIATE RELEASE
CAMDEN NATIONAL CORPORATION REPORTS
FOURTH QUARTER AND ANNUAL EARNINGS FOR 2019
Company Reports Record Net Income of $57.2 Million and Diluted EPS of $3.69 for 2019
CAMDEN, Maine, January 28, 2020/PRNewswire/--Camden National Corporation (NASDAQ: CAC; “Camden National” or the “Company”), a $4.4 billion bank holding company headquartered in Camden, Maine, reported record net income of $57.2 million and diluted earnings per share ("EPS") of $3.69 for 2019, an increase of 8% and 9% over 2018, respectively. Strong earnings for the year resulted in a return on average assets of 1.30% and return on average equity of 12.44% for 2019, compared to a return on average assets and equity of 1.28% and 12.92%, respectively, for 2018.
"Camden National reported record earnings of $57.2 million for the year,” said Gregory A. Dufour, President and Chief Executive Officer of the Company. "Our efforts and focus on our core businesses have translated directly to our bottom line." Dufour added, "Over the year, Camden National received several accolades from various organizations recognizing our financial performance, customer experience and service to our communities. It is certainly rewarding to see our hard work recognized by those we serve in varying capacities, and it is a reminder of our impact on and responsibility to many."
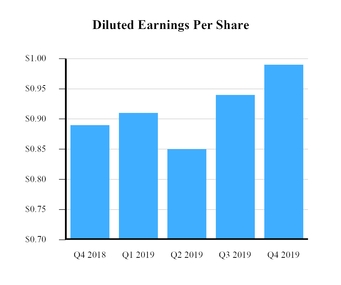
Net income for the fourth quarter of 2019 of $15.2 million increased 9% over the fourth quarter of 2018, while diluted EPS increased 11% to $0.99 over the same period. On a linked-quarter basis, net income and diluted EPS for the fourth quarter of 2019 each increased 5% over last quarter.
"We continue to actively manage our capital through various strategies," said Dufour. "In 2019, we returned nearly $20.8 million of capital to shareholders through the repurchase of 488,052 shares of Camden National common stock, and in December announced an increase in our quarterly dividend rate of 10%. As we balance our capital needs and generation of shareholder value, we believed it was the right time to increase our return of capital to shareholders."
“We continue to review our organization for efficiencies, and after careful consideration we will be closing our Corinth, Hampden and Milo banking centers by the end of April,” Dufour reported. "Our decision was based on many factors, including changes in customer behavior, financial considerations, and impact to stakeholders and customers."
2019 FINANCIAL HIGHLIGHTS
• | 2019 net income and diluted EPS grew 8% and 9%, respectively, over 2018; fourth quarter 2019 net income grew 9% over the fourth quarter of 2018 and 5% on a linked-quarter basis. |
• | Return on average assets for 2019 was 1.30%, and return on average equity was 12.44%; fourth quarter 2019 return on average assets of 1.35%, and return on average equity of 12.77%. |
• | Loans and deposits each grew 2% in 2019; loans and deposits decreased 1% and 2%, respectively, in the fourth quarter of 2019. |
1
• | Average deposits for 2019 grew 14% over 2018, led by average checking account growth of 20% over 2018; fourth quarter 2019 average deposits grew 12% over the fourth quarter of 2018 and 2% on a linked-quarter basis. |
• | Average loans for 2019 grew 8% over 2018; fourth quarter 2019 average loans grew 5% over the fourth quarter of 2018 and less than 1% on a linked-quarter basis. |
FINANCIAL CONDITION
Assets. As of December 31, 2019, total assets were $4.4 billion. In 2019, total assets grew 3% driven by loan growth (including loans held for sale) of $76.3 million, or 3%. Loans and loans held for sale, at December 31, 2019, were $3.1 billion. Net loan growth in 2019 was driven by:
• | Residential mortgage growth of $78.0 million, or 8%. During 2019, the Company originated $570.3 million of residential real estate loans and sold 50%, compared to $494.3 million in originations and 44% sold in 2018. Refinancing activity was 37% of residential real estate loan originations in 2019, compared to 24% in 2018. |
• | Commercial loan growth of $27.3 million, or 7%. Commercial loan originations for 2019 totaled $212.3 million, driven primarily by small business loans. Syndication loans were 10% of total commercial loan originations in 2019. |
• | Commercial real estate ("CRE") loans decreased $26.1 million, or 2%, primarily due to elevated prepayments. CRE loan activity was steady but very competitive within our markets throughout 2019. The Company had record CRE loan production in 2019 of $361.0 million, of which $137.5 million were construction loans yet to fund as of December 31, 2019. |
Deposits and Borrowings. As of December 31, 2019, deposits totaled $3.5 billion. In 2019, deposits grew 2% driven by checking account growth of $185.7 million, or 12%, and certificates of deposit ("CD") growth of $77.8 million, or 18%. The Company's CD growth was primarily attributable to one large depositor shifting $70.0 million of funding from interest checking to CDs earlier in the year.
At December 31, 2019, brokered deposits totaled $191.0 million, a decrease of $172.1 million, or 47%, since December 31, 2018. Brokered deposits represented 5% of total deposits at December 31, 2019, compared to 10% of total deposits at December 31, 2018. The decrease was attributable to strong checking and CD deposit growth in 2019.
The Company's total loan-to-deposit ratio at December 31, 2019 and 2018 was 87%.
Shareholders' Equity. At December 31, 2019, the Company's capital position was well in excess of regulatory requirements, including a total risk-based capital ratio of 14.44% and a Tier 1 leverage ratio of 9.55%. The Company deployed $20.8 million of capital throughout 2019 through the repurchase of 488,052 shares of its common stock.
The Company's Board of Directors has approved a new share repurchase program for up to 750,000 shares of the Company's common stock, or approximately 5% of shares outstanding at December 31, 2019, as the Company's current share repurchase program expired in January 2020. Repurchases under the new program may be made at the Company's discretion from time to time in the open market, through block trades or otherwise, and in privately negotiated transactions, subject to market conditions and other factors, and in accordance with applicable legal and regulatory requirements. If any share repurchases are made, they will be over a period of not greater than twelve months.
In December 2019, the Company announced a $0.03 per share, or 10%, increase in its quarterly cash dividend to shareholders of record as of January 15, 2020. The cash dividend is payable to shareholders of record on January 31, 2020 at a rate of $0.33 per share. As of December 31, 2019, the Company's annualized dividend yield was 2.87%, based on Camden National's closing share price of $46.06 as reported by NASDAQ.
ASSET QUALITY
As of December 31, 2019, the Company's asset quality metrics reached a new milestone with non-performing assets at a historical low of 0.25% of total assets and non-performing loans at 0.36% of total loans. In comparison, at December 31, 2018, non-performing assets to total assets were 0.34% and non-performing loans to total loans were 0.48%. As of December 31, 2019, loans 30-89 days past due were 0.17% of total loans, compared 0.29% at December 31, 2018.
At December 31, 2019, the allowance for loan losses was 0.81% of total loans and 225.77% of non-performing loans, compared to 0.82% of total loans and 171.17% of non-performing loans at December 31, 2018.
2
Q4 2019 FINANCIAL OPERATING RESULTS (linked quarter)
The Company reported net income of $15.2 million for the fourth quarter of 2019, an increase of $750,000, or 5%, over the third quarter of 2019. Diluted EPS for the fourth quarter of 2019 increased $0.05 over last quarter to $0.99.
Net Interest Income. Net interest income for the fourth quarter of 2019 was $32.2 million, an increase of $316,000, or 1%, over the third quarter of 2019.
Net interest margin for the fourth quarter was 3.12%, an increase of 3 basis points between quarters. The Company's cost of funds decreased 14 basis points between quarters to 0.94% for the fourth quarter, while its earning asset yield decreased 9 basis points between quarters to 4.02% for the fourth quarter.
Cost of Funds
• | Cost of deposits decreased 8 basis points between quarters to 0.77% for the fourth quarter. The decrease was driven by average checking account growth of 3% between quarters at an average cost of 0.53% for the fourth quarter, due in part to seasonal deposits within our markets and active management of deposit rates with new and existing customers. |
• | Cost of borrowings decreased 20 basis points between quarters to 2.07% for the fourth quarter. The decrease was driven by lower average borrowings of $70.9 million, or 12%, due to average deposit growth and a reduction in average cash balances for the quarter, as well as a 25 basis point Fed Funds interest rate cut in September and October. |
Asset Yield
• | Loan yields decreased 11 basis points between quarters to 4.49% due to repricing of existing variable rate loans combined with new loans funded at lower rates than the overall loan portfolio. |
• | Our fourth quarter loan yield benefited from an increase in loan prepayment income between quarters of $289,000, which provided a 3 basis point lift in loan yield over the third quarter. |
Provision for Credit Losses. The provision for credit losses for the fourth quarter of 2019 was $214,000, compared to $730,000 last quarter. The decrease in expense between quarters was due to:
• | Annualized net charge-offs for the fourth quarter of 0.09%, compared to 0.16% last quarter. |
• | A decrease in loan balances in the fourth quarter of 1%, compared to an increase in loan balances in the third quarter of 3%. |
Non-Interest Income. Non-interest income for the fourth quarter of 2019 was $11.9 million, an increase of $1.2 million, or 11%, over the third quarter of 2019. The increase in non-interest income was driven by:
• | A change in unrealized gain on equity securities of $866,000 in the fourth quarter. |
• | An increase in debit card income of $546,000 as annual volume growth hurdles were reached, resulting in a $579,000 incentive bonus from our network provider in the fourth quarter. |
• | A decrease in mortgage banking income of $494,000 as we experienced our normal decrease due to seasonality within our markets between quarters. |
Non-Interest Expense. Non-interest expense for the fourth quarter of 2019 was $24.8 million, an increase of $1.1 million, or 4%, compared to the third quarter of 2019. The increase was primarily due to an increase in salaries and benefits costs of $842,000 between quarters as the Company accrued for bonus and incentives based on annual performance to budget. The Company's efficiency ratio for the fourth quarter, calculated as non-interest expense divided by total revenues1, was 56.16%, compared to 55.67% last quarter.
2019 ANNUAL FINANCIAL OPERATING RESULTS
The Company reported net income of $57.2 million for 2019, an increase of $4.1 million, or 8%, over 2018. Diluted EPS for 2019 increased $0.30 over 2018 to $3.69.
______________________________________________________________________________________________________
1 | Revenue is the sum of net interest income and non-interest income. |
3
Net interest income. Net interest income for 2019 was $127.6 million, an increase of $7.2 million, or 6%, over 2018. Average loans grew 8% and average deposits grew 14% in 2019. The Company's ability to fund loan growth through deposit growth allowed it to maintain a relatively stable net interest margin year over year, despite the challenging interest rate environment. Net interest margin for 2019 was 3.15%, a decrease of 1 basis point compared to 2018.
Provision for Credit Losses. The provision for credit losses for 2019 was $2.9 million, compared to $847,000 for 2018. For 2019, net charge-offs to average loans were 0.08%, compared to 0.01% for 2018. Our ratio of net charge-offs to average loans for 2018 was lower primarily due to the favorable resolution of a significant commercial credit relationship that resulted in a large recovery.
Non-Interest Income. Non-interest income for 2019 was $42.1 million, an increase of $3.9 million, or 10%, over 2018. The increase was primarily attributable to:
• | An increase in mortgage banking income of $1.9 million, or 33%, due to higher mortgage sales of 32%, in part driven by higher refinance activity. |
• | A change in unrealized gain on equity securities of $928,000. |
• | An increase in debit card income of 7% driven by transaction volume. |
• | An increase in fiduciary service of $525,000, or 10%, as Camden National Wealth Management assets under management increased 20% to $1.0 billion as of December 31, 2019. In 2019, Camden National Wealth Management reached a new milestone with $96.1 million of new business. |
Non-Interest Expense. Non-interest expense for 2019 was $95.3 million, an increase of $3.4 million, or 4%, over 2018. The increase was primarily driven by an increase in salaries and benefits costs of $3.0 million, or 6%, due to an increase in: (i) wages and related taxes of 5%; (ii) health insurance costs of 10%; and (iii) bonus and incentives based on annual performance to budget. The Company's efficiency ratio for 2019, calculated as non-interest expense divided by total revenues, was 56.15%, compared to 57.98% for 2018.
CONFERENCE CALL
Camden National will host a conference call and webcast at 3:00 p.m. Eastern Time on January 28, 2020 to discuss fourth quarter and annual 2019 financial results. Participants should dial in to the call 10 - 15 minutes before it begins. Information about the conference call is as follows:
Live dial-in (domestic): (888) 349-0139
Live dial-in (international): (412) 542-4154
Live webcast: https://services.choruscall.com/links/cac200128.html
A link to the live webcast will be will be available on Camden National's website under "Investor Relations" at CamdenNational.com prior to the meeting. The transcript of the conference call will also be available on Camden National's website approximately two business days after the conference call.
ABOUT CAMDEN NATIONAL CORPORATION
Camden National Corporation (NASDAQ:CAC) is the largest publicly traded bank holding company in Northern New England with $4.4 billion in assets and nearly 650 employees. Camden National Bank, its subsidiary, is a full-service community bank founded in 1875 in Camden, Maine. Dedicated to customers at every stage of their financial journey, the bank offers the latest in digital banking, complemented by personalized service with 61 banking centers, 24/7 live phone support, 71 ATMs, and lending offices in New Hampshire and Massachusetts. For the past two years, Camden National Bank was named "Customer Experience Leader in U.S. Retail Banking" by Greenwich Associates, and in 2019, it was the only New England based organization included in Sandler O'Neill's "Bank and Thrift Sm-All Star" list of high-performing financial institutions. The Finance Authority of Maine has awarded Camden National Bank as "Lender at Work for Maine" for ten years. Comprehensive wealth management, investment and financial planning services are delivered by Camden National Wealth Management. To learn more, visit CamdenNational.com. Member FDIC.
4
FORWARD-LOOKING STATEMENTS
Certain statements contained in this press release that are not statements of historical fact constitute forward-looking statements within the meaning of the Private Securities Litigation Reform Act of 1995, as amended, including certain plans, expectations, goals, projections and other statements, which are subject to numerous risks, assumptions and uncertainties. Forward-looking statements can be identified by the fact that they do not relate strictly to historical or current facts. They often include words like “believe,” “expect,” “anticipate,” “estimate,” and “intend” or future or conditional verbs such as “will,” “would,” “should,” “could” or “may.” Certain factors that could cause actual results to differ materially from expected results include increased competitive pressures; changes in the interest rate environment; changes in general economic conditions; operational risks including, but not limited to, cybersecurity, fraud and natural disasters; legislative and regulatory changes that adversely affect the business in which Camden National is engaged; changes in the securities markets and other risks and uncertainties disclosed from time to time in in Camden National’s Annual Report on Form 10-K for the year ended December 31, 2018, as updated by other filings with the Securities and Exchange Commission ("SEC"). Camden National does not have any obligation to update forward-looking statements.
USE OF NON-GAAP MEASURES
In addition to evaluating the Company's results of operations in accordance with generally accepted accounting principles in the United States ("GAAP"), management supplements this evaluation with certain non-GAAP financial measures, such as return on average tangible equity; the efficiency and tangible common equity ratios; tangible book value per share; and core deposits. Management utilizes these non-GAAP financial measures for purposes of measuring our performance against our peer group and other financial institutions and analyzing our internal performance. We also believe these non-GAAP financial measure help investors better understand the Company's operating performance and trends and allow for better performance comparisons to other financial institutions. In addition, these non-GAAP financial measures remove the impact of unusual items that may obscure trends in the Company's underlying performance. These disclosures should not be viewed as a substitute for GAAP operating results, nor are they necessarily comparable to non-GAAP performance measures that may be presented by other financial institutions. Reconciliation to the comparable GAAP financial measure can be found in this document.
ANNUALIZED DATA
Certain returns, yields, and performance ratios are presented on an “annualized” basis. This is done for analytical and decision-making purposes to better discern underlying performance trends when compared to full-year or year-over-year amounts. Annualized data may not be indicative of any four-quarter period, and are presented for illustrative purposes only.
5
Selected Financial Data (unaudited) | ||||||||||||||||||||
At or For The Three Months Ended | At or For The Year Ended | |||||||||||||||||||
(In thousands, except number of shares and per share data) | December 31, 2019 | September 30, 2019 | December 31, 2018 | December 31, 2019 | December 31, 2018 | |||||||||||||||
Financial Condition Data | ||||||||||||||||||||
Investments | $ | 933,069 | $ | 926,444 | $ | 926,678 | $ | 933,069 | $ | 926,678 | ||||||||||
Loans and loans held for sale | 3,106,877 | 3,127,083 | 3,030,625 | 3,106,877 | 3,030,625 | |||||||||||||||
Allowance for loan losses | 25,171 | 25,688 | 24,712 | 25,171 | 24,712 | |||||||||||||||
Total assets | 4,429,521 | 4,520,315 | 4,297,435 | 4,429,521 | 4,297,435 | |||||||||||||||
Deposits | 3,537,743 | 3,617,963 | 3,464,474 | 3,537,743 | 3,464,474 | |||||||||||||||
Borrowings | 337,889 | 342,459 | 341,515 | 337,889 | 341,515 | |||||||||||||||
Shareholders' equity | 473,415 | 471,672 | 435,825 | 473,415 | 435,825 | |||||||||||||||
Operating Data | ||||||||||||||||||||
Net interest income | $ | 32,239 | $ | 31,923 | $ | 31,587 | $ | 127,630 | $ | 120,393 | ||||||||||
Provision for credit losses | 214 | 730 | 7 | 2,861 | 847 | |||||||||||||||
Non-interest income | 11,948 | 10,739 | 9,479 | 42,113 | 38,176 | |||||||||||||||
Non-interest expense | 24,814 | 23,748 | 23,580 | 95,303 | 91,945 | |||||||||||||||
Income before income tax expense | 19,159 | 18,184 | 17,479 | 71,579 | 65,777 | |||||||||||||||
Income tax expense | 3,921 | 3,696 | 3,502 | 14,376 | 12,706 | |||||||||||||||
Net income | $ | 15,238 | $ | 14,488 | $ | 13,977 | $ | 57,203 | $ | 53,071 | ||||||||||
Key Ratios | ||||||||||||||||||||
Return on average assets | 1.35 | % | 1.29 | % | 1.32 | % | 1.30 | % | 1.28 | % | ||||||||||
Return on average equity | 12.77 | % | 12.26 | % | 13.19 | % | 12.44 | % | 12.92 | % | ||||||||||
GAAP efficiency ratio | 56.16 | % | 55.67 | % | 57.42 | % | 56.15 | % | 57.98 | % | ||||||||||
Common equity ratio | 10.69 | % | 10.43 | % | 10.14 | % | 10.69 | % | 10.14 | % | ||||||||||
Net interest margin (fully-taxable equivalent) | 3.12 | % | 3.09 | % | 3.21 | % | 3.15 | % | 3.16 | % | ||||||||||
Non-performing assets to total assets | 0.25 | % | 0.30 | % | 0.34 | % | 0.25 | % | 0.34 | % | ||||||||||
Tier 1 leverage capital ratio | 9.55 | % | 9.39 | % | 9.53 | % | 9.55 | % | 9.53 | % | ||||||||||
Total risk-based capital ratio | 14.44 | % | 13.97 | % | 14.36 | % | 14.44 | % | 14.36 | % | ||||||||||
Per Share Data | ||||||||||||||||||||
Basic earnings per share | $ | 1.00 | $ | 0.94 | $ | 0.90 | $ | 3.70 | $ | 3.40 | ||||||||||
Diluted earnings per share | $ | 0.99 | $ | 0.94 | $ | 0.89 | $ | 3.69 | $ | 3.39 | ||||||||||
Cash dividends declared per share | $ | 0.33 | $ | 0.30 | $ | 0.30 | $ | 1.23 | $ | 1.15 | ||||||||||
Book value per share | $ | 31.26 | $ | 30.98 | $ | 27.95 | $ | 31.26 | $ | 27.95 | ||||||||||
Non-GAAP Measures(1) | ||||||||||||||||||||
Return on average tangible equity | 16.26 | % | 15.67 | % | 17.43 | % | 15.99 | % | 17.22 | % | ||||||||||
Efficiency ratio | 55.64 | % | 55.32 | % | 56.50 | % | 55.77 | % | 57.71 | % | ||||||||||
Tangible common equity ratio | 8.66 | % | 8.44 | % | 8.02 | % | 8.66 | % | 8.02 | % | ||||||||||
Tangible book value per share | $ | 24.77 | $ | 24.52 | $ | 21.61 | $ | 24.77 | $ | 21.61 | ||||||||||
(1) | Please see "Reconciliation of non-GAAP to GAAP Financial Measures (unaudited)." |
6
Consolidated Statements of Condition Data (unaudited) | ||||||||||||
(In thousands) | December 31, 2019 | September 30, 2019 | December 31, 2018 | |||||||||
ASSETS | ||||||||||||
Cash and due from banks | $ | 39,586 | $ | 63,620 | $ | 52,240 | ||||||
Interest-bearing deposits in other banks (including restricted cash) | 36,050 | 73,912 | 14,759 | |||||||||
Total cash, cash equivalents and restricted cash | 75,636 | 137,532 | 66,999 | |||||||||
Investments: | ||||||||||||
Available-for-sale securities, at fair value (book value of $913,978, $903,988 and $933,399, respectively) | 918,118 | 913,523 | 910,692 | |||||||||
Held-to-maturity securities, at amortized cost (fair value of $1,359, $1,352 and $1,291, respectively) | 1,302 | 1,303 | 1,307 | |||||||||
Other investments | 13,649 | 11,618 | 14,679 | |||||||||
Total investments | 933,069 | 926,444 | 926,678 | |||||||||
Loans held for sale, at fair value (book value of $11,915, $16,630 and $4,314, respectively) | 11,854 | 16,449 | 4,403 | |||||||||
Loans: | ||||||||||||
Commercial real estate | 1,243,397 | 1,255,519 | 1,269,533 | |||||||||
Residential real estate | 1,070,374 | 1,061,898 | 992,866 | |||||||||
Commercial(1) | 442,701 | 445,466 | 415,436 | |||||||||
Consumer and home equity | 338,551 | 347,751 | 348,387 | |||||||||
Total loans | 3,095,023 | 3,110,634 | 3,026,222 | |||||||||
Less: allowance for loan losses | (25,171 | ) | (25,688 | ) | (24,712 | ) | ||||||
Net loans | 3,069,852 | 3,084,946 | 3,001,510 | |||||||||
Goodwill | 94,697 | 94,697 | 94,697 | |||||||||
Other intangible assets | 3,525 | 3,701 | 4,230 | |||||||||
Bank-owned life insurance | 92,344 | 91,729 | 89,919 | |||||||||
Premises and equipment, net | 41,836 | 40,930 | 42,495 | |||||||||
Deferred tax assets | 16,823 | 15,656 | 23,053 | |||||||||
Other assets | 89,885 | 108,231 | 43,451 | |||||||||
Total assets | $ | 4,429,521 | $ | 4,520,315 | $ | 4,297,435 | ||||||
LIABILITIES AND SHAREHOLDERS’ EQUITY | ||||||||||||
Liabilities | ||||||||||||
Deposits: | ||||||||||||
Non-interest checking | $ | 552,590 | $ | 573,621 | $ | 496,729 | ||||||
Interest checking | 1,153,203 | 1,147,627 | 1,023,373 | |||||||||
Savings and money market | 1,119,193 | 1,105,290 | 1,137,356 | |||||||||
Certificates of deposit | 521,752 | 541,199 | 443,912 | |||||||||
Brokered deposits | 191,005 | 250,226 | 363,104 | |||||||||
Total deposits | 3,537,743 | 3,617,963 | 3,464,474 | |||||||||
Short-term borrowings | 268,809 | 273,454 | 270,868 | |||||||||
Long-term borrowings | 10,000 | 10,000 | 11,580 | |||||||||
Subordinated debentures | 59,080 | 59,005 | 59,067 | |||||||||
Accrued interest and other liabilities | 80,474 | 88,221 | 55,621 | |||||||||
Total liabilities | 3,956,106 | 4,048,643 | 3,861,610 | |||||||||
Shareholders’ equity | 473,415 | 471,672 | 435,825 | |||||||||
Total liabilities and shareholders’ equity | $ | 4,429,521 | $ | 4,520,315 | $ | 4,297,435 | ||||||
(1) | Includes the HPFC loan portfolio. |
7
Consolidated Statements of Income Data (unaudited) | ||||||||||||
For The Three Months Ended | ||||||||||||
(In thousands, except per share data) | December 31, 2019 | September 30, 2019 | December 31, 2018 | |||||||||
Interest Income | ||||||||||||
Interest and fees on loans | $ | 35,379 | $ | 36,207 | $ | 34,532 | ||||||
Taxable interest on investments | 4,780 | 4,794 | 4,708 | |||||||||
Nontaxable interest on investments | 758 | 675 | 659 | |||||||||
Dividend income | 160 | 158 | 319 | |||||||||
Other interest income | 475 | 686 | 235 | |||||||||
Total interest income | 41,552 | 42,520 | 40,453 | |||||||||
Interest Expense | ||||||||||||
Interest on deposits | 7,459 | 8,963 | 6,650 | |||||||||
Interest on borrowings | 961 | 801 | 1,357 | |||||||||
Interest on subordinated debentures | 893 | 833 | 859 | |||||||||
Total interest expense | 9,313 | 10,597 | 8,866 | |||||||||
Net interest income | 32,239 | 31,923 | 31,587 | |||||||||
Provision for credit losses | 214 | 730 | 7 | |||||||||
Net interest income after provision for credit losses | 32,025 | 31,193 | 31,580 | |||||||||
Non-Interest Income | ||||||||||||
Debit card income | 2,978 | 2,432 | 2,839 | |||||||||
Service charges on deposit accounts | 2,191 | 1,970 | 2,145 | |||||||||
Mortgage banking income, net | 2,175 | 2,668 | 1,156 | |||||||||
Income from fiduciary services | 1,520 | 1,444 | 1,347 | |||||||||
Brokerage and insurance commissions | 683 | 625 | 665 | |||||||||
Bank-owned life insurance | 615 | 613 | 607 | |||||||||
Customer loan swap fees | 247 | 109 | 401 | |||||||||
Net (loss) gain on sale of securities | (133 | ) | 1 | (420 | ) | |||||||
Other income | 1,672 | 877 | 739 | |||||||||
Total non-interest income | 11,948 | 10,739 | 9,479 | |||||||||
Non-Interest Expense | ||||||||||||
Salaries and employee benefits | 14,446 | 13,604 | 13,080 | |||||||||
Furniture, equipment and data processing | 2,770 | 2,708 | 2,649 | |||||||||
Net occupancy costs | 1,784 | 1,710 | 1,764 | |||||||||
Consulting and professional fees | 1,027 | 892 | 874 | |||||||||
Debit card expense | 947 | 960 | 841 | |||||||||
Regulatory assessments | 170 | 182 | 490 | |||||||||
Amortization of intangible assets | 176 | 177 | 181 | |||||||||
Other real estate owned and collection costs, net | 127 | 251 | 370 | |||||||||
Other expenses | 3,367 | 3,264 | 3,331 | |||||||||
Total non-interest expense | 24,814 | 23,748 | 23,580 | |||||||||
Income before income tax expense | 19,159 | 18,184 | 17,479 | |||||||||
Income tax expense | 3,921 | 3,696 | 3,502 | |||||||||
Net income | $ | 15,238 | $ | 14,488 | $ | 13,977 | ||||||
Per Share Data | ||||||||||||
Basic earnings per share | $ | 1.00 | $ | 0.94 | $ | 0.90 | ||||||
Diluted earnings per share | $ | 0.99 | $ | 0.94 | $ | 0.89 | ||||||
8
Consolidated Statements of Income Data (unaudited) | ||||||||
Year Ended December 31, | ||||||||
(In thousands, except per share data) | 2019 | 2018 | ||||||
Interest Income | ||||||||
Interest and fees on loans | $ | 143,399 | $ | 128,546 | ||||
Taxable interest on investments | 19,509 | 17,727 | ||||||
Nontaxable interest on investments | 2,701 | 2,648 | ||||||
Dividend income | 722 | 1,316 | ||||||
Other interest income | 2,187 | 1,140 | ||||||
Total interest income | 168,518 | 151,377 | ||||||
Interest Expense | ||||||||
Interest on deposits | 34,001 | 20,113 | ||||||
Interest on borrowings | 3,621 | 7,456 | ||||||
Interest on subordinated debentures | 3,266 | 3,415 | ||||||
Total interest expense | 40,888 | 30,984 | ||||||
Net interest income | 127,630 | 120,393 | ||||||
Provision for credit losses | 2,861 | 847 | ||||||
Net interest income after provision for credit losses | 124,769 | 119,546 | ||||||
Non-Interest Income | ||||||||
Debit card income | 9,701 | 9,067 | ||||||
Service charges on deposit accounts | 8,393 | 8,253 | ||||||
Mortgage banking income, net | 7,837 | 5,914 | ||||||
Income from fiduciary services | 5,901 | 5,376 | ||||||
Brokerage and insurance commissions | 2,625 | 2,615 | ||||||
Bank-owned life insurance | 2,425 | 2,430 | ||||||
Customer loan swap fees | 1,166 | 956 | ||||||
Net (loss) gain on sale of securities | (105 | ) | 275 | |||||
Other income | 4,170 | 3,290 | ||||||
Total non-interest income | 42,113 | 38,176 | ||||||
Non-Interest Expense | ||||||||
Salaries and employee benefits | 54,489 | 51,513 | ||||||
Furniture, equipment and data processing | 10,881 | 10,359 | ||||||
Net occupancy costs | 7,047 | 6,876 | ||||||
Consulting and professional fees | 3,706 | 3,752 | ||||||
Debit card expense | 3,613 | 3,180 | ||||||
Regulatory assessments | 1,261 | 1,937 | ||||||
Amortization of intangible assets | 705 | 725 | ||||||
Other real estate owned and collection costs, net | 480 | 935 | ||||||
Other expenses | 13,121 | 12,668 | ||||||
Total non-interest expense | 95,303 | 91,945 | ||||||
Income before income tax expense | 71,579 | 65,777 | ||||||
Income tax expense | 14,376 | 12,706 | ||||||
Net income | $ | 57,203 | $ | 53,071 | ||||
Per Share Data | ||||||||
Basic earnings per share | $ | 3.70 | $ | 3.40 | ||||
Diluted earnings per share | $ | 3.69 | $ | 3.39 | ||||
9
Quarterly Average Balance and Yield/Rate Analysis (unaudited) | |||||||||||||||||||||
Average Balance | Yield/Rate | ||||||||||||||||||||
For the Three Months Ended | For the Three Months Ended | ||||||||||||||||||||
(In thousands) | December 31, 2019 | September 30, 2019 | December 31, 2018 | December 31, 2019 | September 30, 2019 | December 31, 2018 | |||||||||||||||
Assets | |||||||||||||||||||||
Interest-earning assets: | |||||||||||||||||||||
Interest-bearing deposits in other banks and other interest-earning assets | $ | 79,578 | $ | 92,352 | $ | 24,620 | 1.74 | % | 2.24 | % | 1.57 | % | |||||||||
Investments - taxable | 804,587 | 807,591 | 830,097 | 2.52 | % | 2.53 | % | 2.49 | % | ||||||||||||
Investments - nontaxable(1) | 112,730 | 98,378 | 97,192 | 3.40 | % | 3.47 | % | 3.43 | % | ||||||||||||
Loans(2): | |||||||||||||||||||||
Commercial real estate | 1,249,961 | 1,255,417 | 1,230,791 | 4.40 | % | 4.56 | % | 4.60 | % | ||||||||||||
Residential real estate | 1,078,485 | 1,062,728 | 973,124 | 4.38 | % | 4.31 | % | 4.29 | % | ||||||||||||
Commercial(1) | 403,601 | 399,689 | 364,253 | 4.41 | % | 4.65 | % | 4.50 | % | ||||||||||||
Consumer and home equity | 345,487 | 347,405 | 346,494 | 5.11 | % | 5.38 | % | 5.36 | % | ||||||||||||
HPFC | 22,516 | 25,973 | 35,163 | 7.56 | % | 8.40 | % | 7.66 | % | ||||||||||||
Municipal(1) | 18,469 | 22,730 | 17,520 | 3.66 | % | 3.60 | % | 3.28 | % | ||||||||||||
Total loans | 3,118,519 | 3,113,942 | 2,967,345 | 4.49 | % | 4.60 | % | 4.60 | % | ||||||||||||
Total interest-earning assets | 4,115,414 | 4,112,263 | 3,919,254 | 4.02 | % | 4.11 | % | 4.11 | % | ||||||||||||
Other assets | 349,786 | 345,618 | 294,178 | ||||||||||||||||||
Total assets | $ | 4,465,200 | $ | 4,457,881 | $ | 4,213,432 | |||||||||||||||
Liabilities & Shareholders' Equity | |||||||||||||||||||||
Deposits: | |||||||||||||||||||||
Non-interest checking | $ | 558,677 | $ | 540,542 | $ | 523,283 | — | % | — | % | — | % | |||||||||
Interest checking | 1,165,610 | 1,130,632 | 995,333 | 0.79 | % | 0.96 | % | 0.76 | % | ||||||||||||
Savings | 471,777 | 474,096 | 483,651 | 0.08 | % | 0.08 | % | 0.06 | % | ||||||||||||
Money market | 642,174 | 622,219 | 553,785 | 1.16 | % | 1.32 | % | 1.07 | % | ||||||||||||
Certificates of deposit | 533,416 | 533,110 | 444,769 | 1.66 | % | 1.64 | % | 1.26 | % | ||||||||||||
Total deposits | 3,371,654 | 3,300,599 | 3,000,821 | 0.77 | % | 0.85 | % | 0.65 | % | ||||||||||||
Borrowings: | |||||||||||||||||||||
Brokered deposits | 187,125 | 305,019 | 307,559 | 2.02 | % | 2.42 | % | 2.28 | % | ||||||||||||
Customer repurchase agreements | 247,780 | 234,362 | 265,675 | 1.20 | % | 1.26 | % | 1.22 | % | ||||||||||||
Subordinated debentures | 59,037 | 58,998 | 59,048 | 6.01 | % | 5.60 | % | 5.77 | % | ||||||||||||
Other borrowings | 44,816 | 11,273 | 93,181 | 1.88 | % | 1.96 | % | 2.29 | % | ||||||||||||
Total borrowings | 538,758 | 609,652 | 725,463 | 2.07 | % | 2.27 | % | 2.18 | % | ||||||||||||
Total funding liabilities | 3,910,412 | 3,910,251 | 3,726,284 | 0.94 | % | 1.08 | % | 0.94 | % | ||||||||||||
Other liabilities | 81,261 | 78,710 | 66,805 | ||||||||||||||||||
Shareholders' equity | 473,527 | 468,920 | 420,343 | ||||||||||||||||||
Total liabilities & shareholders' equity | $ | 4,465,200 | $ | 4,457,881 | $ | 4,213,432 | |||||||||||||||
Net interest rate spread (fully-taxable equivalent) | 3.08 | % | 3.03 | % | 3.17 | % | |||||||||||||||
Net interest margin (fully-taxable equivalent) | 3.12 | % | 3.09 | % | 3.21 | % | |||||||||||||||
Net interest margin (fully-taxable equivalent), excluding fair value mark accretion and collection of previously charged-off acquired loans(3) | 3.09 | % | 3.05 | % | 3.14 | % | |||||||||||||||
(1) Reported on tax-equivalent basis calculated using the federal corporate income tax rate of 21%, including certain commercial loans.
(2) | Non-accrual loans and loans held for sale are included in total average loans. |
(3) Excludes the impact of the fair value mark accretion on loans and certificates of deposit generated in purchase accounting and collection of previously charged-off acquired loans for the three months ended December 31, 2019, September 30, 2019, and December 31, 2018, totaling $326,000, $409,000 and $686,000, respectively.
10
Year-to-Date Average Balance and Yield/Rate Analysis (unaudited) | ||||||||||||||
Average Balance | Yield/Rate | |||||||||||||
For the Year Ended | For the Year Ended | |||||||||||||
(In thousands) | December 31, 2019 | December 31, 2018 | December 31, 2019 | December 31, 2018 | ||||||||||
Assets | ||||||||||||||
Interest-earning assets: | ||||||||||||||
Interest-bearing deposits in other banks and other interest-earning assets | $ | 67,288 | $ | 45,155 | 2.13 | % | 1.62 | % | ||||||
Investments - taxable | 825,674 | 829,462 | 2.54 | % | 2.35 | % | ||||||||
Investments - nontaxable(1) | 99,024 | 98,128 | 3.45 | % | 3.42 | % | ||||||||
Loans(2): | ||||||||||||||
Commercial real estate | 1,260,412 | 1,195,544 | 4.66 | % | 4.47 | % | ||||||||
Residential real estate | 1,045,668 | 913,593 | 4.33 | % | 4.19 | % | ||||||||
Commercial(1) | 390,689 | 354,508 | 4.68 | % | 4.50 | % | ||||||||
Consumer and home equity | 346,769 | 343,292 | 5.35 | % | 5.08 | % | ||||||||
HPFC | 27,502 | 39,588 | 8.05 | % | 7.89 | % | ||||||||
Municipal(1) | 19,181 | 20,361 | 3.59 | % | 3.18 | % | ||||||||
Total loans | 3,090,221 | 2,866,886 | 4.65 | % | 4.49 | % | ||||||||
Total interest-earning assets | 4,082,207 | 3,839,631 | 4.15 | % | 3.97 | % | ||||||||
Other assets | 328,301 | 295,837 | ||||||||||||
Total assets | $ | 4,410,508 | $ | 4,135,468 | ||||||||||
Liabilities & Shareholders' Equity | ||||||||||||||
Deposits: | ||||||||||||||
Non-interest checking | $ | 519,078 | $ | 488,702 | — | % | — | % | ||||||
Interest checking | 1,123,268 | 884,710 | 0.93 | % | 0.55 | % | ||||||||
Savings | 476,860 | 485,986 | 0.08 | % | 0.06 | % | ||||||||
Money market | 607,383 | 515,590 | 1.24 | % | 0.87 | % | ||||||||
Certificates of deposit | 506,971 | 467,631 | 1.57 | % | 1.13 | % | ||||||||
Total deposits | 3,233,560 | 2,842,619 | 0.81 | % | 0.52 | % | ||||||||
Borrowings: | ||||||||||||||
Brokered deposits | 316,475 | 264,711 | 2.42 | % | 1.98 | % | ||||||||
Customer repurchase agreements | 241,899 | 248,743 | 1.25 | % | 1.02 | % | ||||||||
Subordinated debentures | 59,007 | 58,990 | 5.54 | % | 5.79 | % | ||||||||
Other borrowings | 29,132 | 249,544 | 2.05 | % | 1.97 | % | ||||||||
Total borrowings | 646,513 | 821,988 | 2.25 | % | 1.96 | % | ||||||||
Total funding liabilities | 3,880,073 | 3,664,607 | 1.05 | % | 0.85 | % | ||||||||
Other liabilities | 70,570 | 60,106 | ||||||||||||
Shareholders' equity | 459,865 | 410,755 | ||||||||||||
Total liabilities & shareholders' equity | $ | 4,410,508 | $ | 4,135,468 | ||||||||||
Net interest rate spread (fully-taxable equivalent) | 3.10 | % | 3.12 | % | ||||||||||
Net interest margin (fully-taxable equivalent) | 3.15 | % | 3.16 | % | ||||||||||
Net interest margin (fully-taxable equivalent), excluding fair value mark accretion and collection of previously charged-off acquired loans(3) | 3.11 | % | 3.10 | % | ||||||||||
(1) | Reported on tax-equivalent basis calculated using the federal corporate income tax rate of 21%, including certain commercial loans. |
(2) | Non-accrual loans and loans held for sale are included in total average loans. |
(3) | Excludes the impact of the fair value mark accretion on loans and certificates of deposit generated in purchase accounting and collection of previously charged-off acquired loans for the years ended December 31, 2019 and 2018, totaling $1.6 million and $2.3 million, respectively. |
11
Asset Quality Data | ||||||||||||||||||||
(unaudited) | ||||||||||||||||||||
(In thousands) | At or For The Year Ended December 31, 2019 | At or For The Nine Months Ended September 30, 2019 | At or For The Six Months Ended June 30, 2019 | At or For The Three Months Ended March 31, 2019 | At or For The Year Ended December 31, 2018 | |||||||||||||||
Non-accrual loans: | ||||||||||||||||||||
Residential real estate | $ | 4,096 | $ | 5,152 | $ | 5,566 | $ | 5,415 | $ | 5,492 | ||||||||||
Commercial real estate | 1,122 | 1,156 | 1,590 | 975 | 1,380 | |||||||||||||||
Commercial | 420 | 751 | 785 | 802 | 1,279 | |||||||||||||||
Consumer and home equity | 2,154 | 2,616 | 3,039 | 2,476 | 1,861 | |||||||||||||||
HPFC | 364 | 450 | 465 | 485 | 518 | |||||||||||||||
Total non-accrual loans | 8,156 | 10,125 | 11,445 | 10,153 | 10,530 | |||||||||||||||
Loans 90 days past due and accruing | — | — | 14 | 14 | 14 | |||||||||||||||
Accruing troubled-debt restructured loans not included above | 2,993 | 3,259 | 3,511 | 3,771 | 3,893 | |||||||||||||||
Total non-performing loans | 11,149 | 13,384 | 14,970 | 13,938 | 14,437 | |||||||||||||||
Other real estate owned | 94 | 94 | 130 | 673 | 130 | |||||||||||||||
Total non-performing assets | $ | 11,243 | $ | 13,478 | $ | 15,100 | $ | 14,611 | $ | 14,567 | ||||||||||
Loans 30-89 days past due: | ||||||||||||||||||||
Residential real estate | $ | 2,227 | $ | 1,447 | $ | 2,536 | $ | 2,265 | $ | 4,833 | ||||||||||
Commercial real estate | 1,582 | 2,242 | 3,378 | 2,947 | 2,130 | |||||||||||||||
Commercial | 548 | 1,135 | 1,400 | 1,205 | 169 | |||||||||||||||
Consumer and home equity | 750 | 822 | 907 | 1,430 | 1,467 | |||||||||||||||
HPFC | 243 | 193 | 171 | 187 | 183 | |||||||||||||||
Total loans 30-89 days past due | $ | 5,350 | $ | 5,839 | $ | 8,392 | $ | 8,034 | $ | 8,782 | ||||||||||
Allowance for loan losses at the beginning of the period | $ | 24,712 | $ | 24,712 | $ | 24,712 | $ | 24,712 | $ | 24,171 | ||||||||||
Provision for loan losses | 2,862 | 2,658 | 1,925 | 750 | 845 | |||||||||||||||
Charge-offs: | ||||||||||||||||||||
Residential real estate | 462 | 436 | 25 | 11 | 173 | |||||||||||||||
Commercial real estate | 300 | 157 | 65 | 65 | 512 | |||||||||||||||
Commercial | 1,167 | 636 | 453 | 236 | 736 | |||||||||||||||
Consumer and home equity | 713 | 670 | 64 | 24 | 572 | |||||||||||||||
HPFC | 71 | 11 | — | — | 255 | |||||||||||||||
Total charge-offs | 2,713 | 1,910 | 607 | 336 | 2,248 | |||||||||||||||
Total recoveries | (310 | ) | (228 | ) | (133 | ) | (75 | ) | (1,944 | ) | ||||||||||
Net charge-offs | 2,403 | 1,682 | 474 | 261 | 304 | |||||||||||||||
Allowance for loan losses at the end of the period | $ | 25,171 | $ | 25,688 | $ | 26,163 | $ | 25,201 | $ | 24,712 | ||||||||||
Components of allowance for credit losses: | ||||||||||||||||||||
Allowance for loan losses | $ | 25,171 | $ | 25,688 | $ | 26,163 | $ | 25,201 | $ | 24,712 | ||||||||||
Liability for unfunded credit commitments | 21 | 11 | 14 | 16 | 22 | |||||||||||||||
Allowance for credit losses | $ | 25,192 | $ | 25,699 | $ | 26,177 | $ | 25,217 | $ | 24,734 | ||||||||||
Ratios: | ||||||||||||||||||||
Non-performing loans to total loans | 0.36 | % | 0.43 | % | 0.48 | % | 0.46 | % | 0.48 | % | ||||||||||
Non-performing assets to total assets | 0.25 | % | 0.30 | % | 0.34 | % | 0.33 | % | 0.34 | % | ||||||||||
Allowance for loan losses to total loans | 0.81 | % | 0.83 | % | 0.84 | % | 0.83 | % | 0.82 | % | ||||||||||
Net charge-offs (recoveries) to average loans (annualized) | ||||||||||||||||||||
Quarter-to-date | 0.09 | % | 0.16 | % | 0.03 | % | 0.03 | % | (0.16 | )% | ||||||||||
Year-to-date | 0.08 | % | 0.07 | % | 0.03 | % | 0.03 | % | 0.01 | % | ||||||||||
Allowance for loan losses to non-performing loans | 225.77 | % | 191.93 | % | 174.77 | % | 180.81 | % | 171.17 | % | ||||||||||
Loans 30-89 days past due to total loans | 0.17 | % | 0.19 | % | 0.27 | % | 0.26 | % | 0.29 | % | ||||||||||
12
Reconciliation of non-GAAP to GAAP Financial Measures (unaudited)
Return on Average Tangible Equity: | ||||||||||||||||||||
For the Three Months Ended | For the Year Ended | |||||||||||||||||||
(In thousands) | December 31, 2019 | September 30, 2019 | December 31, 2018 | December 31, 2019 | December 31, 2018 | |||||||||||||||
Net income, as presented | $ | 15,238 | $ | 14,488 | $ | 13,977 | $ | 57,203 | $ | 53,071 | ||||||||||
Add: amortization of intangible assets, net of tax(1) | 139 | 140 | 143 | 557 | 573 | |||||||||||||||
Net income, adjusted for amortization of intangible assets | $ | 15,377 | $ | 14,628 | $ | 14,120 | $ | 57,760 | $ | 53,644 | ||||||||||
Average equity, as presented | $ | 473,527 | $ | 468,920 | $ | 420,343 | $ | 459,865 | $ | 410,755 | ||||||||||
Less: average goodwill and other intangible assets | (98,307 | ) | (98,484 | ) | (99,015 | ) | (98,570 | ) | (99,287 | ) | ||||||||||
Average tangible equity | $ | 375,220 | $ | 370,436 | $ | 321,328 | $ | 361,295 | $ | 311,468 | ||||||||||
Return on average equity | 12.77 | % | 12.26 | % | 13.19 | % | 12.44 | % | 12.92 | % | ||||||||||
Return on average tangible equity | 16.26 | % | 15.67 | % | 17.43 | % | 15.99 | % | 17.22 | % | ||||||||||
(1) | Assumed a 21% tax rate. |
Efficiency Ratio: | ||||||||||||||||||||
For the Three Months Ended | For the Year Ended | |||||||||||||||||||
(In thousands) | December 31, 2019 | September 30, 2019 | December 31, 2018 | December 31, 2019 | December 31, 2018 | |||||||||||||||
Non-interest expense, as presented | $ | 24,814 | $ | 23,748 | $ | 23,580 | $ | 95,303 | $ | 91,945 | ||||||||||
Net interest income, as presented | $ | 32,239 | $ | 31,923 | $ | 31,587 | $ | 127,630 | $ | 120,393 | ||||||||||
Add: effect of tax-exempt income(1) | 277 | 264 | 251 | 1,029 | 1,022 | |||||||||||||||
Non-interest income, as presented | 11,948 | 10,739 | 9,479 | 42,113 | 38,176 | |||||||||||||||
Add: net loss (gain) on sale of securities | 133 | (1 | ) | 420 | 105 | (275 | ) | |||||||||||||
Adjusted net interest income plus non-interest income | $ | 44,597 | $ | 42,925 | $ | 41,737 | $ | 170,877 | $ | 159,316 | ||||||||||
GAAP efficiency ratio | 56.16 | % | 55.67 | % | 57.42 | % | 56.15 | % | 57.98 | % | ||||||||||
Non-GAAP efficiency ratio | 55.64 | % | 55.32 | % | 56.50 | % | 55.77 | % | 57.71 | % | ||||||||||
(1) Assumed a 21% tax rate.
13
Tangible Book Value Per Share and Tangible Common Equity Ratio: | ||||||||||||
December 31, 2019 | September 30, 2019 | December 31, 2018 | ||||||||||
(In thousands, except number of shares and per share data) | ||||||||||||
Tangible Book Value Per Share: | ||||||||||||
Shareholders' equity, as presented | $ | 473,415 | $ | 471,672 | $ | 435,825 | ||||||
Less: goodwill and other intangible assets | (98,222 | ) | (98,398 | ) | (98,927 | ) | ||||||
Tangible shareholders' equity | $ | 375,193 | $ | 373,274 | $ | 336,898 | ||||||
Shares outstanding at period end | 15,144,719 | 15,224,903 | 15,591,914 | |||||||||
Book value per share | $ | 31.26 | $ | 30.98 | $ | 27.95 | ||||||
Tangible book value per share | $ | 24.77 | $ | 24.52 | $ | 21.61 | ||||||
Tangible Common Equity Ratio: | ||||||||||||
Total assets | $ | 4,429,521 | $ | 4,520,315 | $ | 4,297,435 | ||||||
Less: goodwill and other intangibles | (98,222 | ) | (98,398 | ) | (98,927 | ) | ||||||
Tangible assets | $ | 4,331,299 | $ | 4,421,917 | $ | 4,198,508 | ||||||
Common equity ratio | 10.69 | % | 10.43 | % | 10.14 | % | ||||||
Tangible common equity ratio | 8.66 | % | 8.44 | % | 8.02 | % | ||||||
Core Deposits: | ||||||||||||
(In thousands) | December 31, 2019 | September 30, 2019 | December 31, 2018 | |||||||||
Total deposits | $ | 3,537,743 | $ | 3,617,963 | $ | 3,464,474 | ||||||
Less: certificates of deposit | (521,752 | ) | (541,199 | ) | (443,912 | ) | ||||||
Less: brokered deposits | (191,005 | ) | (250,266 | ) | (363,104 | ) | ||||||
Core deposits | $ | 2,824,986 | $ | 2,826,498 | $ | 2,657,458 | ||||||
Average Core Deposits: | ||||||||||||||||||||
For the Three Months Ended | For the Year Ended | |||||||||||||||||||
(In thousands) | December 31, 2019 | September 30, 2019 | December 31, 2018 | December 31, 2019 | December 31, 2018 | |||||||||||||||
Total average deposits | $ | 3,371,654 | $ | 3,300,599 | $ | 3,000,821 | $ | 3,233,560 | $ | 2,842,619 | ||||||||||
Less: certificates of deposit | (533,416 | ) | (533,110 | ) | (444,769 | ) | (506,971 | ) | (467,631 | ) | ||||||||||
Average core deposits | $ | 2,838,238 | $ | 2,767,489 | $ | 2,556,052 | $ | 2,726,589 | $ | 2,374,988 | ||||||||||
14
 Fourth Quarter Report - 2019