
CONTACT:
Michael Archer
Senior Vice President
Corporate Controller
Camden National Corporation
(800) 860-8821
FOR IMMEDIATE RELEASE
CAMDEN NATIONAL CORPORATION REPORTS
THIRD QUARTER 2020 FINANCIAL RESULTS
Third Quarter 2020 Net Income Increased 16% over Third Quarter 2019
CAMDEN, Maine, October 27, 2020/PRNewswire/--Camden National Corporation (NASDAQ: CAC; “Camden National” or the “Company”), a $5.2 billion bank holding company headquartered in Camden, Maine, reported net income for the third quarter of 2020 of $16.8 million, an increase of $2.3 million, or 16%, compared to the third quarter of 2019. Diluted earnings per share ("EPS") for the third quarter of 2020 was $1.11, an increase of $0.17, or 18%, over the third quarter of 2019.
"This quarter's results demonstrate that our core business is solid and resilient. Our strong earnings for the quarter reflect the collective efforts and tireless work across our Company as we continue to focus on our customers' needs while maintaining our strategic focus," said Gregory A. Dufour, President and Chief Executive Officer of the Company. "Although the last six months have presented unprecedented economic conditions, we took the necessary actions early to preserve the strength of our balance sheet by increasing loan loss reserves over $11 million year-to-date. At the end of the third quarter, our allowance for losses was 1.11% of total loans and 1.19% of total loans when excluding SBA PPP loans1 originated this year, up from 0.81% at the beginning of the year."
Dufour added, "At September 30, 2020, COVID-19-related short-term loan deferrals were 5.5% of total loans, which included nearly $68 million of consumer loans that we automatically deferred for another 90 days after the initial 90-day deferral period matured. This is a significant decrease from June 30, 2020, where our total short-term loan deferrals were 16.4% of total loans at June 30, 2020. Through September 30, 2020, our asset quality continues to be very strong, highlighted by non-performing loans totaling 0.34% and past due loans of 0.18% of total loans at quarter-end, as well as annualized net charge-offs year-to-date of 0.04% of average loans.”
1 This is a non-GAAP measure. Please refer to "Reconciliation of non-GAAP to GAAP Financial Measures" for further details.
THIRD QUARTER 2020 HIGHLIGHTS
•Net income increased by $2.3 million, or 16%, over the third quarter of 2019 and by $5.8 million, or 53%, over the second quarter of 2020.
•Pre-tax, pre-provision earnings1 increased $3.0 million, or 16%, over the third quarter of 2019 and decreased $1.1 million, or 5%, from the second quarter of 2020.
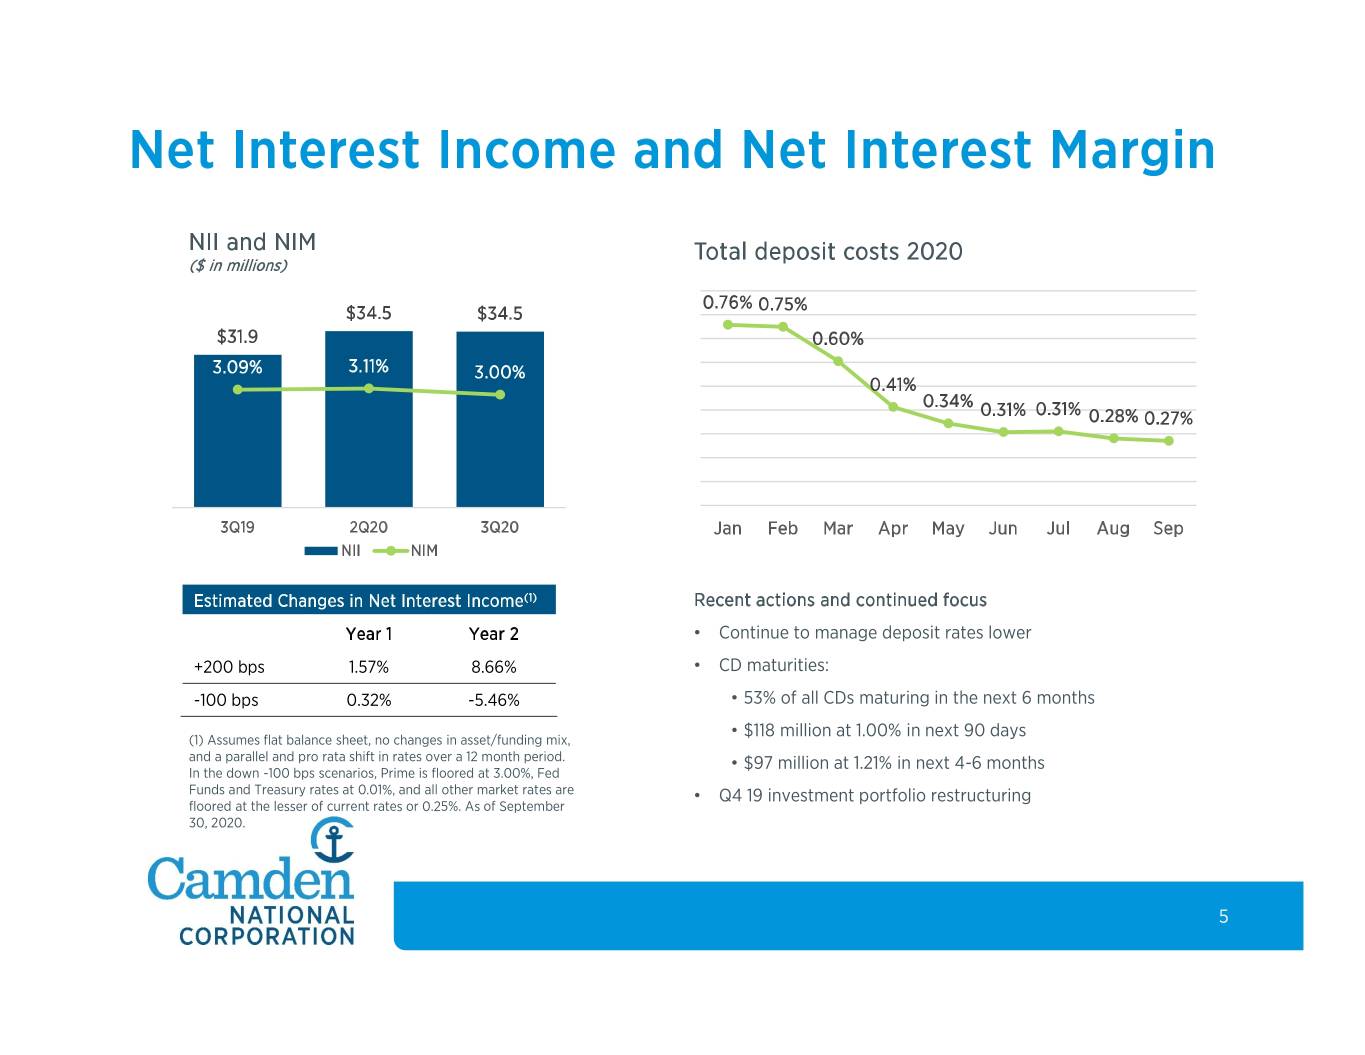
•Net interest margin on a fully-taxable equivalent basis (“net interest margin”) for the third quarter of 2020 was 3.00%, compared to 3.09% for the third quarter of 2019 and 3.11% for the second quarter of 2020.
•5.5% of total loans were operating under a short-term deferral due to COVID-19 at September 30, 2020, compared to 16.4% at June 30, 2020.
•Allowance for loan losses was 1.11% of total loans at September 30, 2020, up from 1.07% at June 30, 2020 and 0.81% at December 31, 2019.
•Non-performing assets were 0.22% of total assets as of September 30, 2020, and annualized net charge-offs were 0.01% and 0.04% of average loans for the three and nine months ended September 30, 2020, respectively.
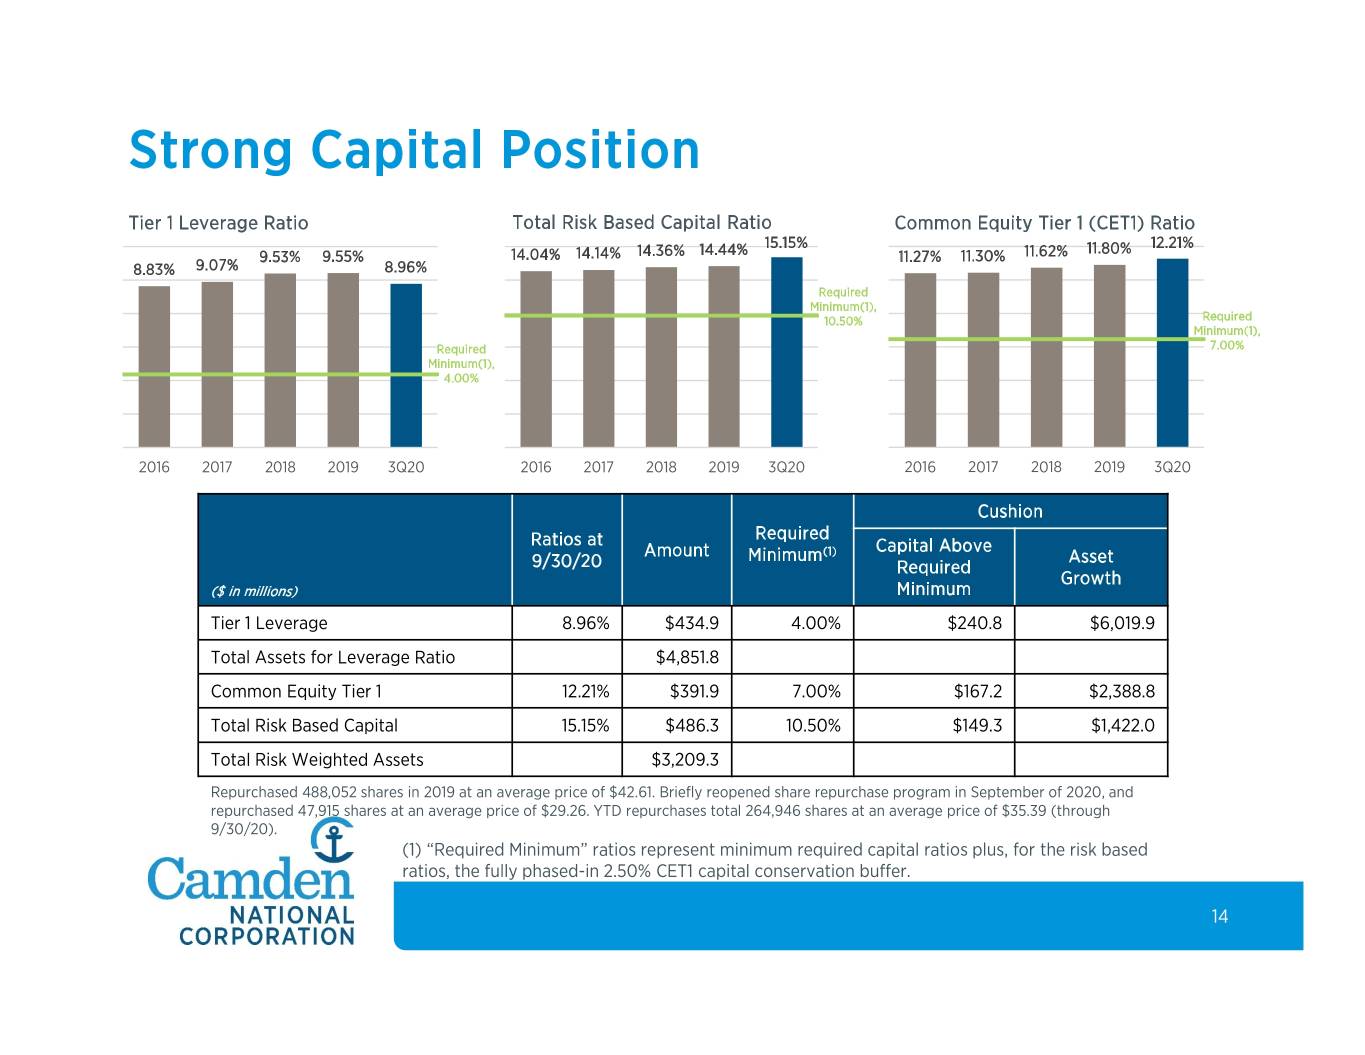
•Capital remains a source of strength, highlighted by regulatory capital ratios well in excess of requirements, including a Total risk-based capital ratio of 15.15% and Tier 1 leverage ratio of 8.96% at September 30, 2020.
FINANCIAL CONDITION
Assets. Total assets increased 16% since December 31, 2019, to $5.2 billion at September 30, 2020. Asset growth for the nine months ended September 30, 2020, was driven by increases in cash, investments and loans.
Cash and Investments. Deposit growth for the nine months ended September 30, 2020, of $686.3 million, or 19%, led to elevated cash and investment balances. Federal stimulus provided to businesses and consumers in response to the COVID-19 pandemic has driven deposit growth and resulted in excess liquidity. At September 30, 2020, cash and investment balances totaled $346.4 million and $1.1 billion, respectively, compared to $75.6 million and $933.1 million at December 31, 2019. At September 30, 2020, the Company's investments designated as available-for-sale (“AFS”) were in an unrealized gain position of $28.7 million, net of tax, compared to $3.3 million, net of tax, at December 31, 2019.
Loans. At September 30, 2020, the Company’s loan portfolio totaled $3.3 billion, compared to $3.1 billion at December 31, 2019. Loan growth for the nine months ended September 30, 2020, was $179.8 million, or 6%, led by (1) Small Business Administration Paycheck Protection Program (“SBA PPP”) loans, which had outstanding loan balances of $223.8 million at September 30, 2020, and (2) commercial real estate loan growth of $90.3 million, or 7%, over this period.
Since the commencement of the SBA PPP in early April 2020, the Company has proudly originated 3,034 loans totaling $244.8 million through September 30, 2020, to businesses across our markets that are in need of support due to the COVID-19 pandemic.
For the nine months ended September 30, 2020, consumer and home equity loans decreased 12% to $297.6 million at September 30, 2020, while residential mortgage loans decreased 2% over the same period to $1.0 billion at September 30, 2020.
For the nine months ended September 30, 2020, the Company originated $727.9 million of residential mortgages and sold 62% of its production to the secondary market. In comparison, for the same period last year, the Company originated $387.8 million and sold 48% of its production. Residential mortgage refinance activity was 59% of originations for the nine months ended September 30, 2020, compared to 31% for the same period last year.
The increase in residential mortgage originations and refinance activity between periods was driven by historically low interest rates for the nine months ended September 30, 2020, highlighted by an average 10-year U.S. Treasury rate of 0.90% over this period.
Deposits and Borrowings. Deposits increased 19% since December 31, 2019, to $4.2 billion at September 30, 2020. The increase in deposits was driven by federal stimulus to businesses and consumers in response to the COVID-19 pandemic, as well as a shift in consumer habits in response to the COVID-19 pandemic, highlighted by the national personal savings rate nearly doubling to 14.1% in August 2020 compared to December 2019. For the nine months ended September 30, 2020, checking account balances grew $514.3 million, or 30%, savings and money market balances grew $187.7 million, or 17%, and brokered deposits grew $100.6 million, or 53%. Over this same period, certificates of deposit (“CDs”) decreased $116.3 million, or 22%.
The Company's loan-to-deposit ratio was 78% at September 30, 2020, compared to 87% at December 31, 2019.
Total borrowings decreased 13% since December 31, 2019 to $294.4 million at September 30, 2020. At September 30, 2020, short-term borrowings of $210.1 million are entirely made up of repurchase agreements.
Shareholders' Equity. At September 30, 2020, the Company's capital position remained well in excess of regulatory requirements, including a Total risk-based capital ratio of 15.15% and a Tier 1 leverage ratio of 8.96%. Additionally, at September 30, 2020, the Company's common equity ratio was 10.04% and tangible common equity ratio1 was 8.30%.
In September 2020, the Company announced a cash dividend to shareholders of $0.33 per share, consistent with that issued for the second quarter of 2020. The cash dividend is payable on October 30, 2020, to shareholders of record as of October 15, 2020. As of September 30, 2020, the Company's annualized dividend yield was 4.37% based on Camden National's closing share price of $30.23, as reported by NASDAQ.
The Company temporarily suspended its share repurchase program during the first quarter of 2020 in response to the COVID-19 pandemic. In September 2020, the Company lifted its suspension and repurchased 47,915 shares. For the nine months ended September 30, 2020, the Company has repurchased 264,946 shares of its common stock. The Company will continue to evaluate its use of the share repurchase program as the impact and our response to the COVID-19 pandemic develops.
ASSET QUALITY
As of September 30, 2020, the Company's asset quality metrics continue to be stable and consistent with past quarters.
•Non-performing assets were 0.22% of total assets at September 30, 2020, compared to 0.23% and 0.25% at June 30, 2020 and December 31, 2019, respectively.
•Past due loans were 0.18% of total loans at September 30, 2020, compared to 0.19% and 0.17% at June 30, 2020 and December 31, 2019, respectively.
•Net charge-offs (annualized) for the third quarter of 2020 were 0.01% of average loans, compared to 0.05% for the second quarter of 2020 and 0.16% for the third quarter of 2019.
COVID-19 Short-Term Deferment Program. In March 2020, the Company began offering temporary debt relief to business and retail customers impacted by the COVID-19 pandemic. All loan modifications made by the Company complied with the terms of the Coronavirus Aid, Relief, and Economic Security Act ("CARES Act") or bank regulator guidance, and, thus, were not individually assessed, designated or accounted for as troubled-debt restructurings.
Short-term debt payment relief was provided to commercial and retail customers for periods up to 180 days, including full and partial principal and/or interest payment relief. At September 30, 2020, loans operating under a short-term deferral arrangement totaled $181.2 million, or 5.5% of total loans at September 30, 2020, of which $67.7 million were retail loans that were provided an automatic 90-day deferment extension upon maturity of the initial 90-day deferment period. In comparison, at June 30, 2020, loan operating under a short-term deferral arrangement totaled $546.7 million, or 16.4% of total loans.
Allowance for Credit Losses and Provision Expense. The provision for credit losses for the three and nine months ended September 30, 2020 was $987,000 and $12.2 million, respectively, compared to $730,000 and $2.6 million for the three and nine months ended September 30, 2019. At September 30, 2020, the Company's allowance for loan losses was $36.4 million, or 1.11% of total loans (1.19% of total loans, excluding SBA PPP loans1), and 3.3 times non-performing loans, compared to $25.2 million, or 0.81% of total loans and 2.3 times non-performing loans, at December 31, 2019. Although asset quality at September 30, 2020 remains strong and COVID-19 deferments have steadily decreased, there continues to be an elevated credit risk throughout the industry given current market conditions, as well as the level of economic, political, and medical uncertainty that remains.
CECL. In the first quarter of 2020, the Company chose to delay its implementation of the current expected credit losses model, commonly referred to as "CECL," in accordance with the provisions of the CARES Act. As such, the reported allowance for credit losses and related provision expense for the three and nine months ended September 30, 2020 was accounted for under the incurred loss model. In accordance with the CARES Act, the Company will effectively adopt CECL on December 31, 2020, retroactively effective as of January 1, 2020.
While the Company has not yet adopted CECL, it estimates that as of September 30, 2020, the allowance for credit losses under CECL, which is comprised of allowance for loan losses and unfunded commitments, would have been $39.0 million to $43.0 million, or 1.19% to 1.31% of total loans, at September 30, 2020.
FINANCIAL OPERATING RESULTS (Q3 2020 vs. Q3 2019)
Net income for the third quarter of 2020 was $16.8 million, an increase of $2.3 million, or 16%, over the third quarter of 2019. Diluted EPS for the third quarter of 2020 was $1.11, an increase of $0.17, or 18%, over the same period last year.
Net Interest Income. Net interest income for the third quarter of 2020 was $34.5 million, an increase of $2.6 million, or 8%, over the third quarter of 2019 due to an increase in average interest-earning assets of 11%, partially offset by a compressed net interest margin of 9 basis points between periods to 3.00% for the third quarter of 2020.
Average interest-earning assets for the third quarter of 2020 were $4.6 billion, an increase of $465.8 million over the third quarter of 2019. Average loans grew 7% between periods to $3.3 billion for the third quarter of 2020, primarily driven by average SBA PPP loans of $221.7 million for the third quarter of 2020, while average cash and investment balances grew 25% to $1.2 billion for the third quarter of 2020.
Net interest margin for the third quarter of 2020 was 3.00%, a decrease of 9 basis points from the third quarter of 2019. The decrease in net interest margin was driven by the current low interest rate environment and change in the mix of interest-earning assets driving down the yield on interest-earning assets by 74 basis points between periods to 3.37% for the third quarter of 2020, whereas the cost of funds decreased 70 basis points between periods to 0.38% for the third quarter of 2020.
Provision for Credit Losses. The provision for credit losses for the third quarter of 2020 was $987,000, an increase of $257,000 compared to the third quarter of 2019.
Non-Interest Income. Non-interest income for the third quarter of 2020 was $12.7 million, an increase of $2.0 million, or 18%, over the third quarter of 2019. The increase was primarily driven by an increase in mortgage
banking income between periods of $2.0 million as the Company’s sold loan production grew by 110% between periods. This increase was partially offset by a decrease in service charges on deposit accounts between periods of $364,000, or 18%. Service charges on deposit accounts primarily decreased between periods due to lower overdraft fees because of elevated deposits across our customers.
Non-Interest Expense. Non-interest expense for the third quarter of 2020 was $25.2 million, an increase of $1.5 million, or 6%, compared to the third quarter of 2019. In the third quarter of 2020, the Company accrued $1.2 million within other expenses for a legal settlement to avoid the burden and expense of litigation. The Company’s efficiency ratio calculated in accordance with generally accepted accounting principles in the United States (“GAAP”) was 53.46% for the third quarter of 2020 and 50.60%1 for the third quarter of 2020 on a non-GAAP basis.
FINANCIAL OPERATING RESULTS (Q3 2020 vs. Q2 2020)
Net income for the third quarter 2020 increased $5.8 million, or 53%, and diluted EPS increased $0.38, or 52%, over the second quarter 2020. The increase between quarters was driven by a decrease in provision expense of $8.4 million.
Net Interest Income. Net interest income for the third quarter 2020 decreased $58,000, compared to the second quarter 2020. The decrease between periods was driven by net interest margin compression of 11 basis points as average cash balances increased $47.8 million, or 28%, to $216.0 million for the third quarter of 2020.
Provision for Credit Losses. Provision for credit losses for the third quarter 2020 decreased $8.4 million, compared to the second quarter 2020. In the second quarter 2020, higher provisions were provided for as reserve levels increased due to the economic environment created by the COVID-19 pandemic, and the Company worked through its COVID-19 loan modifications.
Non-Interest Income. Non-interest income for the third quarter 2020 increased $636,000, or 5%, over the second quarter 2020. The increase between periods was primarily attributable to an increase in service charges on deposit accounts of $269,000 and debit card income of $236,000.
Non-Interest Expense. Non-interest expense for the third quarter 2020 increased $1.7 million, or 7%, over the second quarter 2020. Included in the third quarter 2020, the Company accrued $1.2 million for a legal settlement to avoid the burden and expense of litigation. This was presented within other expenses on the consolidated statements of income.
CONFERENCE CALL
Camden National will host a conference call and webcast at 3:00 p.m., Eastern Time, on Tuesday, October 27, 2020 to discuss its third quarter 2020 financial results and outlook. Participants should dial in to the call 10 - 15 minutes before it begins. Information about the conference call is as follows:
Live dial-in (domestic): (888) 349-0139
Live dial-in (international): (412) 542-4154
Live webcast: https://services.choruscall.com/links/cac201027.html
A link to the live webcast will be available on Camden National's website under "Investor Relations" at www.CamdenNational.com prior to the meeting, and a replay of the webcast will be available on Camden National's website following the conference call. The transcript of the conference call will also be available on Camden National's website approximately two days after the conference call.
ABOUT CAMDEN NATIONAL CORPORATION
Camden National Corporation (NASDAQ:CAC) is the largest publicly traded bank holding company in Northern New England with $5.2 billion in assets and approximately 650 employees. Camden National Bank, its subsidiary, is a full-service community bank founded in 1875 in Camden, Maine. Dedicated to customers at every stage of their financial journey, the bank offers the latest in digital banking, complemented by personalized service with 58 banking centers, 24/7 live phone support, 68 ATMs, and additional lending offices in New Hampshire and Massachusetts. For the past two years, Camden National Bank was named "Customer Experience Leader in U.S. Retail Banking" by Greenwich Associates, and in 2019, it was the only New England based organization included in Sandler O'Neill's "Bank and Thrift Sm-All Star" list of high-performing financial institutions. The Finance Authority of Maine has awarded Camden National Bank as "Lender at Work for Maine" for ten years. Comprehensive wealth management, investment and financial planning services are delivered by Camden National Wealth Management. To learn more, visit CamdenNational.com. Member FDIC.
FORWARD-LOOKING STATEMENTS
Certain statements contained in this press release that are not statements of historical fact constitute forward-looking statements within the meaning of the Private Securities Litigation Reform Act of 1995, as amended, including certain plans, expectations, goals, projections and other statements, which are subject to numerous risks, assumptions and uncertainties. Forward-looking statements can be identified by the fact that they do not relate strictly to historical or current facts. They often include words like “believe,” “expect,” “anticipate,” “estimate,” and “intend” or future or conditional verbs such as “will,” “would,” “should,” “could” or “may.” Certain factors that could cause actual results to differ materially from expected results include increased competitive pressures; changes in the interest rate environment; changes in general economic conditions; operational risks including, but not limited to, cybersecurity, fraud and natural disasters; legislative and regulatory changes that adversely affect the business in which Camden National is engaged; changes in the securities markets and other risks and uncertainties disclosed from time to time in Camden National’s Annual Report on Form 10-K for the year ended December 31, 2019, as updated by other filings with the Securities and Exchange Commission ("SEC"). Further, statements about the potential effects of the COVID-19 pandemic on our business, results of operations and financial condition may constitute forward-looking statements and are subject to the risk that the actual effects may differ, possibly materially, from what is reflected in those forward-looking statements due to factors and future developments that are uncertain, unpredictable and in many cases beyond our control, including the scope and duration of the pandemic, action taken by government authorities in response to the pandemic, and the direct and indirect impact of the pandemic on our customers, service providers and on economies and markets more generally. Camden National does not have any obligation to update forward-looking statements.
USE OF NON-GAAP MEASURES
In addition to evaluating the Company's results of operations in accordance with GAAP, management supplements this evaluation with certain non-GAAP financial measures, such as pre-tax, pre-provision earnings; return on average tangible equity; the efficiency and tangible common equity ratios; tangible book value per share; core deposits and average core deposits; and allowance for loan losses to total loans, excluding SBA PPP loans. Management utilizes these non-GAAP financial measures for purposes of measuring our performance against our peer group and other financial institutions and analyzing our internal performance. We also believe these non-GAAP financial measure help investors better understand the Company's operating performance and trends and allow for better performance comparisons to other financial institutions. In addition, these non-GAAP financial measures remove the impact of unusual items that may obscure trends in the Company's underlying performance. These disclosures should not be viewed as a substitute for GAAP operating results, nor are they necessarily comparable to non-GAAP performance measures that may be presented by other financial institutions. Reconciliation to the comparable GAAP financial measure can be found in this document.
ANNUALIZED DATA
Certain returns, yields and performance ratios are presented on an “annualized” basis. This is done for analytical and decision-making purposes to better discern underlying performance trends when compared to full-year or year-over-year amounts. Annualized data may not be indicative of any four-quarter period, and are presented for illustrative purposes only.
Selected Financial Data
(unaudited)
| At or For The Three Months Ended | At or For The Nine Months Ended | |||||||||||||||||||||||||||||||
(In thousands, except number of shares and per share data) | September 30, 2020 | June 30, 2020 | September 30, 2019 | September 30, 2020 | September 30, 2019 | |||||||||||||||||||||||||||
| Financial Condition Data | ||||||||||||||||||||||||||||||||
| Investments | $ | 1,121,712 | $ | 1,064,089 | $ | 926,444 | $ | 1,121,712 | $ | 926,444 | ||||||||||||||||||||||
| Loans and loans held for sale | 3,312,777 | 3,362,631 | 3,127,083 | 3,312,777 | 3,127,083 | |||||||||||||||||||||||||||
| Allowance for loan losses | 36,414 | 35,539 | 25,688 | 36,414 | 25,688 | |||||||||||||||||||||||||||
| Total assets | 5,153,793 | 4,959,016 | 4,520,315 | 5,153,793 | 4,520,315 | |||||||||||||||||||||||||||
| Deposits | 4,224,044 | 3,996,358 | 3,617,963 | 4,224,044 | 3,617,963 | |||||||||||||||||||||||||||
| Borrowings | 294,361 | 330,229 | 342,459 | 294,361 | 342,459 | |||||||||||||||||||||||||||
| Shareholders' equity | 517,522 | 506,467 | 471,672 | 517,522 | 471,672 | |||||||||||||||||||||||||||
| Operating Data | ||||||||||||||||||||||||||||||||
| Net interest income | $ | 34,481 | $ | 34,539 | $ | 31,923 | $ | 100,846 | $ | 95,391 | ||||||||||||||||||||||
| Provision for credit losses | 987 | 9,398 | 730 | 12,160 | 2,647 | |||||||||||||||||||||||||||
| Non-interest income | 12,696 | 12,060 | 10,739 | 36,159 | 30,165 | |||||||||||||||||||||||||||
| Non-interest expense | 25,221 | 23,509 | 23,748 | 73,291 | 70,489 | |||||||||||||||||||||||||||
| Income before income tax expense | 20,969 | 13,692 | 18,184 | 51,554 | 52,420 | |||||||||||||||||||||||||||
| Income tax expense | 4,194 | 2,752 | 3,696 | 10,346 | 10,455 | |||||||||||||||||||||||||||
| Net income | $ | 16,775 | $ | 10,940 | $ | 14,488 | $ | 41,208 | $ | 41,965 | ||||||||||||||||||||||
| Key Ratios | ||||||||||||||||||||||||||||||||
| Return on average assets | 1.34 | % | 0.90 | % | 1.29 | % | 1.15 | % | 1.28 | % | ||||||||||||||||||||||
| Return on average equity | 13.01 | % | 8.81 | % | 12.26 | % | 11.06 | % | 12.32 | % | ||||||||||||||||||||||
| GAAP efficiency ratio | 53.46 | % | 50.45 | % | 55.67 | % | 53.50 | % | 56.14 | % | ||||||||||||||||||||||
| Net interest margin (fully-taxable equivalent) | 3.00 | % | 3.11 | % | 3.09 | % | 3.06 | % | 3.13 | % | ||||||||||||||||||||||
| Non-performing assets to total assets | 0.22 | % | 0.23 | % | 0.30 | % | 0.22 | % | 0.30 | % | ||||||||||||||||||||||
| Common equity ratio | 10.04 | % | 10.21 | % | 10.43 | % | 10.04 | % | 10.43 | % | ||||||||||||||||||||||
| Tier 1 leverage capital ratio | 8.96 | % | 8.95 | % | 9.39 | % | 8.96 | % | 9.39 | % | ||||||||||||||||||||||
| Common equity tier 1 risk-based capital ratio | 12.21 | % | 11.69 | % | 11.36 | % | 12.21 | % | 11.36 | % | ||||||||||||||||||||||
| Tier 1 risk-based capital ratio | 13.55 | % | 13.01 | % | 12.70 | % | 13.55 | % | 12.70 | % | ||||||||||||||||||||||
| Total risk-based capital ratio | 15.15 | % | 14.56 | % | 13.97 | % | 15.15 | % | 13.97 | % | ||||||||||||||||||||||
| Per Share Data | ||||||||||||||||||||||||||||||||
| Basic earnings per share | $ | 1.12 | $ | 0.73 | $ | 0.94 | $ | 2.74 | $ | 2.70 | ||||||||||||||||||||||
| Diluted earnings per share | $ | 1.11 | $ | 0.73 | $ | 0.94 | $ | 2.73 | $ | 2.70 | ||||||||||||||||||||||
| Cash dividends declared per share | $ | 0.33 | $ | 0.33 | $ | 0.30 | $ | 0.99 | $ | 0.90 | ||||||||||||||||||||||
| Book value per share | $ | 34.69 | $ | 33.85 | $ | 30.98 | $ | 34.69 | $ | 30.98 | ||||||||||||||||||||||
Non-GAAP Measures(1) | ||||||||||||||||||||||||||||||||
| Return on average tangible equity | 16.21 | % | 11.09 | % | 15.67 | % | 13.91 | % | 15.89 | % | ||||||||||||||||||||||
| Efficiency ratio | 50.60 | % | 50.13 | % | 55.32 | % | 52.29 | % | 55.82 | % | ||||||||||||||||||||||
| Pre-tax, pre-provision earnings | $ | 21,956 | $ | 23,090 | $ | 18,914 | $ | 63,714 | $ | 55,067 | ||||||||||||||||||||||
| Allowance for loan losses to total loans, excluding SBA PPP loans | 1.19 | % | 1.14 | % | 0.83 | % | 1.19 | % | 0.83 | % | ||||||||||||||||||||||
| Tangible common equity ratio | 8.30 | % | 8.41 | % | 8.44 | % | 8.30 | % | 8.44 | % | ||||||||||||||||||||||
| Tangible book value per share | $ | 28.14 | $ | 27.31 | $ | 24.52 | $ | 28.14 | $ | 24.52 | ||||||||||||||||||||||
(1) Please see "Reconciliation of non-GAAP to GAAP Financial Measures (unaudited)."
Consolidated Statements of Condition Data
(unaudited)
| (In thousands) | September 30, 2020 | December 31, 2019 | September 30, 2019 | |||||||||||||||||
| ASSETS | ||||||||||||||||||||
| Cash and due from banks | $ | 42,119 | $ | 39,586 | $ | 63,620 | ||||||||||||||
| Interest-bearing deposits in other banks (including restricted cash) | 304,270 | 36,050 | 73,912 | |||||||||||||||||
| Total cash, cash equivalents and restricted cash | 346,389 | 75,636 | 137,532 | |||||||||||||||||
| Investments: | ||||||||||||||||||||
| Available-for-sale securities, at fair value (book value of $1,070,479, $913,978 and $903,988, respectively) | 1,107,069 | 918,118 | 913,523 | |||||||||||||||||
| Held-to-maturity securities, at amortized cost (fair value of $1,403, $1,359 and $1,352, respectively) | 1,298 | 1,302 | 1,303 | |||||||||||||||||
| Other investments | 13,345 | 13,649 | 11,618 | |||||||||||||||||
| Total investments | 1,121,712 | 933,069 | 926,444 | |||||||||||||||||
| Loans held for sale, at fair value (book value of $37,301, $11,915 and $16,630, respectively) | 37,935 | 11,854 | 16,449 | |||||||||||||||||
| Loans: | ||||||||||||||||||||
| Commercial real estate | 1,333,733 | 1,243,397 | 1,255,519 | |||||||||||||||||
Commercial(1) | 375,548 | 442,701 | 445,466 | |||||||||||||||||
| SBA PPP | 223,838 | — | — | |||||||||||||||||
| Residential real estate | 1,044,103 | 1,070,374 | 1,061,898 | |||||||||||||||||
| Consumer and home equity | 297,620 | 338,551 | 347,751 | |||||||||||||||||
| Total loans | 3,274,842 | 3,095,023 | 3,110,634 | |||||||||||||||||
| Less: allowance for loan losses | (36,414) | (25,171) | (25,688) | |||||||||||||||||
| Net loans | 3,238,428 | 3,069,852 | 3,084,946 | |||||||||||||||||
| Goodwill | 94,697 | 94,697 | 94,697 | |||||||||||||||||
| Core deposit intangible assets | 3,014 | 3,525 | 3,701 | |||||||||||||||||
| Bank-owned life insurance | 94,262 | 92,344 | 91,729 | |||||||||||||||||
| Premises and equipment, net | 40,517 | 41,836 | 40,930 | |||||||||||||||||
| Deferred tax assets | 11,195 | 16,823 | 15,656 | |||||||||||||||||
| Other assets | 165,644 | 89,885 | 108,231 | |||||||||||||||||
| Total assets | $ | 5,153,793 | $ | 4,429,521 | $ | 4,520,315 | ||||||||||||||
| LIABILITIES AND SHAREHOLDERS’ EQUITY | ||||||||||||||||||||
| Liabilities | ||||||||||||||||||||
| Deposits: | ||||||||||||||||||||
| Non-interest checking | $ | 800,582 | $ | 552,590 | $ | 573,621 | ||||||||||||||
| Interest checking | 1,419,544 | 1,153,203 | 1,147,627 | |||||||||||||||||
| Savings and money market | 1,306,868 | 1,119,193 | 1,105,290 | |||||||||||||||||
| Certificates of deposit | 405,434 | 521,752 | 541,199 | |||||||||||||||||
| Brokered deposits | 291,616 | 191,005 | 250,226 | |||||||||||||||||
| Total deposits | 4,224,044 | 3,537,743 | 3,617,963 | |||||||||||||||||
| Short-term borrowings | 210,055 | 268,809 | 273,454 | |||||||||||||||||
| Long-term borrowings | 25,000 | 10,000 | 10,000 | |||||||||||||||||
| Subordinated debentures | 59,306 | 59,080 | 59,005 | |||||||||||||||||
| Accrued interest and other liabilities | 117,866 | 80,474 | 88,221 | |||||||||||||||||
| Total liabilities | 4,636,271 | 3,956,106 | 4,048,643 | |||||||||||||||||
| Shareholders’ equity | 517,522 | 473,415 | 471,672 | |||||||||||||||||
| Total liabilities and shareholders’ equity | $ | 5,153,793 | $ | 4,429,521 | $ | 4,520,315 | ||||||||||||||
(1) Includes the HPFC loan portfolio.
Consolidated Statements of Income Data
(unaudited)
| For The Three Months Ended | For The Nine Months Ended | |||||||||||||||||||||||||||||||
| (In thousands, except per share data) | September 30, 2020 | June 30, 2020 | September 30, 2019 | September 30, 2020 | September 30, 2019 | |||||||||||||||||||||||||||
| Interest Income | ||||||||||||||||||||||||||||||||
| Interest and fees on loans | $ | 33,025 | $ | 33,120 | $ | 36,207 | $ | 100,190 | $ | 108,020 | ||||||||||||||||||||||
| Taxable interest on investments | 4,480 | 4,883 | 4,794 | 14,241 | 14,729 | |||||||||||||||||||||||||||
| Nontaxable interest on investments | 823 | 828 | 675 | 2,438 | 1,943 | |||||||||||||||||||||||||||
| Dividend income | 163 | 167 | 158 | 498 | 562 | |||||||||||||||||||||||||||
| Other interest income | 176 | 180 | 686 | 691 | 1,712 | |||||||||||||||||||||||||||
| Total interest income | 38,667 | 39,178 | 42,520 | 118,058 | 126,966 | |||||||||||||||||||||||||||
| Interest Expense | ||||||||||||||||||||||||||||||||
| Interest on deposits | 2,899 | 3,392 | 8,963 | 12,953 | 26,542 | |||||||||||||||||||||||||||
| Interest on borrowings | 394 | 359 | 801 | 1,591 | 2,660 | |||||||||||||||||||||||||||
| Interest on subordinated debentures | 893 | 888 | 833 | 2,668 | 2,373 | |||||||||||||||||||||||||||
| Total interest expense | 4,186 | 4,639 | 10,597 | 17,212 | 31,575 | |||||||||||||||||||||||||||
| Net interest income | 34,481 | 34,539 | 31,923 | 100,846 | 95,391 | |||||||||||||||||||||||||||
| Provision for credit losses | 987 | 9,398 | 730 | 12,160 | 2,647 | |||||||||||||||||||||||||||
| Net interest income after provision for credit losses | 33,494 | 25,141 | 31,193 | 88,686 | 92,744 | |||||||||||||||||||||||||||
| Non-Interest Income | ||||||||||||||||||||||||||||||||
| Mortgage banking income, net | 4,664 | 4,691 | 2,668 | 12,889 | 5,662 | |||||||||||||||||||||||||||
| Debit card income | 2,627 | 2,391 | 2,432 | 7,159 | 6,723 | |||||||||||||||||||||||||||
| Service charges on deposit accounts | 1,606 | 1,337 | 1,970 | 4,955 | 6,202 | |||||||||||||||||||||||||||
| Income from fiduciary services | 1,504 | 1,603 | 1,444 | 4,609 | 4,381 | |||||||||||||||||||||||||||
| Brokerage and insurance commissions | 755 | 622 | 625 | 2,034 | 1,942 | |||||||||||||||||||||||||||
| Bank-owned life insurance | 615 | 614 | 613 | 1,918 | 1,810 | |||||||||||||||||||||||||||
| Customer loan swap fees | 51 | 57 | 109 | 222 | 919 | |||||||||||||||||||||||||||
| Net gain on sale of securities | — | — | 1 | — | 28 | |||||||||||||||||||||||||||
| Other income | 874 | 745 | 877 | 2,373 | 2,498 | |||||||||||||||||||||||||||
| Total non-interest income | 12,696 | 12,060 | 10,739 | 36,159 | 30,165 | |||||||||||||||||||||||||||
| Non-Interest Expense | ||||||||||||||||||||||||||||||||
| Salaries and employee benefits | 13,739 | 13,627 | 13,604 | 41,693 | 40,043 | |||||||||||||||||||||||||||
| Furniture, equipment and data processing | 3,076 | 2,710 | 2,708 | 8,576 | 8,111 | |||||||||||||||||||||||||||
| Net occupancy costs | 1,785 | 1,997 | 1,710 | 5,785 | 5,263 | |||||||||||||||||||||||||||
| Consulting and professional fees | 913 | 1,181 | 892 | 2,877 | 2,679 | |||||||||||||||||||||||||||
| Debit card expense | 972 | 878 | 960 | 2,784 | 2,666 | |||||||||||||||||||||||||||
| Regulatory assessments | 510 | 299 | 182 | 971 | 1,091 | |||||||||||||||||||||||||||
| Amortization of core deposit intangible assets | 170 | 171 | 177 | 511 | 529 | |||||||||||||||||||||||||||
| Other real estate owned and collection costs, net | 71 | 98 | 251 | 270 | 353 | |||||||||||||||||||||||||||
| Other expenses | 3,985 | 2,548 | 3,264 | 9,824 | 9,754 | |||||||||||||||||||||||||||
| Total non-interest expense | 25,221 | 23,509 | 23,748 | 73,291 | 70,489 | |||||||||||||||||||||||||||
| Income before income tax expense | 20,969 | 13,692 | 18,184 | 51,554 | 52,420 | |||||||||||||||||||||||||||
| Income Tax Expense | 4,194 | 2,752 | 3,696 | 10,346 | 10,455 | |||||||||||||||||||||||||||
| Net Income | $ | 16,775 | $ | 10,940 | $ | 14,488 | $ | 41,208 | $ | 41,965 | ||||||||||||||||||||||
| Per Share Data | ||||||||||||||||||||||||||||||||
| Basic earnings per share | $ | 1.12 | $ | 0.73 | $ | 0.94 | $ | 2.74 | $ | 2.70 | ||||||||||||||||||||||
| Diluted earnings per share | $ | 1.11 | $ | 0.73 | $ | 0.94 | $ | 2.73 | $ | 2.70 | ||||||||||||||||||||||
Quarterly Average Balance and Yield/Rate Analysis
(unaudited)
| Average Balance | Yield/Rate | |||||||||||||||||||||||||||||||||||||
| For The Three Months Ended | For The Three Months Ended | |||||||||||||||||||||||||||||||||||||
| (Dollars in thousands) | September 30, 2020 | June 30, 2020 | September 30, 2019 | September 30, 2020 | June 30, 2020 | September 30, 2019 | ||||||||||||||||||||||||||||||||
| Assets | ||||||||||||||||||||||||||||||||||||||
| Interest-earning assets: | ||||||||||||||||||||||||||||||||||||||
Interest-bearing deposits in other banks and other interest-earning assets | $ | 216,027 | $ | 168,221 | $ | 92,352 | 0.09 | % | 0.06 | % | 2.24 | % | ||||||||||||||||||||||||||
| Investments - taxable | 906,374 | 836,885 | 807,591 | 2.11 | % | 2.49 | % | 2.53 | % | |||||||||||||||||||||||||||||
Investments - nontaxable(1) | 122,204 | 124,101 | 98,378 | 3.41 | % | 3.38 | % | 3.47 | % | |||||||||||||||||||||||||||||
Loans(2): | ||||||||||||||||||||||||||||||||||||||
| Commercial real estate | 1,315,958 | 1,302,393 | 1,255,417 | 3.74 | % | 3.83 | % | 4.56 | % | |||||||||||||||||||||||||||||
Commercial(1) | 372,416 | 404,545 | 399,689 | 3.73 | % | 3.78 | % | 4.65 | % | |||||||||||||||||||||||||||||
| SBA PPP | 221,672 | 178,119 | — | 4.16 | % | 3.79 | % | — | % | |||||||||||||||||||||||||||||
Municipal(1) | 19,072 | 19,567 | 22,730 | 3.52 | % | 3.62 | % | 3.60 | % | |||||||||||||||||||||||||||||
| HPFC | 16,104 | 17,659 | 25,973 | 8.09 | % | 9.28 | % | 8.40 | % | |||||||||||||||||||||||||||||
| Residential real estate | 1,083,052 | 1,084,931 | 1,062,728 | 4.00 | % | 4.06 | % | 4.31 | % | |||||||||||||||||||||||||||||
| Consumer and home equity | 305,194 | 321,019 | 347,405 | 4.31 | % | 4.29 | % | 5.38 | % | |||||||||||||||||||||||||||||
| Total loans | 3,333,468 | 3,328,233 | 3,113,942 | 3.92 | % | 3.97 | % | 4.60 | % | |||||||||||||||||||||||||||||
| Total interest-earning assets | 4,578,073 | 4,457,440 | 4,112,263 | 3.37 | % | 3.53 | % | 4.11 | % | |||||||||||||||||||||||||||||
| Other assets | 417,956 | 414,225 | 345,618 | |||||||||||||||||||||||||||||||||||
| Total assets | $ | 4,996,029 | $ | 4,871,665 | $ | 4,457,881 | ||||||||||||||||||||||||||||||||
Liabilities & Shareholders' Equity | ||||||||||||||||||||||||||||||||||||||
| Deposits: | ||||||||||||||||||||||||||||||||||||||
| Non-interest checking | $ | 741,757 | $ | 664,605 | $ | 540,542 | — | % | — | % | — | % | ||||||||||||||||||||||||||
| Interest checking | 1,339,389 | 1,298,468 | 1,130,632 | 0.26 | % | 0.28 | % | 0.96 | % | |||||||||||||||||||||||||||||
| Savings | 557,718 | 518,803 | 474,096 | 0.06 | % | 0.06 | % | 0.08 | % | |||||||||||||||||||||||||||||
| Money market | 737,782 | 717,056 | 622,219 | 0.35 | % | 0.37 | % | 1.32 | % | |||||||||||||||||||||||||||||
| Certificates of deposit | 417,788 | 477,068 | 533,110 | 1.07 | % | 1.34 | % | 1.64 | % | |||||||||||||||||||||||||||||
| Total deposits | 3,794,434 | 3,676,000 | 3,300,599 | 0.29 | % | 0.35 | % | 0.85 | % | |||||||||||||||||||||||||||||
| Borrowings: | ||||||||||||||||||||||||||||||||||||||
| Brokered deposits | 242,390 | 234,823 | 305,019 | 0.26 | % | 0.28 | % | 2.42 | % | |||||||||||||||||||||||||||||
Customer repurchase agreements | 194,937 | 209,302 | 234,362 | 0.42 | % | 0.56 | % | 1.26 | % | |||||||||||||||||||||||||||||
| Subordinated debentures | 59,269 | 59,194 | 58,998 | 6.00 | % | 6.03 | % | 5.60 | % | |||||||||||||||||||||||||||||
| Other borrowings | 73,370 | 76,983 | 11,273 | 1.02 | % | 0.35 | % | 1.96 | % | |||||||||||||||||||||||||||||
| Total borrowings | 569,966 | 580,302 | 609,652 | 1.01 | % | 0.98 | % | 2.27 | % | |||||||||||||||||||||||||||||
| Total funding liabilities | 4,364,400 | 4,256,302 | 3,910,251 | 0.38 | % | 0.44 | % | 1.08 | % | |||||||||||||||||||||||||||||
| Other liabilities | 118,727 | 115,914 | 78,710 | |||||||||||||||||||||||||||||||||||
| Shareholders' equity | 512,902 | 499,449 | 468,920 | |||||||||||||||||||||||||||||||||||
Total liabilities & shareholders' equity | $ | 4,996,029 | $ | 4,871,665 | $ | 4,457,881 | ||||||||||||||||||||||||||||||||
| Net interest rate spread (fully-taxable equivalent) | 2.99 | % | 3.09 | % | 3.03 | % | ||||||||||||||||||||||||||||||||
| Net interest margin (fully-taxable equivalent) | 3.00 | % | 3.11 | % | 3.09 | % | ||||||||||||||||||||||||||||||||
Net interest margin (fully-taxable equivalent), excluding fair value mark accretion and collection of previously charged-off acquired loans(3) | 2.96 | % | 3.07 | % | 3.05 | % | ||||||||||||||||||||||||||||||||
(1) Reported on a tax-equivalent basis calculated using the federal corporate income tax rate of 21%, including certain commercial loans.
(2) Non-accrual loans and loans held for sale are included in total average loans.
(3) Excludes the impact of the fair value mark accretion on loans and certificates of deposit generated in purchase accounting and collection of previously charged-off acquired loans for the three months ended September 30, 2020, June 30, 2020 and September 30, 2019 totaling $453,000, $403,000 and $409,000, respectively.
Year-to-Date Average Balance and Yield/Rate Analysis
(unaudited)
| Average Balance | Yield/Rate | |||||||||||||||||||||||||
| For The Nine Months Ended | For The Nine Months Ended | |||||||||||||||||||||||||
| (Dollars in thousands) | September 30, 2020 | September 30, 2019 | September 30, 2020 | September 30, 2019 | ||||||||||||||||||||||
| Assets | ||||||||||||||||||||||||||
| Interest-earning assets: | ||||||||||||||||||||||||||
Interest-bearing deposits in other banks and other interest-earning assets | $ | 150,383 | $ | 63,146 | 0.25 | % | 2.26 | % | ||||||||||||||||||
| Investments - taxable | 850,970 | 832,780 | 2.37 | % | 2.55 | % | ||||||||||||||||||||
Investments - nontaxable(1) | 121,284 | 94,405 | 3.39 | % | 3.47 | % | ||||||||||||||||||||
Loans(2): | ||||||||||||||||||||||||||
| Commercial real estate | 1,297,364 | 1,263,934 | 3.93 | % | 4.66 | % | ||||||||||||||||||||
Commercial(1) | 397,754 | 386,338 | 3.91 | % | 4.69 | % | ||||||||||||||||||||
| SBA PPP | 133,569 | — | 4.00 | % | — | % | ||||||||||||||||||||
Municipal(1) | 18,545 | 19,421 | 3.60 | % | 3.56 | % | ||||||||||||||||||||
| HPFC | 18,026 | 29,183 | 8.38 | % | 8.03 | % | ||||||||||||||||||||
| Residential real estate | 1,082,276 | 1,034,609 | 4.08 | % | 4.31 | % | ||||||||||||||||||||
| Consumer and home equity | 320,273 | 347,201 | 4.55 | % | 5.43 | % | ||||||||||||||||||||
| Total loans | 3,267,807 | 3,080,686 | 4.06 | % | 4.66 | % | ||||||||||||||||||||
| Total interest-earning assets | 4,390,444 | 4,071,017 | 3.59 | % | 4.16 | % | ||||||||||||||||||||
| Other assets | 395,621 | 321,060 | ||||||||||||||||||||||||
| Total assets | $ | 4,786,065 | $ | 4,392,077 | ||||||||||||||||||||||
| Liabilities & Shareholders' Equity | ||||||||||||||||||||||||||
| Deposits: | ||||||||||||||||||||||||||
| Non-interest checking | $ | 645,640 | $ | 505,733 | — | % | — | % | ||||||||||||||||||
| Interest checking | 1,261,831 | 1,108,999 | 0.40 | % | 0.98 | % | ||||||||||||||||||||
| Savings | 517,936 | 478,573 | 0.06 | % | 0.08 | % | ||||||||||||||||||||
| Money market | 701,872 | 595,659 | 0.55 | % | 1.27 | % | ||||||||||||||||||||
| Certificates of deposit | 482,076 | 498,059 | 1.36 | % | 1.54 | % | ||||||||||||||||||||
| Total deposits | 3,609,355 | 3,187,023 | 0.44 | % | 0.83 | % | ||||||||||||||||||||
| Borrowings: | ||||||||||||||||||||||||||
| Brokered deposits | 228,483 | 360,066 | 0.65 | % | 2.49 | % | ||||||||||||||||||||
| Customer repurchase agreements | 213,463 | 239,917 | 0.71 | % | 1.27 | % | ||||||||||||||||||||
| Subordinated debentures | 59,195 | 58,997 | 6.02 | % | 5.38 | % | ||||||||||||||||||||
| Other borrowings | 69,883 | 23,847 | 0.88 | % | 2.17 | % | ||||||||||||||||||||
| Total borrowings | 571,024 | 682,827 | 1.26 | % | 2.30 | % | ||||||||||||||||||||
| Total funding liabilities | 4,180,379 | 3,869,850 | 0.55 | % | 1.09 | % | ||||||||||||||||||||
| Other liabilities | 108,122 | 66,966 | ||||||||||||||||||||||||
| Shareholders' equity | 497,564 | 455,261 | ||||||||||||||||||||||||
| Total liabilities & shareholders' equity | $ | 4,786,065 | $ | 4,392,077 | ||||||||||||||||||||||
| Net interest rate spread (fully-taxable equivalent) | 3.04 | % | 3.07 | % | ||||||||||||||||||||||
| Net interest margin (fully-taxable equivalent) | 3.06 | % | 3.13 | % | ||||||||||||||||||||||
Net interest margin (fully-taxable equivalent), excluding fair value mark accretion and collection of previously charged-off acquired loans(3) | 3.03 | % | 3.09 | % | ||||||||||||||||||||||
(1) Reported on a tax-equivalent basis calculated using the federal corporate income tax rate of 21%, including certain commercial loans.
(2) Non-accrual loans and loans held for sale are included in total average loans.
(3) Excludes the impact of the fair value mark accretion on loans and certificates of deposit generated in purchase accounting and collection of previously charged-off acquired loans for the nine months ended September 30, 2020 and September 30, 2019 totaling $1.1 million and $1.2 million, respectively.
Asset Quality Data | ||||||||||||||||||||||||||||||||
(unaudited) | ||||||||||||||||||||||||||||||||
| (In thousands) | At or For The Nine Months Ended September 30, 2020 | At or For The Six Months Ended June 30, 2020 | At or For The Three Months Ended March 31, 2020 | At or For The Year Ended December 31, 2019 | At or For The Nine Months Ended September 30, 2019 | |||||||||||||||||||||||||||
| Non-accrual loans: | ||||||||||||||||||||||||||||||||
| Residential real estate | $ | 4,017 | $ | 4,664 | $ | 3,499 | $ | 4,096 | $ | 5,152 | ||||||||||||||||||||||
| Commercial real estate | 565 | 432 | 646 | 1,122 | 1,156 | |||||||||||||||||||||||||||
| Commercial | 605 | 699 | 748 | 420 | 751 | |||||||||||||||||||||||||||
| Consumer and home equity | 2,503 | 2,371 | 2,102 | 2,154 | 2,616 | |||||||||||||||||||||||||||
| HPFC | 509 | 392 | 322 | 364 | 450 | |||||||||||||||||||||||||||
| Total non-accrual loans | 8,199 | 8,558 | 7,317 | 8,156 | 10,125 | |||||||||||||||||||||||||||
Accruing troubled-debt restructured loans not included above | 2,952 | 2,874 | 3,008 | 2,993 | 3,259 | |||||||||||||||||||||||||||
| Total non-performing loans | 11,151 | 11,432 | 10,325 | 11,149 | 13,384 | |||||||||||||||||||||||||||
| Other real estate owned | — | 118 | 94 | 94 | 94 | |||||||||||||||||||||||||||
| Total non-performing assets | $ | 11,151 | $ | 11,550 | $ | 10,419 | $ | 11,243 | $ | 13,478 | ||||||||||||||||||||||
| Loans 30-89 days past due: | ||||||||||||||||||||||||||||||||
| Residential real estate | $ | 1,784 | $ | 4,016 | $ | 1,781 | $ | 2,227 | $ | 1,447 | ||||||||||||||||||||||
| Commercial real estate | 2,056 | 1,625 | 2,641 | 1,582 | 2,242 | |||||||||||||||||||||||||||
| Commercial | 1,315 | 95 | 1,560 | 548 | 1,135 | |||||||||||||||||||||||||||
| Consumer and home equity | 434 | 388 | 1,379 | 750 | 822 | |||||||||||||||||||||||||||
| HPFC | 323 | 128 | 165 | 243 | 193 | |||||||||||||||||||||||||||
Total loans 30-89 days past due | $ | 5,912 | $ | 6,252 | $ | 7,526 | $ | 5,350 | $ | 5,839 | ||||||||||||||||||||||
Allowance for loan losses at the beginning of the period | $ | 25,171 | $ | 25,171 | $ | 25,171 | $ | 24,712 | $ | 24,712 | ||||||||||||||||||||||
| Provision for loan losses | 12,172 | 11,172 | 1,772 | 2,862 | 2,658 | |||||||||||||||||||||||||||
| Charge-offs: | ||||||||||||||||||||||||||||||||
| Residential real estate | 121 | 96 | 96 | 462 | 436 | |||||||||||||||||||||||||||
| Commercial real estate | 104 | 71 | 50 | 300 | 157 | |||||||||||||||||||||||||||
| Commercial | 857 | 673 | 253 | 1,167 | 636 | |||||||||||||||||||||||||||
| Consumer and home equity | 199 | 134 | 91 | 713 | 670 | |||||||||||||||||||||||||||
| HPFC | — | — | — | 71 | 11 | |||||||||||||||||||||||||||
| Total charge-offs | 1,281 | 974 | 490 | 2,713 | 1,910 | |||||||||||||||||||||||||||
| Total recoveries | (352) | (170) | (68) | (310) | (228) | |||||||||||||||||||||||||||
| Net charge-offs | 929 | 804 | 422 | 2,403 | 1,682 | |||||||||||||||||||||||||||
Allowance for loan losses at the end of the period | $ | 36,414 | $ | 35,539 | $ | 26,521 | $ | 25,171 | $ | 25,688 | ||||||||||||||||||||||
Components of allowance for credit losses: | ||||||||||||||||||||||||||||||||
Allowance for loan losses | $ | 36,414 | $ | 35,539 | $ | 26,521 | $ | 25,171 | $ | 25,688 | ||||||||||||||||||||||
Liability for unfunded credit commitments | 9 | 22 | 24 | 21 | 11 | |||||||||||||||||||||||||||
| Allowance for credit losses | $ | 36,423 | $ | 35,561 | $ | 26,545 | $ | 25,192 | $ | 25,699 | ||||||||||||||||||||||
| Ratios: | ||||||||||||||||||||||||||||||||
Non-performing loans to total loans | 0.34 | % | 0.34 | % | 0.33 | % | 0.36 | % | 0.43 | % | ||||||||||||||||||||||
Non-performing assets to total assets | 0.22 | % | 0.23 | % | 0.23 | % | 0.25 | % | 0.30 | % | ||||||||||||||||||||||
Allowance for loan losses to total loans | 1.11 | % | 1.07 | % | 0.84 | % | 0.81 | % | 0.83 | % | ||||||||||||||||||||||
Allowance for loan losses to total loans, excluding SBA PPP loans(1) | 1.19 | % | 1.14 | % | 0.84 | % | 0.81 | % | 0.83 | % | ||||||||||||||||||||||
Net charge-offs to average loans (annualized): | ||||||||||||||||||||||||||||||||
Quarter-to-date | 0.01 | % | 0.05 | % | 0.05 | % | 0.09 | % | 0.16 | % | ||||||||||||||||||||||
Year-to-date | 0.04 | % | 0.05 | % | 0.05 | % | 0.08 | % | 0.07 | % | ||||||||||||||||||||||
Allowance for loan losses to non-performing loans | 326.55 | % | 310.87 | % | 256.86 | % | 225.77 | % | 191.93 | % | ||||||||||||||||||||||
Loans 30-89 days past due to total loans | 0.18 | % | 0.19 | % | 0.24 | % | 0.17 | % | 0.19 | % | ||||||||||||||||||||||
(1) This is a non-GAAP measure. Please refer to "Reconciliation of non-GAAP to GAAP Financial Measures (unaudited)" for further details.
Reconciliation of non-GAAP to GAAP Financial Measures (unaudited)
Return on Average Tangible Equity: | ||||||||||||||||||||||||||||||||
| For the Three Months Ended | For the Nine Months Ended | |||||||||||||||||||||||||||||||
| (Dollars in thousands) | September 30, 2020 | June 30, 2020 | September 30, 2019 | September 30, 2020 | September 30, 2019 | |||||||||||||||||||||||||||
| Net income, as presented | $ | 16,775 | $ | 10,940 | $ | 14,488 | $ | 41,208 | $ | 41,965 | ||||||||||||||||||||||
Add: amortization of core deposit intangible assets, net of tax(1) | 134 | 135 | 140 | 404 | 418 | |||||||||||||||||||||||||||
| Net income, adjusted for amortization of core deposit intangible assets | $ | 16,909 | $ | 11,075 | $ | 14,628 | $ | 41,612 | $ | 42,383 | ||||||||||||||||||||||
| Average equity, as presented | $ | 512,902 | $ | 499,449 | $ | 468,920 | $ | 497,564 | $ | 455,261 | ||||||||||||||||||||||
| Less: average goodwill and core deposit intangible assets | (97,794) | (97,965) | (98,484) | (97,967) | (98,659) | |||||||||||||||||||||||||||
Average tangible equity | $ | 415,108 | $ | 401,484 | $ | 370,436 | $ | 399,597 | $ | 356,602 | ||||||||||||||||||||||
| Return on average equity | 13.01 | % | 8.81 | % | 12.26 | % | 11.06 | % | 12.32 | % | ||||||||||||||||||||||
| Return on average tangible equity | 16.21 | % | 11.09 | % | 15.67 | % | 13.91 | % | 15.89 | % | ||||||||||||||||||||||
(1) Assumed a 21% tax rate.
| Efficiency Ratio: | ||||||||||||||||||||||||||||||||
| For the Three Months Ended | For the Nine Months Ended | |||||||||||||||||||||||||||||||
| (Dollars in thousands) | September 30, 2020 | June 30, 2020 | September 30, 2019 | September 30, 2020 | September 30, 2019 | |||||||||||||||||||||||||||
| Non-interest expense, as presented | $ | 25,221 | $ | 23,509 | $ | 23,748 | $ | 73,291 | $ | 70,489 | ||||||||||||||||||||||
| Less: legal settlement | (1,200) | — | — | (1,200) | — | |||||||||||||||||||||||||||
| Adjusted non-interest expense | $ | 24,021 | $ | 23,509 | $ | 23,748 | $ | 72,091 | $ | 70,489 | ||||||||||||||||||||||
| Net interest income, as presented | $ | 34,481 | $ | 34,539 | $ | 31,923 | $ | 100,846 | $ | 95,391 | ||||||||||||||||||||||
Add: effect of tax-exempt income(1) | 292 | 295 | 264 | 865 | 752 | |||||||||||||||||||||||||||
| Non-interest income, as presented | 12,696 | 12,060 | 10,739 | 36,159 | 30,165 | |||||||||||||||||||||||||||
| Less: net gain on sale of securities | — | — | (1) | — | (28) | |||||||||||||||||||||||||||
Adjusted net interest income plus non-interest income | $ | 47,469 | $ | 46,894 | $ | 42,925 | $ | 137,870 | $ | 126,280 | ||||||||||||||||||||||
| GAAP efficiency ratio | 53.46 | % | 50.45 | % | 55.67 | % | 53.50 | % | 56.14 | % | ||||||||||||||||||||||
| Non-GAAP efficiency ratio | 50.60 | % | 50.13 | % | 55.32 | % | 52.29 | % | 55.82 | % | ||||||||||||||||||||||
(1) Assumed a 21% tax rate.
| Pre-tax, Pre-provision Earnings: | ||||||||||||||||||||||||||||||||
| For the Three Months Ended | For the Nine Months Ended | |||||||||||||||||||||||||||||||
| (In thousands) | September 30, 2020 | June 30, 2020 | September 30, 2019 | September 30, 2020 | September 30, 2019 | |||||||||||||||||||||||||||
| Net income, as presented | $ | 16,775 | $ | 10,940 | $ | 14,488 | $ | 41,208 | $ | 41,965 | ||||||||||||||||||||||
| Add: provision for credit losses | 987 | 9,398 | 730 | 12,160 | 2,647 | |||||||||||||||||||||||||||
| Add: income tax expense | 4,194 | 2,752 | 3,696 | 10,346 | 10,455 | |||||||||||||||||||||||||||
| Pre-tax, pre-provision earnings | $ | 21,956 | $ | 23,090 | $ | 18,914 | $ | 63,714 | $ | 55,067 | ||||||||||||||||||||||
| Allowance for loan losses to total loans, excluding SBA PPP loans: | ||||||||||||||||||||
| (In thousands) | September 30, 2020 | June 30, 2020 | September 30, 2019 | |||||||||||||||||
| Allowance for loan losses, as presented | $ | 36,414 | $ | 35,539 | $ | 25,688 | ||||||||||||||
| Less: allowance for loan losses on SBA PPP loans | (115) | (113) | — | |||||||||||||||||
| Adjusted allowance for loan losses | $ | 36,299 | $ | 35,426 | $ | 25,688 | ||||||||||||||
| Total loans, as presented | $ | 3,274,842 | $ | 3,326,041 | $ | 3,110,634 | ||||||||||||||
| Less: SBA PPP loans | (223,838) | (218,803) | — | |||||||||||||||||
| Adjusted total loans | $ | 3,051,004 | $ | 3,107,238 | $ | 3,110,634 | ||||||||||||||
| Allowance for loan losses to total loans | 1.11 | % | 1.07 | % | 0.83 | % | ||||||||||||||
| Allowance for loan losses to total loans, excluding SBA PPP loans | 1.19 | % | 1.14 | % | 0.83 | % | ||||||||||||||
| Tangible Book Value Per Share and Tangible Common Equity Ratio: | ||||||||||||||||||||
| September 30, 2020 | June 30, 2020 | September 30, 2019 | ||||||||||||||||||
| (In thousands, except number of shares, per share data and ratios) | ||||||||||||||||||||
| Tangible Book Value Per Share: | ||||||||||||||||||||
| Shareholders' equity, as presented | $ | 517,522 | $ | 506,467 | $ | 471,672 | ||||||||||||||
| Less: goodwill and other intangible assets | (97,711) | (97,881) | (98,398) | |||||||||||||||||
| Tangible shareholders' equity | $ | 419,811 | $ | 408,586 | $ | 373,274 | ||||||||||||||
| Shares outstanding at period end | 14,917,344 | 14,963,041 | 15,224,903 | |||||||||||||||||
| Book value per share | $ | 34.69 | $ | 33.85 | $ | 30.98 | ||||||||||||||
| Tangible book value per share | $ | 28.14 | $ | 27.31 | $ | 24.52 | ||||||||||||||
| Tangible Common Equity Ratio: | ||||||||||||||||||||
| Total assets | $ | 5,153,793 | $ | 4,959,016 | $ | 4,520,315 | ||||||||||||||
| Less: goodwill and other intangible assets | (97,711) | (97,881) | (98,398) | |||||||||||||||||
| Tangible assets | $ | 5,056,082 | $ | 4,861,135 | $ | 4,421,917 | ||||||||||||||
| Common equity ratio | 10.04 | % | 10.21 | % | 10.43 | % | ||||||||||||||
| Tangible common equity ratio | 8.30 | % | 8.41 | % | 8.44 | % | ||||||||||||||
| Core Deposits: | ||||||||||||||||||||
| (In thousands) | September 30, 2020 | June 30, 2020 | September 30, 2019 | |||||||||||||||||
| Total deposits | $ | 4,224,044 | $ | 3,996,358 | $ | 3,617,963 | ||||||||||||||
| Less: certificates of deposit | (405,434) | (431,376) | (541,199) | |||||||||||||||||
| Less: brokered deposits | (291,616) | (224,777) | (250,226) | |||||||||||||||||
| Core deposits | $ | 3,526,994 | $ | 3,340,205 | $ | 2,826,538 | ||||||||||||||
| Average Core Deposits: | ||||||||||||||||||||||||||||||||
| For the Three Months Ended | For the Nine Months Ended | |||||||||||||||||||||||||||||||
| (In thousands) | September 30, 2020 | June 30, 2020 | September 30, 2019 | September 30, 2020 | September 30, 2019 | |||||||||||||||||||||||||||
| Total average deposits | $ | 3,794,434 | $ | 3,676,000 | $ | 3,300,599 | $ | 3,609,355 | $ | 3,187,023 | ||||||||||||||||||||||
| Less: average certificates of deposit | (417,788) | (477,068) | (533,110) | (482,076) | (498,059) | |||||||||||||||||||||||||||
| Average core deposits | $ | 3,376,646 | $ | 3,198,932 | $ | 2,767,489 | $ | 3,127,279 | $ | 2,688,964 | ||||||||||||||||||||||




 Third Quarter Report - 2020