CONTACT:
Michael Archer
Senior Vice President
Corporate Controller
Camden National Corporation
(800) 860-8821
FOR IMMEDIATE RELEASE
CAMDEN NATIONAL CORPORATION REPORTS
FIRST QUARTER 2020 FINANCIAL RESULTS
First Quarter 2020 Net Income of $13.5 Million and Diluted Earnings Per Share of $0.89
CAMDEN, Maine, April 28, 2020/PRNewswire/--Camden National Corporation (NASDAQ: CAC; “Camden National” or the “Company”), a $4.6 billion bank holding company headquartered in Camden, Maine, reported net income for the first quarter of 2020 of $13.5 million, a decrease of 5% compared to the first quarter of 2019, and diluted earnings per share ("EPS") of $0.89, a decrease of 2% over the same period. For the first quarter of 2020, the Company's return on average assets was 1.21% and return on average equity was 11.30%.
"These are unprecedented times – in just a few weeks, our focus shifted from working towards our long-term operational and financial goals to one that is focused on the next several quarters," said Gregory A. Dufour, President and Chief Executive Officer of the Company. "We entered this uncertain social and economic period in a strong financial position, which we fortified during the first quarter by adding about $1.4 million to our allowance for loan losses."
Dufour reported the Company’s response to the pandemic has been focused on its employees, customers and communities. "I'm extremely proud of the Camden National team and our quick response to this health crisis," he said. "In a matter of weeks, we transitioned over half of our employees to work from home, instituted a debt relief program to support customers impacted by COVID-19, and successfully rolled-out the Small Business Administration (SBA) Paycheck Protection Program to hundreds of businesses in need. The critical role banking plays for our customers and communities is magnified during times like these, and I feel very fortunate to see first-hand the actions the team has taken to serve our customers, communities and each other during these difficult times."
FINANCIAL HIGHLIGHTS
• | First quarter 2020 net income of $13.5 million decreased 5% compared to the first quarter of 2019 and 11% compared to the fourth quarter of 2019, driven by higher provision expense |
• | Loans and loans held for sale grew 3% in the first quarter of 2020 |
• | First quarter 2020 net interest margin of 3.08% decreased 10 basis points compared to the first quarter of 2019 and 4 basis points compared to the fourth quarter of 2019 |
• | Delayed implementation of the new accounting guidance for expected credit losses, commonly referred to as "CECL" |
• | Strong asset quality as of March 31, 2020, however, first quarter 2020 provision for credit losses increased $1.0 million over the first quarter of 2019 and $1.6 million over the fourth quarter of 2019 due to the COVID-19 pandemic |
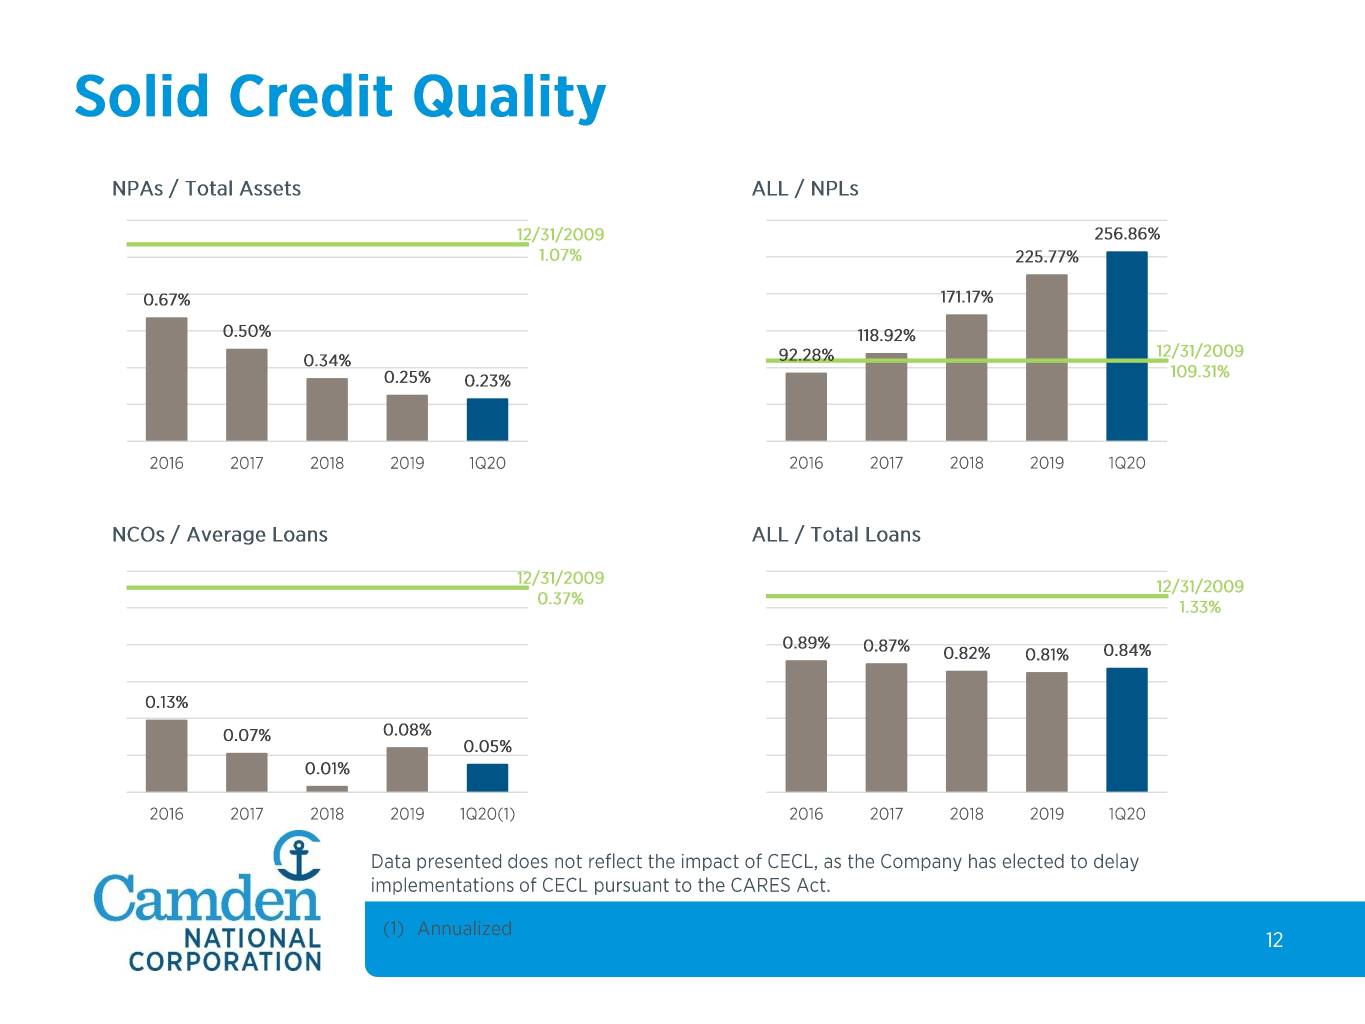
• | At March 31, 2020, the allowance for loan losses was 0.84% of total loans and 2.6 times non-performing loans |
• | Repurchased 217,031 shares of the Company's common stock in the first quarter of 2020 before suspending repurchases in March to prioritize capital preservation during the COVID-19 pandemic |
FINANCIAL CONDITION
Assets. Total assets increased 4% since December 31, 2019 to $4.6 billion at March 31, 2020. The increase was driven by: (i) loan growth, including loans held for sale, of $78.6 million, or 3%; (ii) an increase in other assets of $72.1 million, primarily driven by an increase in interest rate swaps and related collateral; and (iii) an increase in investment balances of $43.4 million.
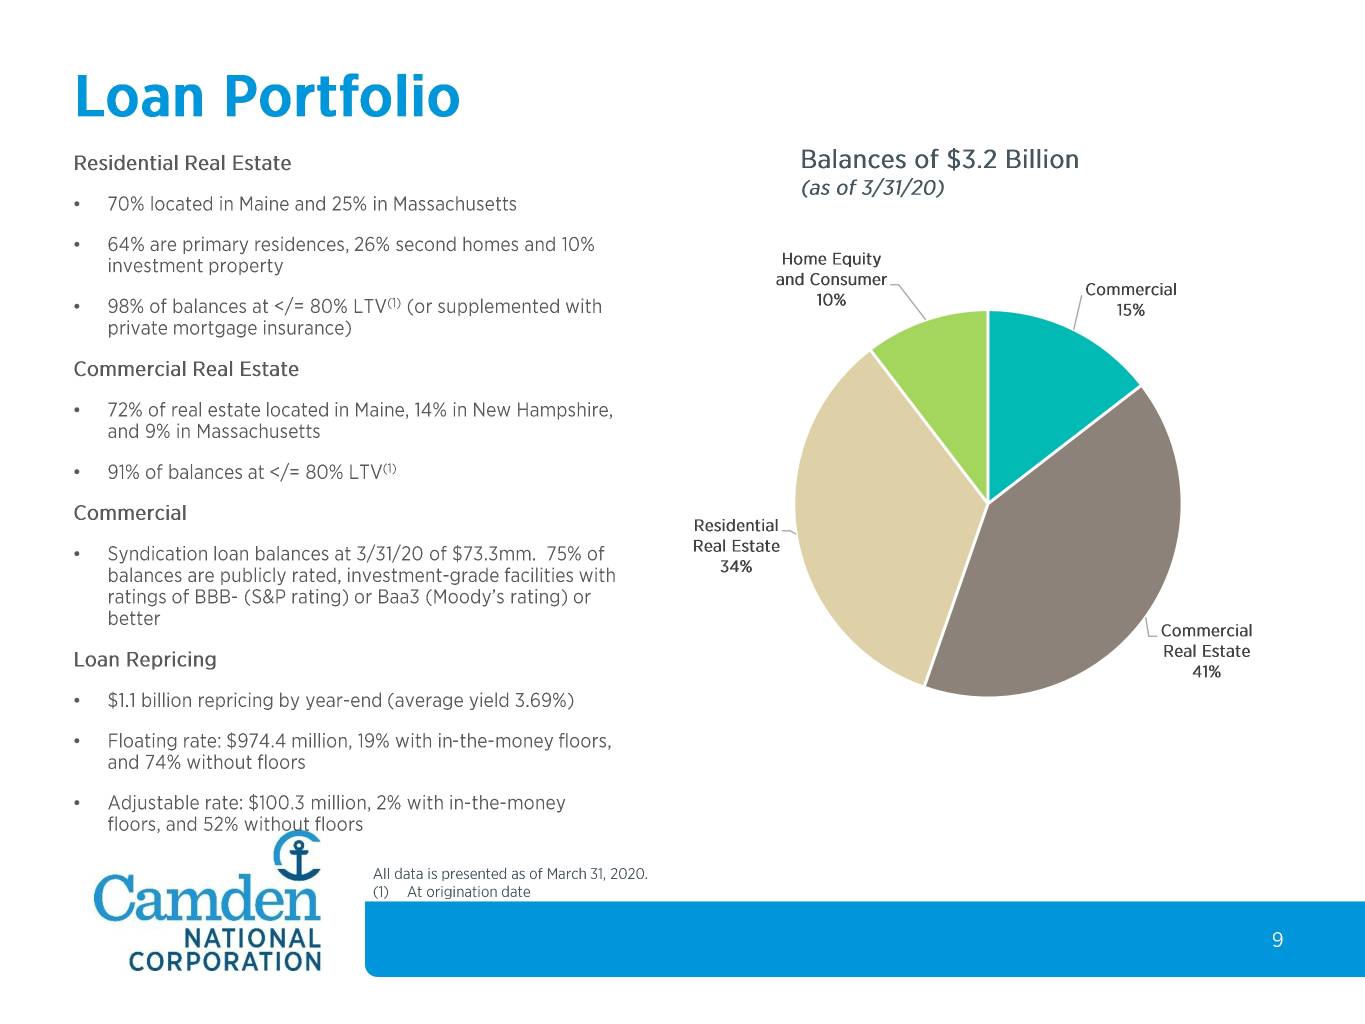
In the first quarter of 2020, commercial real estate and commercial loan portfolios each grew 5%, driving net loan growth, while the consumer and home equity loan portfolio decreased 2%, and the residential mortgage loan portfolio decreased 1%.
In the first quarter of 2020, the Company originated $156.3 million of residential mortgages and sold 44% of its production to the secondary market. In comparison, in the first and fourth quarter of 2019, the Company originated $86.4 million and $182.5 million, respectively, of residential mortgages. Refinance activity was 61% of residential mortgage production for the first quarter of 2020, compared to 31% and 50% for the first and fourth quarter of 2019, respectively.
Deposits and Borrowings. Deposits increased 1% since December 31, 2019 to $3.6 billion at March 31, 2020. In the first quarter of 2020, savings and money market deposits grew 2% and certificates of deposit grew 4%, while checking account and brokered deposits each decreased 1%. The decrease in checking account balances was primarily driven by certain large depositors' balances reducing interest checking balances by $20.7 million. The Company did not see its normal core deposit1 outflows in the first quarter of 2020, likely because of changes in customer behavior due to the COVID-19 pandemic.
The Company's loan-to-deposit ratio was 89% at March 31, 2020, compared to 87% at December 31, 2019 and 85% at March 31, 2019.
Total borrowings increased $83.0 million since December 31, 2019 to $420.9 million at March 31, 2020. In the first quarter of 2020, we entered into two interest rate swaps to lock in $50.0 million of three-year funding at 0.71% and $50.0 million of ten-year funding at 0.86%. Each interest rate swap was designated as a cash flow hedge for accounting purposes.
Shareholders' Equity. The Company's capital strategy shifted during the first quarter of 2020 as the COVID-19 pandemic spread and growing uncertainty mounted as to its impact on the global, national and local economies. Through early-March 2020, the Company had repurchased 217,031 shares of its common stock at a cost of $8.0 million. In mid-March 2020, the Company suspended repurchasing shares of its common stock.
The Company enters this period of economic uncertainty well-positioned from a capital perspective. At March 31, 2020, the Company's capital position was well in excess of regulatory requirements, including a total risk-based capital ratio of 13.81%, a tier 1 risk-based capital ratio of 12.56%, common equity tier 1 risk-based capital ratio of 11.27%, and a tier 1 leverage ratio of 9.53%. Additionally, at March 31, 2020, the Company's common equity ratio was 10.72%, and tangible common equity ratio1 was 8.78%.
In March 2020, the Company announced a cash dividend to shareholders of $0.33 per share, an increase of 10% compared to a year ago. The cash dividend is payable to shareholders of record as of April 15, 2020, and shareholders will begin receiving payments on April 30, 2020. As of March 31, 2020, the Company's annualized dividend yield was 4.20%, based on Camden National's closing share price of $31.45, as reported by NASDAQ.
ASSET QUALITY
The Company enters into these unprecedented times with very strong asset quality. As of March 31, 2020, non-performing assets were 0.23% of total assets and past due loans were 0.24% of total loans. In comparison, at December 31, 2019, non-performing assets were 0.25% of total assets and past due loans were 0.17% of total loans. For the first quarter of 2020, net charge-offs (annualized) were 0.05% of average loans, compared to 0.09% for the fourth quarter of 2019 and 0.03% for the first quarter of 2019.
In March 2020, the Company offered temporary debt relief to business and retail customers impacted by the COVID-19 pandemic. Generally, the terms of the internal temporary debt relief program provided customers with 90 to 180 days of payment deferral.
The Coronavirus Aid, Relief, and Economic Security Act ("CARES Act") was signed into law in March 2020. The CARES Act provided certain companies with optional temporary relief from applying the current expected credit losses model, commonly referred to as "CECL." The Company chose to delay its implementation of CECL under the terms of the CARES Act to allow its internal resources to focus on and prioritize the roll-out of its temporary debt relief program and the SBA Paycheck Protection Program. As such, the reported allowance for credit losses and related provision expense for the first quarter of 2020 was accounted for under the incurred loss model. Under the terms of the CARES Act, we are permitted to delay our compliance with CECL until the earlier of (i) the date on which the national emergency concerning the COVID-19 pandemic that the President of the United States declared on March 15, 2020 terminates, or (ii) December 31, 2020.
The provision for credit losses for the first quarter of 2020 was $1.8 million, an increase of $1.0 million over the first quarter of 2019 and $1.6 million over the fourth quarter of 2019. The increase in provision expense in the first quarter of 2020 over comparable periods reflects the impact of the pandemic as of March 31, 2020, based on known information at that time.
At March 31, 2020, the Company's allowance for loan losses was 0.84% of total loans and 2.6 times non-performing loans.
FINANCIAL OPERATING RESULTS (Q1 2020 vs. Q1 2019)
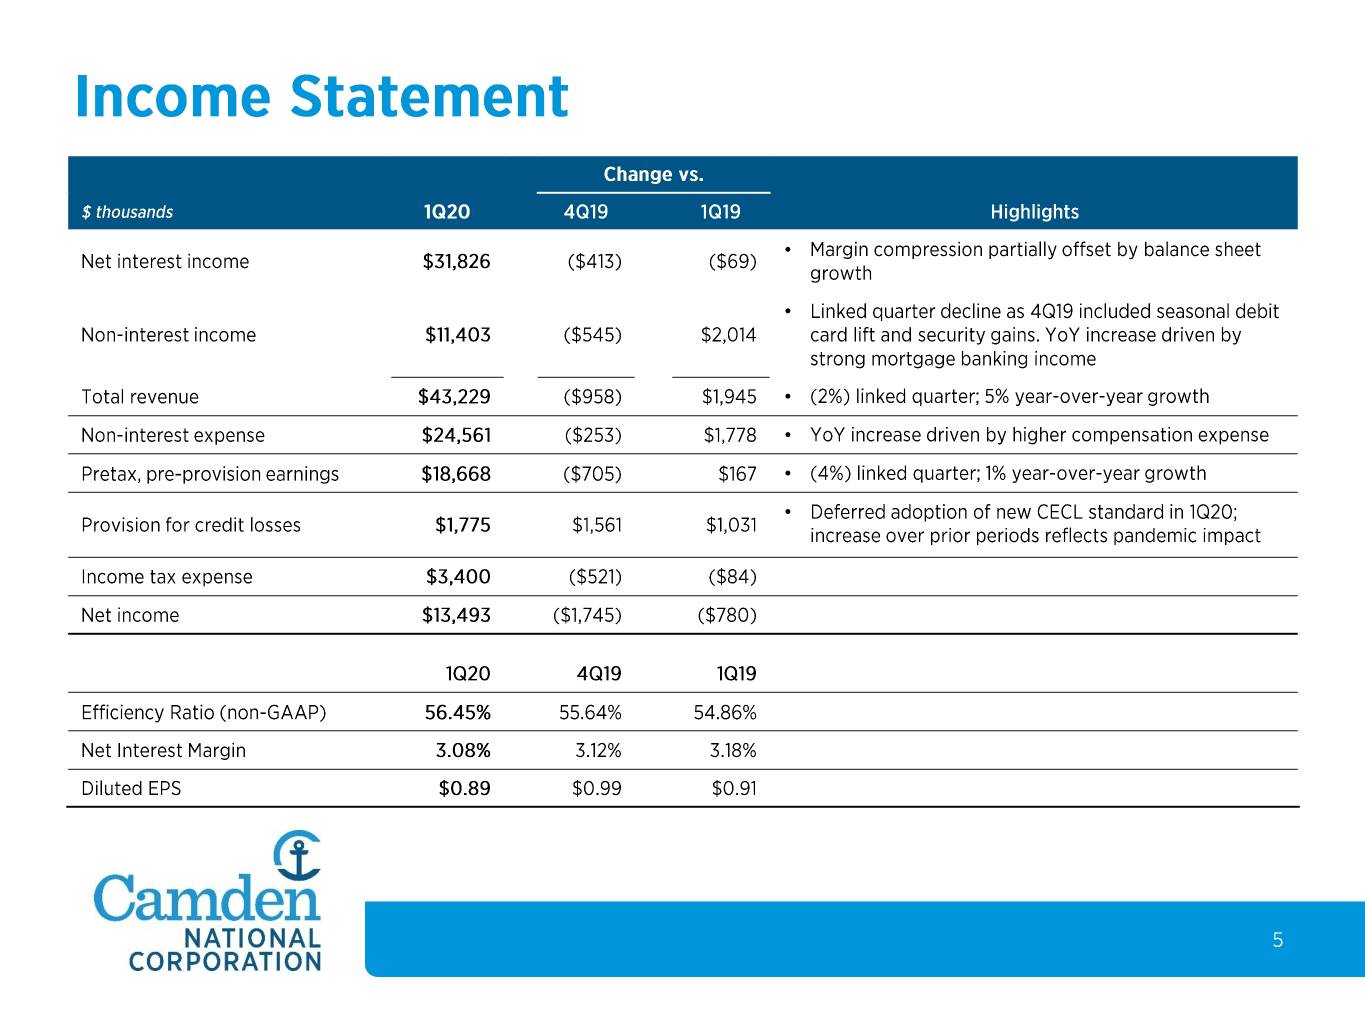
The Company reported net income of $13.5 million for the first quarter of 2020, a decrease of $780,000, or 5%, compared to the first quarter of 2019. Diluted EPS for the first quarter of 2020 was $0.89, a decrease of $0.02, or 2%.
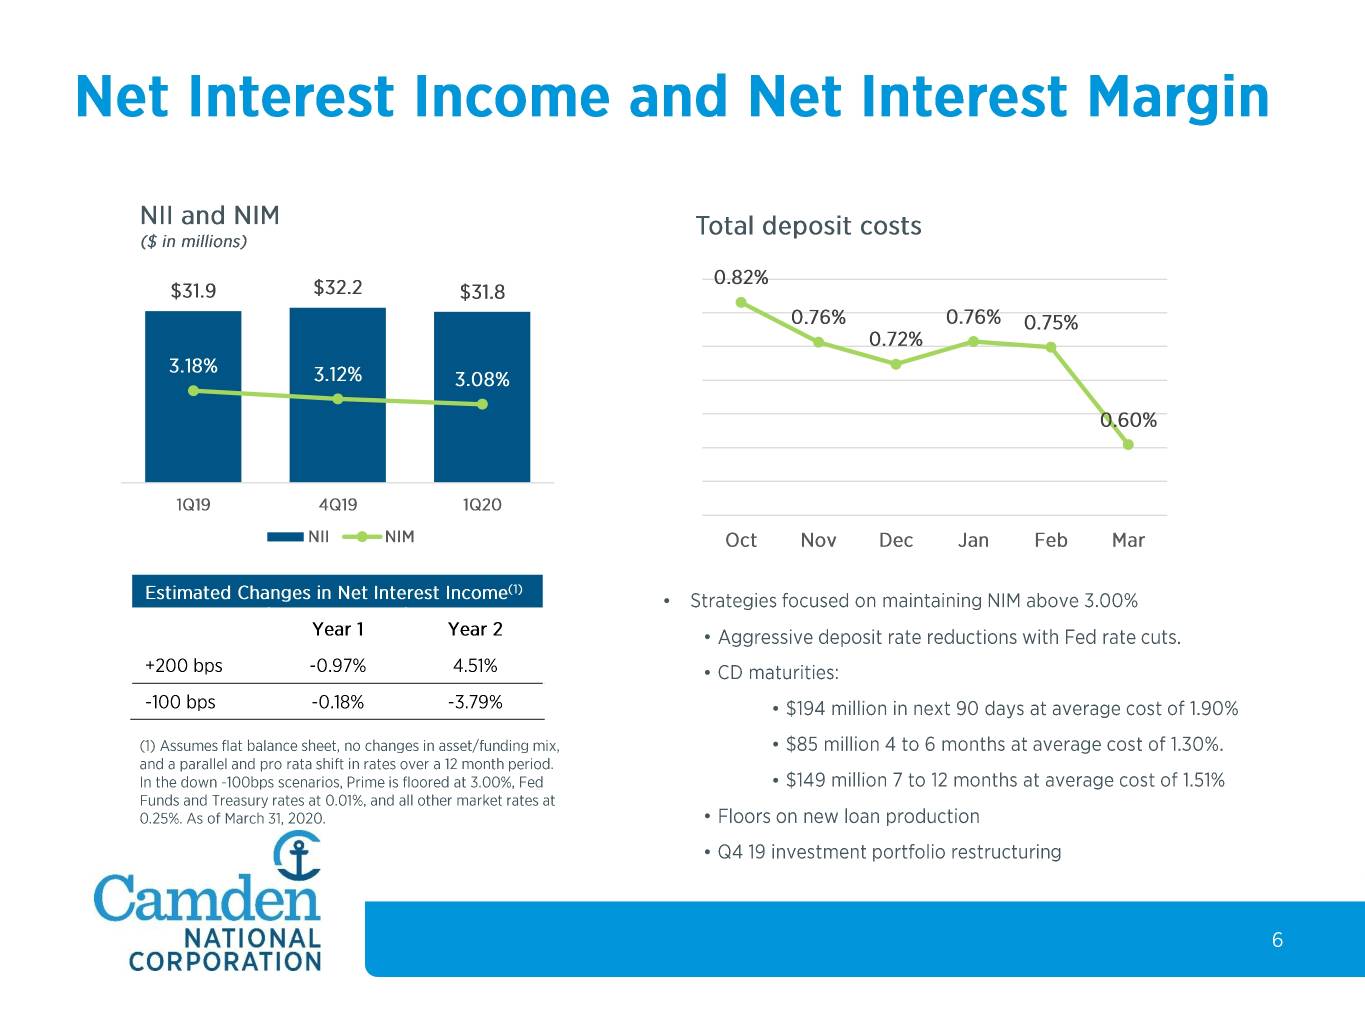
Net Interest Income. Net interest income for the first quarter of 2020 was $31.8 million, a decrease of $69,000 compared to the first quarter of 2019 due to the decline in net interest margin of 10 basis points, partially offset by average interest-earning assets growth of 3% between periods.
Net interest margin for the first quarter of 2020 was 3.08%, compared to 3.18% for the first quarter of 2019. The Company's interest-earning asset yield decreased 30 basis points between periods to 3.90% for the first quarter of 2020, while its cost of funds decreased 21 basis points between periods to 0.86% for the first quarter of 2020. The decrease in yields and funding costs reflects the change in the interest rate environment over this period. The 10-year U.S. Treasury rate averaged 1.37% in the first quarter of 2020, compared to 2.65% for the first quarter of 2019. The Federal Funds rate was cut twice in the first quarter of 2020 dropping the rate to 0.25% at March 31, 2020, compared to 2.50% at March 31, 2019.
Average interest-earning assets for the first quarter of 2020 were $4.1 billion, an increase of $103.4 million, or 3%, compared to the first quarter of 2019. The primary drivers for the net growth between periods included (i) average loan growth of 3%; and (ii) an increase in average cash and due from banks of $36.2 million driven by cash collateral for loan and interest rate swaps; partially offset by a decrease in average investments of $19.6 million, or 2%.
Average funding liabilities for the first quarter of 2020 were $3.9 billion, an increase of $82.2 million, or 2%, compared to the first quarter of 2019. Average deposits grew 9% between periods, led by: (i) average certificates of deposit growth of $109.0 million, or 25%, driven by one large municipal depositor; (ii) average checking account growth of $100.6 million, or 6%; and (iii) average money market growth of $67.7 million, or 12%. Over this same period, average borrowings decreased $185.2 million, or 25%.
Provision for Credit Losses. The provision for credit losses for the first quarter of 2020 was $1.8 million, an increase of $1.0 million over the first quarter of 2019. The increase in provision expense between periods was primarily the result of an increase in the allowance for credit losses due to the estimated impact of the pandemic as of March 31, 2020, based on known information at that time.
Non-Interest Income. Non-interest income for the first quarter of 2020 was $11.4 million, an increase of $2.0 million, or 21%, over the first quarter of 2019. The net increase in non-interest income between periods was primarily driven by an increase in mortgage banking income of $2.3 million due to record residential loan production and pipeline activity in the first quarter of 2020, due to the low interest rate environment.
Non-Interest Expense. Non-interest expense for the first quarter of 2020 was $24.6 million, an increase of $1.8 million, or 8%, compared to the first quarter of 2019. The increase was primarily due to an increase in salaries and benefits costs of $1.3 million, or 10%, between periods, primarily driven by normal annual merit increases, an increase in employees, and higher incentive accruals. The Company's efficiency ratio for the first quarter of 2020, calculated as non-interest expense divided by total revenues2, was 56.82%, compared to 55.19% for the first quarter of 2019.
FINANCIAL OPERATING RESULTS (Q1 2020 vs. Q4 2019)
Reported net income decreased $1.7 million, or 11%, and diluted EPS decreased $0.10, or 10%, between quarters, primarily due to an increase in provision for credit losses of $1.6 million and a 1% decrease in net interest income.
Net Interest Income. Net interest income decreased $413,000, or 1%, between quarters as net interest margin decreased 4 basis points to 3.08% for the first quarter of 2020. The Company's interest-earning asset yield decreased 12 basis points and its cost of funds decreased 8 basis points between quarters. The decrease in yields and funding costs reflects the change in the interest rate environment between quarters. The 10-year U.S. Treasury rate averaged 1.37% in the first quarter of 2020, compared to 1.79% for the fourth quarter of 2019. The Federal Funds rate decreased 150 basis points in the first quarter of 2020 reaching 0.25% at March 31, 2020.
Average interest-earning assets increased $18.3 million between quarters, driven by average loan growth of $22.5 million, or 1%. Average funding liabilities increased $8.0 million between quarters, driven by an increase in average borrowings of $24.1 million, or 4%, but was partially offset by a decrease in average deposits of $16.1 million.
Provision for Credit Losses. The provision for credit losses increased $1.6 million between quarters, primarily due to an increase in the allowance for credit losses due to the estimated impact of the pandemic as of March 31, 2020, based on known information at that time.
Non-Interest Income. Non-interest income decreased $545,000, or 5%, between quarters. The net decrease in non-interest income between periods was primarily driven by (i) a decrease in other income of $918,000 as an unrealized gain on equity securities of $866,000 was recognized in the fourth quarter of 2019; (ii) a decrease in debit card income of $837,000, or 28%, due to the recognition of our annual volume incentive bonus of $579,000 in
the fourth quarter of 2019, and a decrease in card activity due to normal seasonal volumes and the impact of the pandemic; partially offset by an increase in mortgage banking income of $1.4 million driven by record residential loan production and pipeline activity in the first quarter of 2020, due to the low interest rate environment.
Non-Interest Expense. Non-interest expense decreased $253,000, or 1%, between quarters. The Company's efficiency ratio for the first quarter of 2020, calculated as non-interest expense divided by total revenues2, was 56.82%, compared to 56.16% for the fourth quarter of 2019.
ANNUAL MEETING
Camden National has scheduled its annual meeting of shareholders for Tuesday, April 28, 2020, at 3:00 p.m. Eastern time. To comply with the Executive Order issued by the Governor of the State of Maine that prohibits gatherings of more than ten people, the Company is requesting that all shareholders attend the meeting virtually by visiting www.virtualshareholdermeeting.com/CAC2020. Camden National is taking these necessary steps due to concerns regarding COVID-19, and to assist in protecting the health and well-being of its shareholders and employees. More information regarding virtual attendance at the Annual Meeting is available in additional proxy materials filed with the SEC, available at www.camdennationalcorporation.com.
CONFERENCE CALL
Camden National will host a conference call and webcast at 1:00 p.m., Eastern Time, on Tuesday, April 28, 2020 to discuss its first quarter 2020 financial results and outlook. Participants should dial in to the call 10 - 15 minutes before it begins. Information about the conference call is as follows:
Live dial-in (domestic): (888) 349-0139
Live dial-in (international): (412) 542-4154
Live webcast: https://services.choruscall.com/links/cac200428.html
A link to the live webcast will be available on Camden National's website under "Investor Relations" at www.CamdenNational.com prior to the meeting, and a replay of the webcast will be available on Camden National's website following the conference call. The transcript of the conference call will also be available on Camden National's website approximately two days after the conference call.
ABOUT CAMDEN NATIONAL CORPORATION
Camden National Corporation (NASDAQ:CAC) is the largest publicly traded bank holding company in Northern New England with $4.6 billion in assets and nearly 650 employees. Camden National Bank, its subsidiary, is a full-service community bank founded in 1875 in Camden, Maine. Dedicated to customers at every stage of their financial journey, the bank offers the latest in digital banking, complemented by personalized service with 58 banking centers, 24/7 live phone support, 68 ATMs, and lending offices in New Hampshire and Massachusetts. Camden National Bank was named one of two "Customer Experience Leaders in U.S. Retail Banking" by Greenwich Associates, and in 2019, it was the only New England based organization included in Sandler O'Neill's "Bank and Thrift Sm-All Star" list of high-performing financial institutions. The Finance Authority of Maine has awarded Camden National Bank as "Lender at Work for Maine" for nine years. Comprehensive wealth management, investment, and financial planning services are delivered by Camden National Wealth Management. To learn more, visit CamdenNational.com. Member FDIC.
FORWARD-LOOKING STATEMENTS
Certain statements contained in this press release that are not statements of historical fact constitute forward-looking statements within the meaning of the Private Securities Litigation Reform Act of 1995, as amended, including certain plans, expectations, goals, projections and other statements, which are subject to numerous risks, assumptions and uncertainties. Forward-looking statements can be identified by the fact that they do not relate strictly to historical or current facts. They often include words like “believe,” “expect,” “anticipate,” “estimate,” and “intend” or future or conditional verbs such as “will,” “would,” “should,” “could” or “may.” Certain factors that could cause actual results to differ materially from expected results include the duration, extent and severity of the COVID-19 pandemic, including its effects on our business, operations and employees as well as its effect on our customers and service providers and on economies and markets more generally; increased competitive pressures; changes in the interest rate environment; changes in general economic conditions; operational risks including, but not limited to, cybersecurity, fraud and natural disasters; legislative and regulatory changes that adversely affect the business in which Camden National is engaged; changes in the securities markets and other risks and uncertainties disclosed from time to time in in Camden National’s Annual Report on Form 10-K for the year ended December 31, 2019, as updated by other filings with the Securities and Exchange Commission ("SEC"). Camden National does not have any obligation to update forward-looking statements.
USE OF NON-GAAP MEASURES
In addition to evaluating the Company's results of operations in accordance with generally accepted accounting principles in the United States ("GAAP"), management supplements this evaluation with certain non-GAAP financial measures, such as return on average tangible equity; the efficiency and tangible common equity ratios; tangible book value per share; and core deposits. Management utilizes these non-GAAP financial measures for purposes of measuring our performance against our peer group and other financial institutions and analyzing our internal performance. We also believe these non-GAAP financial measure help investors better understand the Company's operating performance and trends and allow for better performance comparisons to other financial institutions. In addition, these non-GAAP financial measures remove the impact of unusual items that may obscure trends in the Company's underlying performance. These disclosures should not be viewed as a substitute for GAAP operating results, nor are they necessarily comparable to non-GAAP performance measures that may be presented by other financial institutions. Reconciliation to the comparable GAAP financial measure can be found in this document.
ANNUALIZED DATA
Certain returns, yields and performance ratios are presented on an “annualized” basis. This is done for analytical and decision-making purposes to better discern underlying performance trends when compared to full-year or year-over-year amounts. Annualized data may not be indicative of any four-quarter period, and are presented for illustrative purposes only.
_____________________________________________________________________________________________
1 This is a non-GAAP measure. Please refer to "Reconciliation of non-GAAP to GAAP Financial Measures" for further details.
2 | Revenue is the sum of net interest income and non-interest income. |
Selected Financial Data (unaudited) | ||||||||||||
At or For The Three Months Ended | ||||||||||||
(In thousands, except number of shares and per share data) | March 31, 2020 | December 31, 2019 | March 31, 2019 | |||||||||
Financial Condition Data | ||||||||||||
Investments | $ | 976,487 | $ | 933,069 | $ | 936,859 | ||||||
Loans and loans held for sale | 3,185,492 | 3,106,877 | 3,051,237 | |||||||||
Allowance for loan losses | 26,521 | 25,171 | 25,201 | |||||||||
Total assets | 4,594,539 | 4,429,521 | 4,421,189 | |||||||||
Deposits | 3,563,705 | 3,537,743 | 3,578,197 | |||||||||
Borrowings | 420,877 | 337,889 | 325,159 | |||||||||
Shareholders' equity | 492,680 | 473,415 | 453,718 | |||||||||
Operating Data | ||||||||||||
Net interest income | $ | 31,826 | $ | 32,239 | $ | 31,895 | ||||||
Provision for credit losses | 1,775 | 214 | 744 | |||||||||
Non-interest income | 11,403 | 11,948 | 9,389 | |||||||||
Non-interest expense | 24,561 | 24,814 | 22,783 | |||||||||
Income before income tax expense | 16,893 | 19,159 | 17,757 | |||||||||
Income tax expense | 3,400 | 3,921 | 3,484 | |||||||||
Net income | $ | 13,493 | $ | 15,238 | $ | 14,273 | ||||||
Key Ratios | ||||||||||||
Return on average assets | 1.21 | % | 1.35 | % | 1.33 | % | ||||||
Return on average equity | 11.30 | % | 12.77 | % | 13.13 | % | ||||||
GAAP efficiency ratio | 56.82 | % | 56.16 | % | 55.19 | % | ||||||
Net interest margin (fully-taxable equivalent) | 3.08 | % | 3.12 | % | 3.18 | % | ||||||
Non-performing assets to total assets | 0.23 | % | 0.25 | % | 0.33 | % | ||||||
Common equity ratio | 10.72 | % | 10.69 | % | 10.26 | % | ||||||
Tier 1 leverage capital ratio | 9.53 | % | 9.55 | % | 9.47 | % | ||||||
Common equity tier 1 risk-based capital ratio | 11.27 | % | 11.80 | % | 11.74 | % | ||||||
Tier 1 risk-based capital ratio | 12.56 | % | 13.16 | % | 13.14 | % | ||||||
Total risk-based capital ratio | 13.81 | % | 14.44 | % | 14.46 | % | ||||||
Per Share Data | ||||||||||||
Basic earnings per share | $ | 0.89 | $ | 1.00 | $ | 0.91 | ||||||
Diluted earnings per share | $ | 0.89 | $ | 0.99 | $ | 0.91 | ||||||
Cash dividends declared per share | $ | 0.33 | $ | 0.33 | $ | 0.30 | ||||||
Book value per share | $ | 32.95 | $ | 31.26 | $ | 29.16 | ||||||
Non-GAAP Measures(1) | ||||||||||||
Return on average tangible equity | 14.35 | % | 16.26 | % | 17.08 | % | ||||||
Efficiency ratio | 56.45 | % | 55.64 | % | 54.86 | % | ||||||
Tangible common equity ratio | 8.78 | % | 8.66 | % | 8.21 | % | ||||||
Tangible book value per share | $ | 26.39 | $ | 24.77 | $ | 22.81 | ||||||
(1) Please see "Reconciliation of non-GAAP to GAAP Financial Measures (unaudited)."
Consolidated Statements of Condition Data (unaudited) | ||||||||||||
(In thousands) | March 31, 2020 | December 31, 2019 | March 31, 2019 | |||||||||
ASSETS | ||||||||||||
Cash and due from banks | $ | 32,477 | $ | 39,586 | $ | 43,722 | ||||||
Interest-bearing deposits in other banks (including restricted cash) | 21,732 | 36,050 | 95,846 | |||||||||
Total cash, cash equivalents and restricted cash | 54,209 | 75,636 | 139,568 | |||||||||
Investments: | ||||||||||||
Available-for-sale securities, at fair value (book value of $931,876, $913,978 and $933,135, respectively) | 960,131 | 918,118 | 924,311 | |||||||||
Held-to-maturity securities, at amortized cost (fair value of $1,358, $1,359 and $1,324, respectively) | 1,300 | 1,302 | 1,306 | |||||||||
Other investments | 15,056 | 13,649 | 11,242 | |||||||||
Total investments | 976,487 | 933,069 | 936,859 | |||||||||
Loans held for sale, at fair value (book value of $28,356, $11,915 and $8,711, respectively) | 27,730 | 11,854 | 8,795 | |||||||||
Loans: | ||||||||||||
Commercial real estate | 1,299,860 | 1,243,397 | 1,258,474 | |||||||||
Residential real estate | 1,064,212 | 1,070,374 | 1,017,442 | |||||||||
Commercial(1) | 463,087 | 442,701 | 421,824 | |||||||||
Consumer and home equity | 330,603 | 338,551 | 344,702 | |||||||||
Total loans | 3,157,762 | 3,095,023 | 3,042,442 | |||||||||
Less: allowance for loan losses | (26,521 | ) | (25,171 | ) | (25,201 | ) | ||||||
Net loans | 3,131,241 | 3,069,852 | 3,017,241 | |||||||||
Goodwill | 94,697 | 94,697 | 94,697 | |||||||||
Core deposit intangible assets | 3,355 | 3,525 | 4,054 | |||||||||
Bank-owned life insurance | 93,033 | 92,344 | 90,513 | |||||||||
Premises and equipment, net | 41,131 | 41,836 | 42,033 | |||||||||
Deferred tax assets | 10,708 | 16,823 | 18,854 | |||||||||
Other assets | 161,948 | 89,885 | 68,575 | |||||||||
Total assets | $ | 4,594,539 | $ | 4,429,521 | $ | 4,421,189 | ||||||
LIABILITIES AND SHAREHOLDERS’ EQUITY | ||||||||||||
Liabilities | ||||||||||||
Deposits: | ||||||||||||
Non-interest checking | $ | 536,243 | $ | 552,590 | $ | 492,306 | ||||||
Interest checking | 1,147,653 | 1,153,203 | 1,163,678 | |||||||||
Savings and money market | 1,146,038 | 1,119,193 | 1,059,897 | |||||||||
Certificates of deposit | 545,013 | 521,752 | 428,487 | |||||||||
Brokered deposits | 188,758 | 191,005 | 433,829 | |||||||||
Total deposits | 3,563,705 | 3,537,743 | 3,578,197 | |||||||||
Short-term borrowings | 326,722 | 268,809 | 256,181 | |||||||||
Long-term borrowings | 35,000 | 10,000 | 10,000 | |||||||||
Subordinated debentures | 59,155 | 59,080 | 58,978 | |||||||||
Accrued interest and other liabilities | 117,277 | 80,474 | 64,115 | |||||||||
Total liabilities | 4,101,859 | 3,956,106 | 3,967,471 | |||||||||
Shareholders’ equity | 492,680 | 473,415 | 453,718 | |||||||||
Total liabilities and shareholders’ equity | $ | 4,594,539 | $ | 4,429,521 | $ | 4,421,189 | ||||||
(1) Includes the HPFC loan portfolio.
Consolidated Statements of Income Data (unaudited) | ||||||||||||
For The Three Months Ended | ||||||||||||
(In thousands, except per share data) | March 31, 2020 | December 31, 2019 | March 31, 2019 | |||||||||
Interest Income | ||||||||||||
Interest and fees on loans | $ | 34,045 | $ | 35,379 | $ | 35,721 | ||||||
Taxable interest on investments | 4,878 | 4,780 | 4,994 | |||||||||
Nontaxable interest on investments | 787 | 758 | 644 | |||||||||
Dividend income | 168 | 160 | 230 | |||||||||
Other interest income | 335 | 475 | 420 | |||||||||
Total interest income | 40,213 | 41,552 | 42,009 | |||||||||
Interest Expense | ||||||||||||
Interest on deposits | 6,662 | 7,459 | 8,423 | |||||||||
Interest on borrowings | 838 | 961 | 974 | |||||||||
Interest on subordinated debentures | 887 | 893 | 717 | |||||||||
Total interest expense | 8,387 | 9,313 | 10,114 | |||||||||
Net interest income | 31,826 | 32,239 | 31,895 | |||||||||
Provision for credit losses | 1,775 | 214 | 744 | |||||||||
Net interest income after provision for credit losses | 30,051 | 32,025 | 31,151 | |||||||||
Non-Interest Income | ||||||||||||
Mortgage banking income, net | 3,534 | 2,175 | 1,252 | |||||||||
Debit card income | 2,141 | 2,978 | 2,010 | |||||||||
Service charges on deposit accounts | 2,012 | 2,191 | 2,023 | |||||||||
Income from fiduciary services | 1,502 | 1,520 | 1,392 | |||||||||
Bank-owned life insurance | 689 | 615 | 594 | |||||||||
Brokerage and insurance commissions | 657 | 683 | 585 | |||||||||
Customer loan swap fees | 114 | 247 | 525 | |||||||||
Net loss on sale of securities | — | (133 | ) | — | ||||||||
Other income | 754 | 1,672 | 1,008 | |||||||||
Total non-interest income | 11,403 | 11,948 | 9,389 | |||||||||
Non-Interest Expense | ||||||||||||
Salaries and employee benefits | 14,327 | 14,446 | 12,978 | |||||||||
Furniture, equipment and data processing | 2,790 | 2,770 | 2,680 | |||||||||
Net occupancy costs | 2,003 | 1,784 | 1,914 | |||||||||
Debit card expense | 934 | 947 | 823 | |||||||||
Consulting and professional fees | 783 | 1,027 | 813 | |||||||||
Amortization of intangible assets | 170 | 176 | 176 | |||||||||
Regulatory assessments | 162 | 170 | 472 | |||||||||
Other real estate owned and collection costs (recoveries), net | 101 | 127 | (307 | ) | ||||||||
Other expenses | 3,291 | 3,367 | 3,234 | |||||||||
Total non-interest expense | 24,561 | 24,814 | 22,783 | |||||||||
Income before income tax expense | 16,893 | 19,159 | 17,757 | |||||||||
Income Tax Expense | 3,400 | 3,921 | 3,484 | |||||||||
Net Income | $ | 13,493 | $ | 15,238 | $ | 14,273 | ||||||
Per Share Data | ||||||||||||
Basic earnings per share | $ | 0.89 | $ | 1.00 | $ | 0.91 | ||||||
Diluted earnings per share | $ | 0.89 | $ | 0.99 | $ | 0.91 | ||||||
Quarterly Average Balance and Yield/Rate Analysis (unaudited) | |||||||||||||||||||||
Average Balance | Yield/Rate | ||||||||||||||||||||
For The Three Months Ended | For The Three Months Ended | ||||||||||||||||||||
(In thousands) | March 31, 2020 | December 31, 2019 | March 31, 2019 | March 31, 2020 | December 31, 2019 | March 31, 2019 | |||||||||||||||
Assets | |||||||||||||||||||||
Interest-earning assets: | |||||||||||||||||||||
Interest-bearing deposits in other banks and other interest-earning assets | $ | 66,180 | $ | 79,578 | $ | 29,985 | 1.24 | % | 1.74 | % | 2.63 | % | |||||||||
Investments - taxable | 809,041 | 804,587 | 851,516 | 2.56 | % | 2.52 | % | 2.56 | % | ||||||||||||
Investments - nontaxable(1) | 117,537 | 112,730 | 94,710 | 3.39 | % | 3.40 | % | 3.44 | % | ||||||||||||
Loans(2): | |||||||||||||||||||||
Commercial real estate | 1,273,538 | 1,249,961 | 1,281,501 | 4.24 | % | 4.40 | % | 4.73 | % | ||||||||||||
Residential real estate | 1,078,836 | 1,078,485 | 1,008,285 | 4.19 | % | 4.38 | % | 4.30 | % | ||||||||||||
Commercial(1) | 416,527 | 403,601 | 369,832 | 4.21 | % | 4.41 | % | 4.70 | % | ||||||||||||
Consumer and home equity | 334,771 | 345,487 | 347,052 | 5.03 | % | 5.11 | % | 5.46 | % | ||||||||||||
HPFC | 20,336 | 22,516 | 32,171 | 7.83 | % | 7.56 | % | 7.91 | % | ||||||||||||
Municipal(1) | 16,990 | 18,469 | 15,333 | 3.67 | % | 3.66 | % | 3.60 | % | ||||||||||||
Total loans | 3,140,998 | 3,118,519 | 3,054,174 | 4.32 | % | 4.49 | % | 4.70 | % | ||||||||||||
Total interest-earning assets | 4,133,756 | 4,115,414 | 4,030,385 | 3.90 | % | 4.02 | % | 4.20 | % | ||||||||||||
Other assets | 354,436 | 349,786 | 308,064 | ||||||||||||||||||
Total assets | $ | 4,488,192 | $ | 4,465,200 | $ | 4,338,449 | |||||||||||||||
Liabilities & Shareholders' Equity | |||||||||||||||||||||
Deposits: | |||||||||||||||||||||
Non-interest checking | $ | 529,501 | $ | 558,677 | $ | 490,382 | — | % | — | % | — | % | |||||||||
Interest checking | 1,146,783 | 1,165,610 | 1,085,301 | 0.70 | % | 0.79 | % | 0.98 | % | ||||||||||||
Savings | 476,849 | 471,777 | 485,646 | 0.07 | % | 0.08 | % | 0.08 | % | ||||||||||||
Money market | 650,383 | 642,174 | 582,685 | 0.98 | % | 1.16 | % | 1.21 | % | ||||||||||||
Certificates of deposit | 552,079 | 533,416 | 443,107 | 1.61 | % | 1.66 | % | 1.34 | % | ||||||||||||
Total deposits | 3,355,595 | 3,371,654 | 3,087,121 | 0.70 | % | 0.77 | % | 0.78 | % | ||||||||||||
Borrowings: | |||||||||||||||||||||
Brokered deposits | 208,084 | 187,125 | 405,837 | 1.54 | % | 2.02 | % | 2.50 | % | ||||||||||||
Customer repurchase agreements | 236,351 | 247,780 | 238,499 | 1.08 | % | 1.20 | % | 1.24 | % | ||||||||||||
Subordinated debentures | 59,119 | 59,037 | 59,007 | 6.04 | % | 6.01 | % | 4.93 | % | ||||||||||||
Other borrowings | 59,257 | 44,816 | 44,711 | 1.39 | % | 1.88 | % | 2.22 | % | ||||||||||||
Total borrowings | 562,811 | 538,758 | 748,054 | 1.80 | % | 2.07 | % | 2.27 | % | ||||||||||||
Total funding liabilities | 3,918,406 | 3,910,412 | 3,835,175 | 0.86 | % | 0.94 | % | 1.07 | % | ||||||||||||
Other liabilities | 89,612 | 81,261 | 62,247 | ||||||||||||||||||
Shareholders' equity | 480,174 | 473,527 | 441,027 | ||||||||||||||||||
Total liabilities & shareholders' equity | $ | 4,488,192 | $ | 4,465,200 | $ | 4,338,449 | |||||||||||||||
Net interest rate spread (fully-taxable equivalent) | 3.04 | % | 3.08 | % | 3.13 | % | |||||||||||||||
Net interest margin (fully-taxable equivalent) | 3.08 | % | 3.12 | % | 3.18 | % | |||||||||||||||
Net interest margin (fully-taxable equivalent), excluding fair value mark accretion and collection of previously charged-off acquired loans(3) | 3.06 | % | 3.09 | % | 3.14 | % | |||||||||||||||
(1) | Reported on a tax-equivalent basis calculated using the federal corporate income tax rate of 21%, including certain commercial loans. |
(2) | Non-accrual loans and loans held for sale are included in total average loans. |
(3) | Excludes the impact of the fair value mark accretion on loans and certificates of deposit generated in purchase accounting and collection of previously charged-off acquired loans for the three months ended March 31, 2020, December 31, 2019 and March 31, 2019 totaling $283,000, $326,000 and $390,000, respectively. |
Asset Quality Data | ||||||||||||||||||||
(unaudited) | ||||||||||||||||||||
(In thousands) | At or For The Three Months Ended March 31, 2020 | At or For The Year Ended December 31, 2019 | At or For The Nine Months Ended September 30, 2019 | At or For The Six Months Ended June 30, 2019 | At or For The Three Months Ended March 31, 2019 | |||||||||||||||
Non-accrual loans: | ||||||||||||||||||||
Residential real estate | $ | 3,499 | $ | 4,096 | $ | 5,152 | $ | 5,566 | $ | 5,415 | ||||||||||
Commercial real estate | 646 | 1,122 | 1,156 | 1,590 | 975 | |||||||||||||||
Commercial | 748 | 420 | 751 | 785 | 802 | |||||||||||||||
Consumer and home equity | 2,102 | 2,154 | 2,616 | 3,039 | 2,476 | |||||||||||||||
HPFC | 322 | 364 | 450 | 465 | 485 | |||||||||||||||
Total non-accrual loans | 7,317 | 8,156 | 10,125 | 11,445 | 10,153 | |||||||||||||||
Loans 90 days past due and accruing | — | — | — | 14 | 14 | |||||||||||||||
Accruing troubled-debt restructured loans not included above | 3,008 | 2,993 | 3,259 | 3,511 | 3,771 | |||||||||||||||
Total non-performing loans | 10,325 | 11,149 | 13,384 | 14,970 | 13,938 | |||||||||||||||
Other real estate owned | 94 | 94 | 94 | 130 | 673 | |||||||||||||||
Total non-performing assets | $ | 10,419 | $ | 11,243 | $ | 13,478 | $ | 15,100 | $ | 14,611 | ||||||||||
Loans 30-89 days past due: | ||||||||||||||||||||
Residential real estate | $ | 1,781 | $ | 2,227 | $ | 1,447 | $ | 2,536 | $ | 2,265 | ||||||||||
Commercial real estate | 2,641 | 1,582 | 2,242 | 3,378 | 2,947 | |||||||||||||||
Commercial | 1,560 | 548 | 1,135 | 1,400 | 1,205 | |||||||||||||||
Consumer and home equity | 1,379 | 750 | 822 | 907 | 1,430 | |||||||||||||||
HPFC | 165 | 243 | 193 | 171 | 187 | |||||||||||||||
Total loans 30-89 days past due | $ | 7,526 | $ | 5,350 | $ | 5,839 | $ | 8,392 | $ | 8,034 | ||||||||||
Allowance for loan losses at the beginning of the period | $ | 25,171 | $ | 24,712 | $ | 24,712 | $ | 24,712 | $ | 24,712 | ||||||||||
Provision for loan losses | 1,772 | 2,862 | 2,658 | 1,925 | 750 | |||||||||||||||
Charge-offs: | ||||||||||||||||||||
Residential real estate | 96 | 462 | 436 | 25 | 11 | |||||||||||||||
Commercial real estate | 50 | 300 | 157 | 65 | 65 | |||||||||||||||
Commercial | 253 | 1,167 | 636 | 453 | 236 | |||||||||||||||
Consumer and home equity | 91 | 713 | 670 | 64 | 24 | |||||||||||||||
HPFC | — | 71 | 11 | — | — | |||||||||||||||
Total charge-offs | 490 | 2,713 | 1,910 | 607 | 336 | |||||||||||||||
Total recoveries | (68 | ) | (310 | ) | (228 | ) | (133 | ) | (75 | ) | ||||||||||
Net charge-offs | 422 | 2,403 | 1,682 | 474 | 261 | |||||||||||||||
Allowance for loan losses at the end of the period | $ | 26,521 | $ | 25,171 | $ | 25,688 | $ | 26,163 | $ | 25,201 | ||||||||||
Components of allowance for credit losses: | ||||||||||||||||||||
Allowance for loan losses | $ | 26,521 | $ | 25,171 | $ | 25,688 | $ | 26,163 | $ | 25,201 | ||||||||||
Liability for unfunded credit commitments | 24 | 21 | 11 | 14 | 16 | |||||||||||||||
Allowance for credit losses | $ | 26,545 | $ | 25,192 | $ | 25,699 | $ | 26,177 | $ | 25,217 | ||||||||||
Ratios: | ||||||||||||||||||||
Non-performing loans to total loans | 0.33 | % | 0.36 | % | 0.43 | % | 0.48 | % | 0.46 | % | ||||||||||
Non-performing assets to total assets | 0.23 | % | 0.25 | % | 0.30 | % | 0.34 | % | 0.33 | % | ||||||||||
Allowance for loan losses to total loans | 0.84 | % | 0.81 | % | 0.83 | % | 0.84 | % | 0.83 | % | ||||||||||
Net charge-offs to average loans (annualized): | ||||||||||||||||||||
Quarter-to-date | 0.05 | % | 0.09 | % | 0.16 | % | 0.03 | % | 0.03 | % | ||||||||||
Year-to-date | 0.05 | % | 0.08 | % | 0.07 | % | 0.03 | % | 0.03 | % | ||||||||||
Allowance for loan losses to non-performing loans | 256.86 | % | 225.77 | % | 191.93 | % | 174.77 | % | 180.81 | % | ||||||||||
Loans 30-89 days past due to total loans | 0.24 | % | 0.17 | % | 0.19 | % | 0.27 | % | 0.26 | % | ||||||||||
Reconciliation of non-GAAP to GAAP Financial Measures (unaudited)
Return on Average Tangible Equity: | ||||||||||||
For the Three Months Ended | ||||||||||||
(Dollars in thousands) | March 31, 2020 | December 31, 2019 | March 31, 2019 | |||||||||
Net income, as presented | $ | 13,493 | $ | 15,238 | $ | 14,273 | ||||||
Add: amortization of intangible assets, net of tax(1) | 134 | 139 | 139 | |||||||||
Net income, adjusted for amortization of intangible assets | $ | 13,627 | $ | 15,377 | $ | 14,412 | ||||||
Average equity, as presented | $ | 480,174 | $ | 473,527 | $ | 441,027 | ||||||
Less: average goodwill and other intangible assets | (98,143 | ) | (98,307 | ) | (98,838 | ) | ||||||
Average tangible equity | $ | 382,031 | $ | 375,220 | $ | 342,189 | ||||||
Return on average equity | 11.30 | % | 12.77 | % | 13.13 | % | ||||||
Return on average tangible equity | 14.35 | % | 16.26 | % | 17.08 | % | ||||||
(1) Assumed a 21% tax rate.
Efficiency Ratio: | ||||||||||||
For the Three Months Ended | ||||||||||||
(Dollars in thousands) | March 31, 2020 | December 31, 2019 | March 31, 2019 | |||||||||
Non-interest expense, as presented | $ | 24,561 | $ | 24,814 | $ | 22,783 | ||||||
Net interest income, as presented | $ | 31,826 | $ | 32,239 | $ | 31,895 | ||||||
Add: effect of tax-exempt income(1) | 280 | 277 | 244 | |||||||||
Non-interest income, as presented | 11,403 | 11,948 | 9,389 | |||||||||
Add: net loss on sale of securities | — | 133 | — | |||||||||
Adjusted net interest income plus non-interest income | $ | 43,509 | $ | 44,597 | $ | 41,528 | ||||||
GAAP efficiency ratio | 56.82 | % | 56.16 | % | 55.19 | % | ||||||
Non-GAAP efficiency ratio | 56.45 | % | 55.64 | % | 54.86 | % | ||||||
(1) Assumed a 21% tax rate.
Tangible Book Value Per Share and Tangible Common Equity Ratio: | ||||||||||||
March 31, 2020 | December 31, 2019 | March 31, 2019 | ||||||||||
(In thousands, except number of shares, per share data and ratios) | ||||||||||||
Tangible Book Value Per Share: | ||||||||||||
Shareholders' equity, as presented | $ | 492,680 | $ | 473,415 | $ | 453,718 | ||||||
Less: goodwill and other intangible assets | (98,052 | ) | (98,222 | ) | (98,751 | ) | ||||||
Tangible shareholders' equity | $ | 394,628 | $ | 375,193 | $ | 354,967 | ||||||
Shares outstanding at period end | 14,951,597 | 15,144,719 | 15,560,565 | |||||||||
Book value per share | $ | 32.95 | $ | 31.26 | $ | 29.16 | ||||||
Tangible book value per share | $ | 26.39 | $ | 24.77 | $ | 22.81 | ||||||
Tangible Common Equity Ratio: | ||||||||||||
Total assets | $ | 4,594,539 | $ | 4,429,521 | $ | 4,421,189 | ||||||
Less: goodwill and other intangible assets | (98,052 | ) | (98,222 | ) | (98,751 | ) | ||||||
Tangible assets | $ | 4,496,487 | $ | 4,331,299 | $ | 4,322,438 | ||||||
Common equity ratio | 10.72 | % | 10.69 | % | 10.26 | % | ||||||
Tangible common equity ratio | 8.78 | % | 8.66 | % | 8.21 | % | ||||||
Core Deposits: | ||||||||||||
(In thousands) | March 31, 2020 | December 31, 2019 | March 31, 2019 | |||||||||
Total deposits | $ | 3,563,705 | $ | 3,537,743 | $ | 3,578,197 | ||||||
Less: certificates of deposit | (545,013 | ) | (521,752 | ) | (428,487 | ) | ||||||
Less: brokered deposits | (188,758 | ) | (191,005 | ) | (433,829 | ) | ||||||
Core deposits | $ | 2,829,934 | $ | 2,824,986 | $ | 2,715,881 | ||||||
Average Core Deposits: | ||||||||||||
(In thousands) | March 31, 2020 | December 31, 2019 | March 31, 2019 | |||||||||
Total average deposits | $ | 3,355,595 | $ | 3,371,654 | $ | 3,087,121 | ||||||
Less: average certificates of deposit | (552,079 | ) | (533,416 | ) | (443,107 | ) | ||||||
Average core deposits | $ | 2,803,516 | $ | 2,838,238 | $ | 2,644,014 | ||||||
 First Quarter Report - 2020