CONTACT:
Michael Archer
Senior Vice President
Corporate Controller
Camden National Corporation
(800) 860-8821
FOR IMMEDIATE RELEASE
CAMDEN NATIONAL CORPORATION REPORTS
SECOND QUARTER 2020 FINANCIAL RESULTS
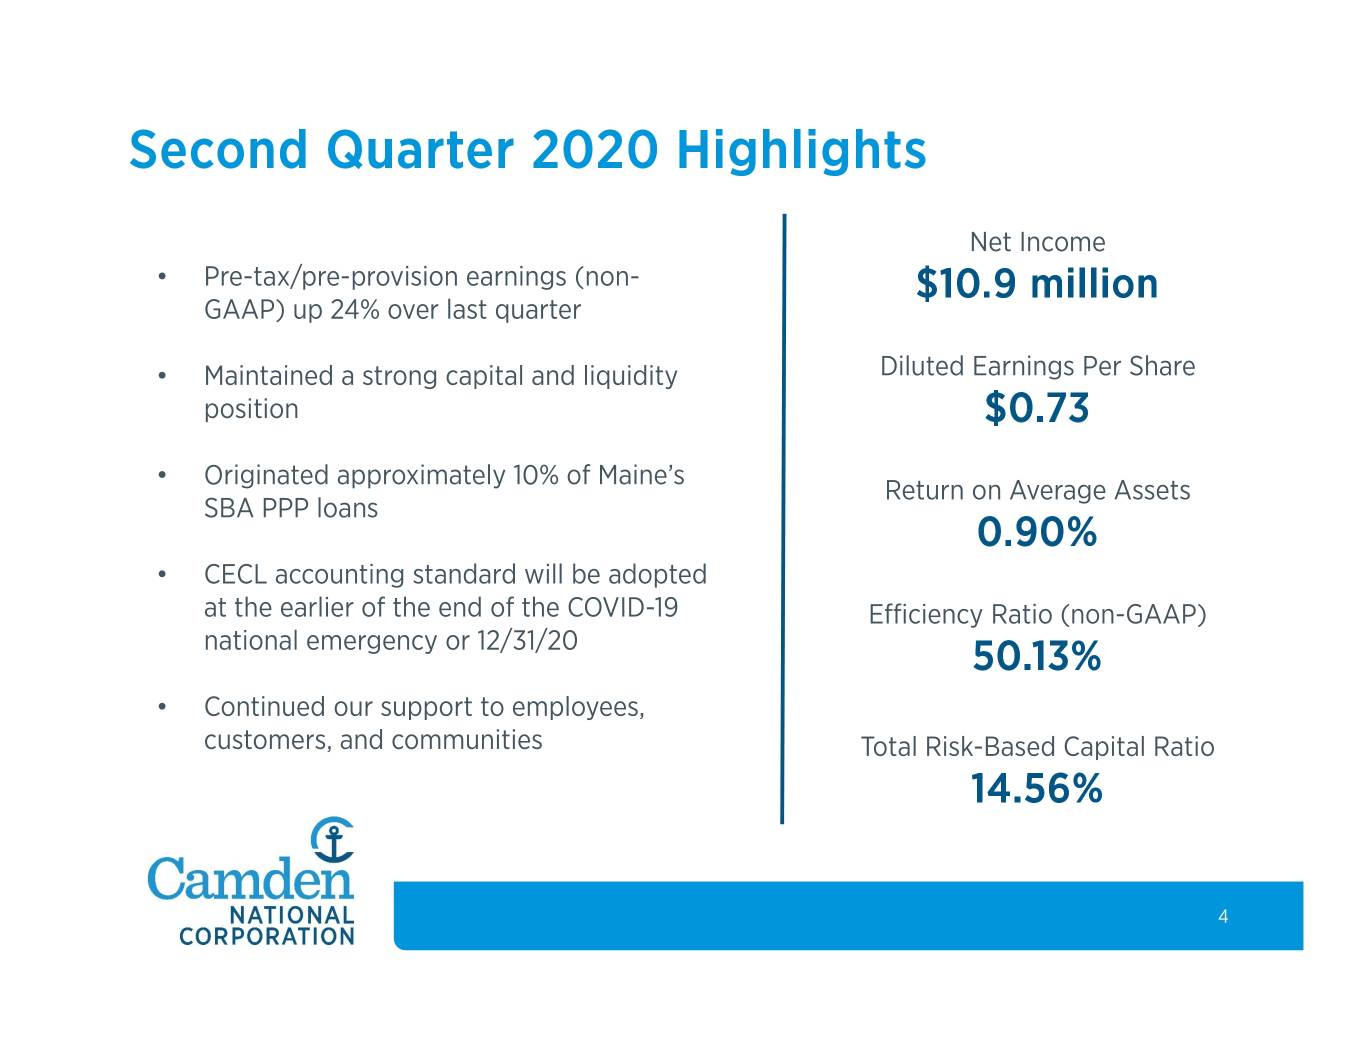
Second Quarter 2020 Net Income of $10.9 Million and Diluted Earnings Per Share of $0.73
CAMDEN, Maine, July 28, 2020/PRNewswire/--Camden National Corporation (NASDAQ: CAC; “Camden National” or the “Company”), a $5.0 billion bank holding company headquartered in Camden, Maine, reported net income for the second quarter 2020 of $10.9 million, a decrease of 17% compared to the second quarter of 2019, and diluted earnings per share ("EPS") of $0.73, a decrease of 14% over the same period. The decrease in net income between periods was driven by higher provision expense in response to the COVID-19 pandemic. Second quarter 2020 pre-tax, pre-provision earnings1 increased $5.4 million, or 31%, over the second quarter of 2019.
"Over the past several months, we have navigated new economic and social challenges as a result of the COVID-19 pandemic," said Gregory A. Dufour, President and Chief Executive Officer of the Company. "The health and financial well-being of our customers, employees, and communities has been top of mind and a significant factor in the decisions made to date. We recognize these are trying times for many, and we continue to diligently support our constituents, which included providing over 2,900 Paycheck Protection Program loans to small businesses and over 2,000 temporary loan payment deferrals to business and retail customers through June 30."
Dufour added, "While the total financial impact of the COVID-19 pandemic remains unclear, we remain well-positioned to withstand the uncertainty. We are fortifying our balance sheet as shown by our pre-tax, pre-provision earnings1 contribution, which is allowing us to build our reserves for loan losses that may occur due to the changing economy."
SECOND QUARTER 2020 HIGHLIGHTS
• | Net income decreased by 17% compared to the second quarter of 2019 and by 19% compared to the first quarter of 2020 |
• | Second quarter 2020 pre-tax, pre-provision earnings1 increased 31% over the second quarter of 2019 and 24% over the first quarter of 2020 |
• | We continue to support our communities and customers through the COVID-19 pandemic, highlighted by our lending and relief efforts, which included originating 10% of the Small Business Administration ("SBA") Paycheck Protection Program ("PPP") loans to small businesses across Maine, according to SBA data, and providing temporary debt relief on over 2,000 loans to business and retail customers through June 30, 2020 |
• | Asset quality remains strong with non-performing assets of 0.23% of total loans as of June 30, 2020 and second quarter 2020 annualized net charge-offs of 0.05% of average loans |
• | Capital remains a source of strength with capital ratios well in excess of regulatory capital thresholds and an allowance for loan losses of 3.1 times non-performing loans as of June 30, 2020 |
FINANCIAL CONDITION
Assets. Total assets increased 12% since December 31, 2019, to $5.0 billion at June 30, 2020. Asset growth was driven by loan growth, including loans held for sale, of $255.8 million, or 8%, investments growth of $131.0 million, or 14%, and an increase in cash balances of $80.2 million, or 106%.
Loans. For the six months ended June 30, 2020, commercial loans grew $204.3 million, or 46%, driven by SBA PPP loans. Through June 30, 2020, the Company originated 2,919 PPP loans with total balances of $237.0 million. At June 30, 2020, outstanding PPP loan balances were $225.8 million.
Over the same period, commercial real estate loans grew $67.6 million, or 5%, driven by funding of prior period loan commitments, while consumer and home equity loans decreased 7% and residential mortgage loans decreased 2%.
Through the first six months of 2020, the Company originated $461.5 million of residential mortgages and sold 58% of its production to the secondary market. In comparison, for the same period last year, the Company originated $214.5 million and sold 46% of its production. Residential mortgage refinance activity was 67% of total production for the six months ended June 30, 2020, compared to 28% for the same period last year.
Cash and Investments. Strong deposit growth in the first half of 2020 of $458.6 million, or 13%, led to an increase in cash and investments. The Company designated its investment purchases as available-for-sale ("AFS") to secure its liquidity position. At June 30, 2020, the Company's AFS investments were in an unrealized gain position of $37.3 million, compared to $4.1 million at December 31, 2019, driven by the lower interest rate environment between periods.
Goodwill. In light of recent events related to the COVID-19 pandemic and its impact on the broad equity markets and economy, the Company assessed its goodwill for impairment in the second quarter of 2020 by calculating its estimated fair value and comparing to its book value. As of June 30, 2020, the Company concluded its goodwill was not impaired.
Deposits and Borrowings. Deposits increased 13% since December 31, 2019, to $4.0 billion at June 30, 2020. For the six months ended June 30, 2020, checking account balances grew $355.8 million, or 21%, and savings and money market balances grew $159.4 million, or 14%. The increase in deposits was driven by various factors in response to the COVID-19 pandemic, including the federal government stimulus programs and a shift in consumer habits as the national personal savings rate reached 23% in May 2020.
The Company's loan-to-deposit ratio was 83% at June 30, 2020, compared to 87% at December 31, 2019 and 86% at June 30, 2019.
Total borrowings decreased 2% since December 31, 2019 to $330.2 million at June 30, 2020. The Company continues to primarily use short-term borrowings to supplement funding in the current low interest rate environment. In the first half of 2020, it also locked-in long-term funding at interest rates below 1%.
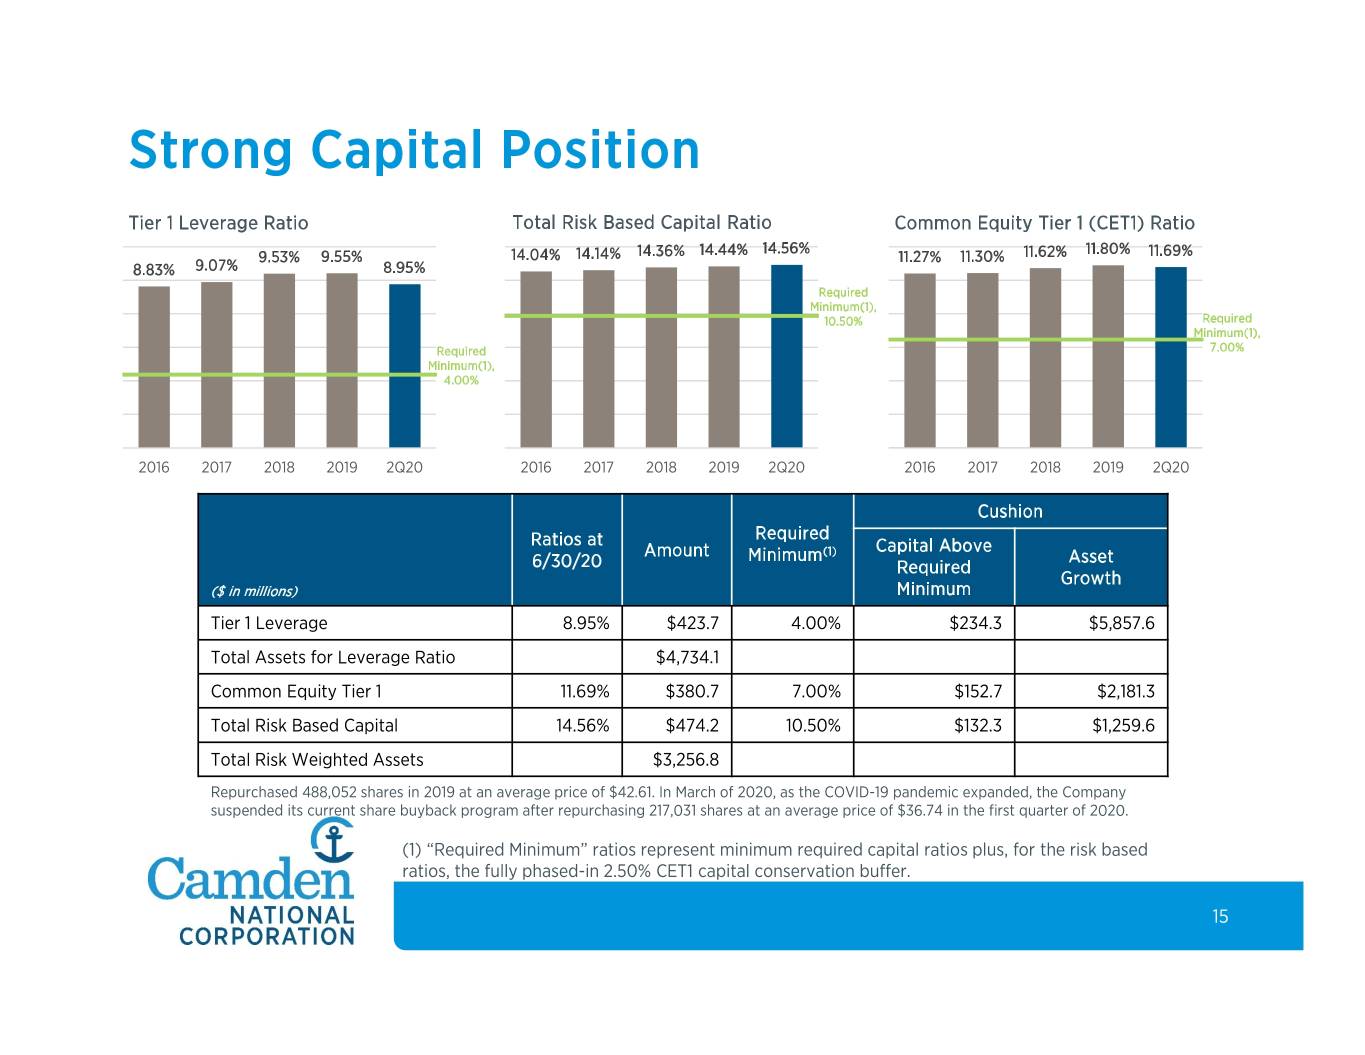
Shareholders' Equity. The Company continues to be well-positioned from a capital perspective to withstand the economic uncertainty surrounding the COVID-19 pandemic. At June 30, 2020, the Company's capital position was well in excess of regulatory requirements, including a total risk-based capital ratio of 14.56%, a tier 1 risk-based capital ratio of 13.01%, common equity tier 1 risk-based capital ratio of 11.69%, and a tier 1 leverage ratio of 8.95%. Additionally, at June 30, 2020, the Company's common equity ratio was 10.21% and tangible common
equity ratio1 was 8.41%.
In June 2020, the Company announced a cash dividend to shareholders of $0.33 per share, consistent with that issued for the first quarter of 2020. The cash dividend is payable to shareholders of record as of July 15, 2020, and shareholders will begin receiving payments on July 31, 2020. As of June 30, 2020, the Company's annualized dividend yield was 3.82% based on Camden National's closing share price of $34.54, as reported by NASDAQ.
The Company suspended its share repurchase program during the first quarter of 2020 in response to the COVID-19 pandemic. We will continue to evaluate our use of the share repurchase program as the impact and our response to the COVID-19 pandemic develops.
ASSET QUALITY
As of June 30, 2020, the Company's asset quality metrics continue to be stable and consistent with past quarters.
• | Non-performing assets were 0.23% of total assets at June 30, 2020, compared to 0.23% and 0.25% at March 31, 2020 and December 31, 2019, respectively. |
• | Past due loans were 0.19% of total loans at June 30, 2020, compared to 0.24% and 0.17% at March 31, 2020 and December 31, 2019, respectively. |
• | Net charge-offs (annualized) for the second quarter of 2020 were 0.05% of average loans, compared to 0.05% for the first quarter of 2020 and 0.09% for the fourth quarter of 2019. |
COVID-19 Loan Modification Program. In March 2020, the Company began offering temporary debt relief to business and retail customers impacted by the COVID-19 pandemic. Generally, the terms of this initial temporary debt relief program provided customers with 90 to 180 days of payment deferral. All loan modifications made by the Company complied with the terms of the Coronavirus Aid, Relief, and Economic Security Act ("CARES Act") or bank regulator guidance, and, thus, were not designated or accounted for as troubled-debt restructurings.
Through June 30, 2020, the Company had modified 2,064 business and retail customer loans to provide temporary debt relief to customers impacted by the COVID-19 pandemic. As of June 30, 2020, 1,763 customer loans with total loan balances of $546.7 million were still under the terms of a COVID-19 loan modification. As the original loan modification term matures, the Company may, at its discretion, extend or modify the loan terms again. With many of the original loan modifications maturing in July, the Company is currently engaged in discussion with these customers to determine if further payment relief is needed. The terms of those loan modifications will be on a case-by-case assessment, and may include an extension of payment deferral in full or in part.
Allowance for Credit Losses and Provision Expense. The provision for credit losses for the three and six months ended June 30, 2020 was $9.4 million and $11.2 million, respectively, compared to $1.2 million and $1.9 million for the three and six months ended June 30, 2019. While asset quality was strong at June 30, 2020, the increase in provision expense between periods reflects a measure of impact attributed to the COVID-19 pandemic, based on available information at that time, which includes consideration of loan modification levels and industry risk.
At June 30, 2020, the Company's allowance for loan losses was $35.5 million, or 1.07% of total loans and 3.1 times non-performing loans, compared to $25.2 million, or 0.81% of total loans and 2.3 times non-performing loans, at December 31, 2019.
CECL. In the first quarter of 2020, the Company chose to delay its implementation of the current expected credit losses model, commonly referred to as "CECL," in accordance with the provisions of the CARES Act. As such, the reported allowance for credit losses and related provision expense for the three and six months ended June 30, 2020 was accounted for under the incurred loss model. In accordance with the CARES Act, the Company will delay implementation of CECL until the earlier of (i) the date on which the national emergency concerning the COVID-19 pandemic terminates, or (ii) December 31, 2020.
While the Company has not yet adopted CECL, it estimates that as of June 30, 2020, the allowance for credit losses under CECL, which is comprised of allowance for loan losses and unfunded commitments, would have been $40.0 million to $44.0 million, or 1.20% to 1.32% of loans at June 30, 2020.
FINANCIAL OPERATING RESULTS (Q2 2020 vs. Q2 2019)
Net income for the second quarter of 2020 was $10.9 million, a decrease of $2.3 million, or 17%, compared to the second quarter of 2019. Diluted EPS for the second quarter of 2020 was $0.73, a decrease of $0.12, or 14%. Lower earnings between periods was driven by an increase in provision expense of $8.2 million.
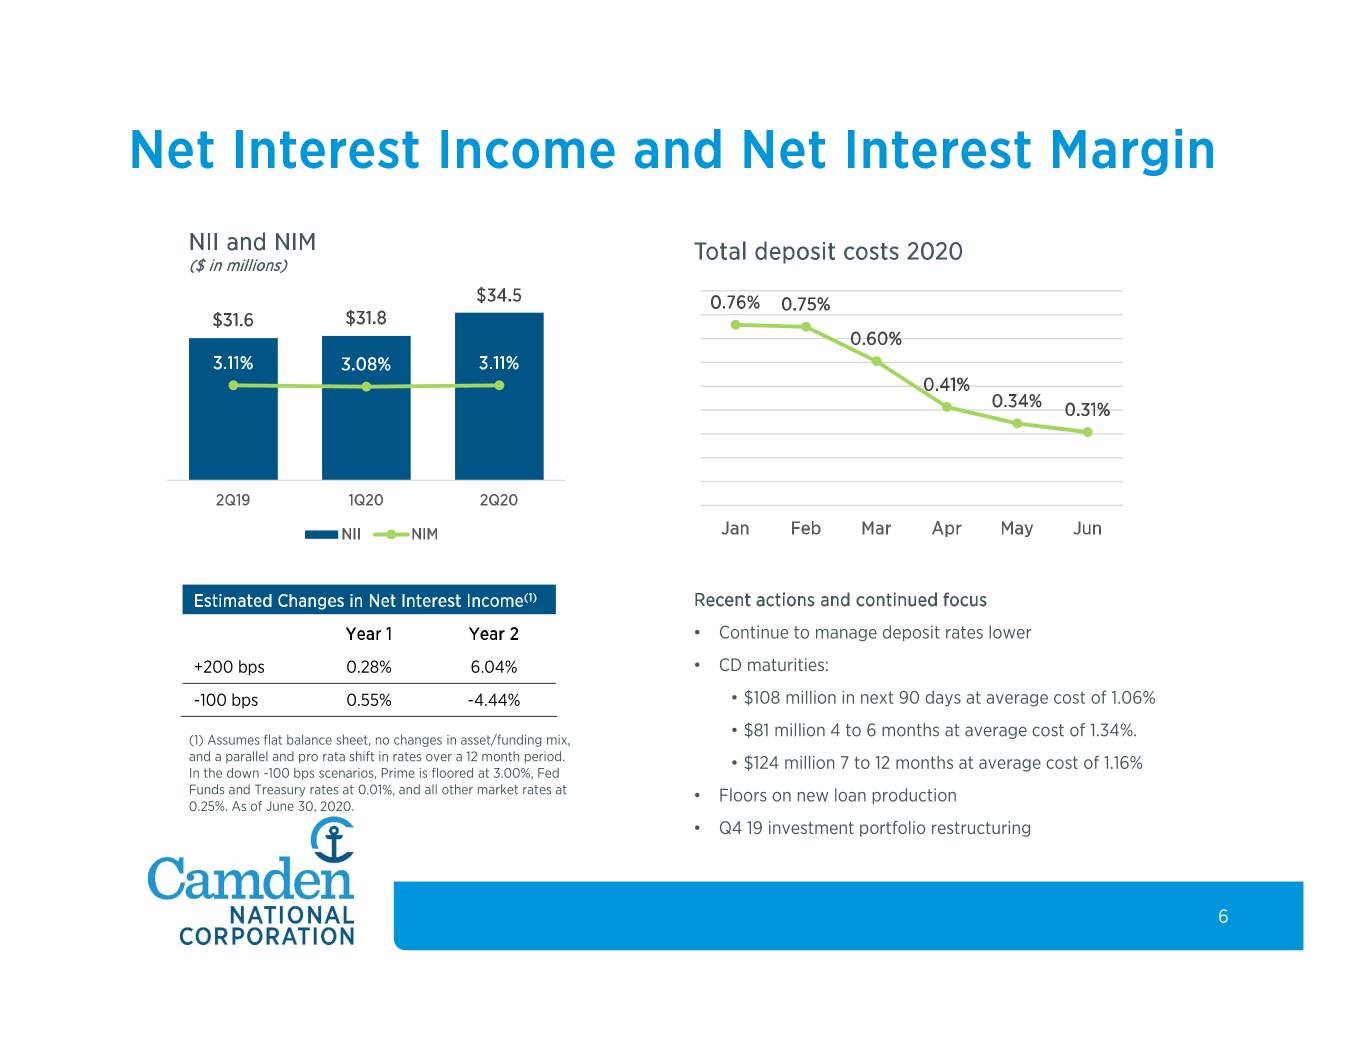
Net Interest Income. Net interest income for the second quarter of 2020 was $34.5 million, an increase of $3.0 million, or 9%, over the second quarter of 2019 due to an increase in average interest-earning assets of 10%. Net interest margin for the second quarter of 2020 and 2019 was 3.11%.
Average interest-earning assets for the second quarter of 2020 were $4.5 billion, an increase of $394.5 million over the second quarter of 2019. The primary drivers for the growth between periods included (i) average loan growth of 8% and (ii) an increase in average cash and investment balances of 14%. The largest driver of average loan growth between periods was an increase in average PPP loans of $178.1 million during the second quarter of 2020.
Net interest margin for the second quarter of 2020 and 2019 was 3.11%. The make-up of net interest margin between periods varied significantly due to the change in interest rates and the roll-out of PPP loans in the second quarter of 2020.
• | The 10-year U.S. Treasury rate averaged 0.69% in the second quarter of 2020, compared to 2.34% for the second quarter of 2019. The decrease in benchmark interest rates drove a decrease in yield on interest-earnings assets of 0.65% to 3.53% for the second quarter of 2020, and was partially offset by $1.7 million of PPP loan income recognized in the second quarter of 2020 with an average yield of 3.79%. |
• | The Federal Funds rate throughout the quarter was 0.25%, compared to 2.50% for the second quarter of 2019. In response to decreasing asset yields and funding rates, the Company effectively managed its cost of funds down to minimize the impact of the interest rate environment on net interest margin. Deposit costs decreased 0.51% between periods to 0.35% for the second quarter of 2020. Our cost of funds for the second quarter of 2020 was 0.44%, compared to 1.13% for the second quarter of 2019. |
Provision for Credit Losses. The provision for credit losses for the second quarter of 2020 was $9.4 million, compared to $1.2 million for the second quarter of 2019. The increase in provision expense between periods was driven by an increase in allowance for loan losses due to estimates attributed to the COVID-19 pandemic.
Non-Interest Income. Non-interest income for the second quarter of 2020 was $12.1 million, an increase of $2.0 million, or 20%, over the second quarter of 2019.
• | Mortgage banking income for the second quarter of 2020 increased $2.9 million over the second quarter of 2019 as mortgage refinance activity was strong due to the low interest rate environment. Refinance activity was 71% of unit production in the second quarter of 2020, compared to 25% for the second quarter of 2019. |
• | Service charges on deposit accounts for the second quarter of 2020 decreased $872,000, compared to the second quarter of 2019 due to lower overdraft fees and deposit account fees as customer deposit balances increased but the number of customer transactions decreased. |
Non-Interest Expense. Non-interest expense for the second quarter of 2020 was $23.5 million, a decrease of $449,000, or 2%, compared to the second quarter of 2019. Certain costs were lower between periods as priorities shifted and employees transitioned to working remotely in response to the COVID-19 pandemic, while other costs increased to ensure the safety and health of our employees during this unprecedented time.
FINANCIAL OPERATING RESULTS (Q2 2020 vs. Q1 2020)
Net income between quarters decreased $2.6 million, or 19%, and diluted EPS decreased $0.16, or 18%, over the same period. Lower earnings between quarters was driven by an increase in provision expense of $7.6 million.
Net Interest Income. Net interest income increased $2.7 million, or 9%, between quarters as net interest margin increased 3 basis points to 3.11% for the second quarter of 2020 and average loan growth was $187.2 million, or 6%. The decrease in cost of funds between quarters of 0.42% outpaced the decrease in yield on interest-earning assets of 0.37%. The decrease in yields and cost of funds reflects the current interest rate environment as loans and deposits are originated and reprice to historically low levels. Average loan growth between periods was driven by PPP loan originations, which averaged $178.1 million for the second quarter of 2020.
Provision for Credit Losses. The provision for credit losses increased $7.6 million between quarters. The increase in provision expense between periods was driven by an increase in allowance for loan losses due to estimates attributed to the COVID-19 pandemic.
Non-Interest Income. Non-interest income increased $657,000, or 6%, between quarters.
• | Mortgage banking income increased $1.2 million, or 33%, between periods as mortgage and refinance activity momentum continued into the second quarter of 2020 and interest rates remained low. |
• | Debit card income increased $250,000, or 12%, driven by higher customer spending as the increase in the average spend per transaction more than offset the decrease in the number of transactions. |
• | Service charges on deposit accounts between quarters decreased $675,000, or 34%, due to lower overdraft fees and deposit account fees as customer deposit balances increased but the number of customer transactions decreased. |
Non-Interest Expense. Non-interest expense decreased $1.1 million, or 4%, between quarters. The decrease was driven by (i) lower employee-related costs as employees transitioned to remote working in the second quarter of 2020; (ii) lower marketing costs; and (iii) a decrease in incentive accruals. This was partially offset by the annual equity award grant to Company directors in the second quarter of 2020.
CONFERENCE CALL
Camden National will host a conference call and webcast at 3:00 p.m., Eastern Time, on Tuesday, July 28, 2020 to discuss its second quarter 2020 financial results and outlook. Participants should dial in to the call 10 - 15 minutes before it begins. Information about the conference call is as follows:
Live dial-in (domestic): (888) 349-0139
Live dial-in (international): (412) 542-4154
Live webcast: https://services.choruscall.com/links/cac200728.html
A link to the live webcast will be available on Camden National's website under "Investor Relations" at www.CamdenNational.com prior to the meeting, and a replay of the webcast will be available on Camden National's website following the conference call. The transcript of the conference call will also be available on Camden National's website approximately two days after the conference call.
ABOUT CAMDEN NATIONAL CORPORATION
Camden National Corporation (NASDAQ:CAC) is the largest publicly traded bank holding company in Northern New England with $5.0 billion in assets and 650 employees. Camden National Bank, its subsidiary, is a full-service community bank founded in 1875 in Camden, Maine. Dedicated to customers at every stage of their financial journey, the bank offers the latest in digital banking, complemented by personalized service with 58 banking centers, 24/7 live phone support, 68 ATMs, and additional lending offices in New Hampshire and Massachusetts.
For the past two years, Camden National Bank was named "Customer Experience Leader in U.S. Retail Banking" by Greenwich Associates, and in 2019, it was the only New England based organization included in Sandler O'Neill's "Bank and Thrift Sm-All Star" list of high-performing financial institutions. The Finance Authority of Maine has awarded Camden National Bank as "Lender at Work for Maine" for ten years. Comprehensive wealth management, investment and financial planning services are delivered by Camden National Wealth Management. To learn more, visit CamdenNational.com. Member FDIC.
FORWARD-LOOKING STATEMENTS
Certain statements contained in this press release that are not statements of historical fact constitute forward-looking statements within the meaning of the Private Securities Litigation Reform Act of 1995, as amended, including certain plans, expectations, goals, projections and other statements, which are subject to numerous risks, assumptions and uncertainties. Forward-looking statements can be identified by the fact that they do not relate strictly to historical or current facts. They often include words like “believe,” “expect,” “anticipate,” “estimate,” and “intend” or future or conditional verbs such as “will,” “would,” “should,” “could” or “may.” Certain factors that could cause actual results to differ materially from expected results include increased competitive pressures; changes in the interest rate environment; changes in general economic conditions; operational risks including, but not limited to, cybersecurity, fraud and natural disasters; legislative and regulatory changes that adversely affect the business in which Camden National is engaged; changes in the securities markets and other risks and uncertainties disclosed from time to time in in Camden National’s Annual Report on Form 10-K for the year ended December 31, 2019, as updated by other filings with the Securities and Exchange Commission ("SEC"). Further, statements about the potential effects of the COVID-19 pandemic on our business, results of operations and financial condition may constitute forward-looking statements and are subject to the risk that the actual effects may differ, possibly materially, from what is reflected in those forward-looking statements due to factors and future developments that are uncertain, unpredictable and in many cases beyond our control, including the scope and duration of the pandemic, action taken by government authorities in response to the pandemic, and the direct and indirect impact of the pandemic on our customers, service providers and on economies and markets more generally. Camden National does not have any obligation to update forward-looking statements.
USE OF NON-GAAP MEASURES
In addition to evaluating the Company's results of operations in accordance with generally accepted accounting principles in the United States ("GAAP"), management supplements this evaluation with certain non-GAAP financial measures, such as pre-tax, pre-provision earnings; return on average tangible equity; the efficiency and tangible common equity ratios; tangible book value per share; core deposits and average core deposits. Management utilizes these non-GAAP financial measures for purposes of measuring our performance against our peer group and other financial institutions and analyzing our internal performance. We also believe these non-GAAP financial measure help investors better understand the Company's operating performance and trends and allow for better performance comparisons to other financial institutions. In addition, these non-GAAP financial measures remove the impact of unusual items that may obscure trends in the Company's underlying performance. These disclosures should not be viewed as a substitute for GAAP operating results, nor are they necessarily comparable to non-GAAP performance measures that may be presented by other financial institutions. Reconciliation to the comparable GAAP financial measure can be found in this document.
ANNUALIZED DATA
Certain returns, yields and performance ratios are presented on an “annualized” basis. This is done for analytical and decision-making purposes to better discern underlying performance trends when compared to full-year or year-over-year amounts. Annualized data may not be indicative of any four-quarter period, and are presented for illustrative purposes only.
_____________________________________________________________________________________________
1 | This is a non-GAAP measure. Please refer to "Reconciliation of non-GAAP to GAAP Financial Measures" for further details. |
Selected Financial Data (unaudited) | ||||||||||||||||||||
At or For The Three Months Ended | At or For The Six Months Ended | |||||||||||||||||||
(In thousands, except number of shares and per share data) | June 30, 2020 | March 31, 2020 | June 30, 2019 | June 30, 2020 | June 30, 2019 | |||||||||||||||
Financial Condition Data | ||||||||||||||||||||
Investments | $ | 1,064,089 | $ | 976,487 | $ | 933,100 | $ | 1,064,089 | $ | 933,100 | ||||||||||
Loans and loans held for sale | 3,362,631 | 3,185,492 | 3,113,437 | 3,362,631 | 3,113,437 | |||||||||||||||
Allowance for loan losses | 35,539 | 26,521 | 26,163 | 35,539 | 26,163 | |||||||||||||||
Total assets | 4,959,016 | 4,594,539 | 4,447,038 | 4,959,016 | 4,447,038 | |||||||||||||||
Deposits | 3,996,358 | 3,563,705 | 3,591,610 | 3,996,358 | 3,591,610 | |||||||||||||||
Borrowings | 330,229 | 420,877 | 310,638 | 330,229 | 310,638 | |||||||||||||||
Shareholders' equity | 506,467 | 492,680 | 467,759 | 506,467 | 467,759 | |||||||||||||||
Operating Data | ||||||||||||||||||||
Net interest income | $ | 34,539 | $ | 31,826 | $ | 31,573 | $ | 66,365 | $ | 63,468 | ||||||||||
Provision for credit losses | 9,398 | 1,775 | 1,173 | 11,173 | 1,917 | |||||||||||||||
Non-interest income | 12,060 | 11,403 | 10,037 | 23,463 | 19,426 | |||||||||||||||
Non-interest expense | 23,509 | 24,561 | 23,958 | 48,070 | 46,741 | |||||||||||||||
Income before income tax expense | 13,692 | 16,893 | 16,479 | 30,585 | 34,236 | |||||||||||||||
Income tax expense | 2,752 | 3,400 | 3,275 | 6,152 | 6,759 | |||||||||||||||
Net income | $ | 10,940 | $ | 13,493 | $ | 13,204 | $ | 24,433 | $ | 27,477 | ||||||||||
Key Ratios | ||||||||||||||||||||
Return on average assets | 0.90 | % | 1.21 | % | 1.21 | % | 1.05 | % | 1.27 | % | ||||||||||
Return on average equity | 8.81 | % | 11.30 | % | 11.63 | % | 10.03 | % | 12.36 | % | ||||||||||
GAAP efficiency ratio | 50.45 | % | 56.82 | % | 57.58 | % | 53.51 | % | 56.39 | % | ||||||||||
Net interest margin (fully-taxable equivalent) | 3.11 | % | 3.08 | % | 3.11 | % | 3.10 | % | 3.14 | % | ||||||||||
Non-performing assets to total assets | 0.23 | % | 0.23 | % | 0.34 | % | 0.23 | % | 0.34 | % | ||||||||||
Common equity ratio | 10.21 | % | 10.72 | % | 10.52 | % | 10.21 | % | 10.52 | % | ||||||||||
Tier 1 leverage capital ratio | 8.95 | % | 9.53 | % | 9.51 | % | 8.95 | % | 9.51 | % | ||||||||||
Common equity tier 1 risk-based capital ratio | 11.69 | % | 11.27 | % | 11.47 | % | 11.69 | % | 11.47 | % | ||||||||||
Tier 1 risk-based capital ratio | 13.01 | % | 12.56 | % | 12.82 | % | 13.01 | % | 12.82 | % | ||||||||||
Total risk-based capital ratio | 14.56 | % | 13.81 | % | 14.12 | % | 14.56 | % | 14.12 | % | ||||||||||
Per Share Data | ||||||||||||||||||||
Basic earnings per share | $ | 0.73 | $ | 0.89 | $ | 0.85 | $ | 1.62 | $ | 1.76 | ||||||||||
Diluted earnings per share | $ | 0.73 | $ | 0.89 | $ | 0.85 | $ | 1.62 | $ | 1.76 | ||||||||||
Cash dividends declared per share | $ | 0.33 | $ | 0.33 | $ | 0.30 | $ | 0.66 | $ | 0.60 | ||||||||||
Book value per share | $ | 33.85 | $ | 32.95 | $ | 30.26 | $ | 33.85 | $ | 30.26 | ||||||||||
Non-GAAP Measures(1) | ||||||||||||||||||||
Return on average tangible equity | 11.09 | % | 14.35 | % | 15.00 | % | 12.68 | % | 16.01 | % | ||||||||||
Efficiency ratio | 50.13 | % | 56.45 | % | 57.27 | % | 53.17 | % | 56.07 | % | ||||||||||
Pre-tax, pre-provision earnings | $ | 23,090 | $ | 18,668 | $ | 17,652 | $ | 41,758 | $ | 36,153 | ||||||||||
Tangible common equity ratio | 8.41 | % | 8.78 | % | 8.49 | % | 8.41 | % | 8.49 | % | ||||||||||
Tangible book value per share | $ | 27.31 | $ | 26.39 | $ | 23.88 | $ | 27.31 | $ | 23.88 | ||||||||||
(1) Please see "Reconciliation of non-GAAP to GAAP Financial Measures (unaudited)."
Consolidated Statements of Condition Data (unaudited) | ||||||||||||
(In thousands) | June 30, 2020 | December 31, 2019 | June 30, 2019 | |||||||||
ASSETS | ||||||||||||
Cash and due from banks | $ | 56,292 | $ | 39,586 | $ | 48,153 | ||||||
Interest-bearing deposits in other banks (including restricted cash) | 99,536 | 36,050 | 38,083 | |||||||||
Total cash, cash equivalents and restricted cash | 155,828 | 75,636 | 86,236 | |||||||||
Investments: | ||||||||||||
Available-for-sale securities, at fair value (book value of $1,010,325, $913,978 and $915,099, respectively) | 1,047,663 | 918,118 | 920,083 | |||||||||
Held-to-maturity securities, at amortized cost (fair value of $1,388, $1,359 and $1,335, respectively) | 1,299 | 1,302 | 1,304 | |||||||||
Other investments | 15,127 | 13,649 | 11,713 | |||||||||
Total investments | 1,064,089 | 933,069 | 933,100 | |||||||||
Loans held for sale, at fair value (book value of $35,909, $11,915 and $13,088, respectively) | 36,590 | 11,854 | 13,113 | |||||||||
Loans: | ||||||||||||
Commercial real estate | 1,310,985 | 1,243,397 | 1,260,639 | |||||||||
Commercial(1) | 428,186 | 442,701 | 456,692 | |||||||||
SBA PPP | 218,803 | — | — | |||||||||
Residential real estate | 1,054,333 | 1,070,374 | 1,035,792 | |||||||||
Consumer and home equity | 313,734 | 338,551 | 347,201 | |||||||||
Total loans | 3,326,041 | 3,095,023 | 3,100,324 | |||||||||
Less: allowance for loan losses | (35,539 | ) | (25,171 | ) | (26,163 | ) | ||||||
Net loans | 3,290,502 | 3,069,852 | 3,074,161 | |||||||||
Goodwill | 94,697 | 94,697 | 94,697 | |||||||||
Core deposit intangible assets | 3,184 | 3,525 | 3,877 | |||||||||
Bank-owned life insurance | 93,647 | 92,344 | 91,116 | |||||||||
Premises and equipment, net | 41,109 | 41,836 | 41,402 | |||||||||
Deferred tax assets | 10,705 | 16,823 | 16,836 | |||||||||
Other assets | 168,665 | 89,885 | 92,500 | |||||||||
Total assets | $ | 4,959,016 | $ | 4,429,521 | $ | 4,447,038 | ||||||
LIABILITIES AND SHAREHOLDERS’ EQUITY | ||||||||||||
Liabilities | ||||||||||||
Deposits: | ||||||||||||
Non-interest checking | $ | 712,146 | $ | 552,590 | $ | 505,355 | ||||||
Interest checking | 1,349,456 | 1,153,203 | 1,111,424 | |||||||||
Savings and money market | 1,278,603 | 1,119,193 | 1,074,094 | |||||||||
Certificates of deposit | 431,376 | 521,752 | 547,786 | |||||||||
Brokered deposits | 224,777 | 191,005 | 352,951 | |||||||||
Total deposits | 3,996,358 | 3,537,743 | 3,591,610 | |||||||||
Short-term borrowings | 245,998 | 268,809 | 241,647 | |||||||||
Long-term borrowings | 25,000 | 10,000 | 10,000 | |||||||||
Subordinated debentures | 59,231 | 59,080 | 58,991 | |||||||||
Accrued interest and other liabilities | 125,962 | 80,474 | 77,031 | |||||||||
Total liabilities | 4,452,549 | 3,956,106 | 3,979,279 | |||||||||
Shareholders’ equity | 506,467 | 473,415 | 467,759 | |||||||||
Total liabilities and shareholders’ equity | $ | 4,959,016 | $ | 4,429,521 | $ | 4,447,038 | ||||||
(1) Includes the HPFC loan portfolio.
Consolidated Statements of Income Data (unaudited) | ||||||||||||
For The Three Months Ended | ||||||||||||
(In thousands, except per share data) | June 30, 2020 | March 31, 2020 | June 30, 2019 | |||||||||
Interest Income | ||||||||||||
Interest and fees on loans | $ | 33,120 | $ | 34,045 | $ | 36,092 | ||||||
Taxable interest on investments | 4,883 | 4,878 | 4,941 | |||||||||
Nontaxable interest on investments | 828 | 787 | 624 | |||||||||
Dividend income | 167 | 168 | 174 | |||||||||
Other interest income | 180 | 335 | 606 | |||||||||
Total interest income | 39,178 | 40,213 | 42,437 | |||||||||
Interest Expense | ||||||||||||
Interest on deposits | 3,392 | 6,662 | 9,156 | |||||||||
Interest on borrowings | 359 | 838 | 885 | |||||||||
Interest on subordinated debentures | 888 | 887 | 823 | |||||||||
Total interest expense | 4,639 | 8,387 | 10,864 | |||||||||
Net interest income | 34,539 | 31,826 | 31,573 | |||||||||
Provision for credit losses | 9,398 | 1,775 | 1,173 | |||||||||
Net interest income after provision for credit losses | 25,141 | 30,051 | 30,400 | |||||||||
Non-Interest Income | ||||||||||||
Mortgage banking income, net | 4,691 | 3,534 | 1,742 | |||||||||
Debit card income | 2,391 | 2,141 | 2,281 | |||||||||
Service charges on deposit accounts | 1,337 | 2,012 | 2,209 | |||||||||
Income from fiduciary services | 1,603 | 1,502 | 1,545 | |||||||||
Bank-owned life insurance | 614 | 689 | 603 | |||||||||
Brokerage and insurance commissions | 622 | 657 | 732 | |||||||||
Customer loan swap fees | 57 | 114 | 285 | |||||||||
Net gain on sale of securities | — | — | 27 | |||||||||
Other income | 745 | 754 | 613 | |||||||||
Total non-interest income | 12,060 | 11,403 | 10,037 | |||||||||
Non-Interest Expense | ||||||||||||
Salaries and employee benefits | 13,627 | 14,327 | 13,461 | |||||||||
Furniture, equipment and data processing | 2,710 | 2,790 | 2,723 | |||||||||
Net occupancy costs | 1,997 | 2,003 | 1,639 | |||||||||
Consulting and professional fees | 1,181 | 783 | 974 | |||||||||
Debit card expense | 878 | 934 | 883 | |||||||||
Regulatory assessments | 299 | 162 | 437 | |||||||||
Amortization of core deposit intangible assets | 171 | 170 | 176 | |||||||||
Other real estate owned and collection costs, net | 98 | 101 | 409 | |||||||||
Other expenses | 2,548 | 3,291 | 3,256 | |||||||||
Total non-interest expense | 23,509 | 24,561 | 23,958 | |||||||||
Income before income tax expense | 13,692 | 16,893 | 16,479 | |||||||||
Income Tax Expense | 2,752 | 3,400 | 3,275 | |||||||||
Net Income | $ | 10,940 | $ | 13,493 | $ | 13,204 | ||||||
Per Share Data | ||||||||||||
Basic earnings per share | $ | 0.73 | $ | 0.89 | $ | 0.85 | ||||||
Diluted earnings per share | $ | 0.73 | $ | 0.89 | $ | 0.85 | ||||||
Consolidated Statements of Income Data (unaudited) | ||||||||
For The Six Months Ended June 30, | ||||||||
(In thousands, except per share data) | 2020 | 2019 | ||||||
Interest Income | ||||||||
Interest and fees on loans | $ | 67,165 | $ | 71,813 | ||||
Taxable interest on investments | 9,761 | 9,935 | ||||||
Nontaxable interest on investments | 1,615 | 1,268 | ||||||
Dividend income | 335 | 404 | ||||||
Other interest income | 515 | 1,026 | ||||||
Total interest income | 79,391 | 84,446 | ||||||
Interest Expense | ||||||||
Interest on deposits | 10,054 | 17,579 | ||||||
Interest on borrowings | 1,197 | 1,859 | ||||||
Interest on subordinated debentures | 1,775 | 1,540 | ||||||
Total interest expense | 13,026 | 20,978 | ||||||
Net interest income | 66,365 | 63,468 | ||||||
Provision for credit losses | 11,173 | 1,917 | ||||||
Net interest income after provision for credit losses | 55,192 | 61,551 | ||||||
Non-Interest Income | ||||||||
Mortgage banking income, net | 8,225 | 2,994 | ||||||
Debit card income | 4,532 | 4,291 | ||||||
Service charges on deposit accounts | 3,349 | 4,232 | ||||||
Income from fiduciary services | 3,105 | 2,937 | ||||||
Bank-owned life insurance | 1,303 | 1,197 | ||||||
Brokerage and insurance commissions | 1,279 | 1,317 | ||||||
Customer loan swap fees | 171 | 810 | ||||||
Net gain on sale of securities | — | 27 | ||||||
Other income | 1,499 | 1,621 | ||||||
Total non-interest income | 23,463 | 19,426 | ||||||
Non-Interest Expense | ||||||||
Salaries and employee benefits | 27,954 | 26,439 | ||||||
Furniture, equipment and data processing | 5,500 | 5,403 | ||||||
Net occupancy costs | 4,000 | 3,553 | ||||||
Consulting and professional fees | 1,964 | 1,787 | ||||||
Debit card expense | 1,812 | 1,706 | ||||||
Regulatory assessments | 461 | 909 | ||||||
Amortization of core deposit intangible assets | 341 | 352 | ||||||
Other real estate owned and collection costs, net | 199 | 102 | ||||||
Other expenses | 5,839 | 6,490 | ||||||
Total non-interest expense | 48,070 | 46,741 | ||||||
Income before income tax expense | 30,585 | 34,236 | ||||||
Income Tax Expense | 6,152 | 6,759 | ||||||
Net Income | $ | 24,433 | $ | 27,477 | ||||
Per Share Data | ||||||||
Basic earnings per share | $ | 1.62 | $ | 1.76 | ||||
Diluted earnings per share | $ | 1.62 | $ | 1.76 | ||||
Quarterly Average Balance and Yield/Rate Analysis (unaudited) | |||||||||||||||||||||
Average Balance | Yield/Rate | ||||||||||||||||||||
For The Three Months Ended | For The Three Months Ended | ||||||||||||||||||||
(Dollars in thousands) | June 30, 2020 | March 31, 2020 | June 30, 2019 | June 30, 2020 | March 31, 2020 | June 30, 2019 | |||||||||||||||
Assets | |||||||||||||||||||||
Interest-earning assets: | |||||||||||||||||||||
Interest-bearing deposits in other banks and other interest-earning assets | $ | 168,221 | $ | 66,180 | $ | 59,901 | 0.06 | % | 1.24 | % | 2.34 | % | |||||||||
Investments - taxable | 836,885 | 809,041 | 839,714 | 2.49 | % | 2.56 | % | 2.56 | % | ||||||||||||
Investments - nontaxable(1) | 124,101 | 117,537 | 90,087 | 3.38 | % | 3.39 | % | 3.51 | % | ||||||||||||
Loans(2): | |||||||||||||||||||||
Commercial real estate | 1,302,393 | 1,273,538 | 1,255,172 | 3.83 | % | 4.24 | % | 4.68 | % | ||||||||||||
Residential real estate | 1,084,931 | 1,078,836 | 1,032,215 | 4.06 | % | 4.19 | % | 4.34 | % | ||||||||||||
Commercial(1) | 404,545 | 416,527 | 389,166 | 3.78 | % | 4.21 | % | 4.72 | % | ||||||||||||
Consumer and home equity | 321,019 | 334,771 | 347,141 | 4.29 | % | 5.03 | % | 5.47 | % | ||||||||||||
SBA PPP | 178,119 | — | — | 3.79 | % | — | % | — | % | ||||||||||||
HPFC | 17,659 | 20,336 | 29,472 | 9.28 | % | 7.83 | % | 7.83 | % | ||||||||||||
Municipal(1) | 19,567 | 16,990 | 20,117 | 3.62 | % | 3.67 | % | 3.56 | % | ||||||||||||
Total loans | 3,328,233 | 3,140,998 | 3,073,283 | 3.97 | % | 4.32 | % | 4.68 | % | ||||||||||||
Total interest-earning assets | 4,457,440 | 4,133,756 | 4,062,985 | 3.53 | % | 3.90 | % | 4.18 | % | ||||||||||||
Other assets | 414,225 | 354,436 | 315,604 | ||||||||||||||||||
Total assets | $ | 4,871,665 | $ | 4,488,192 | $ | 4,378,589 | |||||||||||||||
Liabilities & Shareholders' Equity | |||||||||||||||||||||
Deposits: | |||||||||||||||||||||
Non-interest checking | $ | 664,605 | $ | 529,501 | $ | 485,724 | — | % | — | % | — | % | |||||||||
Interest checking | 1,298,468 | 1,146,783 | 1,110,567 | 0.28 | % | 0.70 | % | 1.01 | % | ||||||||||||
Savings | 518,803 | 476,849 | 476,104 | 0.06 | % | 0.07 | % | 0.09 | % | ||||||||||||
Money market | 717,056 | 650,383 | 581,638 | 0.37 | % | 0.98 | % | 1.28 | % | ||||||||||||
Certificates of deposit | 477,068 | 552,079 | 516,972 | 1.34 | % | 1.61 | % | 1.60 | % | ||||||||||||
Total deposits | 3,676,000 | 3,355,595 | 3,171,005 | 0.35 | % | 0.70 | % | 0.86 | % | ||||||||||||
Borrowings: | |||||||||||||||||||||
Brokered deposits | 234,823 | 208,084 | 370,448 | 0.28 | % | 1.54 | % | 2.53 | % | ||||||||||||
Customer repurchase agreements | 209,302 | 236,351 | 246,935 | 0.56 | % | 1.08 | % | 1.30 | % | ||||||||||||
Subordinated debentures | 59,194 | 59,119 | 58,985 | 6.03 | % | 6.04 | % | 5.60 | % | ||||||||||||
Other borrowings | 76,983 | 59,257 | 15,940 | 0.35 | % | 1.39 | % | 2.17 | % | ||||||||||||
Total borrowings | 580,302 | 562,811 | 692,308 | 0.98 | % | 1.80 | % | 2.34 | % | ||||||||||||
Total funding liabilities | 4,256,302 | 3,918,406 | 3,863,313 | 0.44 | % | 0.86 | % | 1.13 | % | ||||||||||||
Other liabilities | 115,914 | 89,612 | 59,747 | ||||||||||||||||||
Shareholders' equity | 499,449 | 480,174 | 455,529 | ||||||||||||||||||
Total liabilities & shareholders' equity | $ | 4,871,665 | $ | 4,488,192 | $ | 4,378,589 | |||||||||||||||
Net interest rate spread (fully-taxable equivalent) | 3.09 | % | 3.04 | % | 3.05 | % | |||||||||||||||
Net interest margin (fully-taxable equivalent) | 3.11 | % | 3.08 | % | 3.11 | % | |||||||||||||||
Net interest margin (fully-taxable equivalent), excluding fair value mark accretion and collection of previously charged-off acquired loans(3) | 3.07 | % | 3.06 | % | 3.07 | % | |||||||||||||||
(1) | Reported on a tax-equivalent basis calculated using the federal corporate income tax rate of 21%, including certain commercial loans. |
(2) | Non-accrual loans and loans held for sale are included in total average loans. |
(3) | Excludes the impact of the fair value mark accretion on loans and certificates of deposit generated in purchase accounting and collection of previously charged-off acquired loans for the three months ended June 30, 2020, March 31, 2020 and June 30, 2019 totaling $403,000, $283,000 and $439,000, respectively. |
Year-to-Date Average Balance and Yield/Rate Analysis (unaudited) | ||||||||||||||
Average Balance | Yield/Rate | |||||||||||||
For The Six Months Ended | For The Six Months Ended | |||||||||||||
(Dollars in thousands) | June 30, 2020 | June 30, 2019 | June 30, 2020 | June 30, 2019 | ||||||||||
Assets | ||||||||||||||
Interest-earning assets: | ||||||||||||||
Interest-bearing deposits in other banks and other interest-earning assets | $ | 117,201 | $ | 48,301 | 0.39 | % | 2.27 | % | ||||||
Investments - taxable | 822,963 | 845,583 | 2.52 | % | 2.56 | % | ||||||||
Investments - nontaxable(1) | 120,819 | 92,386 | 3.38 | % | 3.48 | % | ||||||||
Loans(2): | ||||||||||||||
Commercial real estate | 1,287,965 | 1,268,264 | 4.03 | % | 4.71 | % | ||||||||
Residential real estate | 1,081,884 | 1,020,316 | 4.12 | % | 4.32 | % | ||||||||
Commercial(1) | 410,563 | 379,552 | 4.00 | % | 4.71 | % | ||||||||
Consumer and home equity | 327,895 | 347,097 | 4.66 | % | 5.46 | % | ||||||||
SBA PPP | 89,033 | — | 3.79 | % | — | % | ||||||||
HPFC | 18,997 | 30,814 | 8.50 | % | 7.87 | % | ||||||||
Municipal(1) | 18,279 | 17,738 | 3.64 | % | 3.58 | % | ||||||||
Total loans | 3,234,616 | 3,063,781 | 4.14 | % | 4.69 | % | ||||||||
Total interest-earning assets | 4,295,599 | 4,050,051 | 3.71 | % | 4.19 | % | ||||||||
Other assets | 384,330 | 308,579 | ||||||||||||
Total assets | $ | 4,679,929 | $ | 4,358,630 | ||||||||||
Liabilities & Shareholders' Equity | ||||||||||||||
Deposits: | ||||||||||||||
Non-interest checking | $ | 597,053 | $ | 488,040 | — | % | — | % | ||||||
Interest checking | 1,222,626 | 1,098,003 | 0.48 | % | 0.99 | % | ||||||||
Savings | 497,826 | 480,849 | 0.07 | % | 0.08 | % | ||||||||
Money market | 683,720 | 582,158 | 0.66 | % | 1.25 | % | ||||||||
Certificates of deposit | 514,573 | 480,244 | 1.48 | % | 1.48 | % | ||||||||
Total deposits | 3,515,798 | 3,129,294 | 0.52 | % | 0.82 | % | ||||||||
Borrowings: | ||||||||||||||
Brokered deposits | 221,454 | 388,045 | 0.87 | % | 2.51 | % | ||||||||
Customer repurchase agreements | 222,827 | 242,740 | 0.83 | % | 1.27 | % | ||||||||
Subordinated debentures | 59,157 | 58,996 | 6.03 | % | 5.26 | % | ||||||||
Other borrowings | 68,120 | 30,237 | 0.80 | % | 2.21 | % | ||||||||
Total borrowings | 571,558 | 720,018 | 1.38 | % | 2.31 | % | ||||||||
Total funding liabilities | 4,087,356 | 3,849,312 | 0.64 | % | 1.10 | % | ||||||||
Other liabilities | 102,762 | 61,000 | ||||||||||||
Shareholders' equity | 489,811 | 448,318 | ||||||||||||
Total liabilities & shareholders' equity | $ | 4,679,929 | $ | 4,358,630 | ||||||||||
Net interest rate spread (fully-taxable equivalent) | 3.07 | % | 3.09 | % | ||||||||||
Net interest margin (fully-taxable equivalent) | 3.10 | % | 3.14 | % | ||||||||||
Net interest margin (fully-taxable equivalent), excluding fair value mark accretion and collection of previously charged-off acquired loans(3) | 3.06 | % | 3.10 | % | ||||||||||
(1) | Reported on a tax-equivalent basis calculated using the federal corporate income tax rate of 21%, including certain commercial loans. |
(2) | Non-accrual loans and loans held for sale are included in total average loans. |
(3) | Excludes the impact of the fair value mark accretion on loans and certificates of deposit generated in purchase accounting and collection of previously charged-off acquired loans for the six months ended June 30, 2020 and June 30, 2019 totaling $687,000 and $829,000, respectively. |
Asset Quality Data | ||||||||||||||||||||
(unaudited) | ||||||||||||||||||||
(In thousands) | At or For The Six Months Ended June 30, 2020 | At or For The Three Months Ended March 31, 2020 | At or For The Year Ended December 31, 2019 | At or For The Nine Months Ended September 30, 2019 | At or For The Six Months Ended June 30, 2019 | |||||||||||||||
Non-accrual loans: | ||||||||||||||||||||
Residential real estate | $ | 4,664 | $ | 3,499 | $ | 4,096 | $ | 5,152 | $ | 5,566 | ||||||||||
Commercial real estate | 432 | 646 | 1,122 | 1,156 | 1,590 | |||||||||||||||
Commercial | 699 | 748 | 420 | 751 | 785 | |||||||||||||||
Consumer and home equity | 2,371 | 2,102 | 2,154 | 2,616 | 3,039 | |||||||||||||||
HPFC | 392 | 322 | 364 | 450 | 465 | |||||||||||||||
Total non-accrual loans | 8,558 | 7,317 | 8,156 | 10,125 | 11,445 | |||||||||||||||
Loans 90 days past due and accruing | — | — | — | — | 14 | |||||||||||||||
Accruing troubled-debt restructured loans not included above | 2,874 | 3,008 | 2,993 | 3,259 | 3,511 | |||||||||||||||
Total non-performing loans | 11,432 | 10,325 | 11,149 | 13,384 | 14,970 | |||||||||||||||
Other real estate owned | 118 | 94 | 94 | 94 | 130 | |||||||||||||||
Total non-performing assets | $ | 11,550 | $ | 10,419 | $ | 11,243 | $ | 13,478 | $ | 15,100 | ||||||||||
Loans 30-89 days past due: | ||||||||||||||||||||
Residential real estate | $ | 4,016 | $ | 1,781 | $ | 2,227 | $ | 1,447 | $ | 2,536 | ||||||||||
Commercial real estate | 1,625 | 2,641 | 1,582 | 2,242 | 3,378 | |||||||||||||||
Commercial | 95 | 1,560 | 548 | 1,135 | 1,400 | |||||||||||||||
Consumer and home equity | 388 | 1,379 | 750 | 822 | 907 | |||||||||||||||
HPFC | 128 | 165 | 243 | 193 | 171 | |||||||||||||||
Total loans 30-89 days past due | $ | 6,252 | $ | 7,526 | $ | 5,350 | $ | 5,839 | $ | 8,392 | ||||||||||
Allowance for loan losses at the beginning of the period | $ | 25,171 | $ | 25,171 | $ | 24,712 | $ | 24,712 | $ | 24,712 | ||||||||||
Provision for loan losses | 11,172 | 1,772 | 2,862 | 2,658 | 1,925 | |||||||||||||||
Charge-offs: | ||||||||||||||||||||
Residential real estate | 96 | 96 | 462 | 436 | 25 | |||||||||||||||
Commercial real estate | 71 | 50 | 300 | 157 | 65 | |||||||||||||||
Commercial | 673 | 253 | 1,167 | 636 | 453 | |||||||||||||||
Consumer and home equity | 134 | 91 | 713 | 670 | 64 | |||||||||||||||
HPFC | — | — | 71 | 11 | — | |||||||||||||||
Total charge-offs | 974 | 490 | 2,713 | 1,910 | 607 | |||||||||||||||
Total recoveries | (170 | ) | (68 | ) | (310 | ) | (228 | ) | (133 | ) | ||||||||||
Net charge-offs | 804 | 422 | 2,403 | 1,682 | 474 | |||||||||||||||
Allowance for loan losses at the end of the period | $ | 35,539 | $ | 26,521 | $ | 25,171 | $ | 25,688 | $ | 26,163 | ||||||||||
Components of allowance for credit losses: | ||||||||||||||||||||
Allowance for loan losses | $ | 35,539 | $ | 26,521 | $ | 25,171 | $ | 25,688 | $ | 26,163 | ||||||||||
Liability for unfunded credit commitments | 22 | 24 | 21 | 11 | 14 | |||||||||||||||
Allowance for credit losses | $ | 35,561 | $ | 26,545 | $ | 25,192 | $ | 25,699 | $ | 26,177 | ||||||||||
Ratios: | ||||||||||||||||||||
Non-performing loans to total loans | 0.34 | % | 0.33 | % | 0.36 | % | 0.43 | % | 0.48 | % | ||||||||||
Non-performing assets to total assets | 0.23 | % | 0.23 | % | 0.25 | % | 0.30 | % | 0.34 | % | ||||||||||
Allowance for loan losses to total loans | 1.07 | % | 0.84 | % | 0.81 | % | 0.83 | % | 0.84 | % | ||||||||||
Net charge-offs to average loans (annualized): | ||||||||||||||||||||
Quarter-to-date | 0.05 | % | 0.05 | % | 0.09 | % | 0.16 | % | 0.03 | % | ||||||||||
Year-to-date | 0.05 | % | 0.05 | % | 0.08 | % | 0.07 | % | 0.03 | % | ||||||||||
Allowance for loan losses to non-performing loans | 310.87 | % | 256.86 | % | 225.77 | % | 191.93 | % | 174.77 | % | ||||||||||
Loans 30-89 days past due to total loans | 0.19 | % | 0.24 | % | 0.17 | % | 0.19 | % | 0.27 | % | ||||||||||
Reconciliation of non-GAAP to GAAP Financial Measures (unaudited)
Return on Average Tangible Equity: | ||||||||||||||||||||
For the Three Months Ended | For the Six Months Ended | |||||||||||||||||||
(Dollars in thousands) | June 30, 2020 | March 31, 2020 | June 30, 2019 | June 30, 2020 | June 30, 2019 | |||||||||||||||
Net income, as presented | $ | 10,940 | $ | 13,493 | $ | 13,204 | $ | 24,433 | $ | 27,477 | ||||||||||
Add: amortization of intangible assets, net of tax(1) | 135 | 134 | 139 | 269 | 278 | |||||||||||||||
Net income, adjusted for amortization of intangible assets | $ | 11,075 | $ | 13,627 | $ | 13,343 | $ | 24,702 | $ | 27,755 | ||||||||||
Average equity, as presented | $ | 499,449 | $ | 480,174 | $ | 455,529 | $ | 489,811 | $ | 448,318 | ||||||||||
Less: average goodwill and other intangible assets | (97,965 | ) | (98,143 | ) | (98,660 | ) | (98,054 | ) | (98,749 | ) | ||||||||||
Average tangible equity | $ | 401,484 | $ | 382,031 | $ | 356,869 | $ | 391,757 | $ | 349,569 | ||||||||||
Return on average equity | 8.81 | % | 11.30 | % | 11.63 | % | 10.03 | % | 12.36 | % | ||||||||||
Return on average tangible equity | 11.09 | % | 14.35 | % | 15.00 | % | 12.68 | % | 16.01 | % | ||||||||||
(1) Assumed a 21% tax rate.
Efficiency Ratio: | ||||||||||||||||||||
For the Three Months Ended | For the Six Months Ended | |||||||||||||||||||
(Dollars in thousands) | June 30, 2020 | March 31, 2020 | June 30, 2019 | June 30, 2020 | June 30, 2019 | |||||||||||||||
Non-interest expense, as presented | $ | 23,509 | $ | 24,561 | $ | 23,958 | $ | 48,070 | $ | 46,741 | ||||||||||
Net interest income, as presented | $ | 34,539 | $ | 31,826 | $ | 31,573 | $ | 66,365 | $ | 63,468 | ||||||||||
Add: effect of tax-exempt income(1) | 295 | 280 | 248 | 574 | 491 | |||||||||||||||
Non-interest income, as presented | 12,060 | 11,403 | 10,037 | 23,463 | 19,426 | |||||||||||||||
Less: net gain on sale of securities | — | — | (27 | ) | — | (27 | ) | |||||||||||||
Adjusted net interest income plus non-interest income | $ | 46,894 | $ | 43,509 | $ | 41,831 | $ | 90,402 | $ | 83,358 | ||||||||||
GAAP efficiency ratio | 50.45 | % | 56.82 | % | 57.58 | % | 53.51 | % | 56.39 | % | ||||||||||
Non-GAAP efficiency ratio | 50.13 | % | 56.45 | % | 57.27 | % | 53.17 | % | 56.07 | % | ||||||||||
(1) Assumed a 21% tax rate.
Pre-tax, Pre-provision Earnings: | ||||||||||||||||||||
For the Three Months Ended | For the Six Months Ended | |||||||||||||||||||
(In thousands) | June 30, 2020 | March 31, 2020 | June 30, 2019 | June 30, 2020 | June 30, 2019 | |||||||||||||||
Net income, as presented | $ | 10,940 | $ | 13,493 | $ | 13,204 | $ | 24,433 | $ | 27,477 | ||||||||||
Add: provision for credit losses | 9,398 | 1,775 | 1,173 | 11,173 | 1,917 | |||||||||||||||
Add: income tax expense | 2,752 | 3,400 | 3,275 | 6,152 | 6,759 | |||||||||||||||
Pre-tax, pre-provision earnings | $ | 23,090 | $ | 18,668 | $ | 17,652 | $ | 41,758 | $ | 36,153 | ||||||||||
Tangible Book Value Per Share and Tangible Common Equity Ratio: | ||||||||||||
June 30, 2020 | March 31, 2020 | June 30, 2019 | ||||||||||
(In thousands, except number of shares, per share data and ratios) | ||||||||||||
Tangible Book Value Per Share: | ||||||||||||
Shareholders' equity, as presented | $ | 506,467 | $ | 492,680 | $ | 467,759 | ||||||
Less: goodwill and other intangible assets | (97,881 | ) | (98,052 | ) | (98,574 | ) | ||||||
Tangible shareholders' equity | $ | 408,586 | $ | 394,628 | $ | 369,185 | ||||||
Shares outstanding at period end | 14,963,041 | 14,951,597 | 15,457,480 | |||||||||
Book value per share | $ | 33.85 | $ | 32.95 | $ | 30.26 | ||||||
Tangible book value per share | $ | 27.31 | $ | 26.39 | $ | 23.88 | ||||||
Tangible Common Equity Ratio: | ||||||||||||
Total assets | $ | 4,959,016 | $ | 4,594,539 | $ | 4,447,038 | ||||||
Less: goodwill and other intangible assets | (97,881 | ) | (98,052 | ) | (98,574 | ) | ||||||
Tangible assets | $ | 4,861,135 | $ | 4,496,487 | $ | 4,348,464 | ||||||
Common equity ratio | 10.21 | % | 10.72 | % | 10.52 | % | ||||||
Tangible common equity ratio | 8.41 | % | 8.78 | % | 8.49 | % | ||||||
Core Deposits: | ||||||||||||
(In thousands) | June 30, 2020 | March 31, 2020 | June 30, 2019 | |||||||||
Total deposits | $ | 3,996,358 | $ | 3,563,705 | $ | 3,591,610 | ||||||
Less: certificates of deposit | (431,376 | ) | (545,013 | ) | (547,786 | ) | ||||||
Less: brokered deposits | (224,777 | ) | (188,758 | ) | (352,951 | ) | ||||||
Core deposits | $ | 3,340,205 | $ | 2,829,934 | $ | 2,690,873 | ||||||
Average Core Deposits: | ||||||||||||||||||||
For the Three Months Ended | For the Six Months Ended | |||||||||||||||||||
(In thousands) | June 30, 2020 | March 31, 2020 | June 30, 2019 | June 30, 2020 | June 30, 2019 | |||||||||||||||
Total average deposits | $ | 3,676,000 | $ | 3,355,595 | $ | 3,171,005 | $ | 3,515,798 | $ | 3,129,294 | ||||||||||
Less: average certificates of deposit | (477,068 | ) | (552,079 | ) | (516,972 | ) | (514,573 | ) | (480,244 | ) | ||||||||||
Average core deposits | $ | 3,198,932 | $ | 2,803,516 | $ | 2,654,033 | $ | 3,001,225 | $ | 2,649,050 | ||||||||||
 Second Quarter Report - 2020