Exhibit 99.1

PRESS
RELEASE
THE CHEESECAKE
FACTORY REPORTS RESULTS FOR
FIRST QUARTER
OF FISCAL 2021 AND PROVIDES BUSINESS UPDATE
Second quarter-to-date
through April 27th comparable sales at
The Cheesecake Factory
restaurants increased over 2019 levels
CALABASAS
HILLS, Calif., – April 28, 2021 – The Cheesecake Factory Incorporated (NASDAQ:
CAKE) today reported financial results for the first quarter of fiscal 2021, which ended on March 30, 2021.
Total revenues were $627.4
million in the first quarter of fiscal 2021 compared to $615.1 million in the first quarter of fiscal 2020. Net loss available to common
stockholders and diluted net loss per common share were $1.2 million and $0.03, respectively, in the first quarter of fiscal 2021.
During the first quarter
of fiscal 2021, the Company recorded COVID-19 related charges of $4.9 million, for costs such as sick and vaccination pay, healthcare
and meal benefits for furloughed staff members, additional sanitation and personal protective equipment. Excluding the after-tax impact
of these and certain other items, and reflecting the potential impact of the conversion of the Company’s convertible preferred
stock into common stock, adjusted net income and adjusted net income per share for the first quarter of fiscal 2021 were $10.8 million
and $0.20, respectively. Please see the Company’s reconciliation of non-GAAP financial measures at the end of this press release.
Comparable restaurant sales
at The Cheesecake Factory restaurants increased 2.8% year-over-year in the first quarter of fiscal 2021. Relative to the first quarter
of fiscal 2019, comparable restaurant sales at The Cheesecake Factory restaurants declined 10.4%.
Fiscal 2021 second quarter-to-date
through April 27th comparable sales for The Cheesecake Factory restaurants increased approximately 220% year-over-year and 7% relative
to the same period in fiscal 2019, supported by approximately one-third off-premise sales mix and reflecting eased COVID-19 restrictions,
as well as strong consumer spending trends.
As of today, nearly all of
the Company’s restaurants across its concepts, including 206 Cheesecake Factory locations, are operating with reopened indoor dining
rooms with limited capacity in accordance with local mandates and social distancing protocols. On average, Cheesecake Factory restaurants
with reopened dining rooms are operating at approximately 60% indoor capacity. One Cheesecake Factory location is operating an off-premise
only model and two locations across the Company’s concepts are currently closed with plans to reopen by the end of the second quarter.
26901
Malibu Hills Road, Calabasas Hills, CA 91301 · Telephone
(818) 871-3000 · Fax (818)
871-3100
“We saw a significant
increase in sales at The Cheesecake Factory restaurants and across our portfolio in March as COVID-19 dining restrictions eased and consumer
spending generally increased,” said David Overton, Chairman and Chief Executive Officer. “In addition to these positive macro
trends, we believe our performance also demonstrates the power of The Cheesecake Factory brand as we saw meaningful pent-up demand to
dine at our restaurants, while we also continued to drive strong off-premise sales volumes. Our operators did a tremendous job managing
the sales levels - delivering delicious, memorable experiences for our guests and also exceeding our expectations across our key performance
indicators, including operating margins.”
Overton continued, “We
are honored to be recognized as one of the ‘100 Best Companies to Work For®’ by FORTUNE magazine for the eighth
consecutive year, continuing to underscore our position as an employer of choice. This accolade is even more meaningful in the context
of the challenges we faced during 2020 and the unique labor environment the restaurant industry is currently experiencing. We believe
we have one of the best teams in the industry, which we expect to continue to differentiate us in the COVID-19 operating environment and
as we emerge from the pandemic.”
Development
During the first quarter of
fiscal 2021, The Cheesecake Factory opened in Washington, D.C., North Italia opened in Birmingham, Alabama and Blanco opened in Nashville.
Subsequent to quarter-end, North Italia opened in Miami and one Cheesecake Factory restaurant opened internationally in Shanghai under
a licensing agreement.
Balance Sheet & Cash Flow
During the first quarter,
the Company generated $21.6 million in cash flow from operating activities.
As
of March 30, 2021, the Company had total available liquidity of approximately $278 million, including a cash balance of approximately
$181.3 million and availability on its revolving credit facility of $96.6 million. Total debt outstanding was $280.0 million.
As previously announced, a
$5.1 million cash dividend for the first quarter of fiscal 2021 was paid on March 31, 2021 to holders of the Company’s convertible
preferred stock.
Conference Call and Webcast
The Company will hold a conference
call to review its results for the first quarter of fiscal 2021 today at 2:00 p.m. Pacific Time. The conference call will be webcast live
on the Company’s website at investors.thecheesecakefactory.com and a replay of the webcast will be available through May 28, 2021.
About The Cheesecake Factory Incorporated
The Cheesecake Factory Incorporated
is a leader in experiential dining. We are culinary forward and relentlessly focused on hospitality. Delicious, memorable experiences
created by passionate people – this defines who we are and where we are going. We currently own and operate 298 restaurants throughout
the United States and Canada under brands including The Cheesecake Factory®, North Italia® and a collection
within the Fox Restaurant Concepts subsidiary. Internationally, 28 The Cheesecake Factory® restaurants operate under licensing
agreements. Our bakery division operates two facilities that produce quality cheesecakes and other baked products for our restaurants,
international licensees and third-party bakery customers. In 2021, we were named to the FORTUNE Magazine “100 Best Companies to
Work For®” list for the eighth consecutive year. To learn more, visit www.thecheesecakefactory.com, www.northitalia.com
and www.foxrc.com.
From FORTUNE. ©2021 Fortune Media IP Limited. FORTUNE 100 Best
Companies to Work For is a trademark of Fortune Media IP Limited and is used under license. FORTUNE and Fortune Media IP Limited are
not affiliated with, and do not endorse products or services of, Licensee.
26901
Malibu Hills Road, Calabasas Hills, CA 91301 · Telephone
(818) 871-3000 · Fax (818)
871-3100
Safe Harbor Statement
This press release contains
forward-looking statements within the meaning of the Private Securities Litigation Reform Act of 1995, as codified in Section 27A of the
Securities Act of 1933, as amended, and Section 21E of the Securities Exchange Act of 1934, as amended. These statements include, without
limitation, statements regarding second quarter to-date comparable restaurant sales, continued strength in off-premise sales, the power
of The Cheesecake Factory brand, the Company’s position as an employer of choice and the strength of the Company’s team, which
the Company expects to continue to differentiate it in the COVID-19 operating environment and as the Company emerges from the pandemic.
Such forward-looking statements include all other statements that are not historical facts, as well as statements that are preceded by,
followed by or that include words or phrases such as “believe,” “plan,” “will likely result,” “expect,”
“intend,” “will continue,” “is anticipated,” “estimate,” “project,” “may,”
“could,” “would,” “should” and similar expressions. These statements are based on current expectations
and involve risks and uncertainties which may cause results to differ materially from those set forth in such statements. Investors are
cautioned that forward-looking statements are not guarantees of future performance and that undue reliance should not be placed on such
statements. These forward-looking statements may be affected by various factors including: the rapidly evolving nature of the COVID-19
pandemic and related containment measures, including the potential for a complete shutdown of the Company’s restaurants, international
licensee restaurants and the Company’s bakery operations; demonstrations, political unrest, potential damage to or closure of the
Company’s restaurants and potential reputational damage to the Company or any of its brands; economic, public health and political
conditions that impact consumer confidence and spending, including the impact of the COVID-19 pandemic and other health epidemics or pandemics
on the global economy; acceptance and success of The Cheesecake Factory in international markets; acceptance and success of North Italia,
the Fox Restaurant Concepts, and other concepts; the risks of doing business abroad through Company-owned restaurants and/or licensees;
foreign exchange rates, tariffs and cross border taxation; changes in unemployment rates; changes in laws impacting the Company’s
business, including laws and regulations related to COVID-19 impacting restaurant operations and customer access to off- and on-premise
dining; increases in minimum wages and benefit costs; the economic health of the Company’s landlords and other tenants in retail
centers in which its restaurants are located, and the Company’s ability to successfully manage its lease arrangements with landlords;
unanticipated costs that may arise in connection with a return to normal course of business including potential negative impacts from
furlough actions; the economic health of suppliers, licensees, vendors and other third parties providing goods or services to the Company;
the timing of the resumption of the Company’s new unit development; compliance with debt covenants; strategic capital allocation
decisions including any share repurchases or dividends; the ability to achieve projected financial results; economic and political conditions
that impact consumer confidence and spending; the resolution of uncertain tax positions with the Internal Revenue Service and the impact
of tax reform legislation; adverse weather conditions in regions in which the Company’s restaurants are located; factors that are
under the control of government agencies, landlords and other third parties; the risk, costs and uncertainties associated with opening
new restaurants; and other risks and uncertainties detailed from time to time in the Company’s filings with the Securities and Exchange
Commission (“SEC”). Forward-looking statements speak only as of the dates on which they are made and the Company undertakes
no obligation to publicly update or revise any forward-looking statements or to make any other forward-looking statements, whether as
a result of new information, future events or otherwise, unless required to do so by law. Investors are referred to the full discussion
of risks and uncertainties associated with forward-looking statements and the discussion of risk factors contained in the Company’s
latest Annual Report on Form 10-K, Quarterly Reports on Form 10-Q and Current Reports on Form 8-K as filed with the SEC, which are available
at www.sec.gov.
26901
Malibu Hills Road, Calabasas Hills, CA 91301 · Telephone
(818) 871-3000 · Fax (818)
871-3100
The Cheesecake Factory Incorporated
Condensed Consolidated Financial Statements
(unaudited; in thousands, except per share and statistical data)
| | |
13 Weeks Ended | | |
13 Weeks Ended | |
| Consolidated Statements of Income | |
March 30, 2021 | | |
March 31, 2020 | |
| | |
Amount | | |
Percent of
Revenues | | |
Amount | | |
Percent of
Revenues | |
| Revenues | |
$ | 627,417 | | |
| 100.0 | % | |
$ | 615,106 | | |
| 100.0 | % |
| Costs and expenses: | |
| | | |
| | | |
| | | |
| | |
| Cost of sales | |
| 135,875 | | |
| 21.7 | % | |
| 140,905 | | |
| 22.9 | % |
| Labor expenses | |
| 229,732 | | |
| 36.6 | % | |
| 236,982 | | |
| 38.6 | % |
| Other operating costs and expenses | |
| 181,533 | | |
| 28.9 | % | |
| 167,970 | | |
| 27.3 | % |
| General and administrative expenses | |
| 44,427 | | |
| 7.1 | % | |
| 43,960 | | |
| 7.1 | % |
| Depreciation and amortization expenses | |
| 22,006 | | |
| 3.5 | % | |
| 23,562 | | |
| 3.8 | % |
| Impairment of assets and lease termination expenses | |
| 594 | | |
| 0.1 | % | |
| 191,896 | | |
| 31.2 | % |
| Acquisition-related costs | |
| - | | |
| 0.0 | % | |
| 1,236 | | |
| 0.2 | % |
| Acquisition-related contingent consideration, compensation and amortization
expenses/(benefit) | |
| 550 | | |
| 0.1 | % | |
| (4,466 | ) | |
| (0.7 | )% |
| Preopening costs | |
| 3,856 | | |
| 0.6 | % | |
| 3,119 | | |
| 0.5 | % |
| Total costs and expenses | |
| 618,573 | | |
| 98.6 | % | |
| 805,164 | | |
| 130.9 | % |
| Income/(loss) from operations | |
| 8,844 | | |
| 1.4 | % | |
| (190,058 | ) | |
| (30.9 | )% |
| Interest and other expense, net | |
| (2,694 | ) | |
| (0.4 | )% | |
| (1,518 | ) | |
| (0.2 | )% |
| Income/(loss) before income taxes | |
| 6,150 | | |
| 1.0 | % | |
| (191,576 | ) | |
| (31.1 | )% |
| Income tax provision/(benefit) | |
| 2,282 | | |
| 0.4 | % | |
| (55,413 | ) | |
| (9.0 | )% |
| Net income/(loss) | |
| 3,868 | | |
| 0.6 | % | |
| (136,163 | ) | |
| (22.1 | )% |
| Dividends on Series A preferred stock | |
| (5,070 | ) | |
| (0.8 | )% | |
| - | | |
| 0.0 | % |
| Net loss available to common stockholders | |
$ | (1,202 | ) | |
| (0.2 | )% | |
$ | (136,163 | ) | |
| (22.1 | )% |
| | |
| | | |
| | | |
| | | |
| | |
| Basic net loss per common share | |
$ | (0.03 | ) | |
| | | |
$ | (3.11 | ) | |
| | |
| Basic weighted average shares outstanding | |
| 44,189 | | |
| | | |
| 43,773 | | |
| | |
| | |
| | | |
| | | |
| | | |
| | |
| Diluted net loss per common share | |
$ | (0.03 | ) | |
| | | |
$ | (3.11 | ) | |
| | |
| Diluted weighted average shares outstanding | |
| 44,189 | | |
| | | |
| 43,773 | | |
| | |
26901
Malibu Hills Road, Calabasas Hills, CA 91301 · Telephone
(818) 871-3000 · Fax (818)
871-3100
| | |
13 Weeks Ended | | |
13 Weeks Ended | |
| Selected Segment Information | |
March 30, 2021 | | |
March 31, 2020 | |
| Revenues: | |
| | | |
| | |
| The Cheesecake Factory restaurants | |
$ | 499,389 | | |
$ | 488,471 | |
| North Italia | |
| 32,823 | | |
| 30,512 | |
| Other FRC | |
| 36,194 | | |
| 35,583 | |
| Other | |
| 59,011 | | |
| 60,540 | |
| Total | |
$ | 627,417 | | |
$ | 615,106 | |
| | |
| | | |
| | |
| Income/(loss) from operations: | |
| | | |
| | |
| The Cheesecake Factory restaurants | |
$ | 44,481 | | |
$ | 39,324 | |
| North Italia | |
| 332 | | |
| (72,086 | ) |
| Other FRC | |
| 3,880 | | |
| (69,964 | ) |
| Other | |
| (39,849 | ) | |
| (87,332 | ) |
| Total | |
$ | 8,844 | | |
$ | (190,058 | ) |
| | |
| | | |
| | |
| Preopening costs: | |
| | | |
| | |
| The Cheesecake Factory restaurants | |
$ | 2,063 | | |
$ | 1,414 | |
| North Italia | |
| 1,217 | | |
| 953 | |
| Other FRC | |
| 463 | | |
| (159 | ) |
| Other | |
| 113 | | |
| 911 | |
| Total | |
$ | 3,856 | | |
$ | 3,119 | |
| | |
| | | |
| | |
| Impairment of assets and lease termination expenses: | |
| | | |
| | |
| The Cheesecake Factory restaurants | |
$ | - | | |
$ | 616 | |
| North Italia | |
| - | | |
| 71,524 | |
| Other FRC | |
| - | | |
| 72,939 | |
| Other | |
| 594 | | |
| 46,817 | |
| Total | |
$ | 594 | | |
$ | 191,896 | |
| | |
| | | |
| | |
| Depreciation and amortization expenses: | |
| | | |
| | |
| The Cheesecake Factory restaurants | |
$ | 16,320 | | |
$ | 17,277 | |
| North Italia | |
| 844 | | |
| 965 | |
| Other FRC | |
| 1,177 | | |
| 1,201 | |
| Other | |
| 3,665 | | |
| 4,119 | |
| Total | |
$ | 22,006 | | |
$ | 23,562 | |
26901
Malibu Hills Road, Calabasas Hills, CA 91301 · Telephone
(818) 871-3000 · Fax (818)
871-3100
| | |
13 Weeks Ended | | |
13 Weeks Ended | |
| |
March 30, 2021 | | |
March 31, 2020 | |
| The Cheesecake Factory restaurants operating
information: | |
| | | |
| | |
| Comparable restaurant sales vs. prior year | |
| 2.8 | % | |
| (12.9 | )% |
| Comparable restaurant sales vs. 2019 | |
| (10.4 | )% | |
| | |
| Restaurants opened during period | |
| 1 | | |
| - | |
| Restaurants open at period-end | |
| 207 | | |
| 206 | |
| Restaurant operating weeks | |
| 2,678 | | |
| 2,674 | |
| | |
| | | |
| | |
| North Italia operating information: | |
| | | |
| | |
| Comparable restaurant sales vs. prior year | |
| 5 | % | |
| (12 | )% |
| Comparable restaurant sales vs. 2019 | |
| (5 | )% | |
| | |
| Restaurants opened during period | |
| 1 | | |
| 1 | |
| Restaurants open at period-end | |
| 24 | | |
| 23 | |
| Restaurant operating weeks | |
| 303 | | |
| 290 | |
| | |
| | | |
| | |
| Other Fox Restaurant Concepts (FRC) operating information:(1) | |
| | | |
| | |
| Restaurants opened during period | |
| 1 | | |
| - | |
| Restaurants open at period-end | |
| 28 | | |
| 25 | |
| Restaurant operating weeks | |
| 342 | | |
| 313 | |
| | |
| | | |
| | |
| Other operating information:(2) | |
| | | |
| | |
| Restaurants opened during period | |
| - | | |
| 1 | |
| Restaurants open at period-end | |
| 38 | | |
| 40 | |
| Restaurant operating weeks | |
| 477 | | |
| 492 | |
| | |
| | | |
| | |
| Number of company-owned restaurants: | |
| | | |
| | |
| The Cheesecake Factory | |
| 207 | | |
| | |
| North Italia | |
| 24 | | |
| | |
| Other FRC | |
| 28 | | |
| | |
| Other | |
| 38 | | |
| | |
| Total | |
| 297 | | |
| | |
| | |
| | | |
| | |
| Number of international-licensed restaurants: | |
| | | |
| | |
| The Cheesecake Factory | |
| 27 | | |
| | |
(1) The Other FRC segment includes all FRC brands except Flower Child.
(2) The Other segment includes the Flower Child, Grand Lux Cafe, RockSugar Southeast Asian Kitchen and Social Monk Asian Kitchen concepts, as well as the Company's third-party bakery, international and consumer packaged goods businesses, unallocated corporate expenses and gift card costs.
| Selected Consolidated Balance Sheet Information | |
March 30, 2021 | | |
December 29, 2020 | |
| Cash and cash equivalents | |
$ | 181,345 | | |
$ | 154,085 | |
| Long-term debt | |
| 280,000 | | |
| 280,000 | |
26901
Malibu Hills Road, Calabasas Hills, CA 91301 · Telephone
(818) 871-3000 · Fax (818)
871-3100
Reconciliation of Non-GAAP Results to GAAP Results
In addition to the
results provided in accordance with accounting principles generally accepted in the United States of America (“GAAP”) in
this press release, the Company is providing non-GAAP measurements which present net income and net income per share excluding the
impact of certain items. The non-GAAP measurements are intended to supplement the presentation of the Company’s financial
results in accordance with GAAP. These non-GAAP measures are calculated by eliminating from net loss and diluted net loss per share
the impact of items the Company does not consider indicative of its ongoing operations. To reflect the potential impact of the
conversion of the Company’s convertible preferred stock into common stock, the Company excludes the preferred dividend and
assumes all convertible preferred shares convert to common stock. The Company uses these non-GAAP financial measures for financial
and operational decision-making and as a means to evaluate period-to-period comparisons.
The Cheesecake Factory Incorporated
Reconciliation of Non-GAAP Financial Measures
(unaudited; in thousands, except per share data)
| | |
13 Weeks Ended | | |
13 Weeks Ended | |
| | |
March 30, 2021 | | |
March 31, 2020 | |
| Net loss available to common stockholders (GAAP) | |
$ | (1,202 | ) | |
$ | (136,163 | ) |
| Dividends on Series A preferred stock | |
| 5,070 | | |
| - | |
| COVID-19
related costs(1) | |
| 4,917 | | |
| 3,290 | |
| Impairment of assets and lease termination expenses(2) | |
| 594 | | |
| 191,896 | |
| Acquisition-related
costs(3) | |
| - | | |
| 1,236 | |
| Acquisition-related contingent consideration, compensation and amortization expenses/(benefit)(4) | |
| 550 | | |
| (4,466 | ) |
| Uncertain
tax position related to tenant improvement allowances(5) | |
| 2,471 | | |
| - | |
| Tax effect of adjustments(6) | |
| (1,576 | ) | |
| (49,908 | ) |
| Adjusted net income (non-GAAP) | |
$ | 10,824 | | |
$ | 5,885 | |
| | |
| | | |
| | |
| Diluted net loss per common share (GAAP) | |
$ | (0.03 | ) | |
$ | (3.11 | ) |
| Dividends on Series A preferred stock | |
| 0.09 | | |
| - | |
| Assumed impact of potential conversion of Series A preferred stock into common stock(7) | |
| 0.00 | | |
| - | |
| COVID-19 related costs | |
| 0.09 | | |
| 0.07 | |
| Impairment of assets and lease termination expenses | |
| 0.01 | | |
| 4.38 | |
| Acquisition-related costs | |
| - | | |
| 0.03 | |
| Acquisition-related contingent consideration, compensation and amortization expenses/(benefit) | |
| 0.01 | | |
| (0.10 | ) |
| Uncertain tax position related to tenant improvement allowances | |
| 0.05 | | |
| - | |
| Tax effect of adjustments | |
| (0.03 | ) | |
| (1.14 | ) |
| Adjusted net income per share (non-GAAP)(8) | |
$ | 0.20 | | |
$ | 0.13 | |
(1) Represents incremental costs associated with COVID-19 such as sick and vaccination pay, healthcare and meal benefits for furloughed staff members, additional sanitation and personal protective equipment. For the thirteen weeks ended March 30, 2021, the Company recorded $4.9 million for these costs with approximately $4.6 million reflected in other operating expenses and $0.3 million in labor expenses. For the thirteen weeks ended March 31, 2020, the Company recorded $3.3 million for these costs with approximately $2.3 million reflected in labor expenses and $1.0 million in other operating expenses.
(2) A detailed breakdown of impairment of assets and lease termination expenses recorded in the thirteen weeks ended March 30, 2021 and March 31, 2020 can be found in the Selected Segment Information table.
(3) Represents costs incurred to effect and integrate the North and FRC acquisition.
(4) Represents changes in the fair value of the deferred consideration and contingent consideration and compensation liabilities related to the North and FRC acquisition, as well as amortization of acquired definite-lived licensing agreements.
(5)
Reserve for uncertain tax position related to tenant improvement allowances. Uncertain tax positions taken in a tax return are
recognized in the financial statements when it is more likely than not that the position will be sustained upon examination by tax
authorities based on its technical merits, taking into account available administrative remedies
and litigation.
(6) Based on the federal statutory rate and an estimated blended state tax rate, the tax effect on all adjustments assumes a 26% tax rate for the fiscal 2021 and 2020 periods.
(7) Represents the impact of assuming the conversion of Series A preferred stock into common stock (9,598,559 shares for the thirteen weeks ended March 30, 2021), resulting in an assumption of 53,787,314 weighted-average common shares outstanding for the thirteen weeks ended March 30, 2021.
(8)
Adjusted net income per share may not add due to rounding.
26901
Malibu Hills Road, Calabasas Hills, CA 91301 · Telephone
(818) 871-3000 · Fax (818)
871-3100
Exhibit 99.2
Investor Presentation April 28, 2021
This presentation contains forward - looking statements within the meaning of Section 27 A of the Securities Act of 1933 , as amended, and Section 21 E of the Securities Exchange Act of 1934 , as amended . This includes, without limitation, financial guidance and projections and statements with respect to expectations of the Company’s future financial condition, results of operations, cash flows, plans, targets, goals, objectives, performance, growth potential, competitive position and business ; the Company’s strong foothold in the off - premise channel supporting the business in the COVID - 19 environment ; the Company’s ability to successfully reopen its dining rooms ; the Company’s ability to retain some of the gains in off - premise sales once dining rooms are at full capacity ; statements from the Company’s corporate social responsibility report ; the opportunity for additional domestic and foreign locations and licensees and territories ; target returns for new restaurant openings ; performance of international licensed locations ; the acquisitions of North Italia and Fox Restaurant Concepts (“FRC”) ; FRC as an incubation engine ; steady - state restaurant level margins and anticipated unit growth roadmap . Such forward - looking statements include all other statements that are not historical facts, as well as statements that are preceded by, followed by or that include words or phrases such as “believe,” “plan,” “will likely result,” “expect,” “intend,” “will continue,” “is anticipated,” “estimate,” “project,” “may,” “could,” “would,” “should” and similar expressions . These statements are based on the Company’s current expectations and involve risks and uncertainties which may cause results to differ materially from those set forth in such statements . These forward - looking statements also may be affected by various factors outside of the Company’s control including : the rapidly evolving nature of the COVID - 19 pandemic and related containment measures, including the potential for a complete shutdown of the Company’s restaurants, international licensee restaurants and the Company’s bakery operations ; demonstrations, political unrest, potential damage to or closure of the Company’s restaurants and potential reputational damage to the Company or any of its brands ; economic, public health and political conditions that impact consumer confidence and spending, including the impact of the COVID - 19 pandemic and other health epidemics or pandemics on the global economy ; acceptance and success of The Cheesecake Factory in international markets ; acceptance and success of North Italia, the FRC concepts, and other concepts ; the risks of doing business abroad through Company - owned restaurants and/or licensees ; foreign exchange rates, tariffs and cross border taxation ; changes in unemployment rates ; changes in laws impacting the Company’s business, including laws and regulations related to COVID - 19 impacting restaurant operations and customer access to off - and on - premise dining ; increases in minimum wages and benefit costs ; the economic health of the Company’s landlords and other tenants in retail centers in which its restaurants are located, and the Company’s ability to successfully manage its lease arrangements with landlords ; unanticipated costs that may arise in connection with a return to normal course of business including potential negative impacts from furlough actions ; the economic health of suppliers, licensees, vendors and other third parties providing goods or services to the Company ; the timing of the resumption of the Company’s new unit development ; compliance with debt covenants ; strategic capital allocation decisions including share repurchases and dividends ; the ability to achieve projected financial results ; economic and political conditions that impact consumer confidence and spending ; impact of tax reform legislation ; adverse weather conditions in regions in which the Company’s restaurants are located ; factors that are under the control of government agencies, landlords and other third parties ; the risk, costs and uncertainties associated with opening new restaurants ; and other risks and uncertainties detailed from time to time in the Company’s filings with the Securities and Exchange Commission (“SEC”) . Forward - looking statements speak only as of the dates on which they are made and the Company undertakes no obligation to publicly update or revise any forward - looking statements or to make any other forward - looking statements, whether as a result of new information, future events or otherwise, unless required to do so by law . Investors are referred to the full discussion of risks and uncertainties associated with forward - looking statements and the discussion of risk factors contained in the Company’s latest Annual Report on Form 10 - K, Quarterly Reports on Form 10 - Q and Current Reports on Form 8 - K as filed with the SEC, which are available at www . sec . gov . Safe Harbor Statement 2
An Experiential Dining Category Leader 3 Culinary forward. First class hospitality. Concepts like no other.
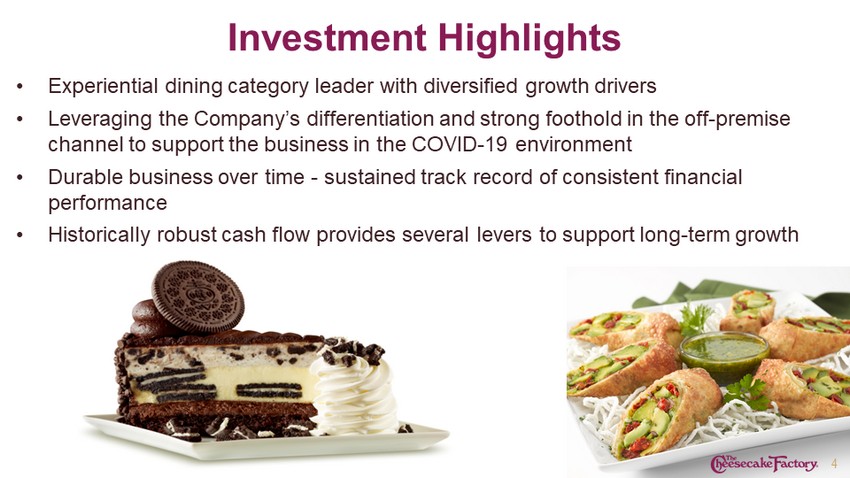
• Experiential dining category leader with diversified growth drivers • Leveraging the Company’s differentiation and strong foothold in the off - premise channel to support the business in the COVID - 19 environment • Durable business over time - sustained track record of consistent financial performance • Historically robust cash flow provides several levers to support long - term growth Investment Highlights 4
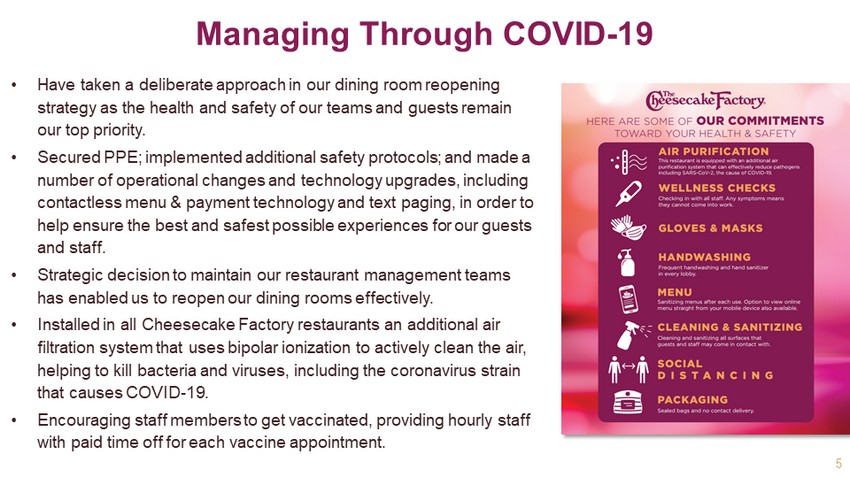
Managing Through COVID - 19 5 • Have taken a deliberate approach in our dining room reopening strategy as the health and safety of our teams and guests remain our top priority. • Secured PPE; implemented additional safety protocols; and made a number of operational changes and technology upgrades, including contactless menu & payment technology and text paging, in order to help ensure the best and safest possible experiences for our guests and staff. • Strategic decision to maintain our restaurant management teams has enabled us to reopen our dining rooms effectively. • Installed in all Cheesecake Factory restaurants an additional air filtration system that uses bipolar ionization to actively clean the air, helping to kill bacteria and viruses, including the coronavirus strain that causes COVID - 19. • Encouraging staff members to get vaccinated, providing hourly staff with paid time off for each vaccine appointment.
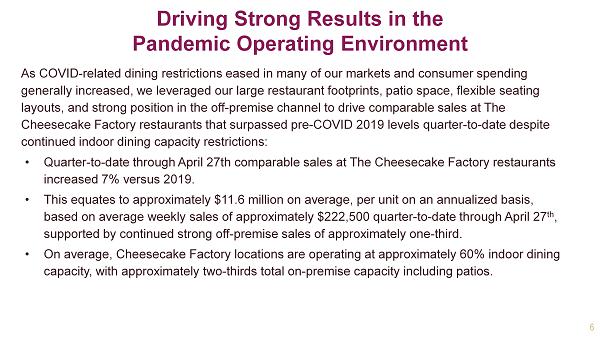
Driving Strong Results in the Pandemic Operating Environment 6 As COVID - related dining restrictions eased in many of our markets and consumer spending generally increased, we leveraged our large restaurant footprints, patio space, flexible seating layouts, and strong position in the off - premise channel to drive comparable sales at The Cheesecake Factory restaurants that surpassed pre - COVID 2019 levels quarter - to - date despite continued indoor dining capacity restrictions: • Quarter - to - date through April 27th comparable sales at The Cheesecake Factory restaurants increased 7% versus 2019. • This equates to approximately $11.6 million on average, per unit on an annualized basis, based on average weekly sales quarter - to - date through April 27 th , supported by continued strong off - premise sales of approximately one - third . • On average, Cheesecake Factory locations are operating at approximately 60% indoor dining capacity.
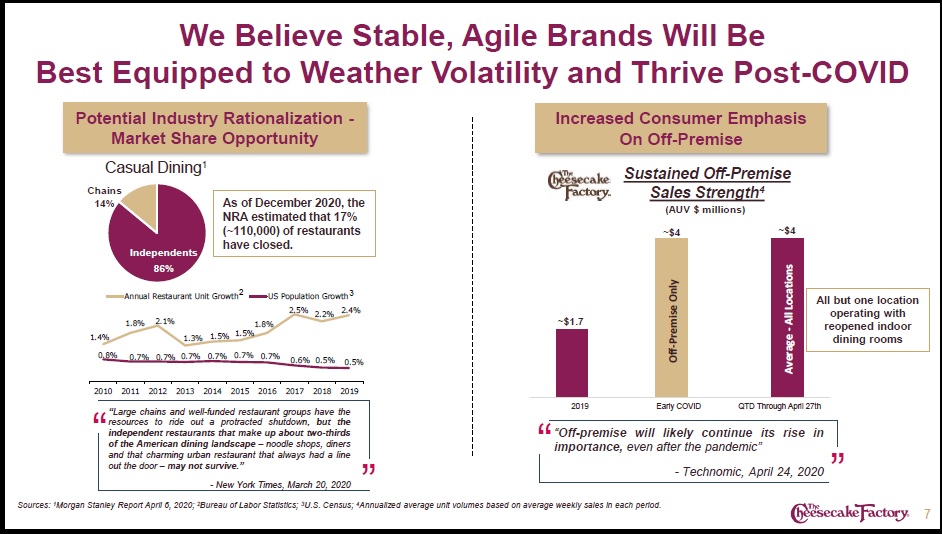
~$4 2019 Early COVID QTD Through April 27th ~$1.7 ~$4 Sustained Off - Premise Sales Strength 4 (AUV $ millions) 1.4% 1.8% 2.1% 1.3% 1.5% 1.5% 1.8% 2.5% 2.2% 2.4% 0.8% 0.7% 0.7% 0.7% 0.7% 0.7% 0.7% 0.6% 0.5% 0.5% 2010 2011 2012 2013 2014 2015 2016 2017 2018 2019 Annual Restaurant Unit Growth US Population Growth We Believe Stable, Agile Brands Will Be Best Equipped to Weather Volatility and Thrive Post - COVID 7 Potential Industry Rationalization - Market Share Opportunity “ ” “ Large chains and well - funded restaurant groups have the resources to ride out a protracted shutdown , but the independent restaurants that make up about two - thirds of the American dining landscape – noodle shops, diners and that charming urban restaurant that always had a line out the door – may not survive . ” - New York Times, March 20, 2020 Casual Dining 1 Sources: 1 Morgan Stanley Report April 6, 2020; 2 Bureau of Labor Statistics; 3 U.S. Census; 4 Annualized average unit volumes based on average weekly sales in each period. Increased Consumer Emphasis On Off - Premise “ Off - premise will likely continue its rise in importance, even after the pandemic” - Technomic, April 24, 2020 ” “ Independents 86% Chains 14% Average - All Locations Off - Premise Only 2 As of December 2020, the NRA estimated that 17% (~110,000) of restaurants have closed. 3 All but one location operating with reopened indoor dining rooms To be confirmed
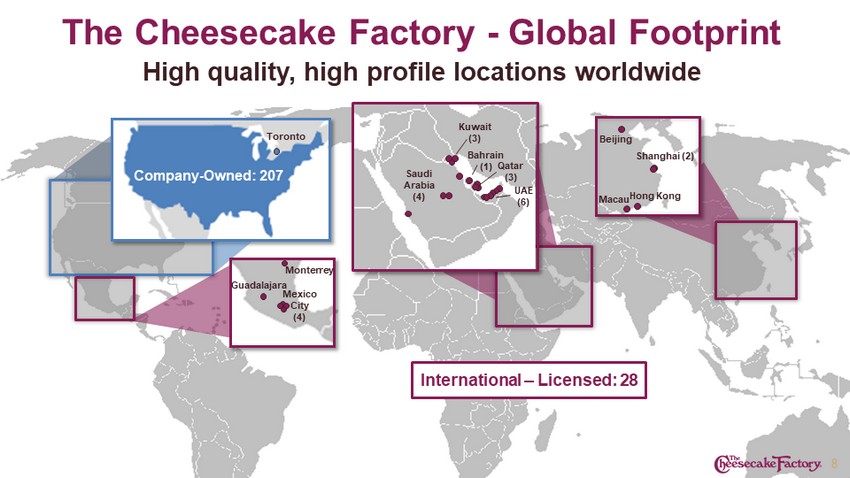
The Cheesecake Factory - Global Footprint 8 High quality, high profile locations worldwide Company - Owned: 207 Toronto International – Licensed: 28 Mexico City (4) Guadalajara Saudi Arabia (4) UAE (6) Kuwait (3) Qatar (3) Bahrain (1) Shanghai (2) Hong Kong Beijing Monterrey Macau
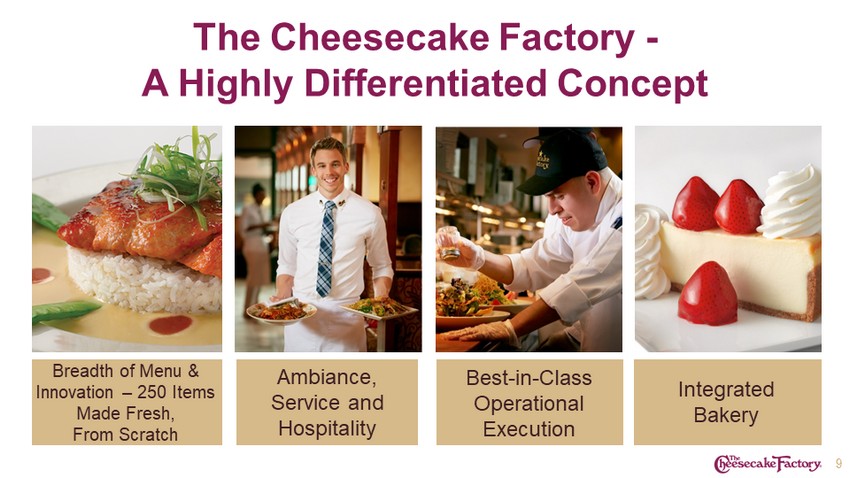
Breadth of Menu & Innovation – 250 Items Made Fresh, From Scratch Ambiance, Service and Hospitality The Cheesecake Factory - A Highly Differentiated Concept Best - in - Class Operational Execution Integrated Bakery 9
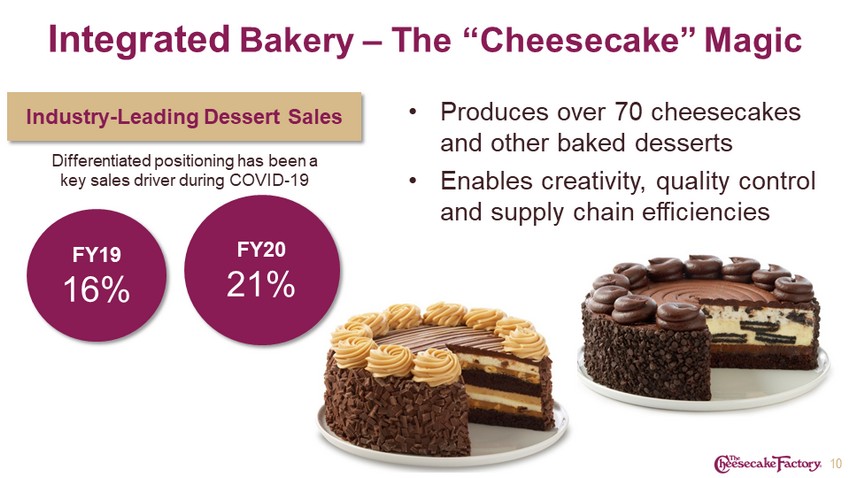
Integrated Bakery – The “Cheesecake” Magic • Produces over 70 cheesecakes and other baked desserts • Enables creativity, quality control and supply chain efficiencies FY19 16% 10 FY20 21% Differentiated positioning has been a key sales driver during COVID - 19 Industry - Leading Dessert Sales
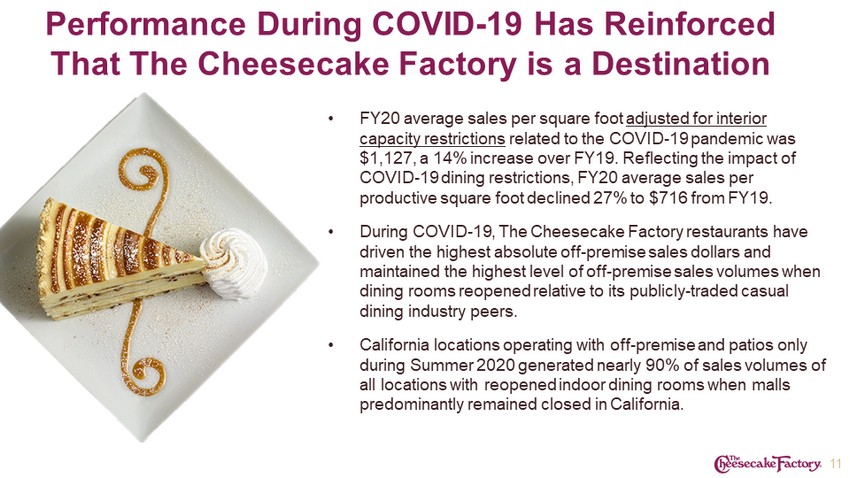
Performance During COVID - 19 Has Reinforced That The Cheesecake Factory is a Destination • FY20 average sales per square foot adjusted for interior capacity restrictions related to the COVID - 19 pandemic was $1,127, a 14% increase over FY19. Reflecting the impact of COVID - 19 dining restrictions, FY20 average sales per productive square foot declined 27% to $716 from FY19. • During COVID - 19, The Cheesecake Factory restaurants have driven the highest absolute off - premise sales dollars and maintained the highest level of off - premise sales volumes when dining rooms reopened relative to its publicly - traded casual dining industry peers. • California locations operating with off - premise and patios only during Summer 2020 generated nearly 90% of sales volumes of all locations with reopened indoor dining rooms when malls predominantly remained closed in California. 11
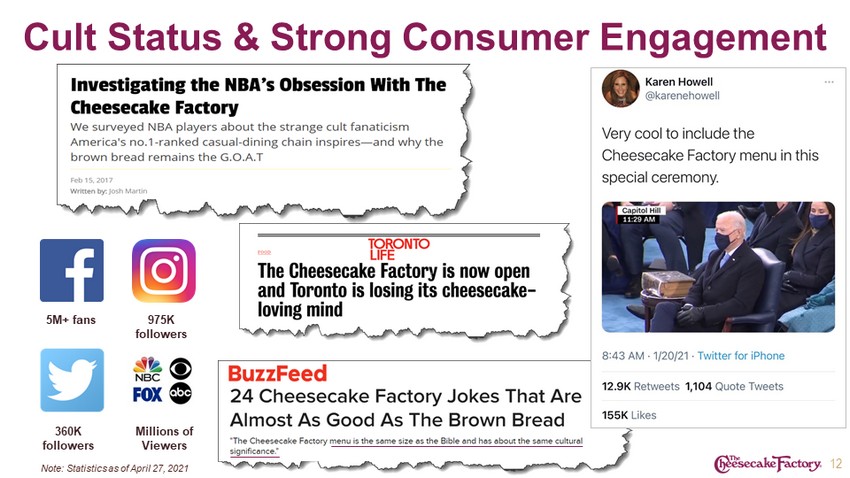
Cult Status & Strong Consumer Engagement 975K followers 5M+ fans 360K followers Millions of Viewers 12 Note: Statistics as of April 27, 2021
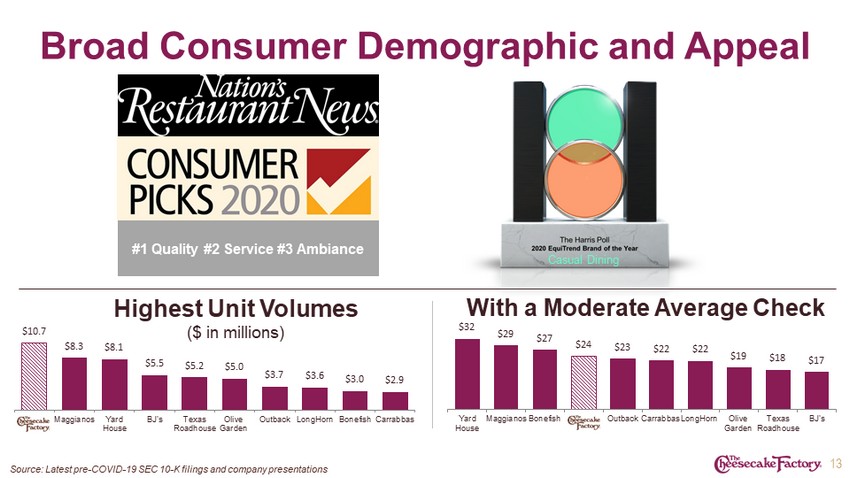
Broad Consumer Demographic and Appeal With a Moderate Average Check Highest Unit Volumes ($ in millions) Source: Latest pre - COVID - 19 SEC 10 - K filings and company presentations 13 Casual Dining $10.7 $8.3 $8.1 $5.5 $5.2 $5.0 $3.7 $3.6 $3.0 $2.9 Maggianos Yard House BJ's Texas Roadhouse Olive Garden Outback LongHorn Bonefish Carrabbas $32 $29 $27 $24 $23 $22 $22 $19 $18 $17 Yard House Maggianos Bonefish Outback Carrabbas LongHorn Olive Garden Texas Roadhouse BJ's #1 Quality #2 Service #3 Ambiance
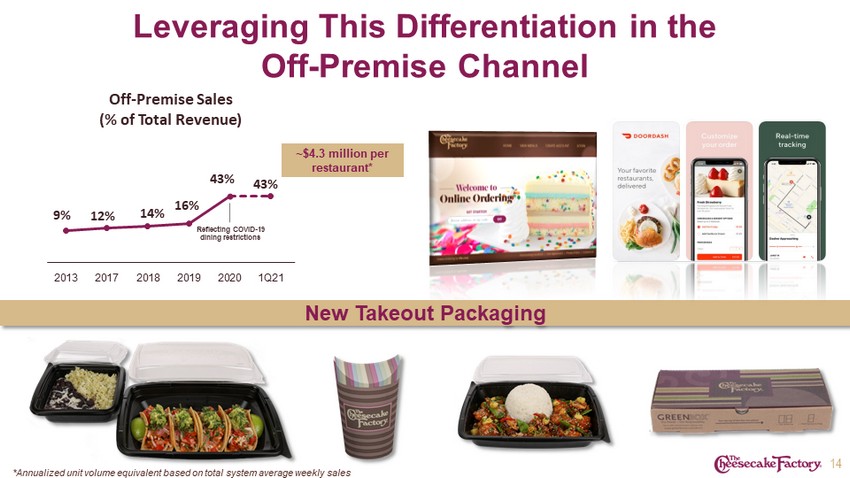
9% 12% 14% 16% 43% 43% 2013 2017 2018 2019 2020 1Q21 Off - Premise Sales (% of Total Revenue) Leveraging This Differentiation in the Off - Premise Channel New Takeout Packaging 14 *Annualized unit volume equivalent based on total system average weekly sales ~$4.3 million per restaurant* Reflecting COVID - 19 dining restrictions
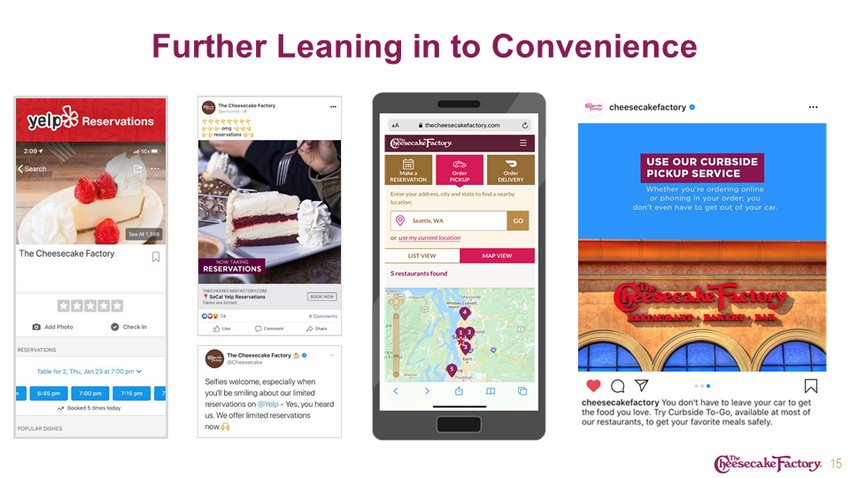
Further Leaning in to Convenience 15

On - Brand Marketing Campaigns Leveraging Brand Identity as a Dessert Leader and Menu Breadth to Drive Sales 16 Attain Top - of - Mind Status
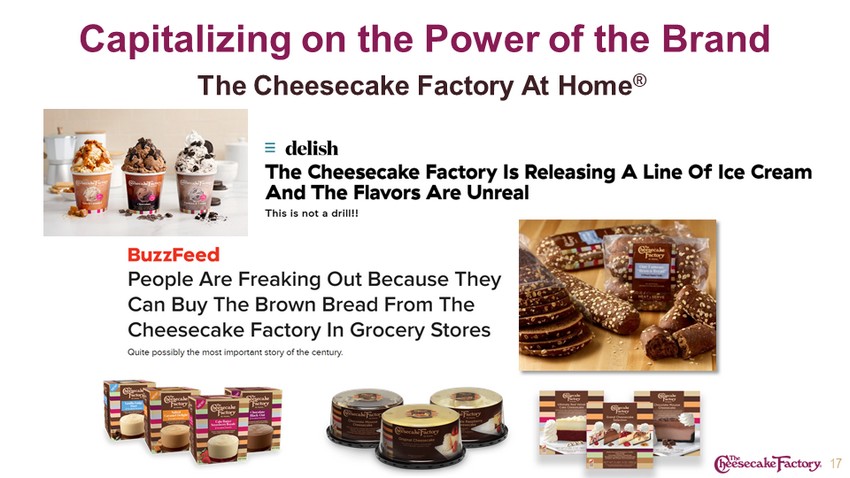
Capitalizing on the Power of the Brand The Cheesecake Factory At Home ® 17
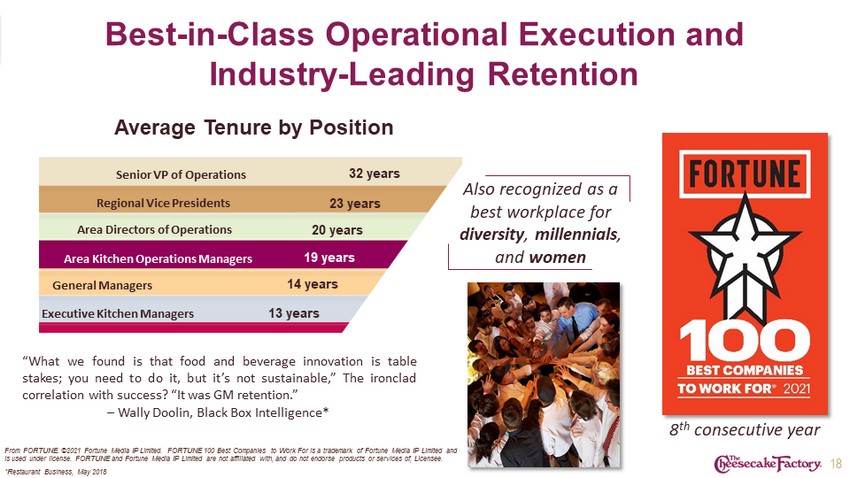
Best - in - Class Operational Execution and Industry - Leading Retention Average Tenure by Position 32 years 23 years 20 years 19 years 14 years 13 years Senior VP of Operations Regional Vice Presidents Area Directors of Operations Area Kitchen Operations Managers General Managers Executive Kitchen Managers “What we found is that food and beverage innovation is table stakes ; you need to do it, but it’s not sustainable,” The ironclad correlation with success? “It was GM retention . ” – Wally Doolin, Black Box Intelligence* From FORTUNE. ©2021 Fortune Media IP Limited. FORTUNE 100 Best Companies to Work For is a trademark of Fortune Media IP Limit ed and is used under license. FORTUNE and Fortune Media IP Limited are not affiliated with, and do not endorse products or services of, Licensee. *Restaurant Business, May 2018 18 Also recognized as a best workplace for diversity , millennials , and women 8 th consecutive year
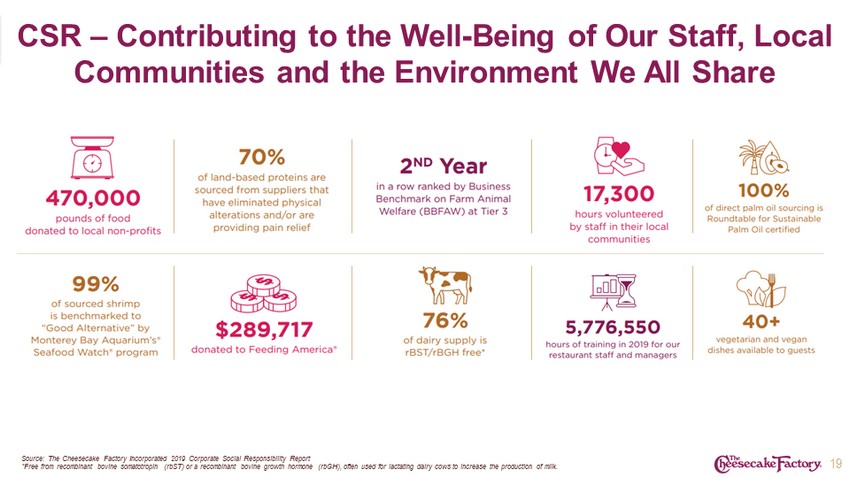
CSR – Contributing to the Well - Being of Our Staff, Local Communities and the Environment We All Share 19 Source: The Cheesecake Factory Incorporated 2019 Corporate Social Responsibility Report *Free from recombinant bovine somatotropin ( rbST ) or a recombinant bovine growth hormone ( rbGH ), often used for lactating dairy cows to increase the production of milk.
Looking Ahead: Post - COVID - 19 Diversified growth drivers once the restaurant industry operating environment normalizes 20 20 *The following targets assume full capacity conditions are ultimately permitted by state and local jurisdictions
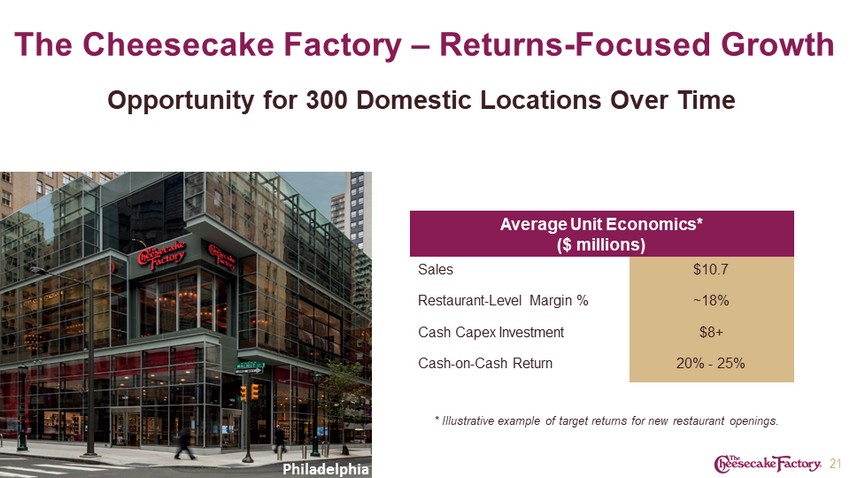
The Cheesecake Factory – Returns - Focused Growth Opportunity for 300 Domestic Locations Over Time Average Unit Economics* ($ millions) Sales $10.7 Restaurant - Level Margin % ~18% Cash Capex Investment $8+ Cash - on - Cash Return 20% - 25% * Illustrative example of target returns for new restaurant openings. Philadelphia 21
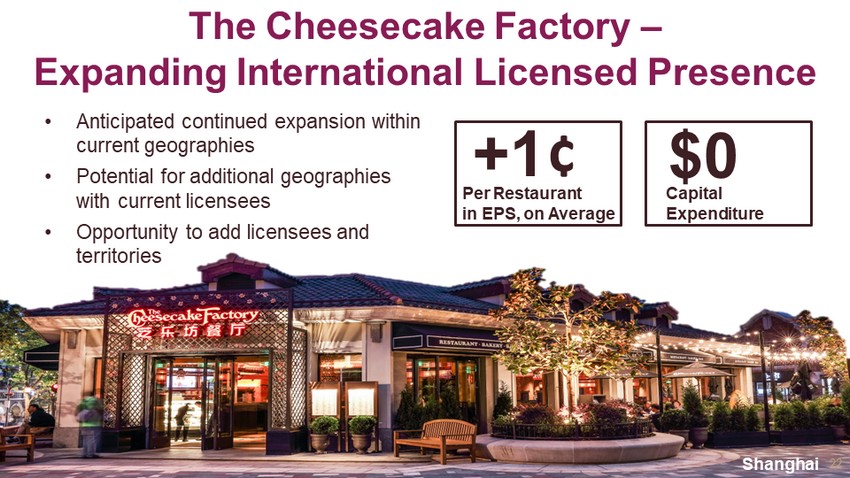
The Cheesecake Factory – Expanding International Licensed Presence • Anticipated continued expansion within current geographies • Potential for additional geographies with current licensees • Opportunity to add licensees and territories +1 ¢ Per Restaurant in EPS, on Average $0 Capital Expenditure Shanghai 22
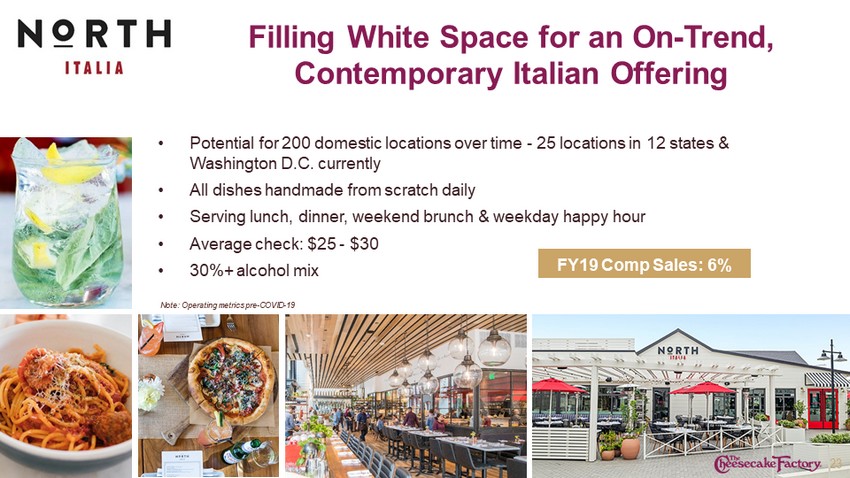
Filling White Space for an On - Trend, Contemporary Italian Offering 23 • Potential for 200 domestic locations over time - 25 locations in 12 states & Washington D.C. currently • All dishes handmade from scratch daily • Serving lunch, dinner, weekend brunch & weekday happy hour • Average check: $25 - $30 • 30%+ alcohol mix FY19 Comp Sales: 6% Note: Operating metrics pre - COVID - 19
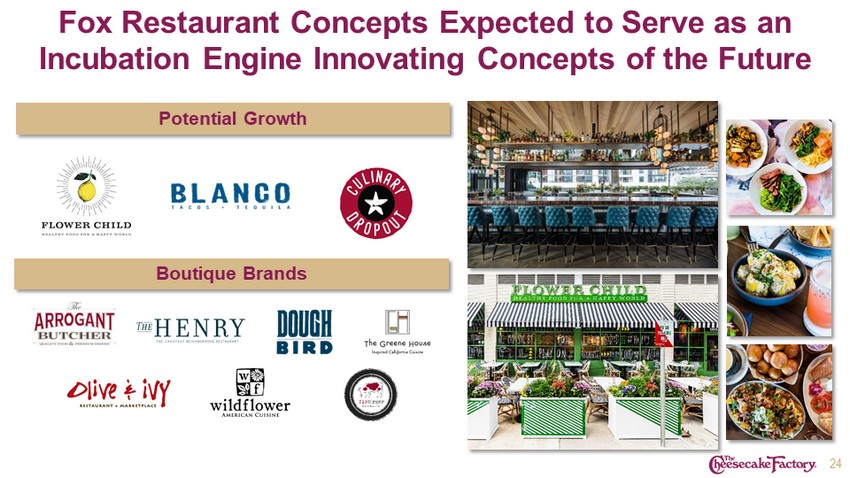
Fox Restaurant Concepts Expected to Serve as an Incubation Engine Innovating Concepts of the Future 24 Potential Growth Boutique Brands
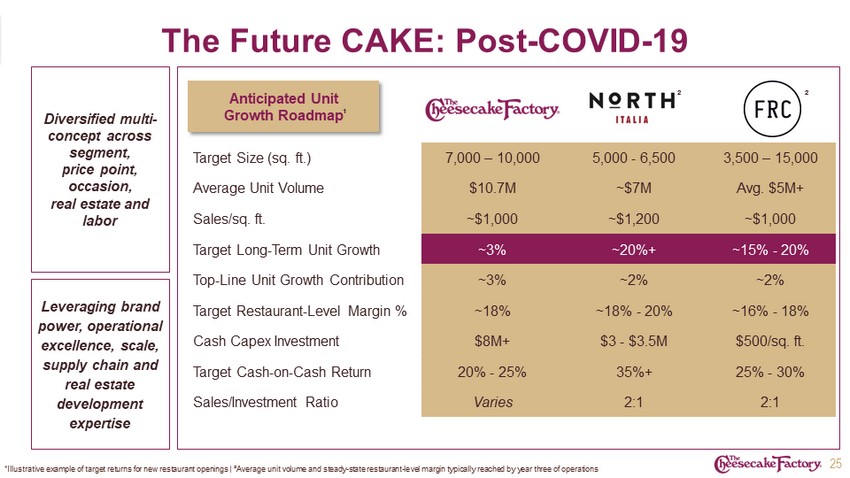
The Future CAKE: Post - COVID - 19 Target Size (sq. ft.) 7,000 – 10,000 5,000 - 6,500 3,500 – 15,000 Average Unit Volume $10.7M ~$7M Avg. $5M+ Sales/sq. ft. ~$1,000 ~$1,200 ~$1,000 Target Long - Term Unit Growth ~3% ~20%+ ~15% - 20% Top - Line Unit Growth Contribution ~3% ~2% ~2% Target Restaurant - Level Margin % ~18% ~18% - 20% ~16% - 18% Cash Capex Investment $8M+ $3 - $3.5M $500/sq. ft. Target Cash - on - Cash Return 20% - 25% 35%+ 25% - 30% Sales/Investment Ratio Varies 2:1 2:1 25 Diversified multi - concept across segment, price point, occasion, real estate and labor Leveraging brand power, operational excellence, scale, supply chain and real estate development expertise Anticipated Unit Growth Roadmap ¹Illustrative example of target returns for new restaurant openings | ²Average unit volume and steady - state restaurant - level mar gin typically reached by year three of operations ¹ ² ²
Track Record of Consistent Financial Performance 26
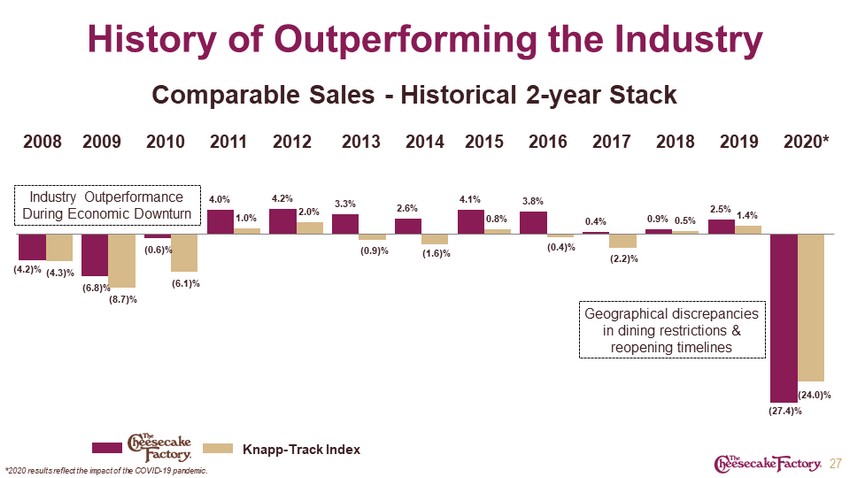
(4.2)% (6.8)% (0.6)% 4.0% 4.2% 3.3% 2.6% 4.1% 3.8% 0.4% 0.9% 2.5% (27.4)% (4.3)% (8.7)% (6.1)% 1.0% 2.0% (0.9)% (1.6)% 0.8% (0.4)% (2.2)% 0.5% 1.4% (24.0)% History of Outperforming the Industry 2008 2009 2010 2011 2012 2013 2014 2015 2016 2017 2018 2019 2020* Knapp - Track Index Comparable Sales - Historical 2 - year Stack 27 Industry Outperformance During Economic Downturn Geographical discrepancies in dining restrictions & reopening timelines *2020 results reflect the impact of the COVID - 19 pandemic.
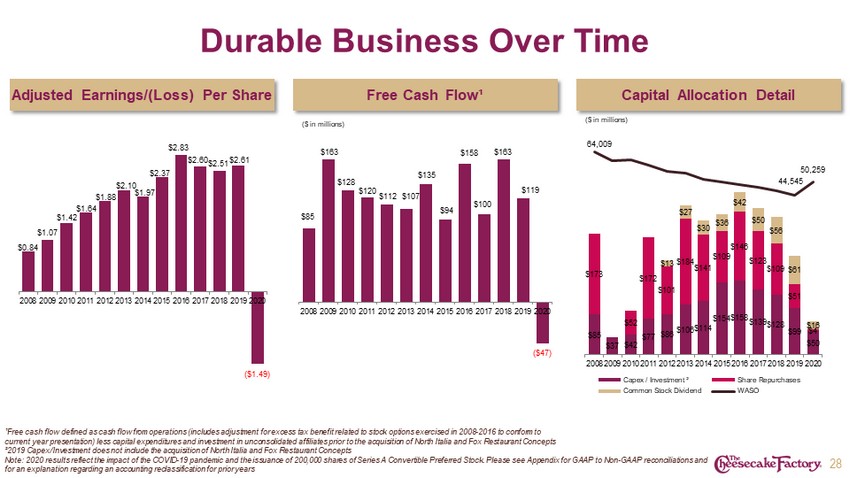
28 $0.84 $1.07 $1.42 $1.64 $1.88 $2.10 $1.97 $2.37 $2.83 $2.60 $2.51 $2.61 ($1.49) 2008 2009 2010 2011 2012 2013 2014 2015 2016 2017 2018 2019 2020 Capital Allocation Detail $85 $163 $128 $120 $112 $107 $135 $94 $158 $100 $163 $119 ($47) 2008 2009 2010 2011 2012 2013 2014 2015 2016 2017 2018 2019 2020 ¹Free cash flow defined as cash flow from operations (includes adjustment for excess tax benefit related to stock options exe rci sed in 2008 - 2016 to conform to current year presentation) less capital expenditures and investment in unconsolidated affiliates prior to the acquisition of Nor th Italia and Fox Restaurant Concepts ²2019 Capex/Investment does not include the acquisition of North Italia and Fox Restaurant Concepts Note: 2020 results reflect the impact of the COVID - 19 pandemic and the issuance of 200,000 shares of Series A Convertible Prefer red Stock. Please see Appendix for GAAP to Non - GAAP reconciliations and for an explanation regarding an accounting reclassification for prior years $85 $37 $42 $77 $86 $106 $114 $154 $158 $139 $128 $99 $50 $173 $52 $172 $101 $184 $141 $109 $146 $123 $109 $51 $4 $13 $27 $30 $36 $42 $50 $56 $61 $16 64,009 44,545 50,259 2008 2009 2010 2011 2012 2013 2014 2015 2016 2017 2018 2019 2020 Capex / Investment ² Share Repurchases Common Stock Dividend WASO Durable Business Over Time Free Cash Flow¹ Adjusted Earnings/(Loss) Per Share ($ in millions) ($ in millions)
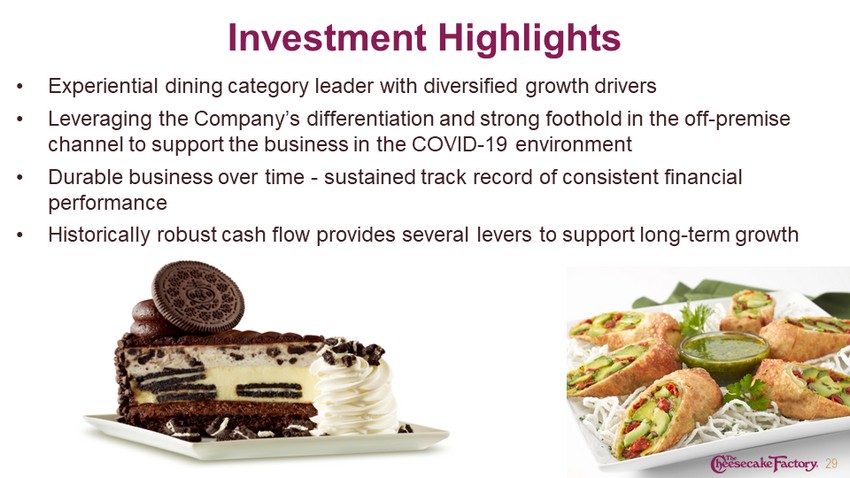
• Experiential dining category leader with diversified growth drivers • Leveraging the Company’s differentiation and strong foothold in the off - premise channel to support the business in the COVID - 19 environment • Durable business over time - sustained track record of consistent financial performance • Historically robust cash flow provides several levers to support long - term growth Investment Highlights 29
Appendix
Non - GAAP Reconciliations In addition to the results provided in accordance with the Generally Accepted Accounting Principles (“GAAP”) in this presentation, the Company is providing non - GAAP measurements which present diluted net income/(loss) per share excluding the impact of certain items and free cash flow . The non - GAAP measurements are intended to supplement the presentation of the Company’s financial results in accordance with GAAP. The Company believes that the presentation of these items provides additional information to facilitate the comparison of past and present financial results. 31
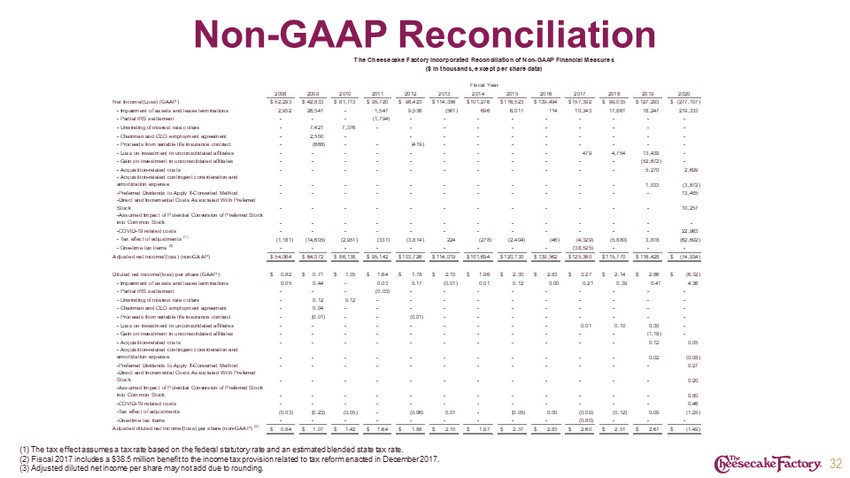
Non - GAAP Reconciliation (1) The tax effect assumes a tax rate based on the federal statutory rate and an estimated blended state tax rate. (2) Fiscal 2017 includes a $38.5 million benefit to the income tax provision related to tax reform enacted in December 2017. (3) Adjusted diluted net income per share may not add due to rounding. 32 2008 2009 2010 2011 2012 2013 2014 2015 2016 2017 2018 2019 2020 Net Income/(Loss) (GAAP) 52,293$ 42,833$ 81,713$ 95,720$ 98,423$ 114,356$ 101,276$ 116,523$ 139,494$ 157,392$ 99,035$ 127,293$ (277,107)$ - Impairment of assets and lease terminations 2,952 26,541 - 1,547 9,536 (561) 696 6,011 114 10,343 17,861 18,247 219,333 - Partial IRS settlement - - - (1,794) - - - - - - - - - - Unwinding of interest rate collars - 7,421 7,376 - - - - - - - - - - - Chairman and CEO employment agreement - 2,550 - - - - - - - - - - - Proceeds from variable life insurance contract - (668) - - (419) - - - - - - - - - Loss on investment in unconsolidated affiliates - - - - - - - - - 479 4,754 13,439 - - Gain on investment in unconsolidated affiliates - - - - - - - - - - - (52,672) - - Acquisition-related costs - - - - - - - - - - - 5,270 2,699 - Acquisition-related contingent consideration and amortization expense - - - - - - - - - - - 1,033 (3,872) -Preferred Dividends to Apply If-Converted Method - - - - - - - - - - - - 13,485 -Direct and Incremental Costs Associated With Preferred Stock - - - - - - - - - - - - 10,257 -Assumed Impact of Potential Conversion of Preferred Stock into Common Stock - - - - - - - - - - - - - -COVID-19 related costs - - - - - - - - - - - - 22,963 - Tax effect of adjustments (1) (1,181) (14,605) (2,951) (331) (3,814) 224 (278) (2,404) (46) (4,329) (5,880) 3,818 (62,692) - One-time tax items (2) - - - - - - - - - (38,525) - - - Adjusted net income/(loss) (non-GAAP) 54,064$ 64,072$ 86,138$ 95,142$ 103,726$ 114,019$ 101,694$ 120,130$ 139,562$ 125,360$ 115,770$ 116,428$ (74,934)$ Diluted net income/(loss) per share (GAAP) 0.82$ 0.71$ 1.35$ 1.64$ 1.78$ 2.10$ 1.96$ 2.30$ 2.83$ 3.27$ 2.14$ 2.86$ (6.32)$ - Impairment of assets and lease terminations 0.05 0.44 - 0.03 0.17 (0.01) 0.01 0.12 0.00 0.21 0.39 0.41 4.36 - Partial IRS settlement - - - (0.03) - - - - - - - - - - Unwinding of interest rate collars - 0.12 0.12 - - - - - - - - - - - Chairman and CEO employment agreement - 0.04 - - - - - - - - - - - - Proceeds from variable life insurance contract - (0.01) - - (0.01) - - - - - - - - - Loss on investment in unconsolidated affiliates - - - - - - - - - 0.01 0.10 0.30 - - Gain on investment in unconsolidated affiliates - - - - - - - - - - - (1.18) - - Acquisition-related costs - - - - - - - - - - - 0.12 0.05 - Acquisition-related contingent consideration and amortization expense - - - - - - - - - - - 0.02 (0.08) -Preferred Dividends to Apply If-Converted Method - - - - - - - - - - - - 0.27 -Direct and Incremental Costs Associated With Preferred Stock - - - - - - - - - - - - 0.20 -Assumed Impact of Potential Conversion of Preferred Stock into Common Stock - - - - - - - - - - - - 0.80 -COVID-19 related costs - - - - - - - - - - - - 0.46 -Tax effect of adjustments (0.03) (0.23) (0.05) - (0.06) 0.01 - (0.05) 0.00 (0.09) (0.12) 0.09 (1.25) -One-time tax items - - - - - - - - - (0.80) - - - Adjusted diluted net income/(loss) per share (non-GAAP) (3) 0.84$ 1.07$ 1.42$ 1.64$ 1.88$ 2.10$ 1.97$ 2.37$ 2.83$ 2.60$ 2.51$ 2.61$ (1.49)$ Fiscal Year The Cheesecake Factory Incorporated Reconciliation of Non-GAAP Financial Measures ($ in thousands, except per share data)
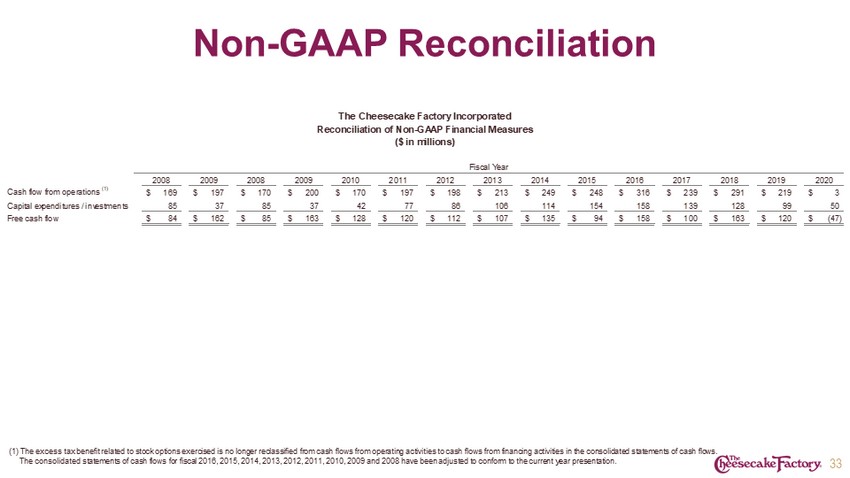
Non - GAAP Reconciliation (1) The excess tax benefit related to stock options exercised is no longer reclassified from cash flows from operating activi tie s to cash flows from financing activities in the consolidated statements of cash flows. The consolidated statements of cash flows for fiscal 2016, 2015, 2014, 2013, 2012, 2011, 2010, 2009 and 2008 have been adjust ed to conform to the current year presentation. 33 2008 2009 2008 2009 2010 2011 2012 2013 2014 2015 2016 2017 2018 2019 2020 Cash flow from operations (1) 169$ 197$ 170$ 200$ 170$ 197$ 198$ 213$ 249$ 248$ 316$ 239$ 291$ 219$ 3$ Capital expenditures / investments 85 37 85 37 42 77 86 106 114 154 158 139 128 99 50 Free cash flow 84$ 162$ 85$ 163$ 128$ 120$ 112$ 107$ 135$ 94$ 158$ 100$ 163$ 120$ (47)$ Fiscal Year The Cheesecake Factory Incorporated Reconciliation of Non-GAAP Financial Measures ($ in millions)