Exhibit 99.2

CAPSTONE HOLDING CORP. March 2025 BUILT TO DELIVER. POSITIONED TO ACQUIRE. READY TO SCALE.
Preamble Disclosure & Disclaimer The following content is completely qualified by the legal disclosures on the following two slide s . Our goal is to share with you some of our strategic thinking and financial analysis we are using to guide the growth of our b usi ness. The content is in line with our principles of being accountable and transparent with shareholders. We operate in a hyper dynamic economic environment. That’s a fancy way of saying things change quickly. What we are telling y ou here is based on our estimates and assumptions which are our best guess. We reserve the right to revise our point of view bas ed on new information and changes in the business environment. Despite an uncertain, dynamic environment, we must plan and make operating and investment decisions. This presentation lays s ome of that out for your review.
Legal Disclosure & Disclaimer This presentation includes forward - looking statements within the meaning of the Private Securities Litigation Reform Act that reflect our current views with respect to, among other things, our operations, business strategy, interpretation of prior development activities, plans to develop and commercialize our products and services, potential market opportunity, financial performance and needs for additional financing . We have used words like "anticipate," "believe," "could,“ "estimate," "expect," "future," "intend," "may," "plan," "potential," "project," "will," and similar terms and phrases to identify forward - looking statements in this presentation . The forward - looking statements contained in this presentation are based on management's current expectations and are subject to substantial risks, uncertainty and changes in circumstances . Actual results may differ materially from those expressed by these expectations due to risks and uncertainties, including, among others, those related to our ability to obtain additional capital on favorable terms to us, or at all, the success, timing and cost of ongoing or future operations, the lengthy and unpredictable nature of the project development, and technology process and business - es in which we currently engage or may engage . These risks and uncertainties include, but may not be limited to, those described in our filings with the SEC . Forward - looking statements speak only as of the date of this presentation, and we undertake no obligation to review or update any forward - looking statement except as may be required by applicable law . The material in this presentation has been prepared by Capstone and is general background information about Capstone’s activities, current as at the date of this presentation and is provided for information purposes only . It should be read in conjunction with Capstone’s periodic and continuous disclosure announcements filed with the Securities and Exchange Commission . This presentation provides information in summary form only and is not intended to be complete . Capstone makes no representation or warranty, express or implied, as to the accuracy, completeness, fairness or reliability of any of the information, illustrations, examples, opinions, forecasts, reports, estimates and conclusions contained in this presentation . It is not intended to be relied upon as advice or a recommendation to investors or potential investors and does not take into account the investment objectives, financial situation, taxation situation or needs of any particular investor . Due care and consideration should be undertaken when consid - ering and analyzing Capstone’s future performance and business prospects .
Contd... THIS PRESENTATION IS NOT INTENDED TO SERVE AS A FORECAST OF ANY SUCH FUTURE PERFORMANCE OR PROSPECTS . An investor must not act on any m att er contained in this document but must make its own assessment of Capstone and conduct its own investigations and analysis . Investors should assess their own individual financial circumstances and consider talking to a financial adviser, professional adviser or consultant before making any investment decision . This document does not constitute an offer, invitation, solicitation or recommendation with respect to the purchase or sale of any security in Capstone nor does it constitute financial product advice . This document is not a prospectus, product disclosure statement or other offer document under United States federal or state securities law or under any other law . This document has not been filed, registered or approved by regulatory authorities in any jurisdiction . This presentation contains statistical and market data that we obtained from industry publications, reports generated by third parties, and third - party studies . Although we believe that the publications, reports, and studies are reliable as of the date of this presentation, we have not independently verified such statistical or market data . Any projection, forecast, estimate or other “forward - looking” statement in this presentation only illustrates hypothetical performance under specified assumptions of events or conditions that have been clearly delineated herein . Such projections, forecasts, estimates or other “forward - looking” statements are not reliable indicators of future performance . Hypothetical or illustrative performance information contained in these materials may not be relied upon as a promise, prediction or projection of future performance and are subject to significant assumptions and limitations . In addition, not all relevant events or conditions may have been considered in developing such assumptions . READERS OF THIS DOCUMENT SHOULD UNDERSTAND THE ASSUMPTIONS AND EVALUATE WHETHER THEY ARE APPROPRIATE FOR THEIR PURPOSES . SOME EVENTS OR CONDITIONS MAY NOT HAVE BEEN CONSIDERED IN SUCH ASSUMPTIONS . ACTUAL EVENTS OR CONDITIONS WILL VARY AND MAY DIFFER MATERIALLY FROM SUCH ASSUMPTIONS . READERS SHOULD UNDERSTAND SUCH ASSUMPTIONS AND EVALUATE WHETHER THEY ARE APPROPRI - ATE FOR THEIR PURPOSES . This presentation may include figures related to past performance or simulated past performance as well as forecasted or simulated future performance . Capstone disclaims any obligation to update their views of such risks and uncertainties or to publicly announce the results of any revision to the forward - looking statements made herein . Use of Projections and Illustrations - this presentation contains certain financial forecasts and illustrations . Neither Capstone nor Capstone’s independent auditors have studied, reviewed, compiled or performed any procedures with respect to the projections for the purpose of their inclusion in this presentation . The material in this presentation is for illustrative purposes only and should not be relied upon as being necessarily indicative of future results .
Capstone Goals for 2025 Performance of Instone in 2024 Earnings Power of Instone Standalone for 2025 Agenda Agenda

Capstone Goals for 2025
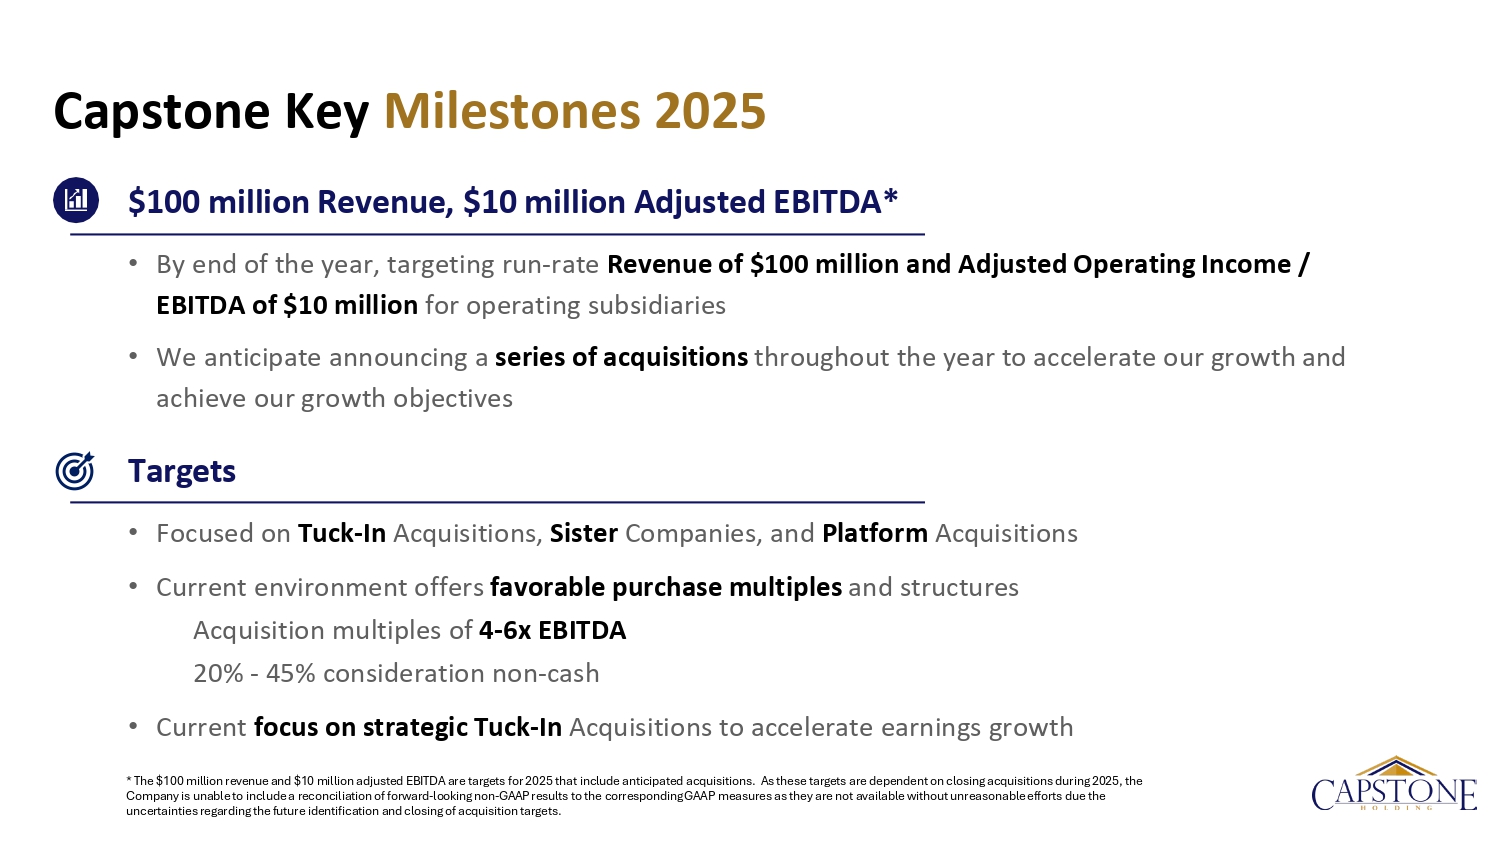
Capstone Key Milestones 2025 $100 million Revenue, $10 million Adjusted EBITDA * • By end of the year, targeting run - rate Re venue of $100 million and Adjusted Operating Income / EBITDA of $10 million for operating subsidiaries • We anticipate announcing a series of acquisitions throughout the year to accelerate our growth and achieve our growth objectives Targets • Focused on Tuck - In Acquisitions, Sister Companies, and Platform Acquisitions • Current environment offers favorable purchase multiples and structures Acquisition multiples of 4 - 6x EBITDA 20% - 45% consideration non - cash • Current focus on strategic Tuck - In Acquisitions to accelerate earnings growth * The $100 million revenue and $10 million adjusted EBITDA are targets for 2025 that include anticipated acquisitions. As these targets are dependent on closing acquisitions during 2025, the Company is unable to include a reconciliation of forward - looking non - GAAP results to the corresponding GAAP measures as they are not available without unreasonable efforts due the uncertainties regarding the future identification and closing of acquisition targets.
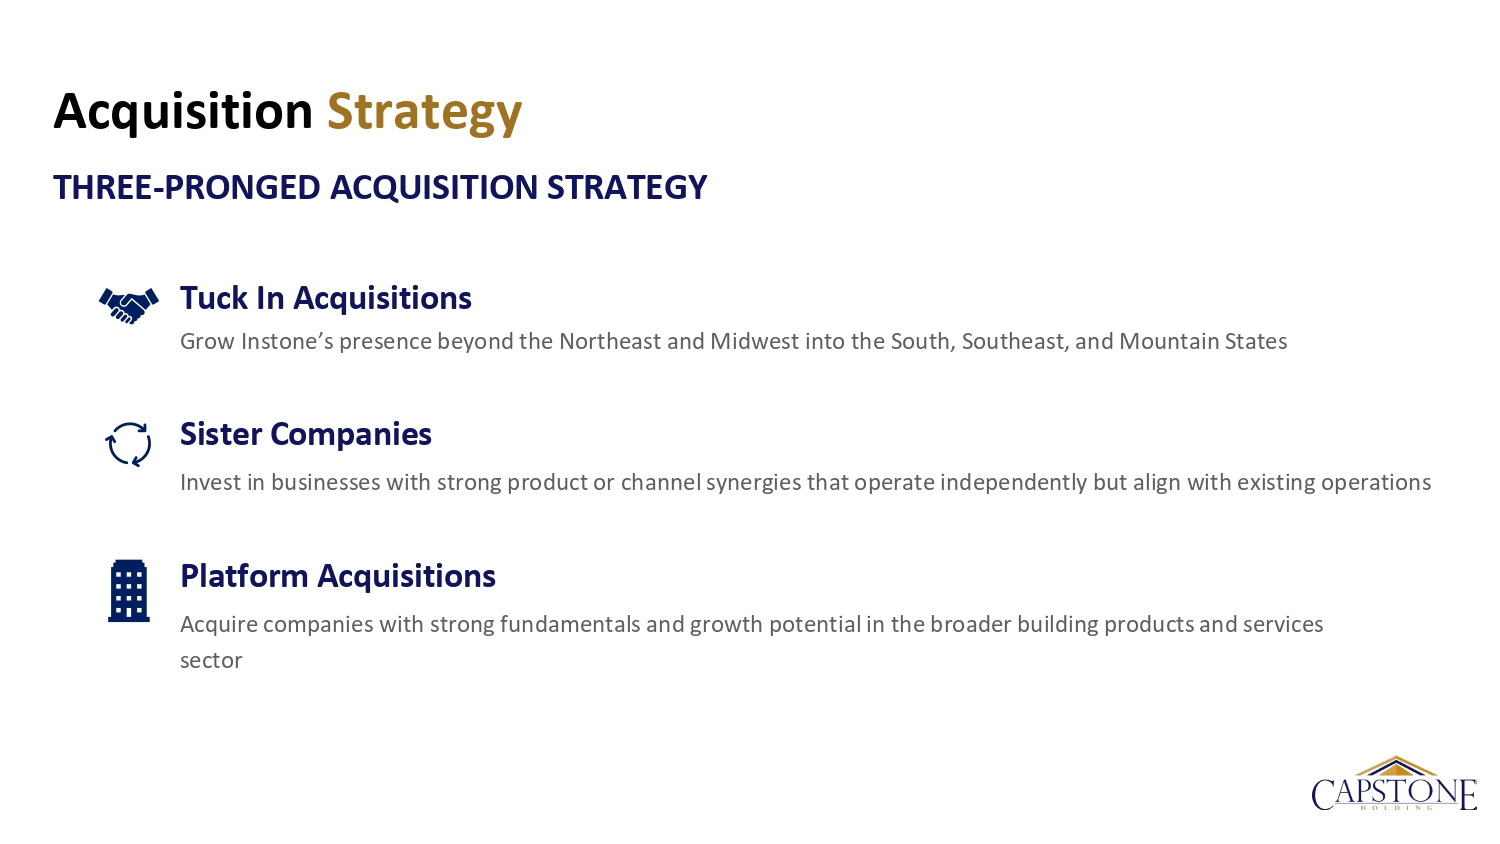
Acquisition Strategy THREE - PRONGED ACQUISITION STRATEGY Tuck In Acquisitions Grow Instone’s presence beyond the Northeast and Midwest into the South, Southeast, and Mountain States Sister Companies Invest in businesses with strong product or channel synergies that operate independently but align with existing operations Platform Acquisitions Acquire companies with strong fundamentals and growth potential in the broader building products and services sector

Performance of Instone in 2024
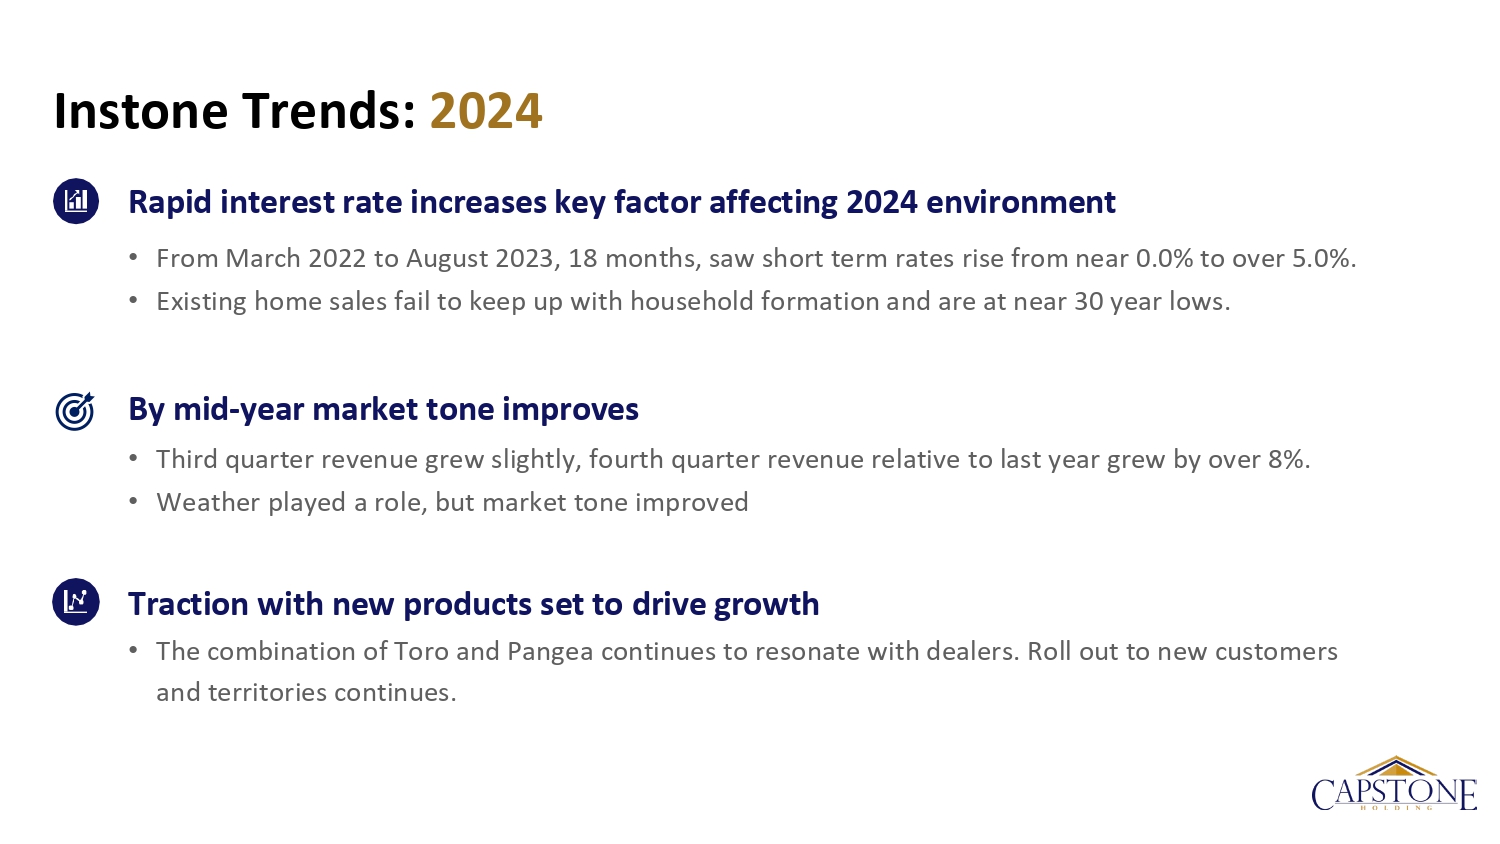
Instone Trends: 2024 Rapid interest rate increases key factor affecting 2024 environment • From March 2022 to August 2023, 18 months, saw short term rates rise from near 0.0% to over 5.0%. • Existing home sales fail to keep up with household formation and are at near 30 year lows. By mid - year market tone improves • Third quarter revenue grew slightly, fourth quarter revenue relative to last year grew by over 8%. • Weather played a role, but market tone improved Traction with new products set to drive growth • The combination of Toro and Pangea continues to resonate with dealers. Roll out to new customers and territories continues.
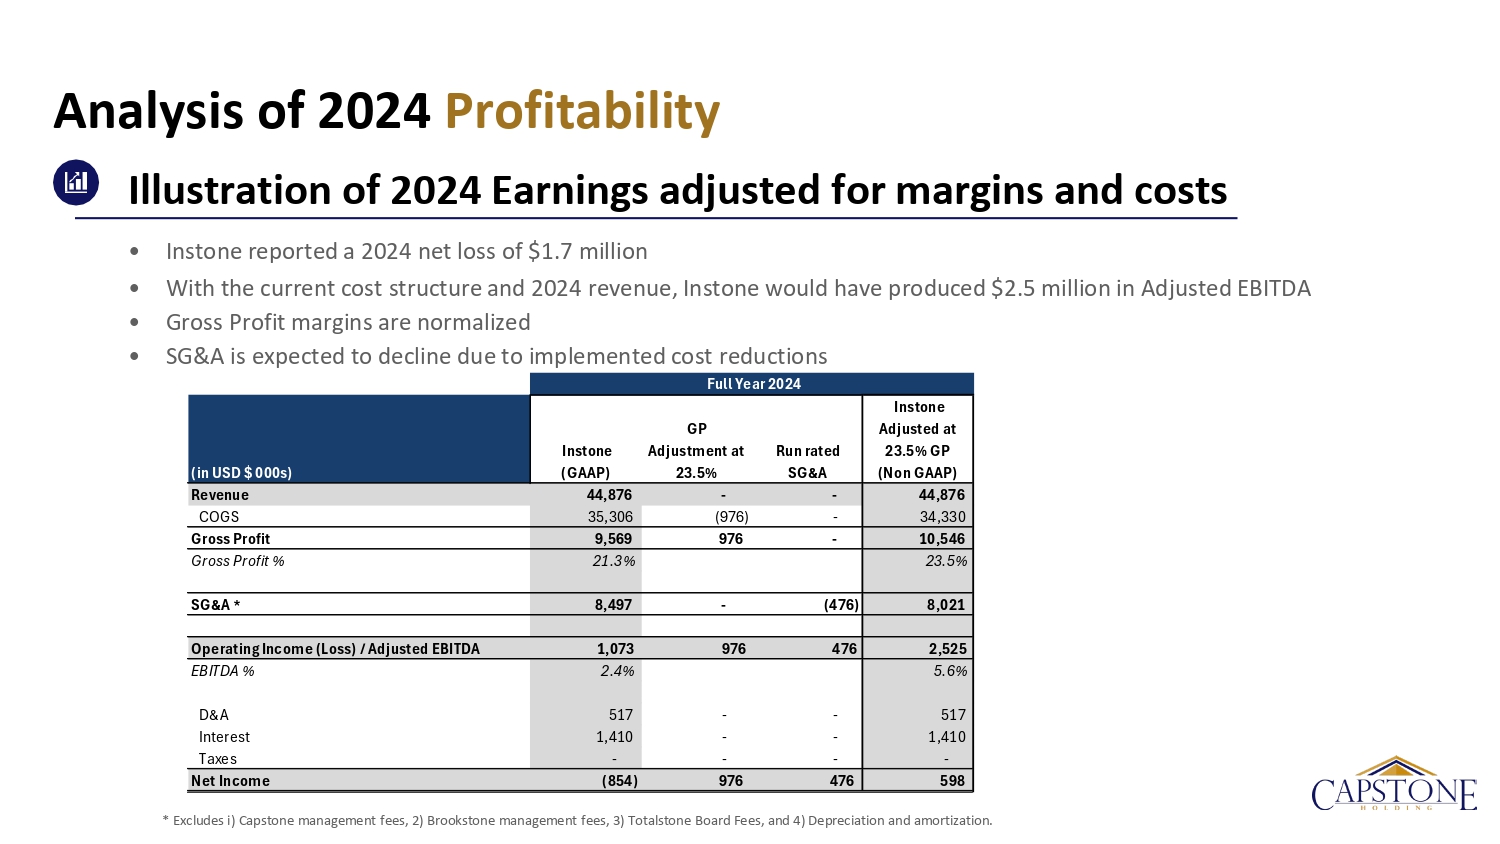
(in USD $ 000s) Instone (GAAP) GP Adjustment at 23.5% Run rated SG&A Instone Adjusted at 23.5% GP (Non GAAP) Revenue 44,876 - - 44,876 COGS 35,306 (976) - 34,330 Gross Profit 9,569 976 - 10,546 Gross Profit % 21.3% 23.5% SG&A * 8,497 - (476) 8,021 Operating Income (Loss) / Adjusted EBITDA 1,073 976 476 2,525 EBITDA % 2.4% 5.6% D&A 517 - - 517 Interest 1,410 - - 1,410 Taxes - - - - Net Income (854) 976 476 598 Full Year 2024 Analysis of 2024 Profitability Illustration of 2024 Earnings adjusted for margins and costs • Instone reported a 2024 net loss of $1.7 million • With the current cost structure and 2024 r evenue , Instone would have produced $2.5 million in Adjusted EBITDA • Gross Profit margins are normalized • SG&A is expected to decline due to implemented cost reductions * Excludes i) Capstone management fees, 2) Brookstone management fees, 3) Totalstone Board Fees, and 4) Depreciation and amor tiz ation.
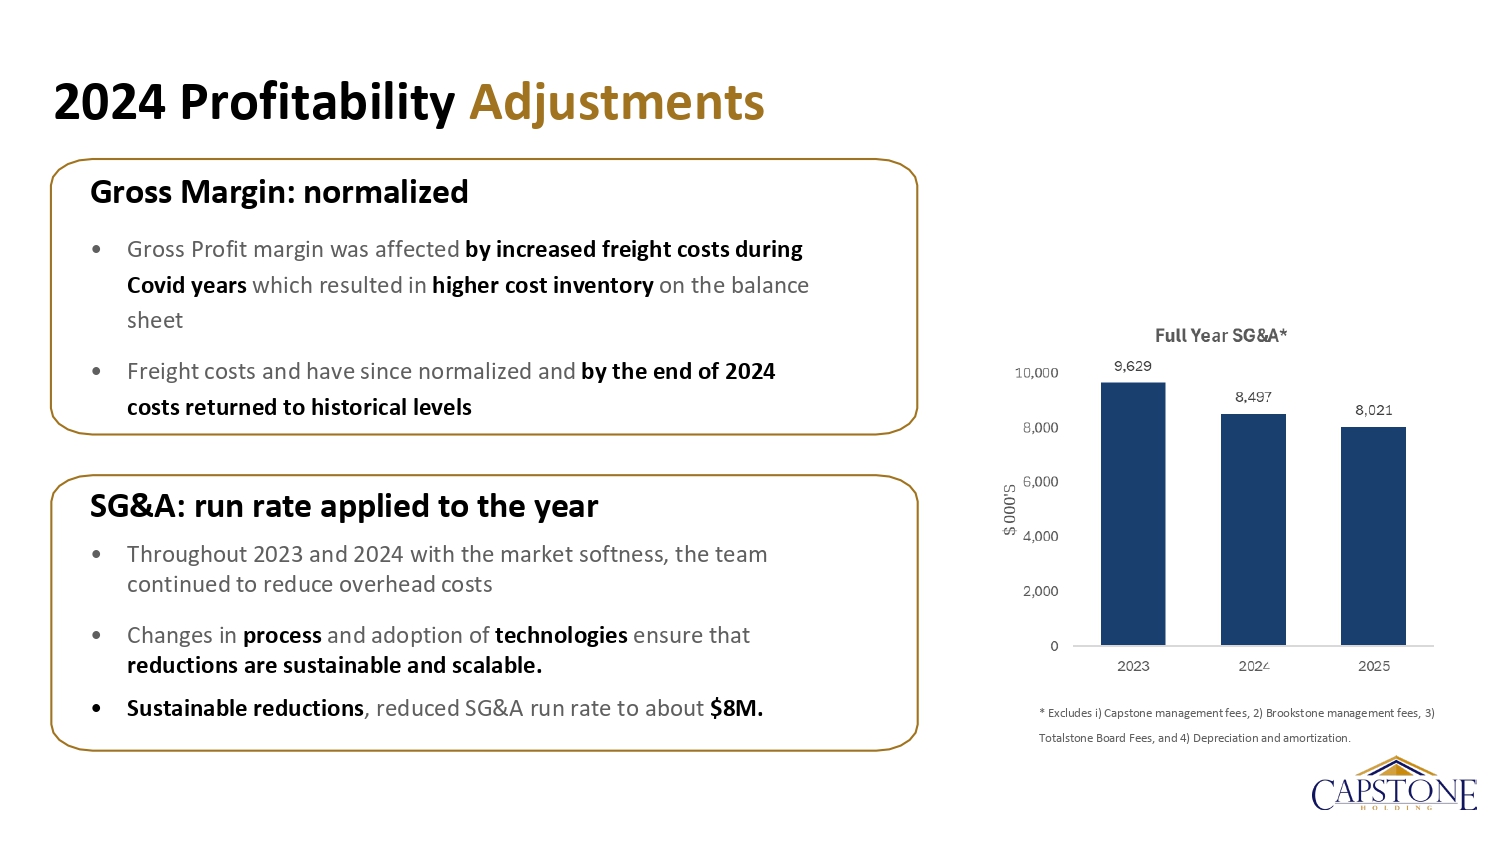
2024 Profitability Adjustments Gross Margin: normalized • Gross Profit margin was affected by increased freight costs during Covid years which resulted in higher cost inventory on the balance sheet • Freight costs and have since normalized and by the end of 2024 costs returned to historical levels SG&A: run rate applied to the year • Throughout 2023 and 2024 with the market softness, the team continued to reduce overhead costs • Changes in process and adoption of technologies e nsure that reductions are sustainable and scalable. • Sustainable reductions , reduced SG&A run rate to about $8M. * Excludes i) Capstone management fees, 2) Brookstone management fees, 3) Totalstone Board Fees, and 4) Depreciation and amortization.
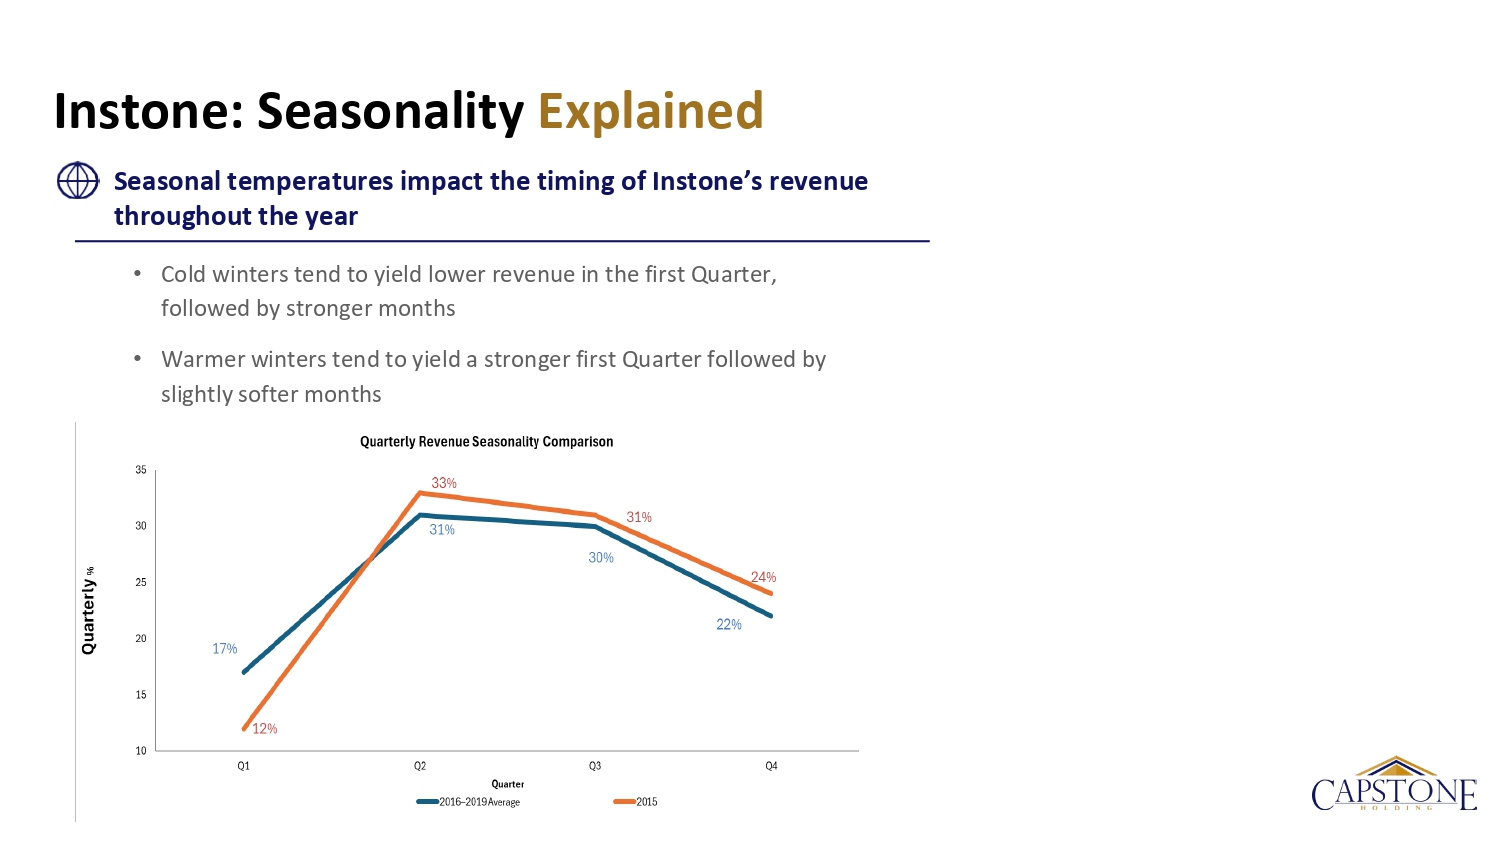
Instone : Seasonality Explained • Cold winters tend to yield lower revenue in the first Quarter, followed by stronger months • Warmer winters tend to yield a stronger first Quarter followed by slightly softer months Seasonal temperatures impact the timing of Instone’s revenue throughout the year

Earnings Plan for 2025
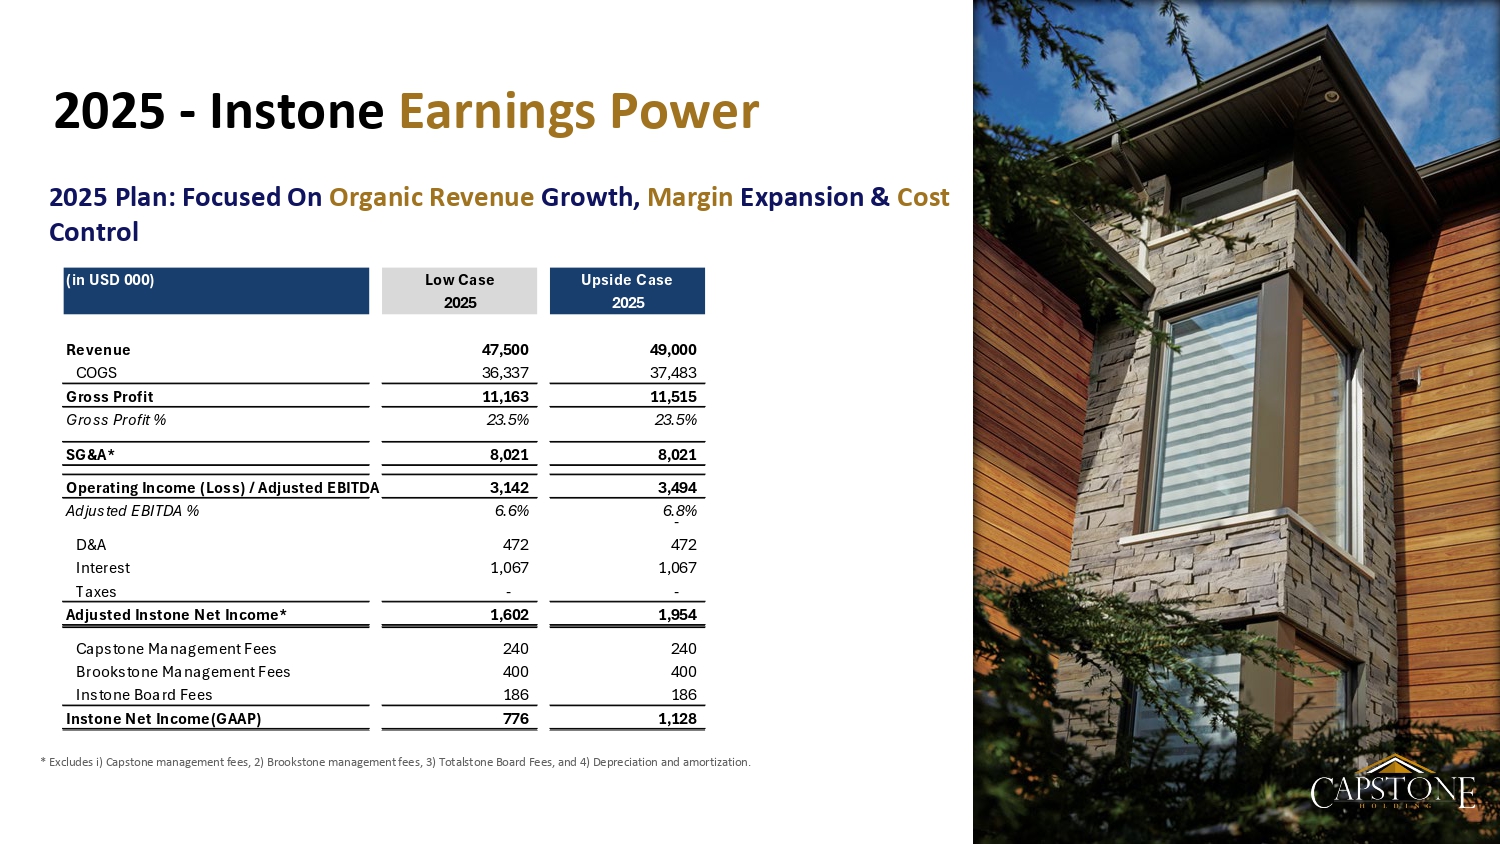
2025 - Instone Earnings Power 2025 Plan : F ocused O n O rganic Revenue Growth , M argin Expansion & C ost C ontrol * Excludes i) Capstone management fees, 2) Brookstone management fees, 3) Totalstone Board Fees, and 4) Depreciation and amorti zat ion. (in USD 000) Low Case Upside Case 2025 2025 Revenue 47,500 49,000 COGS 36,337 37,483 Gross Profit 11,163 11,515 Gross Profit % 23.5% 23.5% SG&A* 8,021 8,021 Operating Income (Loss) / Adjusted EBITDA 3,142 3,494 Adjusted EBITDA % 6.6% 6.8% - D&A 472 472 Interest 1,067 1,067 Taxes - - Adjusted Instone Net Income* 1,602 1,954 Capstone Management Fees 240 240 Brookstone Management Fees 400 400 Instone Board Fees 186 186 Instone Net Income(GAAP) 776 1,128
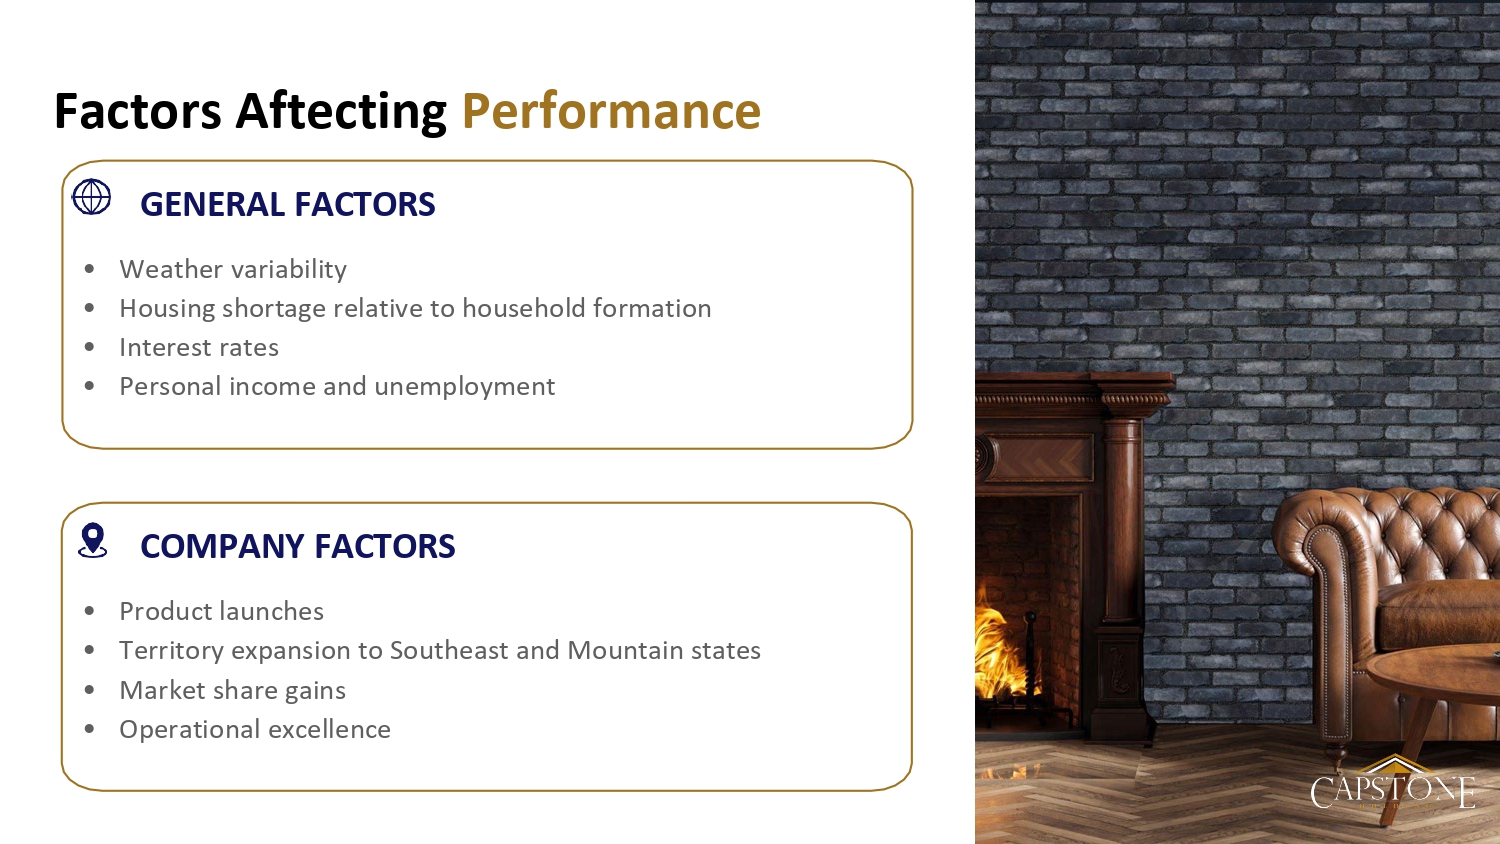
COMPANY FACTORS • Product l aunches • Territory e xpansion to Southeast and Mountain states • Market s hare gains • Operational e xcellence Factors Aftecting Performance GENERAL FACTORS • Weather variability • Housing shortage relative to household formation • Interest rates • Personal income and unemployment
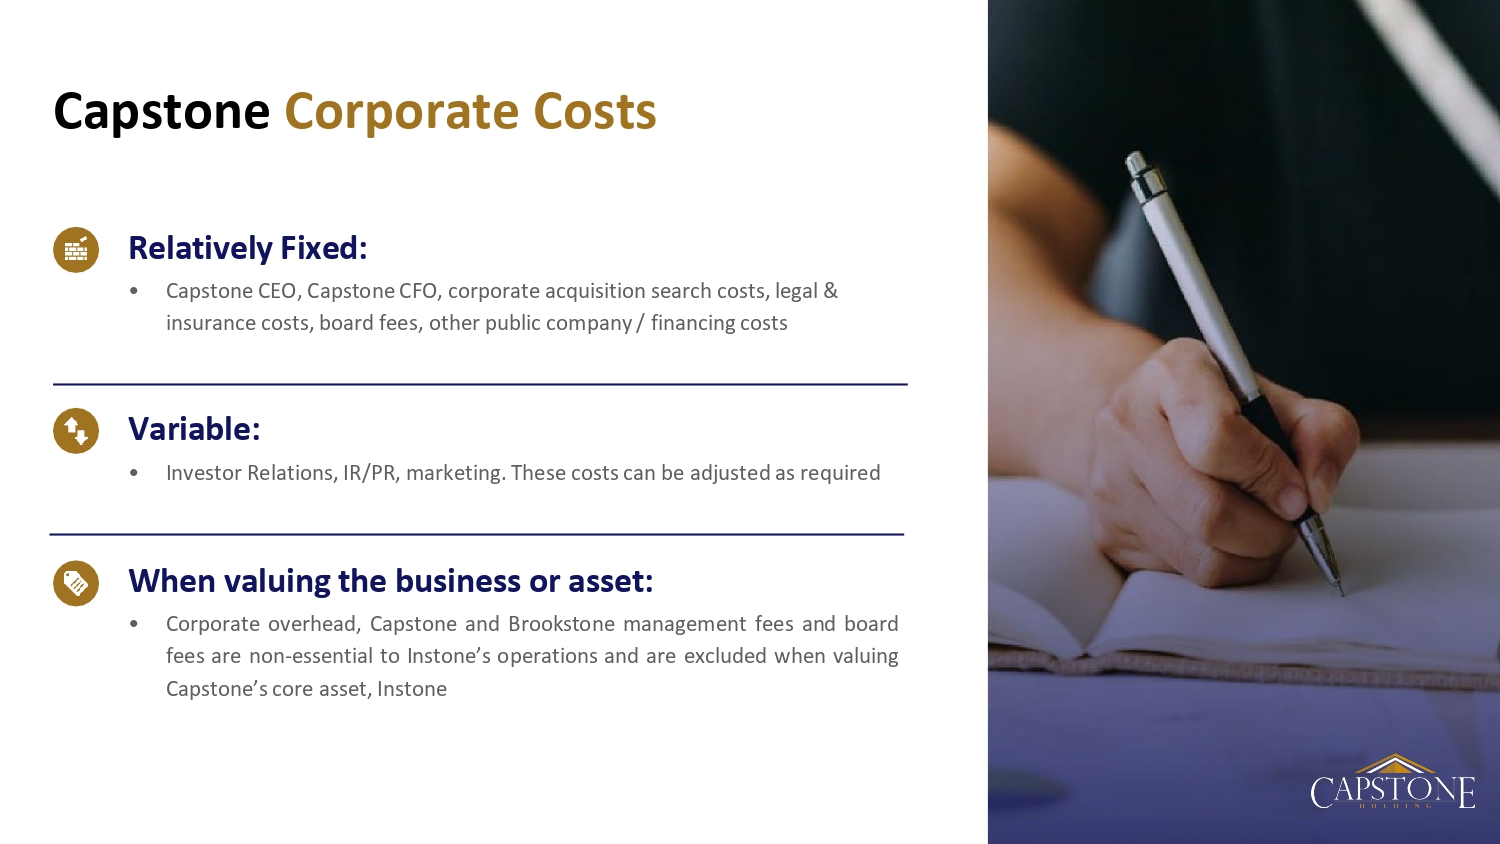
Capstone Corporate Costs Relatively Fixed: • Capstone CEO, Capstone CFO, corporate acquisition search costs, legal & insurance costs, board fees, other public company / financing costs Variable: • Investor Relations, IR/PR, marketing. These costs can be adjusted as required When valuing the business or asset: • Corporate overhead , Capstone and Brookstone management fees and board fees are non - essential to Instone’s operations and are excluded when valuing Capstone’s core asset, Instone
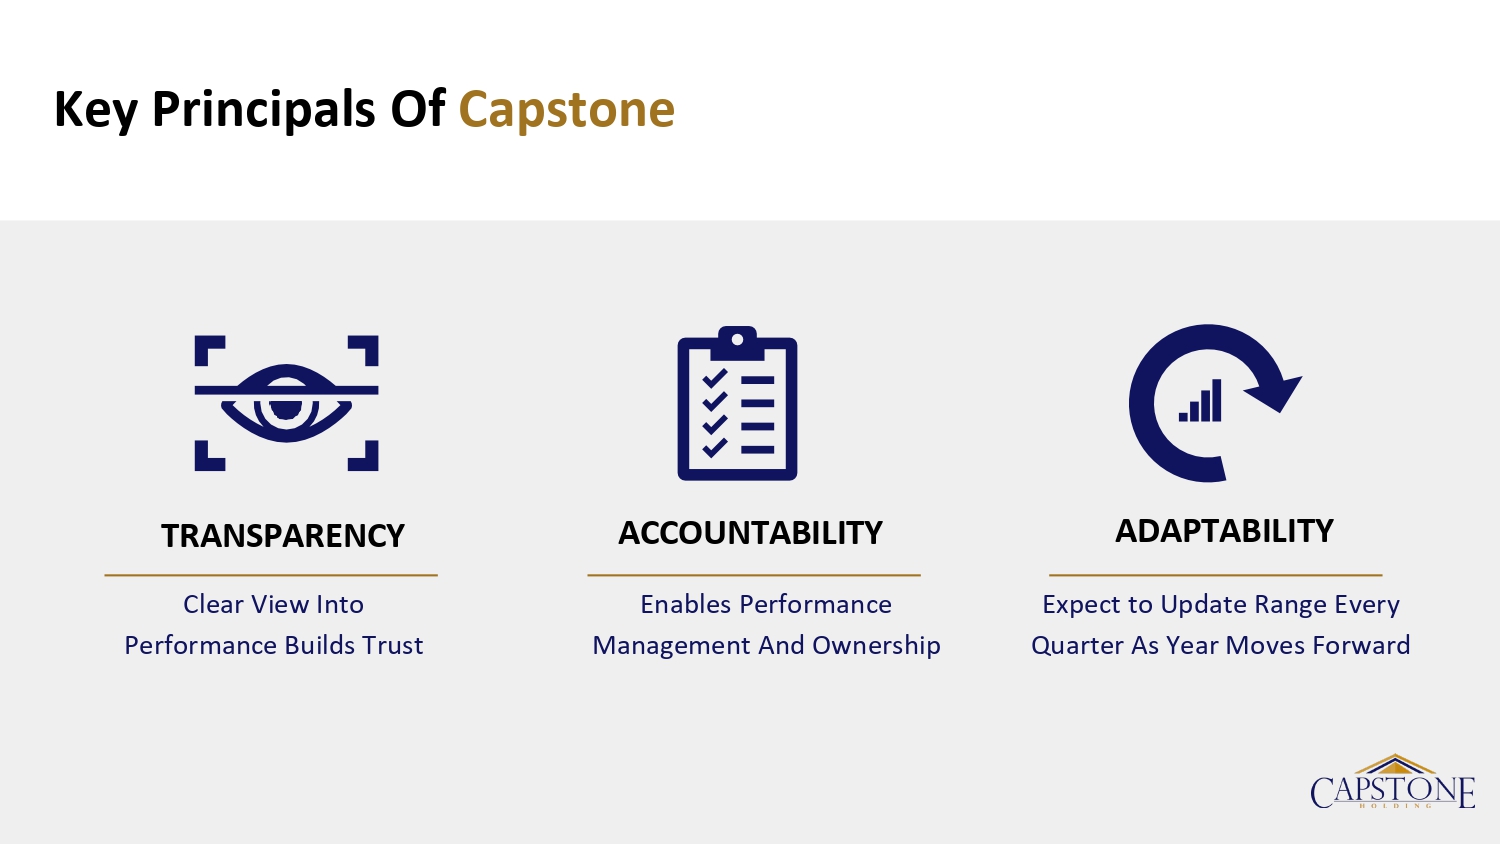
Key Principals Of Capstone TRANSPARENCY Clear View Into Performance Builds Trust ACCOUNTABILITY Enables Performance Management And Ownership ADAPTABILITY Expect to Update Range Every Quarter As Year Moves Forward

Appendix
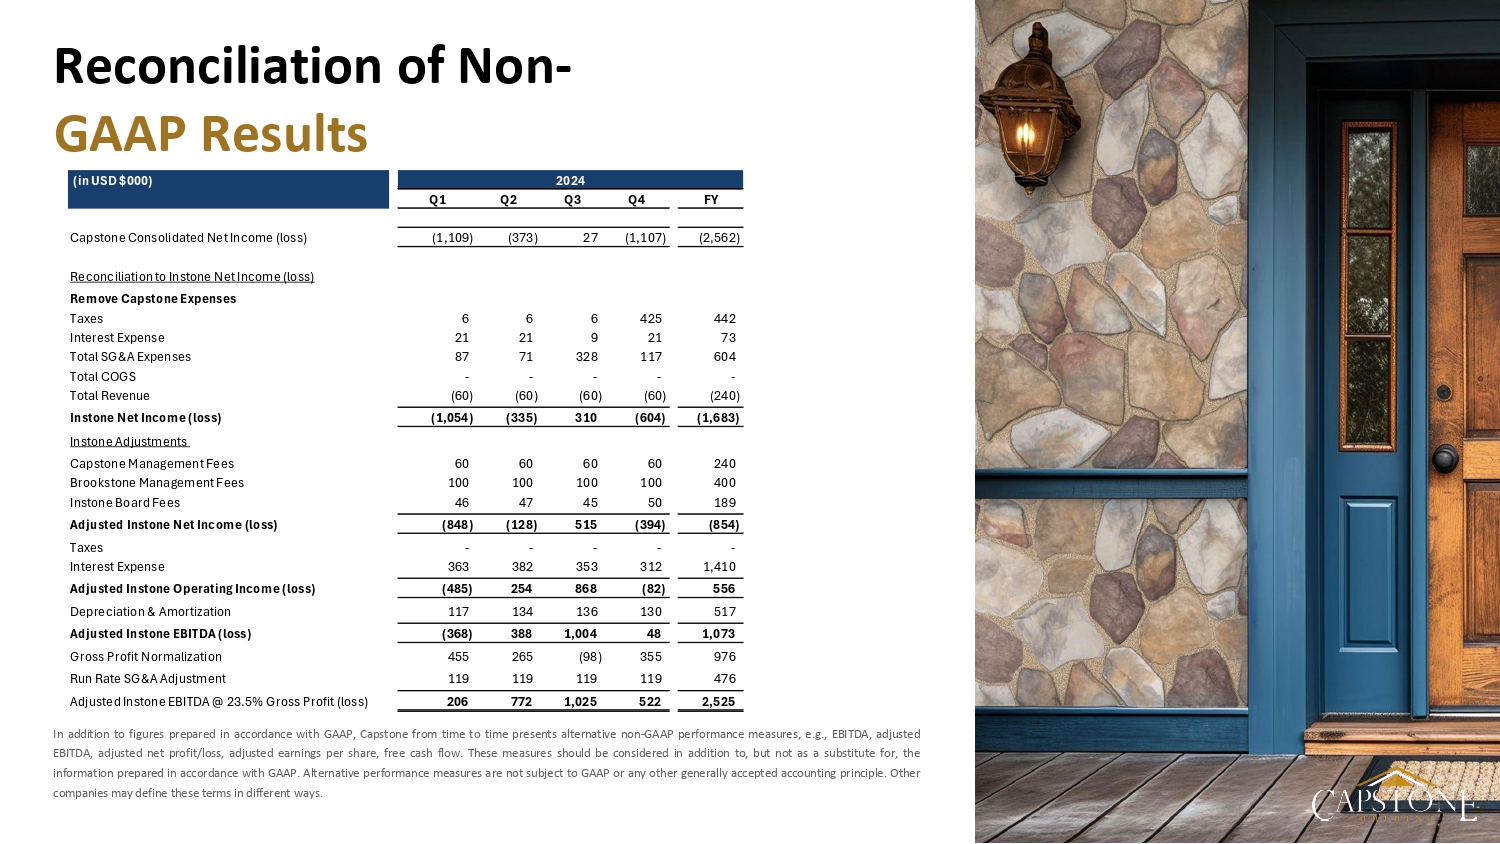
Reconciliation of Non - GAAP Results In addition to figures prepared in accordance with GAAP, Capstone from time to time presents alternative non - GAAP performance measures, e . g . , EBITDA, adjusted EBITDA, adjusted net profit/loss, adjusted earnings per share, free cash flow . These measures should be considered in addition to, but not as a substitute for, the information prepared in accordance with GAAP . Alternative performance measures are not subject to GAAP or any other generally accepted accounting principle . Other companies may define these terms in different ways . (in USD $000) Q1 Q2 Q3 Q4 FY Capstone Consolidated Net Income (loss) (1,109) (373) 27 (1,107) (2,562) Reconciliation to Instone Net Income (loss) Remove Capstone Expenses Taxes 6 6 6 425 442 Interest Expense 21 21 9 21 73 Total SG&A Expenses 87 71 328 117 604 Total COGS - - - - - Total Revenue (60) (60) (60) (60) (240) Instone Net Income (loss) (1,054) (335) 310 (604) (1,683) Instone Adjustments Capstone Management Fees 60 60 60 60 240 Brookstone Management Fees 100 100 100 100 400 Instone Board Fees 46 47 45 50 189 Adjusted Instone Net Income (loss) (848) (128) 515 (394) (854) Taxes - - - - - Interest Expense 363 382 353 312 1,410 Adjusted Instone Operating Income (loss) (485) 254 868 (82) 556 Depreciation & Amortization 117 134 136 130 517 Adjusted Instone EBITDA (loss) (368) 388 1,004 48 1,073 Gross Profit Normalization 455 265 (98) 355 976 Run Rate SG&A Adjustment 119 119 119 119 476 Adjusted Instone EBITDA @ 23.5% Gross Profit (loss) 206 772 1,025 522 2,525 2024
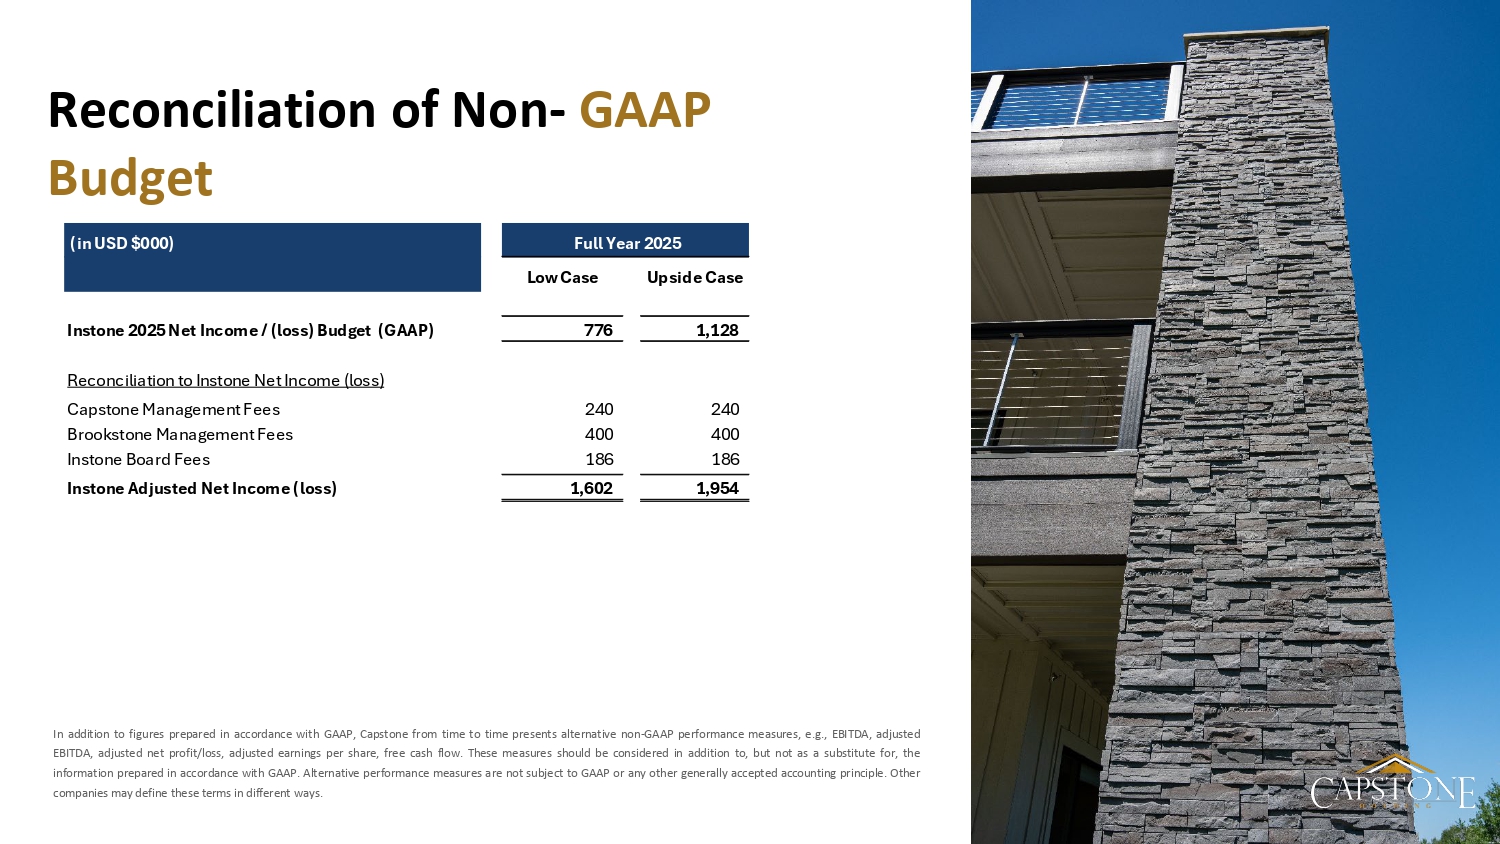
Reconciliation of Non - GAAP Budget In addition to figures prepared in accordance with GAAP, Capstone from time to time presents alternative non - GAAP performance measures, e . g . , EBITDA, adjusted EBITDA, adjusted net profit/loss, adjusted earnings per share, free cash flow . These measures should be considered in addition to, but not as a substitute for, the information prepared in accordance with GAAP . Alternative performance measures are not subject to GAAP or any other generally accepted accounting principle . Other companies may define these terms in different ways . (in USD $000) Low Case Upside Case Instone 2025 Net Income / (loss) Budget (GAAP) 776 1,128 Reconciliation to Instone Net Income (loss) Capstone Management Fees 240 240 Brookstone Management Fees 400 400 Instone Board Fees 186 186 Instone Adjusted Net Income (loss) 1,602 1,954 Full Year 2025
Financial Measures - Non - GAAP Capstone uses non - GAAP Adjusted EBITDA as a supplemental measure of our performance that is not required by, or presented in accordance with, accounting principles generally accepted in the United States (GAAP). A non - GAAP financial measure is a numerical measure of a company’s financial performance that excludes or includes amounts so as to be different from the most directly comparable measure calculated and presented in accordance with GAAP in the statement of operations, balance sheet or statement of cash flows of a company. Adjusted Instone EBITDA and Adjusted Instone EBITDA @ 23.5% Gross Profit (Loss) are not measurements of financial performance under GAAP and should not be considered as an alternative to net income (loss), operating income (loss), or any other performance measure derived in accordance with GAAP, or as an alternative to cash flow from operating activities or a measure of our liquidity. Capstone urges investors to review the reconciliation of non - GAAP Adjusted EBITDA to the comparable GAAP Net Income (Loss), which is included in this presentation, and not to rely on any single financial measure to evaluate Capstone’s financial performance. We believe that Adjusted Instone EBITDA is a useful performance measure and is used by us to facilitate a comparison of our operating performance on a consistent basis from period - to - period and to provide for a more complete understanding of factors and trends affecting our business than measures under GAAP can provide alone. We define “ Adjusted Instone EBITDA ” as earnings (loss) before interest expense, any income taxes, depreciation and amortization expense, management fees incurred by Instone payable to Capstone and Brookstone, Instone board fees, share - based compensation, change in fair value of contingent consideration, and transaction costs. We believe that Adjusted Instone EBITDA @ 23.5% Gross Profit (Loss) is a useful performance measure and is used by us to measure Instone’s adjusted EBITDA on a current run rate basis. We define “Adjusted EBITDA @ 23.5% Gross Profit (Loss)” as Adjusted EBITDA plus adjustments to derive gross profit at our estimated next twelve month gross profit percentage and reflect SGA expenses based on our SGA costs incurred in our last historical quarter.

GROWTH IS JUST GETTING STARTED. LEARN MORE AT www.capstoneholdingcorp.com