Exhibit 99.1

META FINANCIAL GROUP, INC.® ANNOUNCES RESULTS FOR 2020 FISCAL SECOND QUARTER
- 2020 Fiscal Second Quarter Net Income of $52.3 Million, or $1.45 Per Diluted Share -
- Committed to Further Enhancing Financial Capacity and Flexibility -
- Suspends 2020 Outlook and Share Repurchase Program -
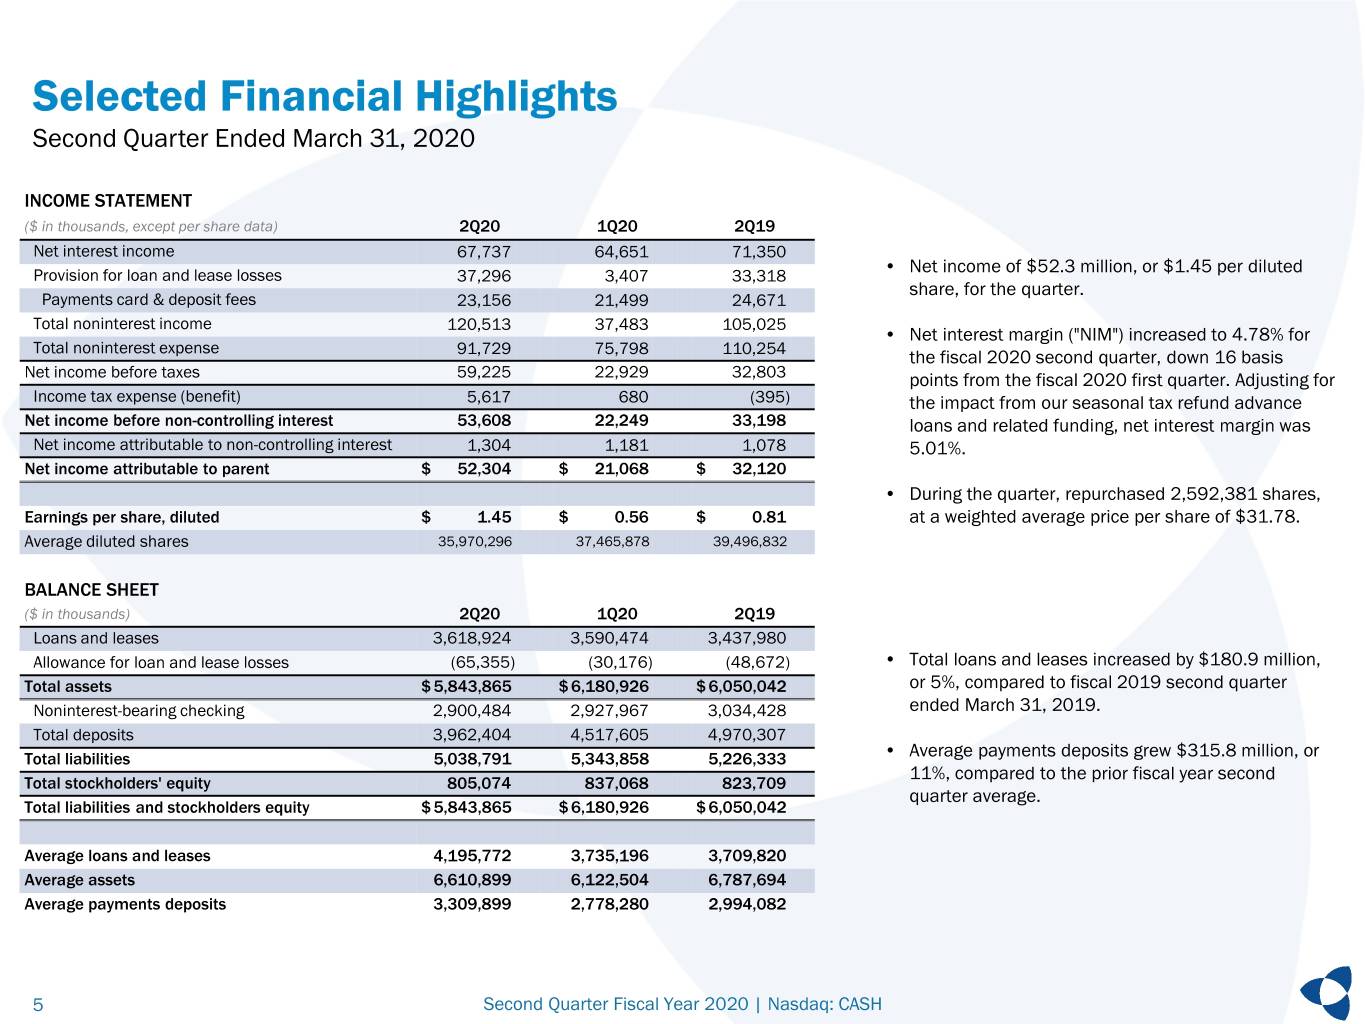
Sioux Falls, S.D., April 22, 2020 (GLOBE NEWSWIRE) -- Meta Financial Group, Inc.® (Nasdaq: CASH) (“Meta” or the “Company”) reported net income of $52.3 million, or $1.45 per diluted share, for the three months ended March 31, 2020, compared to net income of $32.1 million, or $0.81 per diluted share, for the three months ended March 31, 2019.
“Our fiscal second quarter, which has in the past been driven by our high volume tax businesses, was met with unprecedented uncertainty and market volatility associated with the spread of COVID-19. Our priorities are the health and safety of our employees and preserving access to the financial products our customers need to make it through these difficult times”, said President and CEO Brad Hanson. “Meta proactively implemented its Pandemic Plan under its Business Continuity Program with minimal business disruption and a near seamless transition to a work from home environment. Our COVID-19 Crisis Command Center consisting of leadership and business continuity planning resources throughout the organization is coordinating extensive scenario planning focused on credit quality, regulatory capital, expense management, and viability of our partners and customers to ensure continuity of our business and financial stability under extreme circumstances related to COVID-19. Finally, I am thrilled with the engagement and productivity exhibited by our staff resulting in strong performance for the quarter and the ability to manage our businesses through and beyond this crisis.”
Business Developments
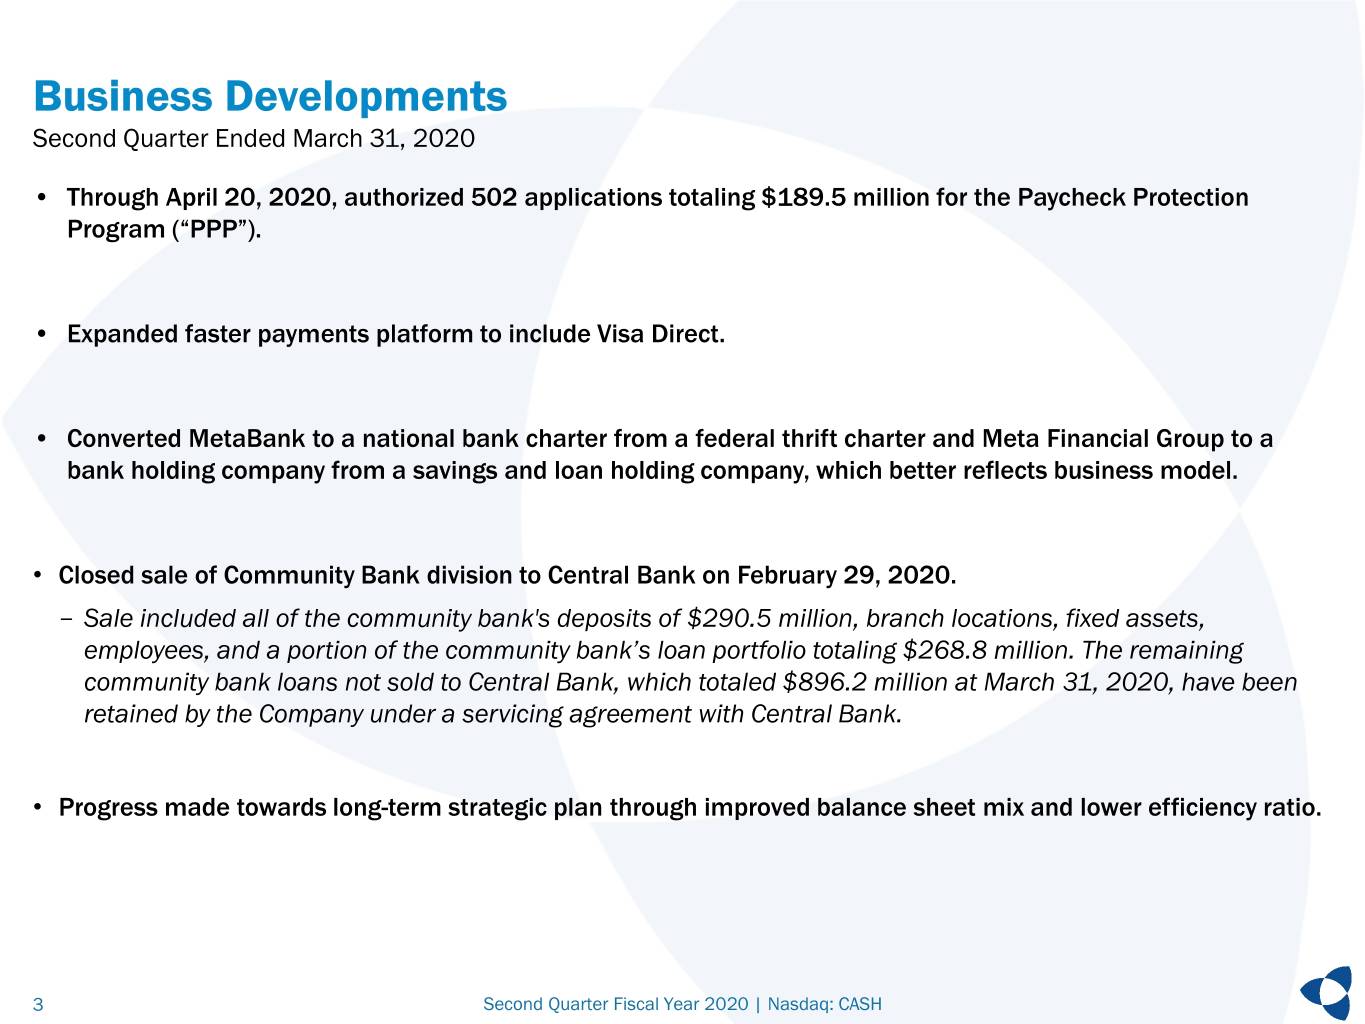
•Through April 20, 2020, the Company authorized 502 applications, totaling $189.5 million in loan requests for the Paycheck Protection Program.
•Effective April 1, 2020, MetaBank, N.A. ("MetaBank" or the "Bank") converted from a federal thrift charter to a national bank charter, and the Company converted from a savings and loan holding company to a bank holding company that has elected treatment as a financial holding company. The Bank now operates under the name "MetaBank, National Association." The Company and the Bank effected these conversions in order to more closely align the Bank's regulatory charter to its current and future strategy with respect to becoming a national business that provides innovative financial solutions to consumers and businesses in niche markets often overlooked by traditional banks. As a result of the bank conversion, the Bank is no longer subject to qualified thrift lending requirements.
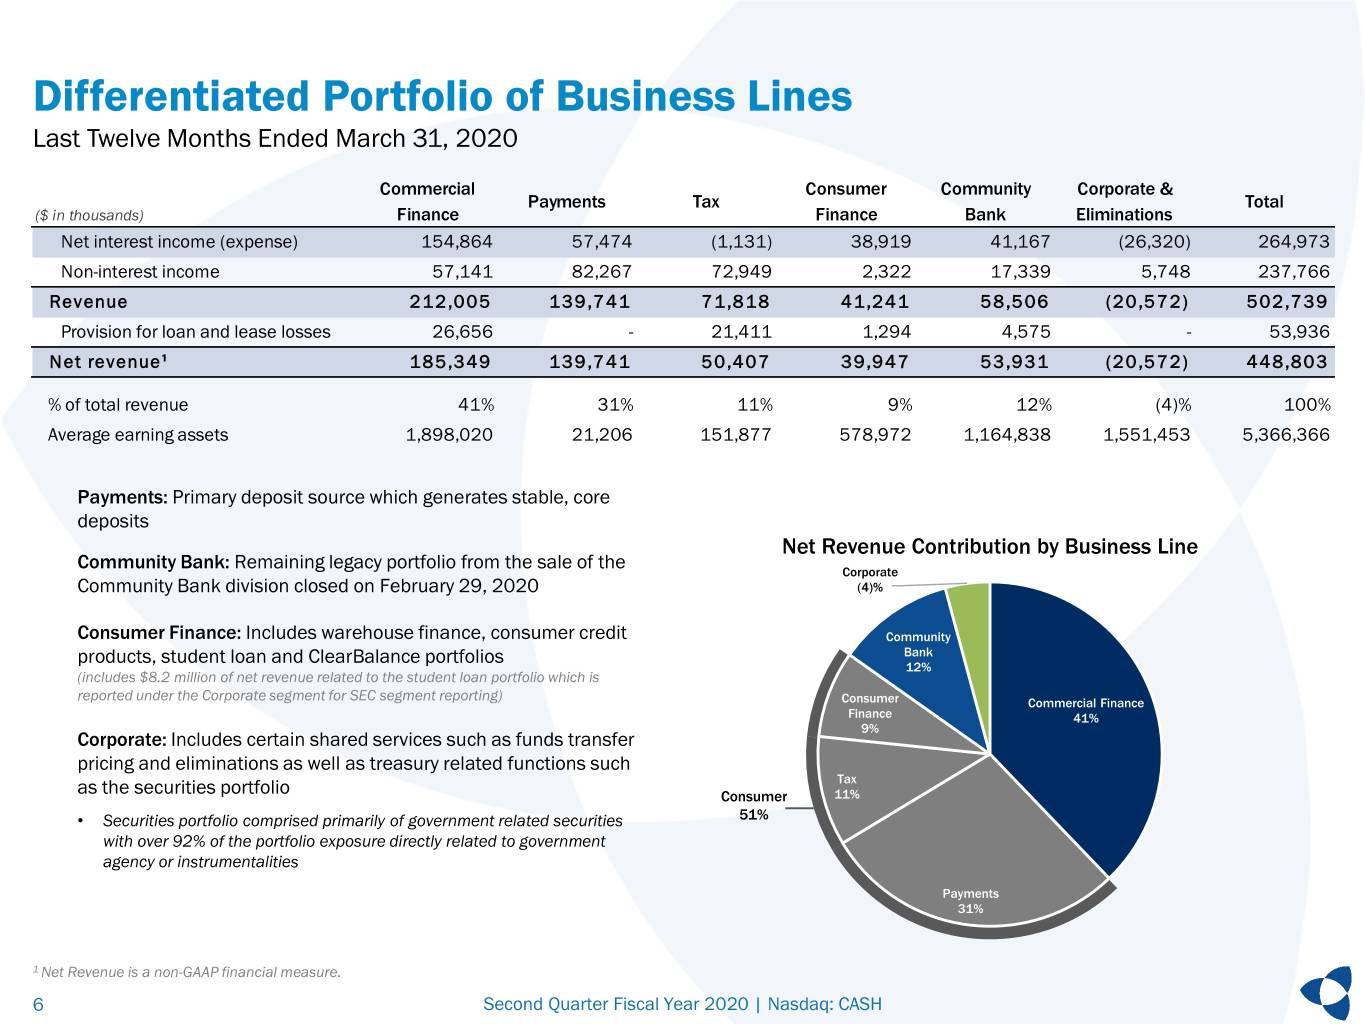
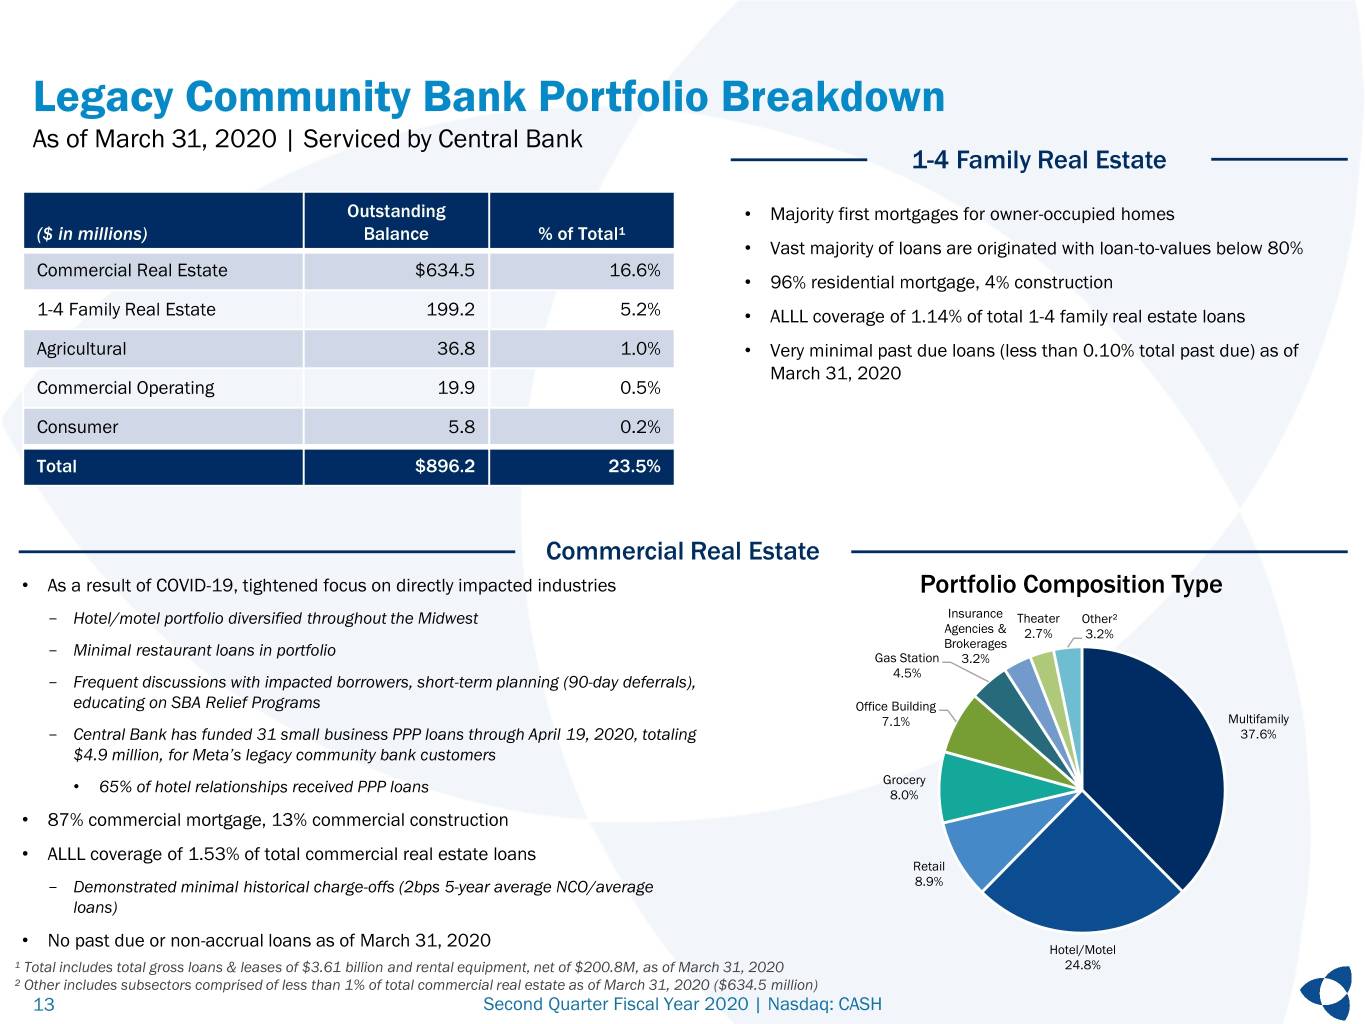
•The sale of MetaBank's Community Bank division to Central Bank closed on February 29, 2020 and included all of the Community Bank's deposits, branch locations, fixed assets, employees, and a portion of the Community Bank’s loan portfolio. The final deposit and loan balances included in the transaction totaled $290.5 million and $268.8 million, respectively. The remaining Community Bank loans not sold to Central Bank, which totaled $896.2 million at March 31, 2020, have been retained by the Company under a servicing agreement with Central Bank.
1
•MetaBank expanded its faster payments platform to include Visa Direct, Visa’s real-time push payments solution. Visa clients can use Visa Direct to enable businesses and payment service providers to make payments, disbursements and remittances rapidly, conveniently and cost-effectively, to more than a billion eligible debit and prepaid cards worldwide. As a leading issuer of payments services, the addition of Visa Direct builds on MetaBank’s faster payments platform that also includes MasterCard Send, ACH origination, wire transfers and more.
Financial Highlights for the 2020 Fiscal Second Quarter Ended March 31, 2020
•During the fiscal 2020 second quarter, the Company recognized a $19.3 million gain on divestiture of the Community Bank division, partially offset by one-time expenses related to the transaction of $1.0 million resulting in a pre-tax net gain from the transaction of $18.3 million, or $0.51 per share.
•Total gross loans and leases at March 31, 2020 increased $175.8 million, or 5%, to $3.61 billion, compared to March 31, 2019 and increased $27.5 million, or 1% when compared to December 31, 2019.
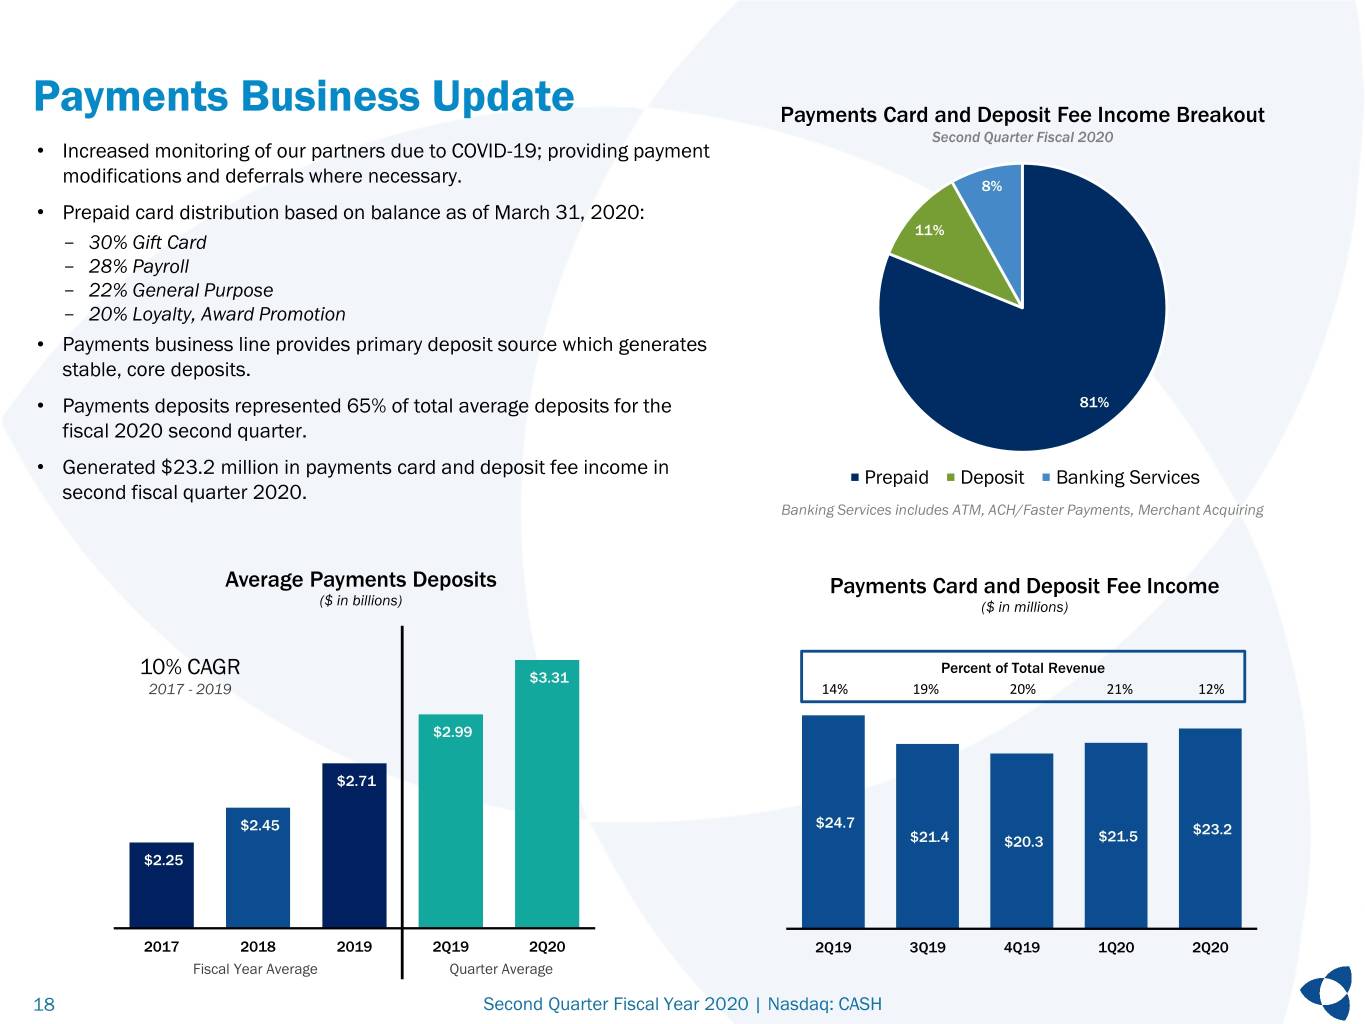
•Average deposits from the payments divisions for the fiscal 2020 second quarter increased nearly 11% to $3.31 billion when compared to the same quarter in fiscal 2019.
•Total revenue for the fiscal 2020 second quarter was $188.3 million, compared to $176.4 million for the same quarter in fiscal 2019, representing a 7% increase.
•Net interest income for the fiscal 2020 second quarter was $67.7 million, compared to $71.4 million in the comparable quarter in fiscal 2019.
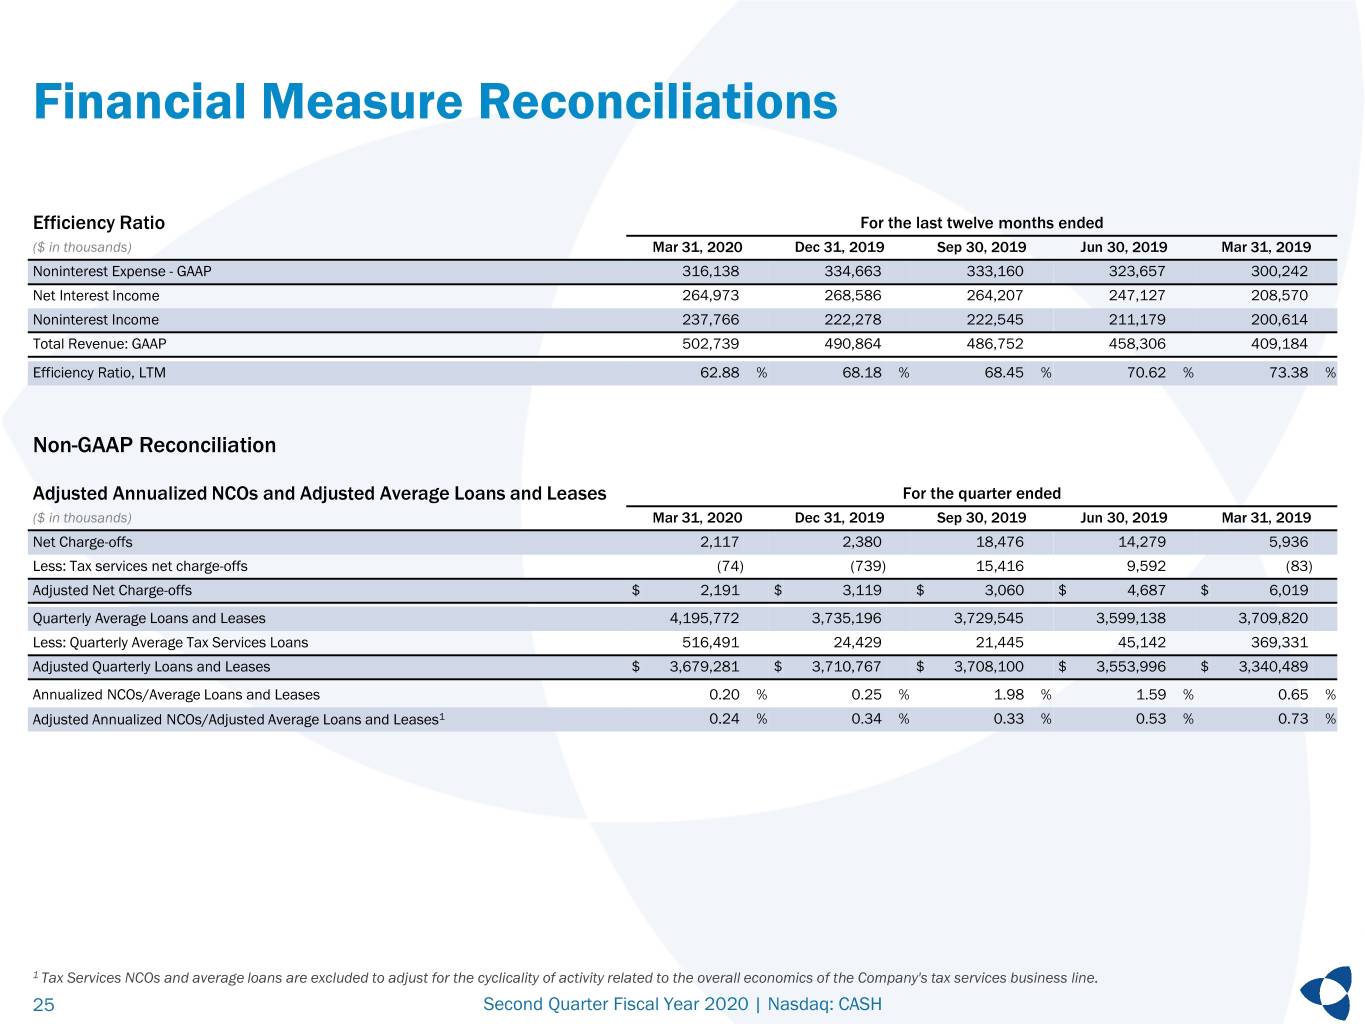
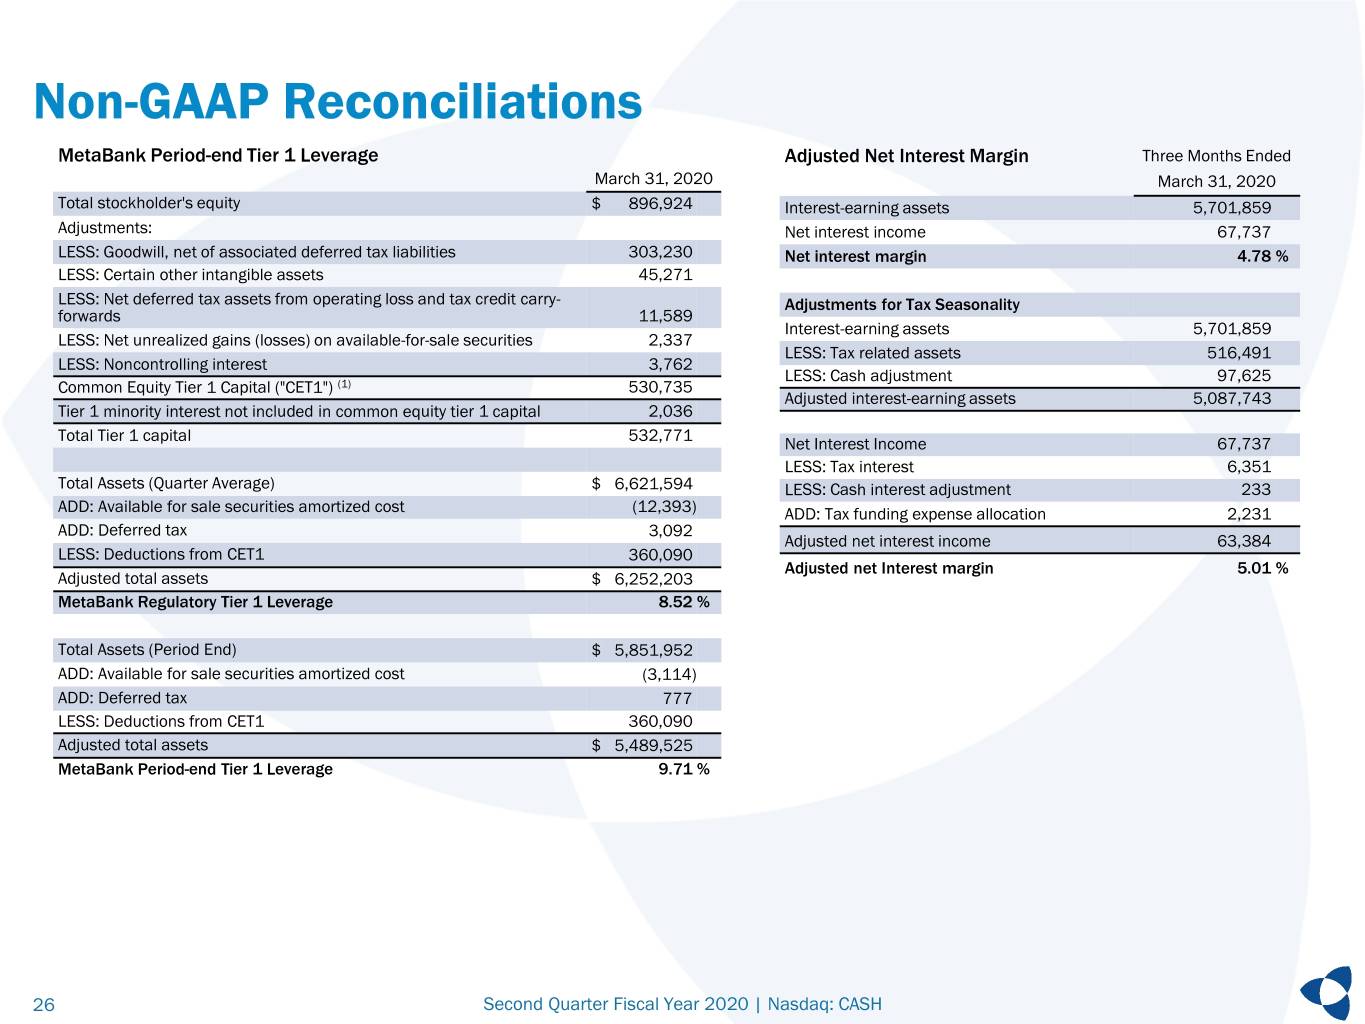
•Net interest margin ("NIM") decreased to 4.78% for the fiscal 2020 second quarter from 5.06% over the same period of the prior fiscal year, while the tax-equivalent net interest margin ("NIM, TE") decreased to 4.82% from 5.18% for that same period in fiscal 2019.
•During the quarter ended March 31, 2020, the Company repurchased 2,592,381 of its shares, at a weighted average price of $31.78, under its share repurchase program, which is authorized through December 31, 2022. The Company suspended repurchase activity under its share repurchase program in March. The Company had 34,607,962 shares outstanding at March 31, 2020.
COVID-19 Business Update
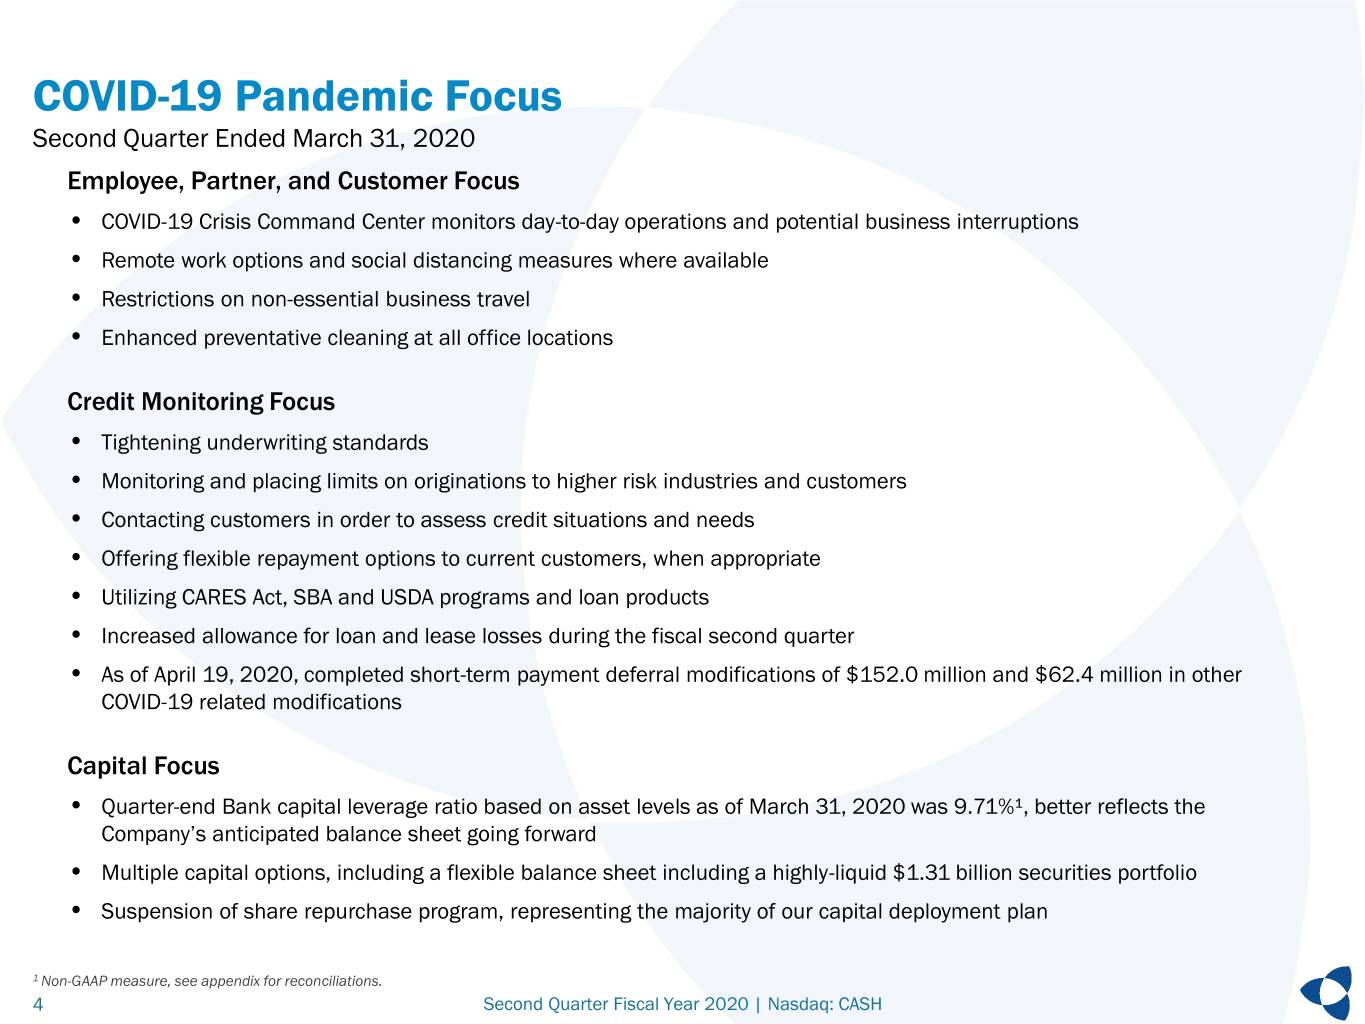
First and foremost, the Company is focused on the well-being of its employees, partners and customers. Preventative health measures were recently put in place to protect employees and customers including mandating remote work options and social distancing measures where possible, restricting non-essential business travel and enhancing preventative cleaning services at all office locations. The Company also enacted a COVID-19 Crisis Command Center consisting of leadership and business continuity planning resources throughout the organization to effectively monitor possible interruptions related to the pandemic and to ensure business continuity.
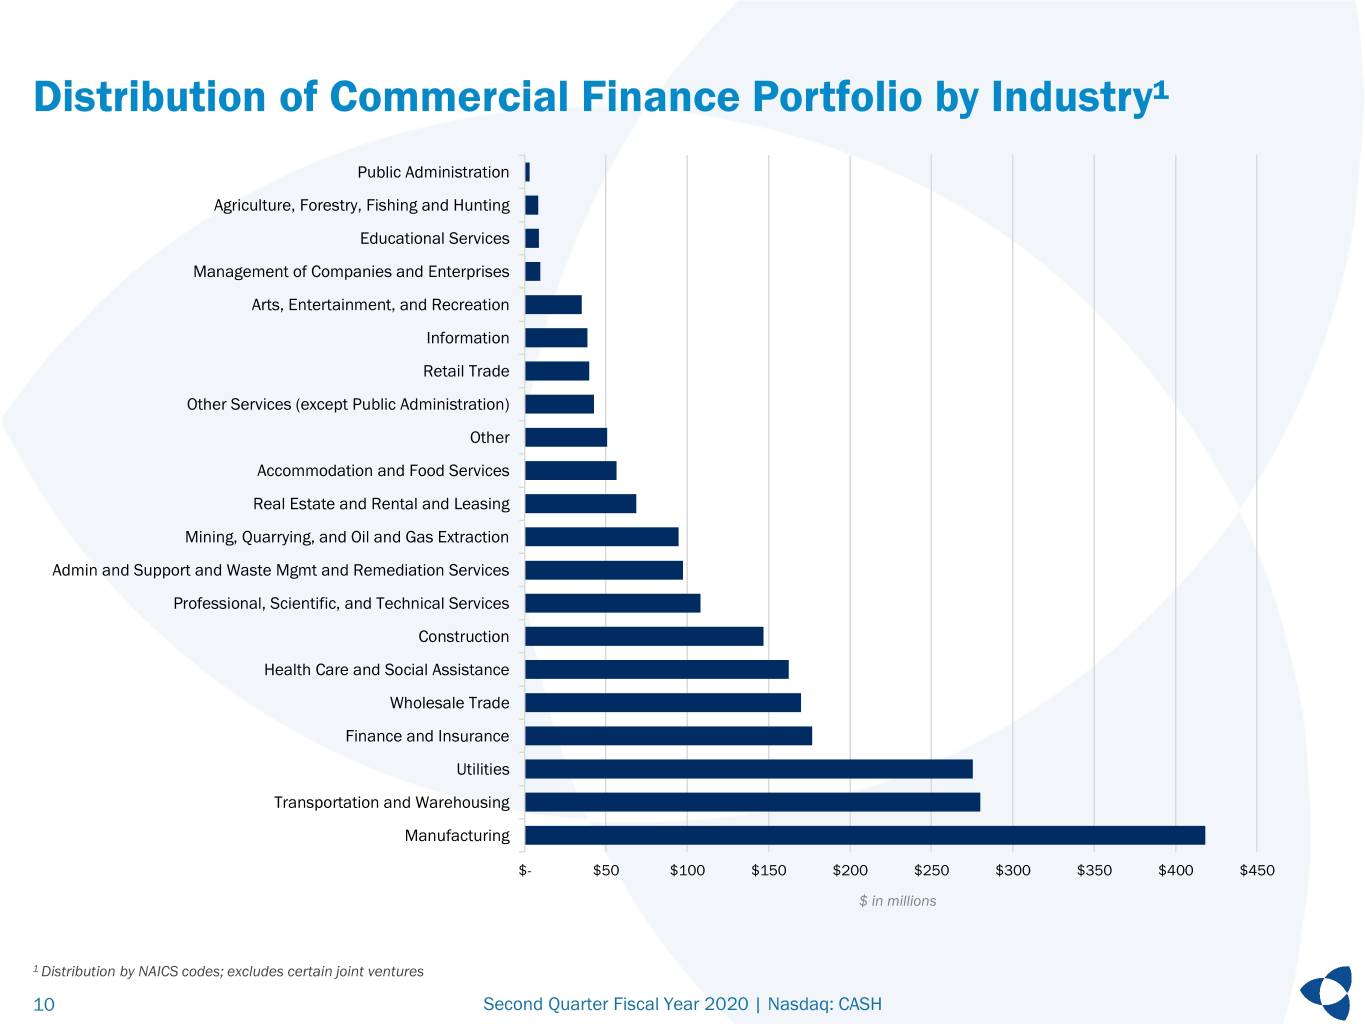
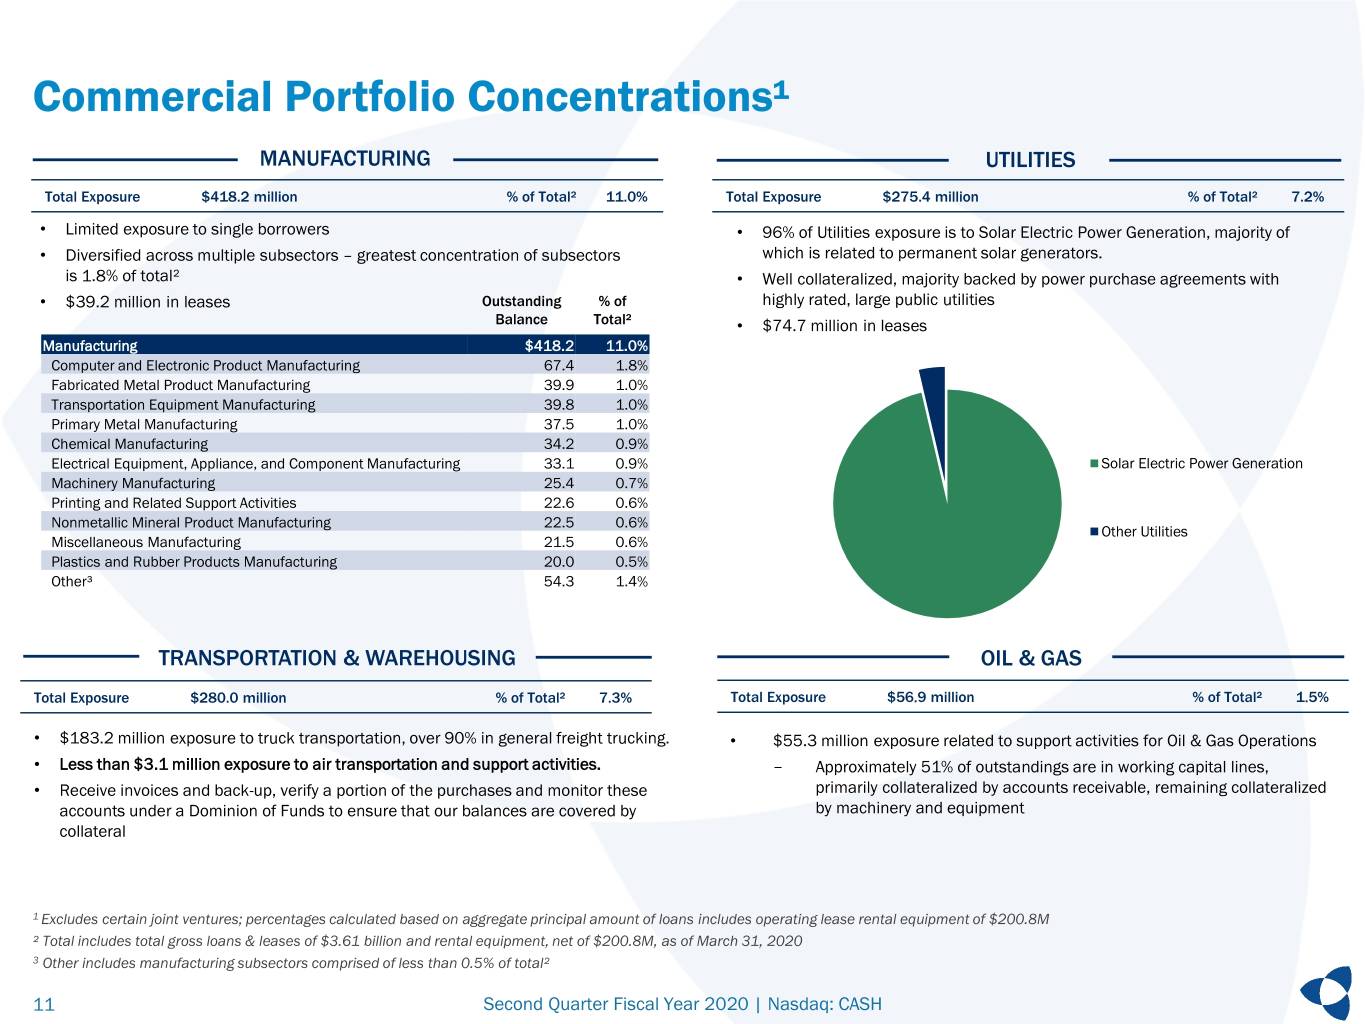
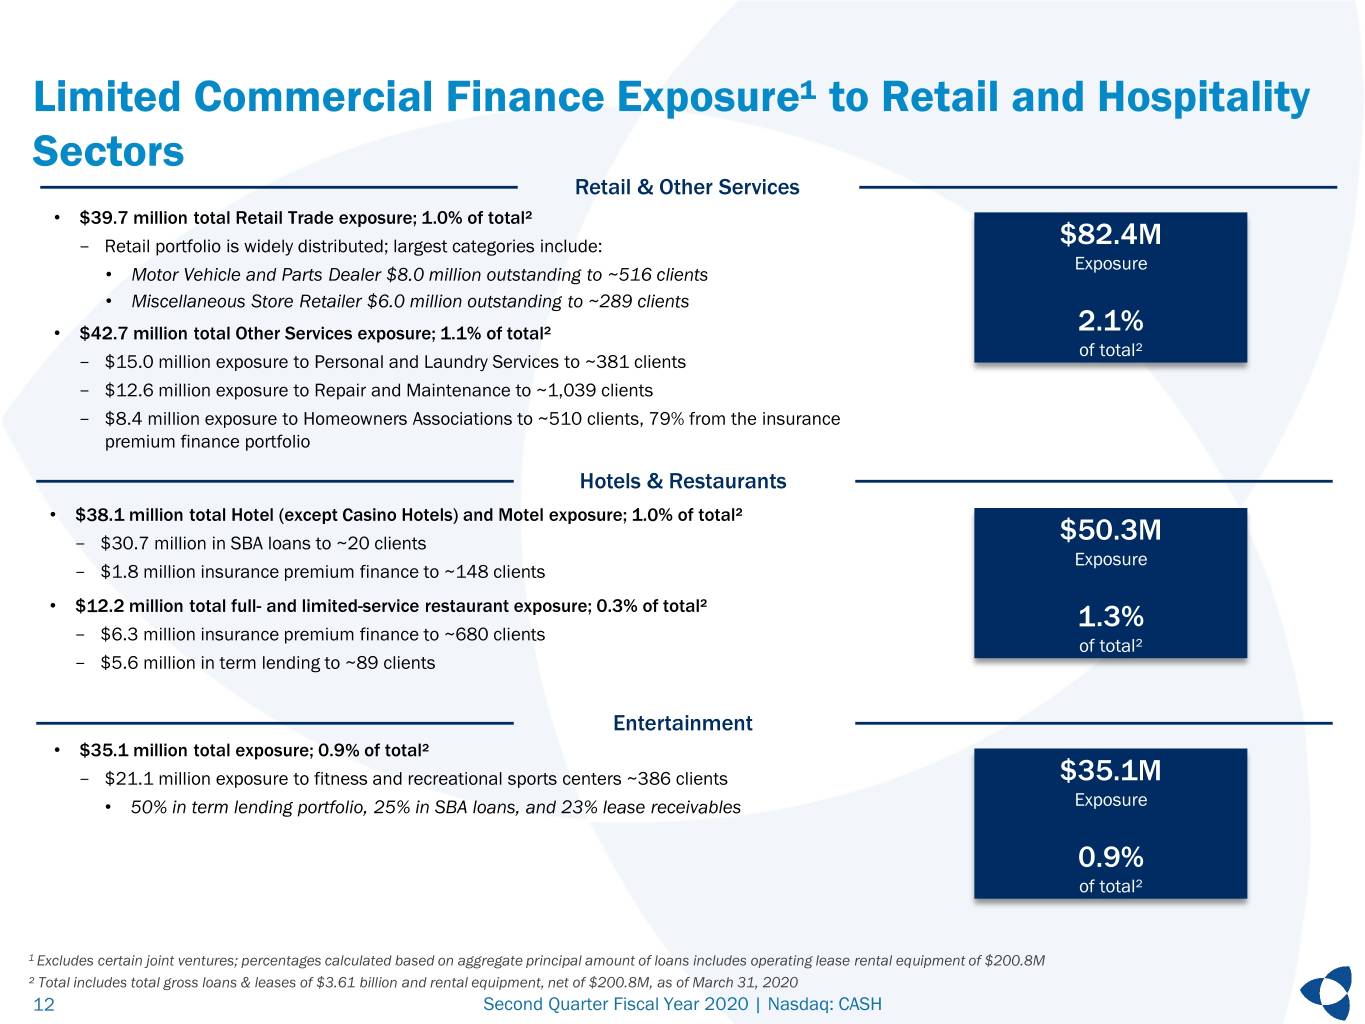
The Company's loan and lease portfolio is diversified by geography and industry. While asset quality remains strong at this time, the Company's focus is on actively monitoring and assisting customers. The following actions have been implemented:
•tighter underwriting standards;
•monitoring and placing limits on originations to industries and customers most adversely impacted by the COVID-19 pandemic, including, but not limited to transportation, travel, entertainment, and retail;
•contacting customers in order to assess their credit situations and needs;
•offering flexible repayment options to current customers, when appropriate; and
•utilizing CARES Act, SBA and USDA programs and loan products to help our small business clients.
The Company increased its allowance for loan and lease losses during the fiscal second quarter as a result of the emerging COVID-19 pandemic. The Company will continue to diligently monitor the allowance for loan and lease losses and adjust as necessary in future periods to maintain an appropriate and supportable level.
2
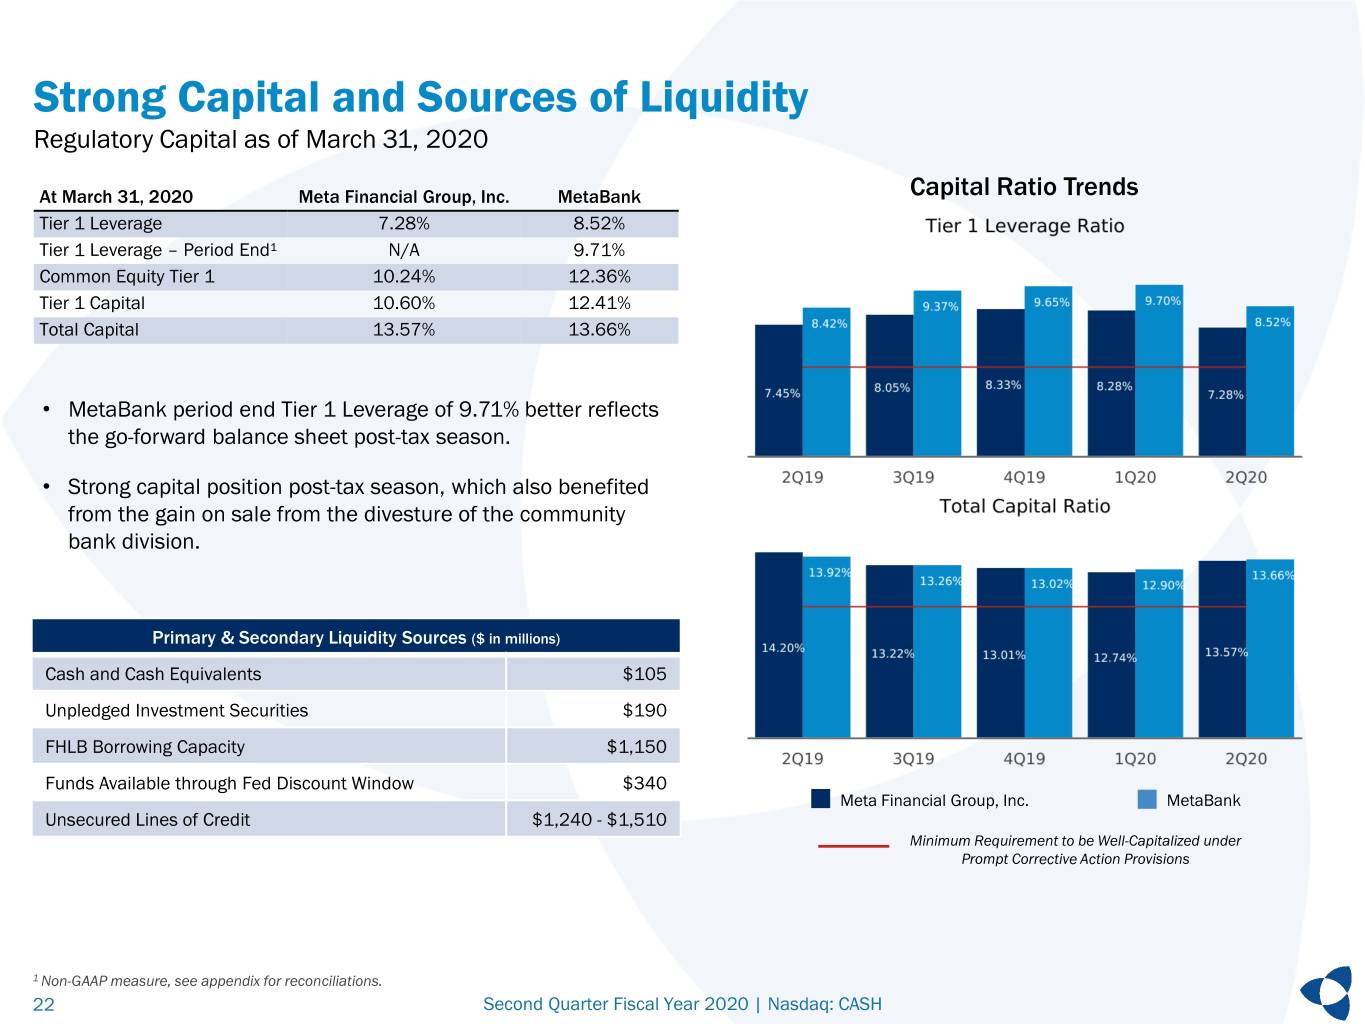
The Company's capital position remained strong as of March 31, 2020. As of March 31, 2020, the Bank's capital leverage ratio based on average assets was 8.52%, which is seasonally low due to higher asset levels driven by the tax services business. In addition, the Company has options available that can be used to effectively manage capital levels through these turbulent times, including a very strong and flexible balance sheet.
2020 Tax Season Update
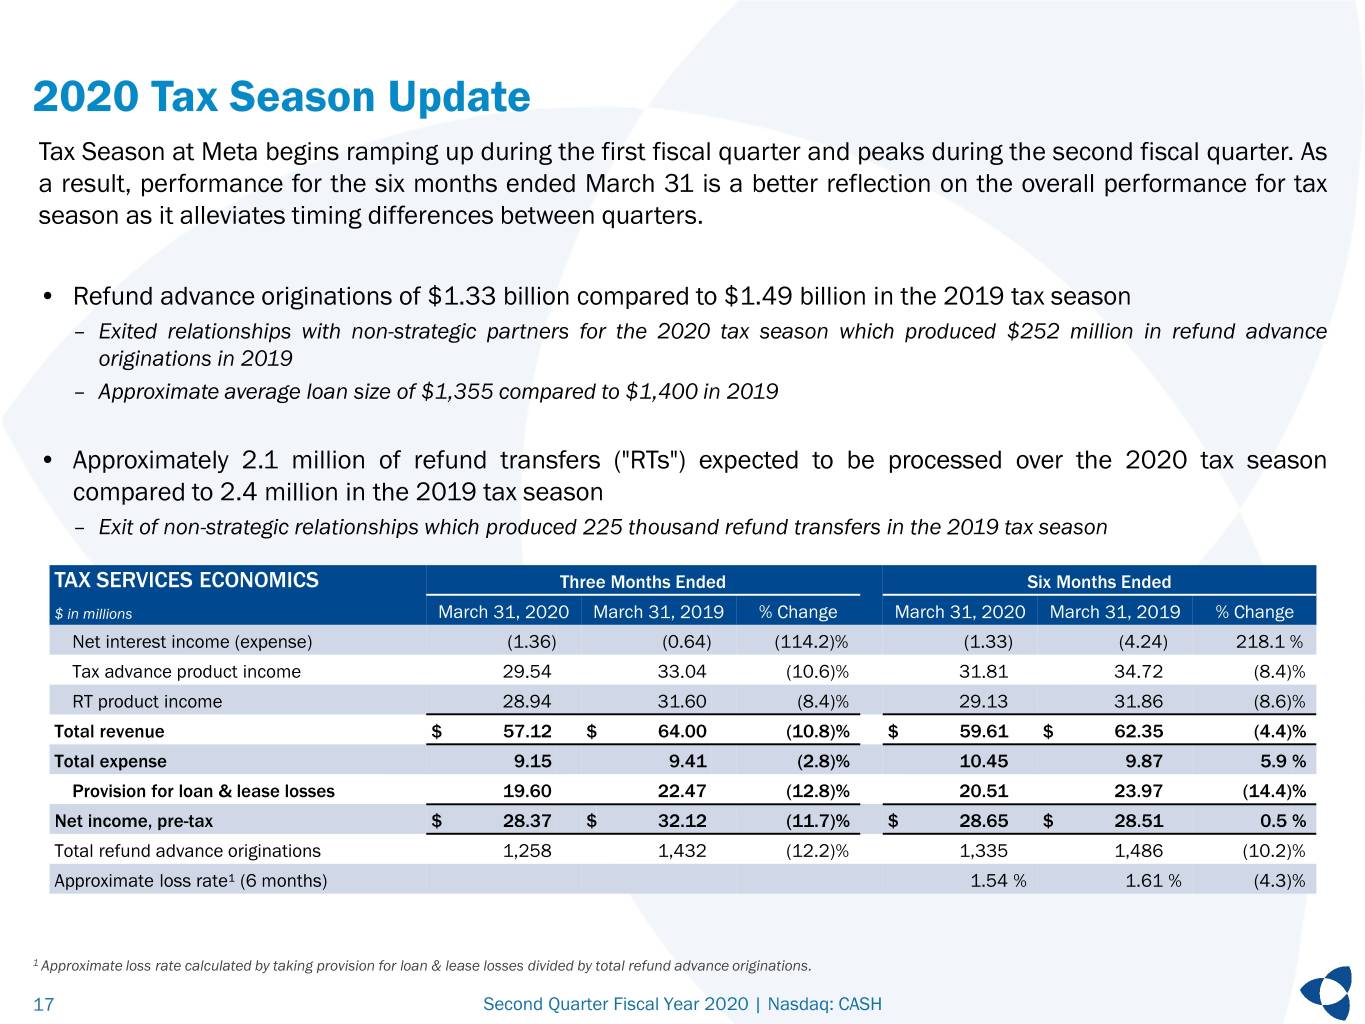
For the 2020 tax season, MetaBank originated $1.33 billion in refund advance loans compared to $1.49 billion during the 2019 tax season. Additionally, the Company expects to process approximately 2.1 million in refund transfers through its tax services division for the 2020 tax season, compared to the over 2.4 million in refund transfers processed during the prior year’s tax season. These decreases can primarily be attributed to the exit of non-strategic partners for the 2020 tax season.
During the second quarter of fiscal 2020, total tax services product revenue was $57.1 million, a decrease of 11% compared to the second quarter of fiscal 2019. The Company recorded $19.6 million in loan loss provision expense related to $1.26 billion in tax services loans originated during the fiscal second quarter of 2020. The Company recorded $22.5 million in loan loss provision expense related to $1.43 billion in tax services loans originated during the fiscal second quarter of 2019.
Tax services product income, net of losses and direct product expenses, increased 1% when comparing the first six months of fiscal 2020 to the same period of the prior fiscal year.
Net Interest Income
Net interest income for the fiscal 2020 second quarter was $67.7 million, a decrease of 5%, from the same quarter in fiscal 2019. The decrease was driven primarily by a decrease in investment securities balances along with lower yields realized on the loan and lease portfolios, partially offset by a reduction in total interest expense.
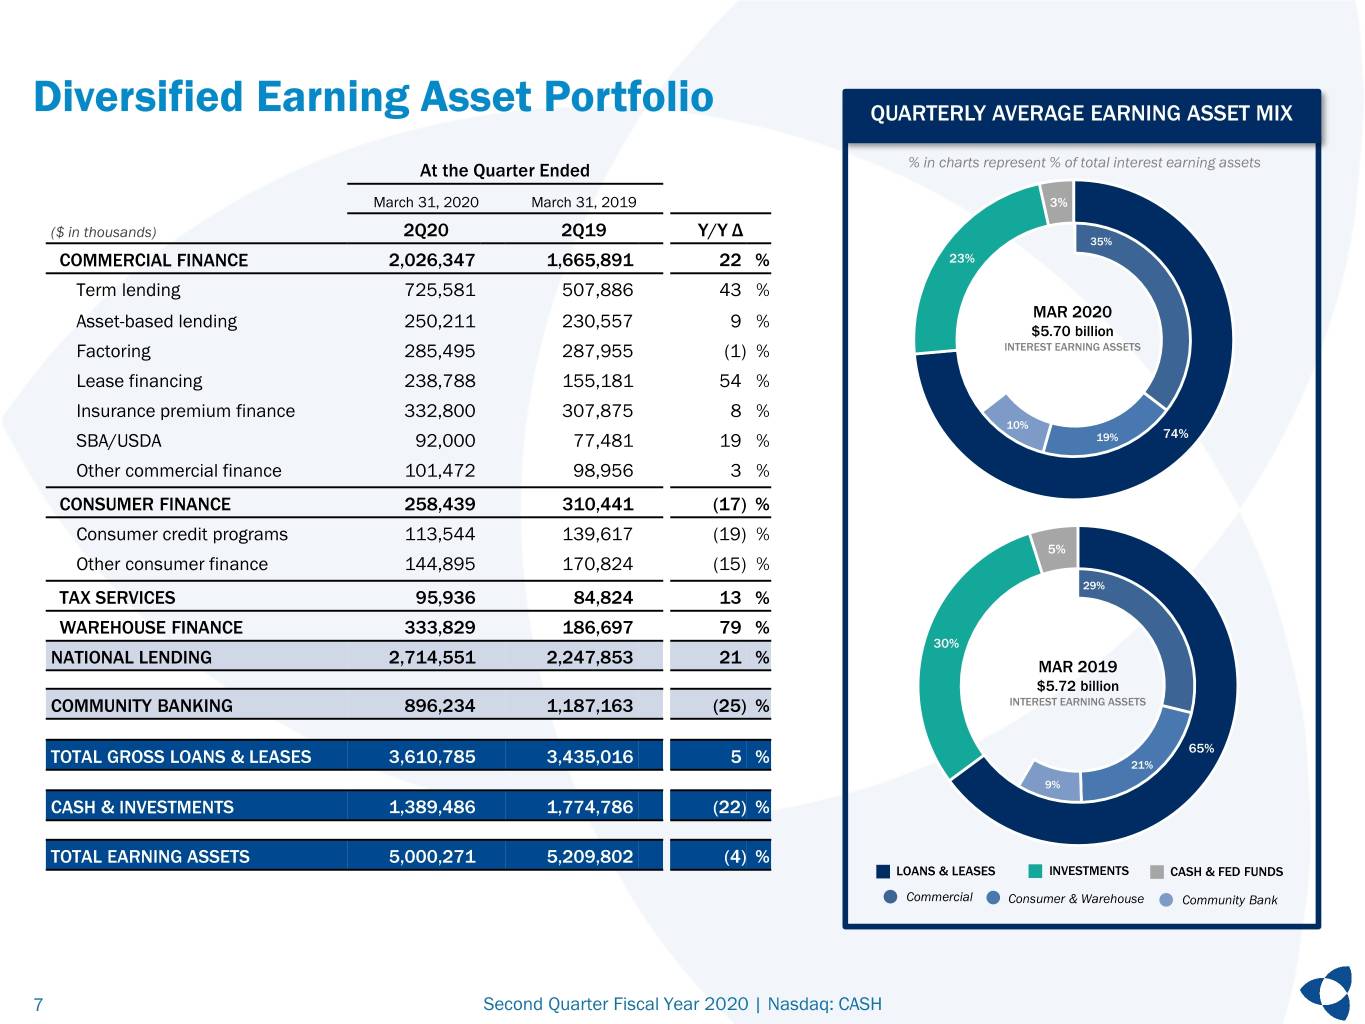
During the second quarter of fiscal year 2020, investment securities interest income decreased $5.7 million and loan and lease interest income decreased $3.2 million, when compared to the same quarter in fiscal 2019, while interest expense decreased $5.3 million over that same period. The quarterly average outstanding balance of loans and leases as a percentage of interest-earning assets for the quarter ended March 31, 2020 increased to 74%, from 65% for the quarter ended March 31, 2019, while the quarterly average balance of total investments as a percentage of interest-earning assets decreased to 23% from 30% over that same period. The Company’s average interest-earning assets for the fiscal 2020 second quarter decreased by $17.5 million, to $5.70 billion from the comparable quarter in fiscal 2019.
NIM decreased to 4.78% for the fiscal 2020 second quarter from 5.06% for the comparable quarter in fiscal 2019. The net effect of purchase accounting accretion contributed three basis points to NIM for the fiscal 2020 second quarter as compared to six basis points and 18 basis points for the quarters ended December 31, 2019 and March 31, 2019, respectively.
The overall reported tax-equivalent yield (“TEY”) on average earning asset yields decreased by 74 basis points to 5.64% for the fiscal 2020 second quarter compared to the fiscal 2019 second quarter, driven primarily by a lower interest rate environment. The fiscal 2020 second quarter TEY on the securities portfolio was 2.68% compared to 3.36% for the same period of the prior fiscal year.
The Company's cost of funds for all deposits and borrowings averaged 0.83% during the fiscal 2020 second quarter, compared to 1.17% for the fiscal 2019 second quarter. This decrease was primarily due to a decrease in overnight borrowings rates as well as an increase in the average balance of the Company's noninterest-bearing deposits. The Company's overall cost of deposits was 0.66% in the fiscal second quarter of 2020, compared to 1.06% in the same quarter of fiscal 2019.
3
Noninterest Income
Fiscal 2020 second quarter noninterest income was $120.5 million, compared to $105.0 million for the same period of the prior year. This increase was primarily due to a $19.3 million gain on divestiture of the Community Bank division during the fiscal 2020 second quarter. Increases in other income and rental income, partially offset by decreases in total tax product fee income and payments card and deposit fees, also contributed to the increase when comparing the fiscal 2020 second quarter to the same period of the prior year.
Noninterest Expense
Noninterest expense decreased 17% to $91.7 million for the fiscal 2020 second quarter, from $110.3 million for the same quarter of fiscal 2019. The decrease in noninterest expense when comparing the fiscal 2020 second quarter to the same period of the prior fiscal year was primarily driven by decreases in compensation and benefits expense, impairment expense, and intangible amortization expense, partially offset by increases in operating lease equipment depreciation, legal and consulting expense, and other expense. The Company recognized $1.0 million of one-time noninterest expenses related to the Community Bank division divestiture during the fiscal second quarter of 2020. These expenses were primarily within legal and consulting expense and other expense.
Income Tax Expense
The Company recorded income tax expense of $5.6 million, representing an effective tax rate of 9.48%, for the fiscal 2020 second quarter, compared to an income tax benefit of $0.4 million, representing an effective tax rate of (1.20)%, for the fiscal 2019 second quarter. The recorded income tax expense during the current quarter was due to an increase in net income before tax, as well as less investment tax credits recognized ratably when compared to the prior year quarter.
The Company originated $17.6 million in solar leases during the fiscal 2020 second quarter and did not originate any solar leases during the fiscal 2019 second quarter. Investment tax credits related to solar leases are recognized ratably based on income throughout each fiscal year. The timing and impact of future solar tax credits are expected to vary from period to period, and Meta intends to undertake only those tax credit opportunities that meet the Company's underwriting and return criteria.
4
Investments, Loans and Leases
| March 31, 2020 | December 31, 2019 | September 30, 2019 | June 30, 2019 | March 31, 2019 | |||||||||||||||||||||||||
| Total investments | $ | 1,310,476 | $ | 1,337,840 | $ | 1,407,257 | $ | 1,502,640 | $ | 1,649,754 | |||||||||||||||||||
| Loans held for sale | |||||||||||||||||||||||||||||
| Consumer credit products | — | — | 122,299 | 45,582 | 42,342 | ||||||||||||||||||||||||
| SBA/USDA | 13,610 | 13,883 | 26,478 | 17,257 | 17,403 | ||||||||||||||||||||||||
Community Bank(1) | — | 250,383 | — | — | — | ||||||||||||||||||||||||
| Total loans held for sale | 13,610 | 264,266 | 148,777 | 62,839 | 59,745 | ||||||||||||||||||||||||
| National Lending | |||||||||||||||||||||||||||||
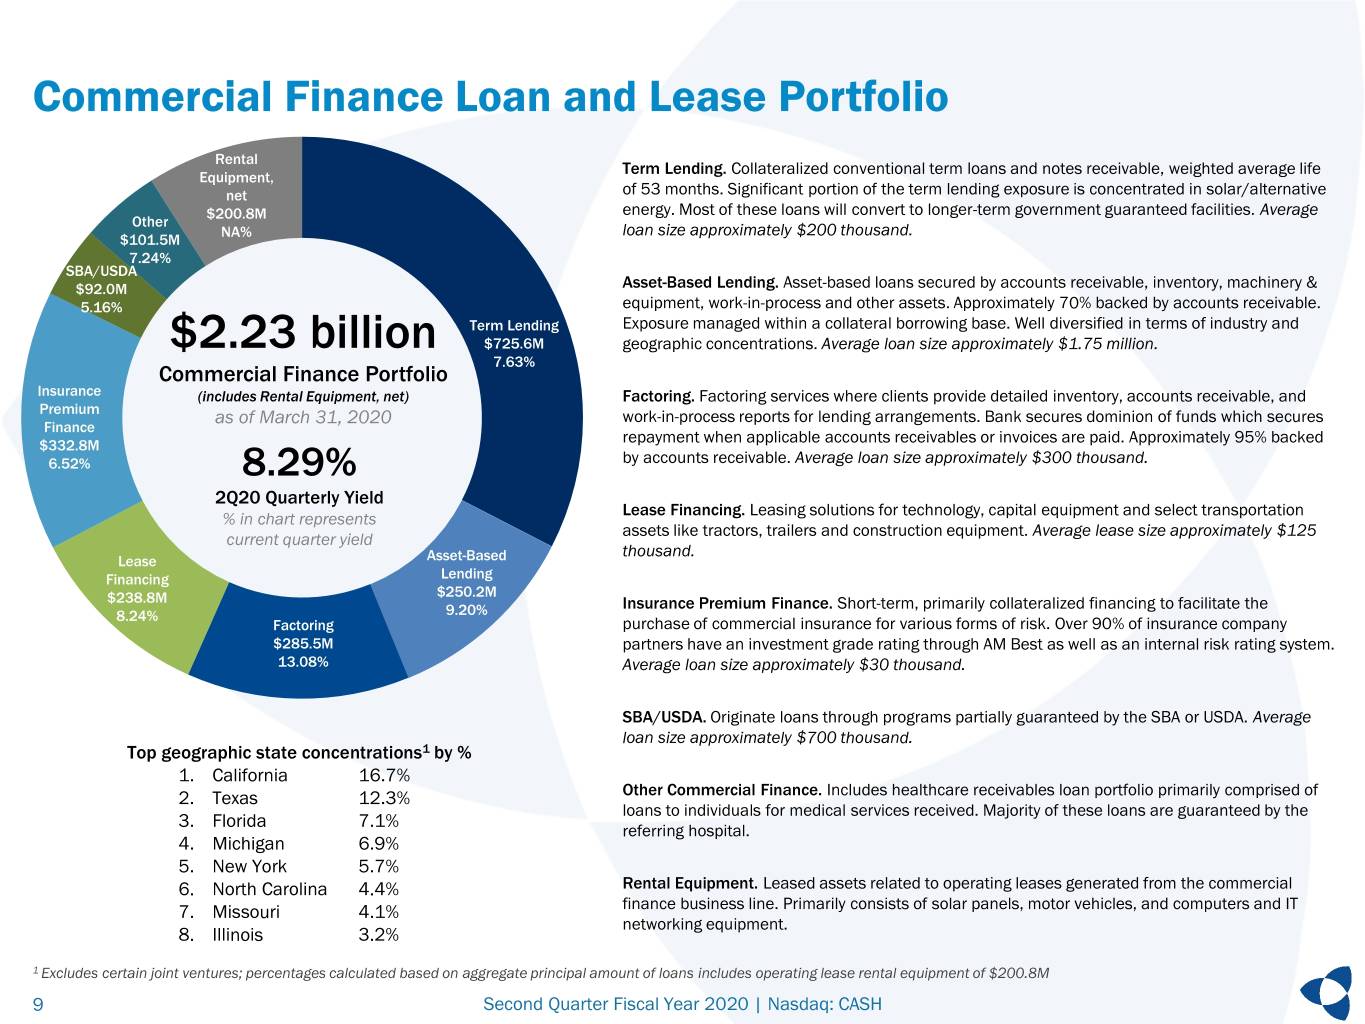
Term lending(2) | 725,581 | 695,347 | 641,742 | 562,557 | 507,886 | ||||||||||||||||||||||||
Asset based lending(2) | 250,211 | 250,633 | 250,465 | 229,573 | 230,557 | ||||||||||||||||||||||||
| Factoring | 285,495 | 285,776 | 296,507 | 320,344 | 287,955 | ||||||||||||||||||||||||
Lease financing(2) | 238,788 | 223,715 | 177,915 | 165,136 | 155,181 | ||||||||||||||||||||||||
| Insurance premium finance | 332,800 | 349,299 | 361,105 | 358,772 | 307,875 | ||||||||||||||||||||||||
| SBA/USDA | 92,000 | 90,269 | 88,831 | 99,791 | 77,481 | ||||||||||||||||||||||||
| Other commercial finance | 101,472 | 99,617 | 99,665 | 99,677 | 98,956 | ||||||||||||||||||||||||
| Commercial Finance | 2,026,347 | 1,994,656 | 1,916,230 | 1,835,850 | 1,665,891 | ||||||||||||||||||||||||
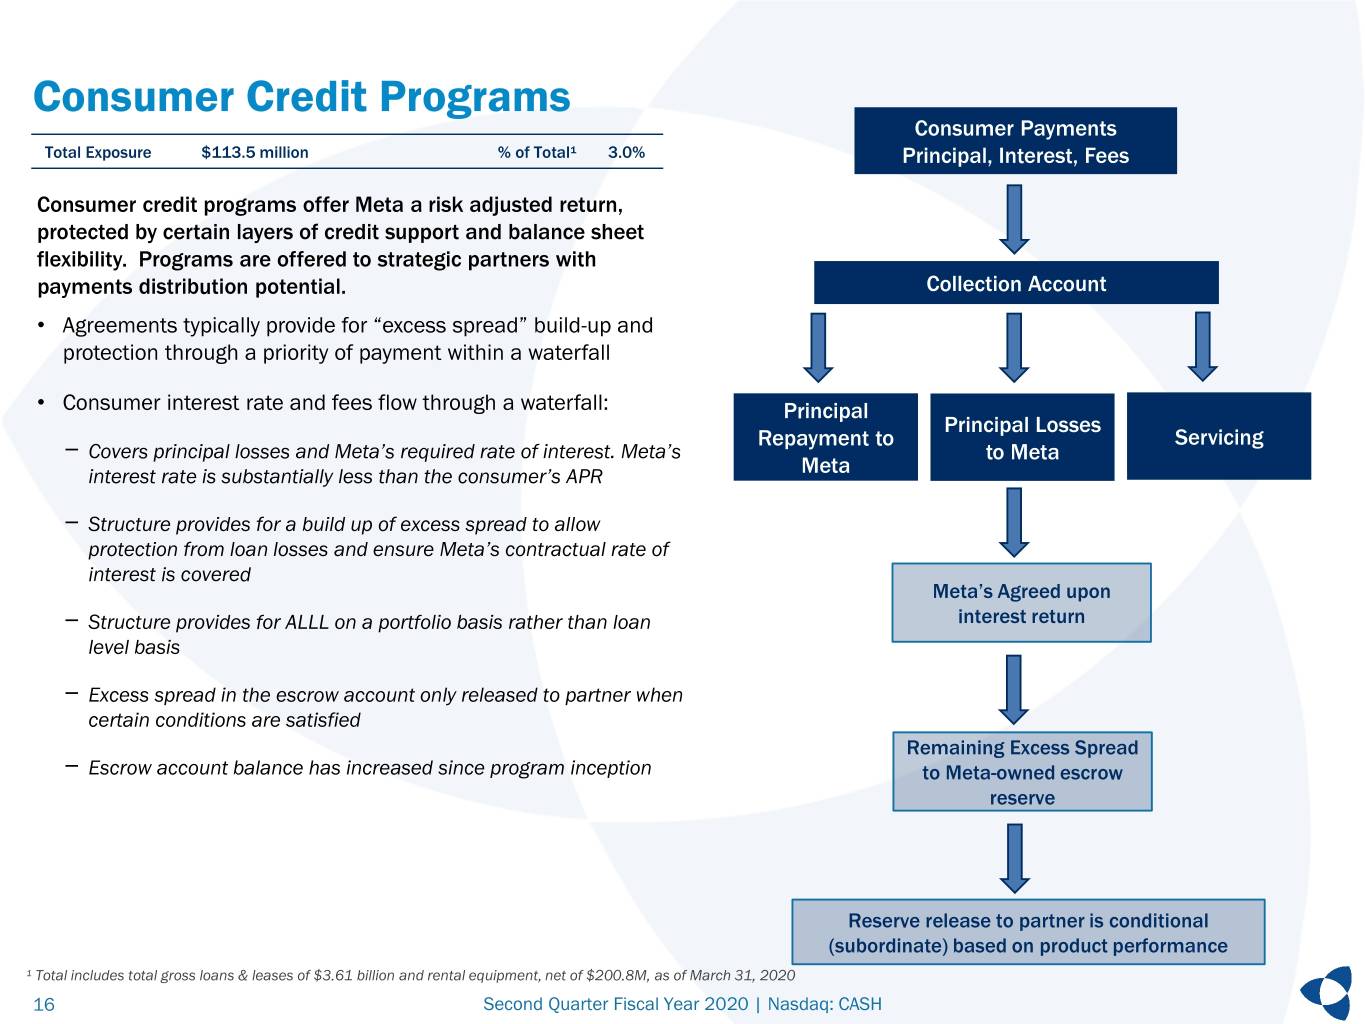
| Consumer credit products | 113,544 | 115,843 | 106,794 | 155,539 | 139,617 | ||||||||||||||||||||||||
| Other consumer finance | 144,895 | 154,772 | 161,404 | 164,727 | 170,824 | ||||||||||||||||||||||||
| Consumer Finance | 258,439 | 270,615 | 268,198 | 320,266 | 310,441 | ||||||||||||||||||||||||
| Tax Services | 95,936 | 101,739 | 2,240 | 24,410 | 84,824 | ||||||||||||||||||||||||
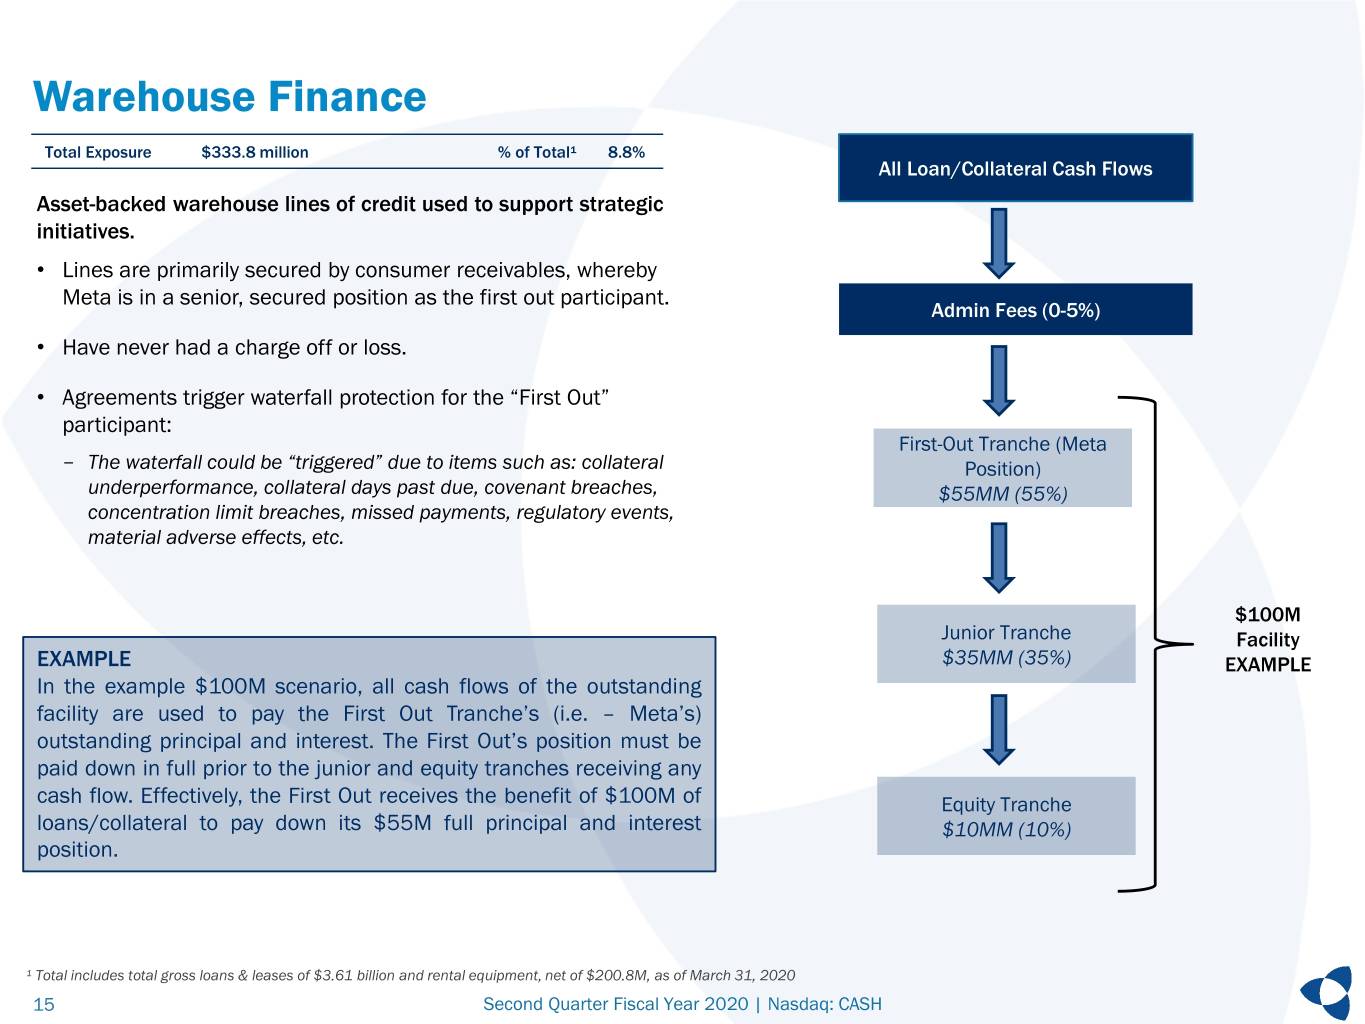
| Warehouse Finance | 333,829 | 272,522 | 262,924 | 250,003 | 186,697 | ||||||||||||||||||||||||
| Total National Lending loans and leases | 2,714,551 | 2,639,532 | 2,449,592 | 2,430,529 | 2,247,853 | ||||||||||||||||||||||||
| Community Banking | |||||||||||||||||||||||||||||
| Commercial real estate and operating | 654,429 | 682,399 | 883,932 | 877,412 | 869,917 | ||||||||||||||||||||||||
| Consumer one-to-four family real estate and other | 205,046 | 220,588 | 259,425 | 256,853 | 257,079 | ||||||||||||||||||||||||
| Agricultural real estate and operating | 36,759 | 40,778 | 58,464 | 61,169 | 60,167 | ||||||||||||||||||||||||
| Total Community Banking loans | 896,234 | 943,765 | 1,201,821 | 1,195,434 | 1,187,163 | ||||||||||||||||||||||||
| Total gross loans and leases | 3,610,785 | 3,583,297 | 3,651,413 | 3,625,963 | 3,435,016 | ||||||||||||||||||||||||
| Allowance for loan and lease losses | (65,355) | (30,176) | (29,149) | (43,505) | (48,672) | ||||||||||||||||||||||||
| Net deferred loan and lease origination fees | 8,139 | 7,177 | 7,434 | 5,068 | 2,964 | ||||||||||||||||||||||||
Total loans and leases, net of allowance(3) | $ | 3,553,569 | $ | 3,560,298 | $ | 3,629,698 | $ | 3,587,526 | $ | 3,389,308 | |||||||||||||||||||
(1) The December 31, 2019 balance included approximately $197.5 million of commercial real estate and operating loans, $40.4 million of consumer one-to-four family real estate and other loans, and $12.7 million of agricultural real estate and operating loans.
(2) The Company updated the presentation of its loan and lease table beginning in the fiscal 2020 first quarter. The new presentation included a new category called term lending. Certain balances previously included in the asset based lending and lease financing categories were reclassified into the new term lending category during the fiscal 2020 first quarter. Prior period balances have been conformed to the new presentation.
(3) As of March 31, 2020, the remaining balance of acquired loans and leases from the acquisition of Crestmark Bancorp, Inc. ("Crestmark") and its bank subsidiary, Crestmark Bank (the "Crestmark Acquisition") was $236.6 million and the remaining balances of the credit and interest rate mark discounts related to the acquired loans and leases held for investment were $4.3 million and $2.7 million, respectively, while the remaining balance of the interest rate mark premium related to the acquired loans held for sale was $0.4 million. On August 1, 2018, the Company acquired loans and leases from the Crestmark Acquisition totaling $1.06 billion and recorded related credit and interest rate mark discounts of $12.3 million and $6.0 million, respectively.
The Company continued to utilize cash flow from its amortizing securities portfolio to fund loan and lease growth. Investment securities totaled $1.31 billion at March 31, 2020, as compared to $1.65 billion at March 31, 2019.
On February 29, 2019, the Company sold $268.8 million of community bank loan balances, as part of the Community Bank division sale to Central Bank, reducing the outstanding balance to $896.2 million as of March 31, 2020.
Total gross loans and leases increased $175.8 million, or 5%, to $3.61 billion at March 31, 2020, from $3.44 billion at March 31, 2019, which was primarily attributable to growth in the commercial finance and warehouse finance portfolios, partially offset by the aforementioned sale of community bank loan balances.
5
At March 31, 2020, commercial finance loans, which comprised 56% of the Company's gross loan and lease portfolio, totaled $2.03 billion, reflecting growth of $31.7 million, or 2%, from December 31, 2019. Warehouse finance loans totaled $333.8 million at March 31, 2020, a 22% increase from December 31, 2019.
Asset Quality
The Company’s allowance for loan and lease losses was $65.4 million at March 31, 2020, compared to $48.7 million at March 31, 2019, driven primarily by increases in the allowance of $16.7 million in commercial finance and $4.6 million in the community banking portfolio, partially offset by decreases in the tax services and consumer lending portfolios of $2.8 million and $1.9 million, respectively.
The following table presents the Company's allowance for loan and lease losses as a percentage of its total loans and leases.
| As of the Period Ended | ||||||||||||||
| (Unaudited) | March 31, 2020 | December 31, 2019 | March 31, 2019 | |||||||||||
| Commercial finance | 1.28 | % | 0.80 | % | 0.55 | % | ||||||||
| Consumer finance | 1.74 | % | 2.22 | % | 2.08 | % | ||||||||
| Tax services | 22.22 | % | 1.62 | % | 28.42 | % | ||||||||
| Warehouse finance | 0.10 | % | 0.10 | % | 0.10 | % | ||||||||
| National Lending | 1.92 | % | 0.90 | % | 1.77 | % | ||||||||
| Community Bank | 1.49 | % | 0.68 | % | 0.74 | % | ||||||||
| Total loans and leases | 1.81 | % | 0.84 | % | 1.42 | % | ||||||||
The Company assessed each of its loan and lease portfolios during the fiscal second quarter and increased its allowance for loan and lease losses as a percentage of total loans and leases in the commercial finance and community bank portfolios as a result of the emerging COVID-19 pandemic. The reduction in consumer finance was largely driven by lower trending charge-off rates on student loans mainly serving students in the medical community. Tax services coverage rates were driven only by typical seasonal activity and are not expected to be materially impacted by COVID-19 as the tax lending season is substantially complete. Warehouse finance remained largely unchanged due to the structure of the credit protections in place. The Company expects to continue to diligently monitor the allowance for loan and lease losses and adjust as necessary in future periods to maintain an appropriate and supportable level. When adding the $4.3 million balance of the credit mark to the allowance for loan and lease losses, the commercial finance coverage ratio increases to 1.49% and the total loans and leases coverage ratio increases to 1.93%, as of March 31, 2020.
Activity in the allowance for loan and lease losses for the periods presented were as follows.
| (Unaudited) | Three Months Ended | Six Months Ended | |||||||||||||||||||||||||||
| March 31, 2020 | December 31, 2019 | March 31, 2019 | March 31, 2020 | March 31, 2019 | |||||||||||||||||||||||||
| (Dollars in thousands) | |||||||||||||||||||||||||||||
| Beginning balance | $ | 30,176 | $ | 29,149 | $ | 21,290 | $ | 29,149 | $ | 13,040 | |||||||||||||||||||
| Provision - tax services loans | 19,596 | 911 | 22,473 | 20,507 | 23,969 | ||||||||||||||||||||||||
| Provision - all other loans and leases | 17,700 | 2,496 | 10,845 | 20,196 | 18,448 | ||||||||||||||||||||||||
| Charge-offs - tax services loans | — | — | (1) | — | (43) | ||||||||||||||||||||||||
| Charge-offs - all other loans and leases | (3,187) | (3,918) | (6,522) | (7,105) | (9,283) | ||||||||||||||||||||||||
| Recoveries - tax services loans | 74 | 739 | 84 | 813 | 176 | ||||||||||||||||||||||||
| Recoveries - all other loans and leases | 996 | 799 | 503 | 1,795 | 2,365 | ||||||||||||||||||||||||
| Ending balance | $ | 65,355 | $ | 30,176 | $ | 48,672 | $ | 65,355 | $ | 48,672 | |||||||||||||||||||
6
Provision for loan and lease losses was $37.3 million for the quarter ended March 31, 2020, compared to $33.3 million for the comparable period in the prior fiscal year. The increase in provision was primarily due to $15.8 million in additional allowance for the Company's loan and lease portfolio, specifically for the commercial finance portfolio and the remaining community bank portfolio, associated with the emerging COVID-19 pandemic. Management believes that given the structure of the credit protections put in place for the consumer and warehouse finance lending lines, the coverage ratio for those loan portfolios was adequate as of March 31, 2020. Net charge-offs were $2.1 million for the quarter ended March 31, 2020 compared to $5.9 million for the quarter ended March 31, 2019. The overall decrease in total net charge-offs from the comparable quarter of the prior fiscal year was primarily within the commercial finance and consumer finance portfolios.
The Company's past due loans and leases were as follows for the periods presented.
| As of March 31, 2020 | Accruing and Nonaccruing Loans and Leases | Nonperforming Loans and Leases | |||||||||||||||||||||||||||||||||||||||||||||||||||
| (Dollars in Thousands) | 30-59 Days Past Due | 60-89 Days Past Due | > 89 Days Past Due | Total Past Due | Current | Total Loans and Leases Receivable | > 89 Days Past Due and Accruing | Non-accrual balance | Total | ||||||||||||||||||||||||||||||||||||||||||||
| Commercial finance | $ | 35,810 | $ | 7,487 | $ | 18,721 | $ | 62,018 | $ | 1,964,329 | $ | 2,026,347 | $ | 9,372 | $ | 16,024 | $ | 25,396 | |||||||||||||||||||||||||||||||||||
| Consumer finance | 1,781 | 1,078 | 1,345 | 4,204 | 254,235 | 258,439 | 1,345 | — | 1,345 | ||||||||||||||||||||||||||||||||||||||||||||
| Tax services | 668 | — | — | 668 | 95,268 | 95,936 | — | — | — | ||||||||||||||||||||||||||||||||||||||||||||
| Warehouse finance | — | — | — | — | 333,829 | 333,829 | — | — | — | ||||||||||||||||||||||||||||||||||||||||||||
| Total National Lending | 38,259 | 8,565 | 20,066 | 66,890 | 2,647,661 | 2,714,551 | 10,717 | 16,024 | 26,741 | ||||||||||||||||||||||||||||||||||||||||||||
| Total Community Banking | 1,012 | 2,735 | 4,723 | 8,470 | 887,764 | 896,234 | 2,905 | 1,818 | 4,723 | ||||||||||||||||||||||||||||||||||||||||||||
| Total loans and leases held for investment | $ | 39,271 | $ | 11,300 | $ | 24,789 | $ | 75,360 | $ | 3,535,425 | $ | 3,610,785 | $ | 13,622 | $ | 17,842 | $ | 31,464 | |||||||||||||||||||||||||||||||||||
| As of December 31, 2019 | Accruing and Nonaccruing Loans and Leases | Nonperforming Loans and Leases | |||||||||||||||||||||||||||||||||||||||||||||||||||
| (Dollars in Thousands) | 30-59 Days Past Due | 60-89 Days Past Due | > 89 Days Past Due | Total Past Due | Current | Total Loans and Leases Receivable | > 89 Days Past Due and Accruing | Non-accrual balance | Total | ||||||||||||||||||||||||||||||||||||||||||||
| Commercial finance | $ | 24,127 | $ | 4,642 | $ | 17,732 | $ | 46,501 | $ | 1,948,155 | $ | 1,994,656 | $ | 5,733 | $ | 16,593 | $ | 22,326 | |||||||||||||||||||||||||||||||||||
| Consumer finance | 2,295 | 1,234 | 1,648 | 5,177 | 265,438 | 270,615 | 1,648 | — | 1,648 | ||||||||||||||||||||||||||||||||||||||||||||
| Tax services | — | — | — | — | 101,739 | 101,739 | — | — | — | ||||||||||||||||||||||||||||||||||||||||||||
| Warehouse finance | — | — | — | — | 272,522 | 272,522 | — | — | — | ||||||||||||||||||||||||||||||||||||||||||||
| Total National Lending | 26,422 | 5,876 | 19,380 | 51,678 | 2,587,854 | 2,639,532 | 7,381 | 16,593 | 23,974 | ||||||||||||||||||||||||||||||||||||||||||||
| Total Community Banking | 376 | 1,612 | 9 | 1,997 | 941,768 | 943,765 | — | 9 | 9 | ||||||||||||||||||||||||||||||||||||||||||||
| Total loans and leases held for investment | $ | 26,798 | $ | 7,488 | $ | 19,389 | $ | 53,675 | $ | 3,529,622 | $ | 3,583,297 | $ | 7,381 | $ | 16,602 | $ | 23,983 | |||||||||||||||||||||||||||||||||||
The Company had not experienced significant asset deterioration as of March 31, 2020, but has made short term deferments of payments on $9.5 million of loan balances as a result of interagency guidance issued on March 22, 2020 encouraging companies to work with customers impacted by COVID-19. Short term payment deferral modifications of $152.0 million and $62.4 million in other COVID-19 related modifications were completed by the Company as of April 19, 2020.
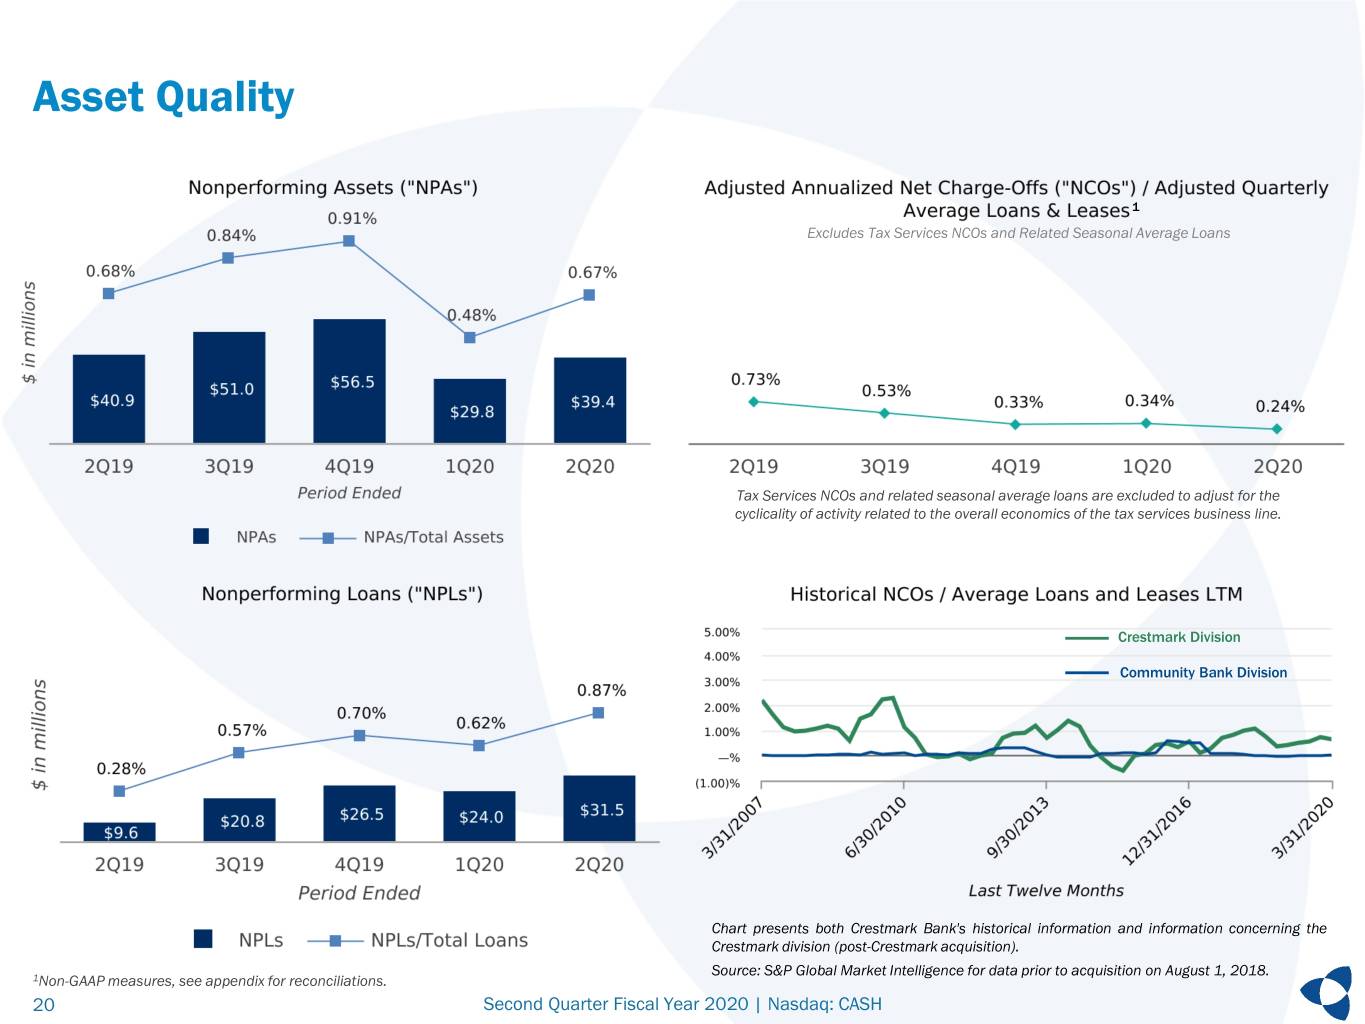
The Company's nonperforming assets at March 31, 2020, were $39.4 million, representing 0.67% of total assets, compared to $29.8 million, or 0.48% of total assets at December 31, 2019 and $40.9 million, or 0.68% of total assets at March 31, 2019. The increase in nonperforming assets on a linked quarter basis was primarily driven by an increase in foreclosed and repossessed assets, two nonperforming agricultural loan relationships in the community bank portfolio, and an increase in term lending nonperforming loans. The year-over-year decrease in nonperforming assets was primarily driven by a reduction in foreclosed and repossessed assets, mostly offset by an increase in commercial finance nonperforming loans and leases.
7
The Company's nonperforming loans and leases at March 31, 2020, were $31.5 million, representing 0.87% of total gross loans and leases, compared to $24.0 million, or 0.62% of total gross loans and leases at December 31, 2019 and $9.6 million, or 0.28% of total gross loans and leases at March 31, 2019.
Deposits, Borrowings and Other Liabilities
Total average deposits for the fiscal 2020 second quarter decreased by $590.0 million to $5.06 billion compared to the same period in fiscal 2019. Average wholesale deposits decreased $807.0 million, or 35%, while average noninterest-bearing deposits increased $245.9 million, or 8%, for the fiscal 2020 second quarter when compared to the same period in fiscal 2019. Average deposits from the payments divisions increased 11% to $3.31 billion for the fiscal 2020 second quarter when compared to the same period in fiscal 2019.
The average balance of total deposits and interest-bearing liabilities was $5.64 billion for the three-month period ended March 31, 2020, compared to $5.86 billion for the same period in the prior fiscal year, representing a decrease of 4%.
Total end-of-period deposits decreased 20% to $3.96 billion at March 31, 2020, compared to $4.97 billion at March 31, 2019. The decrease in end-of-period deposits was primarily driven by a decrease of $672.4 million in wholesale deposits, as well as the aforementioned sale of $290.5 million of community bank deposits during the second quarter of fiscal 2020.
Regulatory Capital
The Company and MetaBank, remained above the federal regulatory minimum capital requirements at March 31, 2020 and continued to be classified as well-capitalized institutions. Regulatory capital ratios of the Company and the Bank are stated in the table below.
The tables below include certain non-GAAP financial measures that are used by investors, analysts and bank regulatory agencies to assess the capital position of financial services companies. Management reviews these measures along with other measures of capital as part of its financial analysis.
| As of the dates indicated | March 31, 2020 | December 31, 2019 | September 30, 2019 | June 30, 2019 | March 31, 2019 | ||||||||||||||||||||||||
| Company | |||||||||||||||||||||||||||||
| Tier 1 leverage capital ratio | 7.28 | % | 8.28 | % | 8.33 | % | 8.05 | % | 7.45 | % | |||||||||||||||||||
| Common equity Tier 1 capital ratio | 10.24 | % | 10.10 | % | 10.35 | % | 10.19 | % | 10.94 | % | |||||||||||||||||||
| Tier 1 capital ratio | 10.60 | % | 10.46 | % | 10.71 | % | 10.55 | % | 11.31 | % | |||||||||||||||||||
| Total capital ratio | 13.57 | % | 12.74 | % | 13.01 | % | 13.22 | % | 14.20 | % | |||||||||||||||||||
| MetaBank | |||||||||||||||||||||||||||||
| Tier 1 leverage capital ratio | 8.52 | % | 9.70 | % | 9.65 | % | 9.37 | % | 8.42 | % | |||||||||||||||||||
| Common equity Tier 1 capital ratio | 12.36 | % | 12.18 | % | 12.31 | % | 12.22 | % | 12.72 | % | |||||||||||||||||||
| Tier 1 capital ratio | 12.41 | % | 12.24 | % | 12.37 | % | 12.27 | % | 12.76 | % | |||||||||||||||||||
| Total capital ratio | 13.66 | % | 12.90 | % | 13.02 | % | 13.26 | % | 13.92 | % | |||||||||||||||||||
The following table provides the non-GAAP financial measures used to compute certain of the ratios included in the table above, as well as a reconciliation of such non-GAAP financial measures to the most directly comparable financial measure in accordance with GAAP:
8
Standardized Approach(1) | March 31, 2020 | December 31, 2019 | September 30, 2019 | June 30, 2019 | March 31, 2019 | ||||||||||||||||||||||||
| (Dollars in Thousands) | |||||||||||||||||||||||||||||
| Total stockholders' equity | $ | 805,074 | $ | 837,068 | $ | 843,958 | $ | 822,901 | $ | 823,709 | |||||||||||||||||||
| Adjustments: | |||||||||||||||||||||||||||||
| LESS: Goodwill, net of associated deferred tax liabilities | 303,625 | 304,020 | 304,020 | 302,850 | 302,768 | ||||||||||||||||||||||||
| LESS: Certain other intangible assets | 44,909 | 47,855 | 50,501 | 53,249 | 56,456 | ||||||||||||||||||||||||
| LESS: Net deferred tax assets from operating loss and tax credit carry-forwards | 11,589 | 16,876 | 15,569 | 13,858 | 7,381 | ||||||||||||||||||||||||
| LESS: Net unrealized gains (losses) on available-for-sale securities | 2,337 | 3,897 | 6,458 | 2,329 | (10,022) | ||||||||||||||||||||||||
| LESS: Non-controlling interest | 3,762 | 4,305 | 4,047 | 3,508 | 3,528 | ||||||||||||||||||||||||
| LESS: Unrealized currency gains (losses) | — | — | — | — | (242) | ||||||||||||||||||||||||
Common Equity Tier 1(1) | 438,852 | 460,115 | 463,363 | 447,107 | 463,840 | ||||||||||||||||||||||||
| Long-term borrowings and other instruments qualifying as Tier 1 | 13,661 | 13,661 | 13,661 | 13,661 | 13,661 | ||||||||||||||||||||||||
| Tier 1 minority interest not included in common equity tier 1 capital | 2,036 | 2,372 | 2,350 | 2,119 | 2,064 | ||||||||||||||||||||||||
| Total Tier 1 Capital | 454,549 | 476,148 | 479,374 | 462,887 | 479,565 | ||||||||||||||||||||||||
| Allowance for loan and lease losses | 53,580 | 30,239 | 29,272 | 43,641 | 48,812 | ||||||||||||||||||||||||
| Subordinated debentures (net of issuance costs) | 73,724 | 73,684 | 73,644 | 73,605 | 73,566 | ||||||||||||||||||||||||
| Total qualifying capital | $ | 581,853 | $ | 580,071 | $ | 582,290 | $ | 580,133 | $ | 601,963 | |||||||||||||||||||
(1) Capital ratios were determined using the Basel III capital rules that became effective on January 1, 2015. Basel III revised the definition of capital, increased minimum capital ratios, and introduced a minimum CET1 ratio; those changes are being fully phased in through the end of 2021.
The following table provides a reconciliation of tangible common equity and tangible common equity excluding accumulated other comprehensive income ("AOCI"), each of which is used in calculating tangible book value data, to Total Stockholders' Equity. Each of tangible common equity and tangible common equity excluding AOCI is a non-GAAP financial measure that is commonly used within the banking industry.
| March 31, 2020 | December 31, 2019 | September 30, 2019 | June 30, 2019 | March 31, 2019 | |||||||||||||||||||||||||
| (Dollars in Thousands) | |||||||||||||||||||||||||||||
| Total Stockholders' Equity | $ | 805,074 | $ | 837,068 | $ | 843,958 | $ | 822,901 | $ | 823,709 | |||||||||||||||||||
| Less: Goodwill | 309,505 | 309,505 | 309,505 | 307,941 | 307,464 | ||||||||||||||||||||||||
| Less: Intangible assets | 46,766 | 50,151 | 52,810 | 56,153 | 60,506 | ||||||||||||||||||||||||
| Tangible common equity | 448,803 | 477,412 | 481,643 | 458,807 | 455,739 | ||||||||||||||||||||||||
| Less: Accumulated other comprehensive income (loss) ("AOCI") | 1,654 | 3,895 | 6,339 | 2,308 | (10,264) | ||||||||||||||||||||||||
| Tangible common equity excluding AOCI | $ | 447,149 | $ | 473,517 | $ | 475,304 | $ | 456,499 | $ | 466,003 | |||||||||||||||||||
Outlook
Given the deteriorating economic environment and the uncertainty of the impact on the business following the emergence of the COVID-19 pandemic, the Company is suspending fiscal 2020 earnings per share guidance.
Conference Call
The Company will host a conference call and earnings webcast at 4:00 p.m. Central Time (5:00 p.m. Eastern Time) on Wednesday, April 22, 2020. The live webcast of the call can be accessed from Meta’s Investor Relations website at www.metafinancialgroup.com. Telephone participants may access the live conference call by dialing (844) 461-9934 beginning approximately 10 minutes prior to start time. Please ask to join the Meta Financial conference call, and provide conference ID 4942497 upon request. International callers should dial (636) 812-6634. A webcast replay will also be archived at www.metafinancialgroup.com for one year.
9
Forward-Looking Statements
The Company and MetaBank, N.A. ("MetaBank") may from time to time make written or oral “forward-looking statements,” including statements contained in this press release, the Company’s filings with the SEC, the Company’s reports to stockholders, and in other communications by the Company and MetaBank, which are made in good faith by the Company pursuant to the “safe harbor” provisions of the Private Securities Litigation Reform Act of 1995.
You can identify forward-looking statements by words such as “may,” “hope,” “will,” “should,” “expect,” “plan,” “anticipate,” “intend,” “believe,” “estimate,” “predict,” “potential,” “continue,” “could,” “future,” or the negative of those terms, or other words of similar meaning or similar expressions. You should carefully read statements that contain these words because they discuss our future expectations or state other “forward-looking” information. These forward-looking statements are based on information currently available to us and assumptions about future events, and include statements with respect to the Company’s beliefs, expectations, estimates, and intentions, which are subject to significant risks and uncertainties, and are subject to change based on various factors, some of which are beyond the Company’s control. Such risks, uncertainties and other factors may cause our actual growth, results of operations, financial condition, cash flows, performance and business prospects and opportunities to differ materially from those expressed in, or implied by, these forward-looking statements. Such statements address, among others, the following subjects: future operating results; expectations in connection with the impact of the ongoing COVID-19 pandemic and related government actions on the Company and MetaBank; the extent in which the COVID-19 pandemic and measures taken in response thereto impact our business, our industry and the capital markets; customer retention; loan and other product demand; important components of the Company's statements of financial condition and operations; growth and expansion; expectations concerning the Company's acquisitions and divestitures, including potential benefits of, and other expectations for the Company in connection with, such transactions; new products and services, such as those offered by MetaBank or the Company's Payments divisions (which include Meta Payment Systems, Refund Advantage, EPS Financial and Specialty Consumer Services); credit quality and adequacy of reserves; technology; and the Company's employees. The following factors, among others, could cause the Company's financial performance and results of operations to differ materially from the expectations, estimates, and intentions expressed in such forward-looking statements: maintaining our executive management team; expected growth opportunities may not be realized or may take longer to realize than expected; the potential adverse effects of the ongoing COVID-19 pandemic and any governmental or societal responses thereto, or other unusual and infrequently occurring events; factors relating to the Company’s share repurchase program; actual changes in interest rates and the Fed Funds rate; additional changes in tax laws; the strength of the United States' economy, in general, and the strength of the local economies in which the Company conducts operations; the effects of, and changes in, trade, monetary, and fiscal policies and laws, including interest rate policies of the Board of Governors of the Federal Reserve System (the “Federal Reserve”), as well as efforts of the United States Congress and the United States Treasury in conjunction with bank regulatory agencies to stimulate the economy and protect the financial system; inflation, market, and monetary fluctuations; the timely and efficient development of, and acceptance of, new products and services offered by the Company or its strategic partners, as well as risks (including reputational and litigation) attendant thereto, and the perceived overall value of these products and services by users; the risks of dealing with or utilizing third parties, including, in connection with the Company’s refund advance business, the risk of reduced volume of refund advance loans as a result of reduced customer demand for or acceptance of usage of Meta’s strategic partners’ refund advance products; any actions which may be initiated by our regulators in the future; the impact of changes in financial services laws and regulations, including, but not limited to, laws and regulations relating to the tax refund industry and the insurance premium finance industry and recent and potential changes in response to the COVID-19 pandemic such as the Coronavirus Aid, Relief, and Economic Security Act ("CARES Act") and the rules and regulations that may be promulgated thereunder; our relationship with our primary regulators, the Office of the Comptroller of the Currency and the Federal Reserve, as well as the Federal Deposit Insurance Corporation, which insures MetaBank’s deposit accounts up to applicable limits; technological changes, including, but not limited to, the protection of electronic files or databases; acquisitions and divestitures; litigation risk; the growth of the Company’s business, as well as expenses related thereto; continued maintenance by MetaBank of its status as a well-capitalized institution, particularly in light of our deposit base, a portion of which has been characterized as “brokered;” changes in consumer spending and saving habits; and the success of the Company at maintaining its high quality asset level and managing and collecting assets of borrowers in default should problem assets increase.
The foregoing list of factors is not exclusive. We caution you not to place undue reliance on these forward-looking statements. The forward-looking statements included in this press release speak only as of the date hereof. Additional discussions of factors affecting the Company’s business and prospects are reflected under the caption “Risk Factors” and in other sections of the Company’s Annual Report on Form 10-K for the Company’s fiscal year ended September 30, 2019, and in other filings made with the SEC. The Company expressly disclaims any intent or obligation to update any forward-looking statements, whether written or oral, that may be made from time to time by or on behalf of the Company or its subsidiaries, whether as a result of new information, changed circumstances, or future events or for any other reason.
10
Condensed Consolidated Statements of Financial Condition (Unaudited)
(Dollars in Thousands, Except Share Data)
| ASSETS | March 31, 2020 | December 31, 2019 | September 30, 2019 | June 30, 2019 | March 31, 2019 | ||||||||||||||||||||||||
| Cash and cash equivalents | $ | 108,733 | $ | 152,189 | $ | 126,545 | $ | 100,732 | $ | 156,461 | |||||||||||||||||||
| Investment securities available for sale, at fair value | 840,525 | 852,603 | 889,947 | 961,897 | 1,081,663 | ||||||||||||||||||||||||
| Mortgage-backed securities available for sale, at fair value | 355,094 | 362,120 | 382,546 | 395,201 | 413,493 | ||||||||||||||||||||||||
| Investment securities held to maturity, at cost | 108,105 | 116,313 | 127,582 | 138,128 | 146,992 | ||||||||||||||||||||||||
| Mortgage-backed securities held to maturity, at cost | 6,752 | 6,804 | 7,182 | 7,414 | 7,606 | ||||||||||||||||||||||||
| Loans held for sale | 13,610 | 264,266 | 148,777 | 62,839 | 59,745 | ||||||||||||||||||||||||
| Loans and leases | 3,618,924 | 3,590,474 | 3,658,847 | 3,631,031 | 3,437,980 | ||||||||||||||||||||||||
| Allowance for loan and lease losses | (65,355) | (30,176) | (29,149) | (43,505) | (48,672) | ||||||||||||||||||||||||
| Federal Home Loan Bank Stock, at cost | 29,944 | 13,796 | 30,916 | 17,236 | 7,436 | ||||||||||||||||||||||||
| Accrued interest receivable | 16,958 | 18,687 | 20,400 | 19,722 | 20,281 | ||||||||||||||||||||||||
| Premises, furniture, and equipment, net | 38,871 | 38,671 | 45,932 | 46,360 | 45,457 | ||||||||||||||||||||||||
| Rental equipment, net | 200,837 | 211,673 | 208,537 | 184,732 | 140,087 | ||||||||||||||||||||||||
| Bank-owned life insurance | 91,081 | 90,458 | 89,827 | 89,193 | 88,565 | ||||||||||||||||||||||||
| Foreclosed real estate and repossessed assets | 7,249 | 1,328 | 29,494 | 29,514 | 29,548 | ||||||||||||||||||||||||
| Goodwill | 309,505 | 309,505 | 309,505 | 307,941 | 307,464 | ||||||||||||||||||||||||
| Intangible assets | 46,766 | 50,151 | 52,810 | 56,153 | 60,506 | ||||||||||||||||||||||||
| Prepaid assets | 9,727 | 14,813 | 9,476 | 22,023 | 26,597 | ||||||||||||||||||||||||
| Deferred taxes | 20,887 | 19,752 | 18,884 | 21,630 | 19,079 | ||||||||||||||||||||||||
| Other assets | 85,652 | 97,499 | 54,832 | 52,831 | 49,754 | ||||||||||||||||||||||||
| Total assets | $ | 5,843,865 | $ | 6,180,926 | 6,182,890 | $ | 6,101,072 | $ | 6,050,042 | ||||||||||||||||||||
| LIABILITIES AND STOCKHOLDERS’ EQUITY | |||||||||||||||||||||||||||||
| LIABILITIES | |||||||||||||||||||||||||||||
| Deposits held for sale | $ | — | $ | 288,975 | $ | — | $ | — | $ | — | |||||||||||||||||||
| Deposits: | |||||||||||||||||||||||||||||
| Noninterest-bearing checking | 2,900,484 | 2,927,967 | 2,358,010 | 2,751,931 | 3,034,428 | ||||||||||||||||||||||||
| Interest-bearing checking | 152,504 | 67,642 | 185,768 | 157,802 | 183,492 | ||||||||||||||||||||||||
| Savings deposits | 37,615 | 17,436 | 49,773 | 52,179 | 59,978 | ||||||||||||||||||||||||
| Money market deposits | 37,266 | 42,286 | 76,911 | 68,604 | 56,563 | ||||||||||||||||||||||||
| Time certificates of deposit | 25,492 | 23,454 | 109,275 | 116,698 | 154,401 | ||||||||||||||||||||||||
| Wholesale deposits | 809,043 | 1,438,820 | 1,557,268 | 1,628,000 | 1,481,445 | ||||||||||||||||||||||||
| Total deposits | 3,962,404 | 4,517,605 | 4,337,005 | 4,775,214 | 4,970,307 | ||||||||||||||||||||||||
| Short-term borrowings | 717,000 | 194,000 | 646,019 | 146,613 | 11,583 | ||||||||||||||||||||||||
| Long-term borrowings | 211,353 | 213,070 | 215,838 | 209,765 | 99,800 | ||||||||||||||||||||||||
| Accrued interest payable | 3,607 | 6,620 | 9,414 | 12,350 | 9,239 | ||||||||||||||||||||||||
| Accrued expenses and other liabilities | 144,427 | 123,588 | 130,656 | 134,229 | 135,404 | ||||||||||||||||||||||||
| Total liabilities | 5,038,791 | 5,343,858 | 5,338,932 | 5,278,171 | 5,226,333 | ||||||||||||||||||||||||
| STOCKHOLDERS’ EQUITY | |||||||||||||||||||||||||||||
| Preferred stock | — | — | — | — | — | ||||||||||||||||||||||||
| Common stock, $.01 par value | 346 | 372 | 378 | 379 | 395 | ||||||||||||||||||||||||
| Common stock, Nonvoting, $.01 par value | — | — | — | — | — | ||||||||||||||||||||||||
| Additional paid-in capital | 590,682 | 587,678 | 580,826 | 578,715 | 576,406 | ||||||||||||||||||||||||
| Retained earnings | 212,027 | 244,005 | 252,813 | 238,004 | 258,600 | ||||||||||||||||||||||||
| Accumulated other comprehensive income (loss) | 1,654 | 3,895 | 6,339 | 2,308 | (10,264) | ||||||||||||||||||||||||
| Treasury stock, at cost | (3,397) | (3,187) | (445) | (13) | (4,956) | ||||||||||||||||||||||||
| Total equity attributable to parent | 801,312 | 832,763 | 839,911 | 819,393 | 820,181 | ||||||||||||||||||||||||
| Noncontrolling interest | 3,762 | 4,305 | 4,047 | 3,508 | 3,528 | ||||||||||||||||||||||||
| Total stockholders’ equity | 805,074 | 837,068 | 843,958 | 822,901 | 823,709 | ||||||||||||||||||||||||
| Total liabilities and stockholders’ equity | $ | 5,843,865 | $ | 6,180,926 | $ | 6,182,890 | $ | 6,101,072 | $ | 6,050,042 | |||||||||||||||||||
11
Consolidated Statements of Operations (Unaudited)
(Dollars in Thousands, Except Share and Per Share Data)
| Three Months Ended | Six Months Ended | ||||||||||||||||||||||||||||
| March 31, 2020 | December 31, 2019 | March 31, 2019 | March 31, 2020 | March 31, 2019 | |||||||||||||||||||||||||
| Interest and dividend income: | |||||||||||||||||||||||||||||
| Loans and leases, including fees | $ | 70,493 | $ | 68,702 | $ | 73,670 | $ | 139,195 | $ | 134,168 | |||||||||||||||||||
| Mortgage-backed securities | 2,493 | 2,389 | 2,861 | 4,882 | 5,559 | ||||||||||||||||||||||||
| Other investments | 6,417 | 6,534 | 11,763 | 12,952 | 23,543 | ||||||||||||||||||||||||
| 79,403 | 77,625 | 88,294 | 157,029 | 163,270 | |||||||||||||||||||||||||
| Interest expense: | |||||||||||||||||||||||||||||
| Deposits | 8,242 | 9,340 | 14,740 | 17,583 | 25,336 | ||||||||||||||||||||||||
| FHLB advances and other borrowings | 3,424 | 3,634 | 2,204 | 7,058 | 6,312 | ||||||||||||||||||||||||
| 11,666 | 12,974 | 16,944 | 24,641 | 31,648 | |||||||||||||||||||||||||
| Net interest income | 67,737 | 64,651 | 71,350 | 132,388 | 131,622 | ||||||||||||||||||||||||
| Provision for loan for lease losses | 37,296 | 3,407 | 33,318 | 40,703 | 42,417 | ||||||||||||||||||||||||
| Net interest income after provision for loan and lease losses | 30,441 | 61,244 | 38,032 | 91,685 | 89,205 | ||||||||||||||||||||||||
| Noninterest income: | |||||||||||||||||||||||||||||
| Refund transfer product fees | 28,939 | 192 | 31,601 | 29,131 | 31,862 | ||||||||||||||||||||||||
| Tax advance product fees | 29,536 | 2,276 | 33,038 | 31,812 | 34,723 | ||||||||||||||||||||||||
| Payments card and deposit fees | 23,156 | 21,499 | 24,671 | 44,655 | 45,477 | ||||||||||||||||||||||||
| Other bank and deposit fees | 381 | 487 | 474 | 868 | 957 | ||||||||||||||||||||||||
| Rental income | 11,100 | 12,351 | 9,890 | 23,451 | 20,780 | ||||||||||||||||||||||||
| Gain on sale of securities available-for-sale, net | — | — | 231 | — | 209 | ||||||||||||||||||||||||
| Gain on divestitures | 19,275 | — | — | 19,275 | — | ||||||||||||||||||||||||
| Gain (loss) on sale of other | 2,325 | (2,568) | 2,230 | (244) | 3,496 | ||||||||||||||||||||||||
| Other income | 5,801 | 3,246 | 2,890 | 9,047 | 5,272 | ||||||||||||||||||||||||
| Total noninterest income | 120,513 | 37,483 | 105,025 | 157,995 | 142,776 | ||||||||||||||||||||||||
| Noninterest expense: | |||||||||||||||||||||||||||||
| Compensation and benefits | 34,260 | 34,268 | 49,164 | 68,529 | 82,174 | ||||||||||||||||||||||||
| Refund transfer product expense | 7,449 | 173 | 7,181 | 7,621 | 7,191 | ||||||||||||||||||||||||
| Tax advance product expense | 1,698 | 1,132 | 2,225 | 2,830 | 2,677 | ||||||||||||||||||||||||
| Card processing | 6,696 | 5,607 | 6,971 | 12,303 | 14,056 | ||||||||||||||||||||||||
| Occupancy and equipment expense | 7,013 | 6,655 | 7,212 | 13,668 | 13,670 | ||||||||||||||||||||||||
| Operating lease equipment depreciation | 8,421 | 8,280 | 4,485 | 16,701 | 12,251 | ||||||||||||||||||||||||
| Legal and consulting | 5,909 | 4,674 | 4,308 | 10,583 | 8,277 | ||||||||||||||||||||||||
| Intangible amortization | 3,402 | 2,676 | 5,596 | 6,077 | 9,978 | ||||||||||||||||||||||||
| Impairment expense | 507 | 242 | 9,660 | 750 | 9,660 | ||||||||||||||||||||||||
| Other expense | 16,374 | 12,091 | 13,452 | 28,464 | 24,615 | ||||||||||||||||||||||||
| Total noninterest expense | 91,729 | 75,798 | 110,254 | 167,526 | 184,549 | ||||||||||||||||||||||||
| Income before income tax expense | 59,225 | 22,929 | 32,803 | 82,154 | 47,432 | ||||||||||||||||||||||||
| Income tax expense (benefit) | 5,617 | 680 | (395) | 6,297 | (2,086) | ||||||||||||||||||||||||
| Net income before noncontrolling interest | 53,608 | 22,249 | 33,198 | 75,857 | 49,518 | ||||||||||||||||||||||||
| Net income attributable to noncontrolling interest | 1,304 | 1,181 | 1,078 | 2,485 | 2,000 | ||||||||||||||||||||||||
| Net income attributable to parent | $ | 52,304 | $ | 21,068 | $ | 32,120 | $ | 73,372 | $ | 47,518 | |||||||||||||||||||
| Earnings per common share | |||||||||||||||||||||||||||||
| Basic | $ | 1.45 | $ | 0.56 | $ | 0.81 | $ | 2.00 | $ | 1.21 | |||||||||||||||||||
| Diluted | $ | 1.45 | $ | 0.56 | $ | 0.81 | $ | 2.00 | $ | 1.20 | |||||||||||||||||||
| Shares used in computing earnings per share | |||||||||||||||||||||||||||||
| Basic | 35,948,799 | 37,431,788 | 39,429,595 | 36,691,705 | 39,381,682 | ||||||||||||||||||||||||
| Diluted | 35,970,296 | 37,465,878 | 39,496,832 | 36,713,339 | 39,450,263 | ||||||||||||||||||||||||
12
Average Balances, Interest Rates and Yields
The following table presents, for the periods indicated, the total dollar amount of interest income from average interest-earning assets and the resulting yields, as well as the interest expense on average interest-bearing liabilities, expressed both in dollars and in rates. Only the yield/rate reflects tax-equivalent adjustments. Non-accruing loans and leases have been included in the table as loans carrying a zero yield.
| Three Months Ended March 31, | 2020 | 2019 | |||||||||||||||||||||||||||||||||
| (Dollars in Thousands) | Average Outstanding Balance | Interest Earned / Paid | Yield / Rate(1) | Average Outstanding Balance | Interest Earned / Paid | Yield / Rate(1) | |||||||||||||||||||||||||||||
| Interest-earning assets: | |||||||||||||||||||||||||||||||||||
| Cash and fed funds sold | $ | 196,754 | $ | 739 | 1.51 | % | $ | 281,069 | $ | 1,914 | 2.76 | % | |||||||||||||||||||||||
| Mortgage-backed securities | 358,103 | 2,493 | 2.80 | % | 374,096 | 2,861 | 3.10 | % | |||||||||||||||||||||||||||
| Tax exempt investment securities | 454,177 | 2,132 | 2.39 | % | 926,156 | 6,138 | 3.40 | % | |||||||||||||||||||||||||||
| Asset-backed securities | 304,674 | 2,271 | 3.00 | % | 285,783 | 2,677 | 3.80 | % | |||||||||||||||||||||||||||
| Other investment securities | 192,379 | 1,275 | 2.67 | % | 142,452 | 1,034 | 2.95 | % | |||||||||||||||||||||||||||
| Total investments | 1,309,333 | 8,171 | 2.68 | % | 1,728,487 | 12,710 | 3.36 | % | |||||||||||||||||||||||||||
| Commercial finance loans and leases | 2,020,358 | 41,643 | 8.29 | % | 1,649,973 | 41,954 | 10.31 | % | |||||||||||||||||||||||||||
| Consumer finance loans | 264,307 | 5,386 | 8.20 | % | 327,441 | 7,289 | 9.03 | % | |||||||||||||||||||||||||||
| Tax services loans | 516,491 | 6,351 | 4.95 | % | 369,331 | 8,204 | 9.01 | % | |||||||||||||||||||||||||||
| Warehouse finance loans | 314,474 | 4,785 | 6.12 | % | 181,781 | 2,789 | 6.22 | % | |||||||||||||||||||||||||||
| National lending loans and leases | 3,115,630 | 58,165 | 7.51 | % | 2,528,526 | 60,236 | 9.66 | % | |||||||||||||||||||||||||||
| Community banking loans | 1,080,142 | 12,328 | 4.59 | % | 1,181,294 | 13,434 | 4.61 | % | |||||||||||||||||||||||||||
| Total loans and leases | 4,195,772 | 70,493 | 6.76 | % | 3,709,820 | 73,670 | 8.05 | % | |||||||||||||||||||||||||||
| Total interest-earning assets | $ | 5,701,859 | $ | 79,403 | 5.64 | % | $ | 5,719,376 | $ | 88,294 | 6.38 | % | |||||||||||||||||||||||
| Non-interest-earning assets | 909,040 | 1,068,318 | |||||||||||||||||||||||||||||||||
| Total assets | $ | 6,610,899 | $ | 6,787,694 | |||||||||||||||||||||||||||||||
| Interest-bearing liabilities: | |||||||||||||||||||||||||||||||||||
| Interest-bearing checking | $ | 182,107 | $ | 105 | 0.23 | % | $ | 148,640 | $ | 78 | 0.21 | % | |||||||||||||||||||||||
| Savings | 46,592 | 6 | 0.05 | % | 56,048 | 9 | 0.07 | % | |||||||||||||||||||||||||||
| Money markets | 68,421 | 153 | 0.90 | % | 57,932 | 92 | 0.64 | % | |||||||||||||||||||||||||||
| Time deposits | 84,940 | 427 | 2.02 | % | 148,384 | 715 | 1.95 | % | |||||||||||||||||||||||||||
| Wholesale deposits | 1,476,085 | 7,551 | 2.06 | % | 2,283,049 | 13,846 | 2.46 | % | |||||||||||||||||||||||||||
| Total interest-bearing deposits | 1,858,145 | 8,242 | 1.78 | % | 2,694,053 | 14,740 | 2.22 | % | |||||||||||||||||||||||||||
| Overnight fed funds purchased | 372,596 | 1,307 | 1.41 | % | 103,600 | 637 | 2.49 | % | |||||||||||||||||||||||||||
| FHLB advances | 110,000 | 670 | 2.45 | % | — | — | — | % | |||||||||||||||||||||||||||
| Subordinated debentures | 73,698 | 1,158 | 6.32 | % | 73,542 | 1,162 | 6.41 | % | |||||||||||||||||||||||||||
| Other borrowings | 28,714 | 289 | 4.04 | % | 39,610 | 405 | 4.14 | % | |||||||||||||||||||||||||||
| Total borrowings | 585,008 | 3,424 | 2.35 | % | 216,752 | 2,204 | 4.12 | % | |||||||||||||||||||||||||||
| Total interest-bearing liabilities | 2,443,153 | 11,666 | 1.92 | % | 2,910,805 | 16,944 | 2.36 | % | |||||||||||||||||||||||||||
| Noninterest-bearing deposits | 3,199,148 | — | — | % | 2,953,275 | — | — | % | |||||||||||||||||||||||||||
| Total deposits and interest-bearing liabilities | $ | 5,642,301 | $ | 11,666 | 0.83 | % | $ | 5,864,080 | $ | 16,944 | 1.17 | % | |||||||||||||||||||||||
| Other noninterest-bearing liabilities | 136,759 | 129,525 | |||||||||||||||||||||||||||||||||
| Total liabilities | 5,779,060 | 5,993,605 | |||||||||||||||||||||||||||||||||
| Shareholders' equity | 831,839 | 794,089 | |||||||||||||||||||||||||||||||||
| Total liabilities and shareholders' equity | $ | 6,610,899 | $ | 6,787,694 | |||||||||||||||||||||||||||||||
| Net interest income and net interest rate spread including noninterest-bearing deposits | $ | 67,737 | 4.81 | % | $ | 71,350 | 5.21 | % | |||||||||||||||||||||||||||
| Net interest margin | 4.78 | % | 5.06 | % | |||||||||||||||||||||||||||||||
| Tax-equivalent effect | 0.04 | % | 0.12 | % | |||||||||||||||||||||||||||||||
Net interest margin, tax-equivalent(2) | 4.82 | % | 5.18 | % | |||||||||||||||||||||||||||||||
(1) Tax rate used to arrive at the TEY for the three months ended March 31, 2020 and 2019 was 21%.
(2) Net interest margin expressed on a fully-taxable-equivalent basis ("net interest margin, tax-equivalent") is a non-GAAP financial measure. The tax-equivalent adjustment to net interest income recognizes the estimated income tax savings when comparing taxable and tax-exempt assets and adjusting for federal and state exemption of interest income. The Company believes that it is a standard practice in the banking industry to present net interest margin expressed on a fully taxable equivalent basis and, accordingly, believes the presentation of this non-GAAP financial measure may be useful for peer comparison purposes.
13
Selected Financial Information
| As of and For the Three Months Ended | March 31, 2020 | December 31, 2019 | September 30, 2019 | June 30, 2019 | March 31, 2019 | ||||||||||||||||||||||||
| Equity to total assets | 13.78 | % | 13.54 | % | 13.65 | % | 13.49 | % | 13.61 | % | |||||||||||||||||||
| Book value per common share outstanding | $ | 23.26 | $ | 22.52 | $ | 22.32 | $ | 21.72 | $ | 20.88 | |||||||||||||||||||
| Tangible book value per common share outstanding | $ | 12.97 | $ | 12.84 | $ | 12.74 | $ | 12.11 | $ | 11.55 | |||||||||||||||||||
| Tangible book value per common share outstanding excluding AOCI | $ | 12.92 | $ | 12.74 | $ | 12.57 | $ | 12.05 | $ | 11.81 | |||||||||||||||||||
| Common shares outstanding | 34,607,962 | 37,172,081 | 37,807,064 | 37,878,205 | 39,450,938 | ||||||||||||||||||||||||
| Non-performing assets to total assets | 0.67 | % | 0.48 | % | 0.91 | % | 0.84 | % | 0.68 | % | |||||||||||||||||||
| Non-performing loans and leases to total loans and leases | 0.87 | % | 0.62 | % | 0.70 | % | 0.57 | % | 0.28 | % | |||||||||||||||||||
| Net interest margin | 4.78 | % | 4.94 | % | 4.95 | % | 5.07 | % | 5.06 | % | |||||||||||||||||||
| Net interest margin, tax-equivalent | 4.82 | % | 4.99 | % | 5.00 | % | 5.15 | % | 5.18 | % | |||||||||||||||||||
| Return on average assets | 3.16 | % | 1.38 | % | 1.32 | % | 1.91 | % | 1.89 | % | |||||||||||||||||||
| Return on average equity | 25.15 | % | 10.04 | % | 9.69 | % | 14.17 | % | 16.18 | % | |||||||||||||||||||
| Full-time equivalent employees | 992 | 1,088 | 1,186 | 1,218 | 1,231 | ||||||||||||||||||||||||
Quarterly Amortization of Intangibles Expense
| (Dollars in Thousands) | Actual | Anticipated | |||||||||||||||||||||||||||
| For the Three Months Ended | Mar 31, 2020 | Jun 30, 2020 | Sep 30, 2020 | Dec 31, 2020 | Mar 31, 2021 | Jun 30, 2021 | Sep 30, 2021 | Dec 31, 2021 | Mar 31, 2022 | ||||||||||||||||||||
Amortization of intangibles(1) | $ | 3,402 | $ | 2,637 | $ | 2,282 | $ | 2,013 | $ | 2,757 | $ | 2,013 | $ | 1,761 | $ | 1,488 | $ | 2,170 | |||||||||||
(1) These amounts are based upon the current reporting period’s intangible assets only. This table makes no assumption for expenses related to future acquired intangible assets.
About Meta Financial Group®
Meta Financial Group, Inc.® (Nasdaq: CASH) is a South Dakota-based financial holding company. Meta Financial Group’s banking subsidiary, MetaBank®, N.A., (“Meta”), is a leader in providing innovative financial solutions to consumers and businesses in under-served niche markets and believes in financial inclusion for all. Meta’s commercial lending division works with high-value niche industries, rapid-growth companies and technology adopters to grow their businesses and build more profitable customer relationships nationwide. Meta is one of the largest issuers of prepaid cards in the U.S., having issued more than a billion cards in partnership with banks, program managers, payments providers and other businesses, and offers a total payments services solution that includes ACH origination, wire transfers, and more. For more information, visit the Meta Financial Group website.
Investor Relations and Media Contact: | |||||
Brittany Kelley Elsasser | |||||
Director of Investor Relations | |||||
605-362-2423 | |||||
| [email protected] | |||||
14