Exhibit 99.1
Caterpillar Inc.
4Q 2021 Earnings Release
January 28, 2022
FOR IMMEDIATE RELEASE
Caterpillar Reports Fourth-Quarter and Full-Year 2021 Results
| | | | | |
| ● | Fourth-quarter 2021 sales and revenues up 23%; full-year sales and revenues up 22% |
| ● | Fourth-quarter 2021 profit per share of $3.91; adjusted profit per share of $2.69 |
| ● | 2021 profit per share of $11.83; adjusted profit per share of $10.81 |
| ● | Strong operating cash flow; ended the year with $9.3 billion of enterprise cash |
| ● | Returned $5.0 billion to shareholders through dividends and share repurchases in 2021 |
| | | | | | | | | | | | | | | | | | | | |
| | Fourth Quarter | | Full Year |
| ($ in billions except profit per share) | | 2021 | 2020 | | 2021 | 2020 |
| Sales and Revenues | | $13.8 | $11.2 | | $51.0 | $41.7 |
| Profit Per Share | | $3.91 | $1.42 | | $11.83 | $5.46 |
| Adjusted Profit Per Share | | $2.69 | $2.12 | | $10.81 | $6.56 |
DEERFIELD, Ill. – Caterpillar Inc. (NYSE: CAT) today announced fourth-quarter and full-year results for 2021.
Sales and revenues for the fourth quarter of 2021 were $13.8 billion, a 23% increase compared with $11.2 billion in the fourth quarter of 2020. Operating profit margin was 11.7% for the fourth quarter of 2021, compared with 12.3% for the fourth quarter of 2020. Fourth-quarter 2021 profit per share was $3.91, compared with $1.42 profit per share in the fourth quarter of 2020. Adjusted profit per share in the fourth quarter of 2021 was $2.69, compared with fourth-quarter 2020 adjusted profit per share of $2.12. Fourth-quarter 2021 adjusted profit per share also reflected a lower-than-expected effective tax rate.
Full-year sales and revenues in 2021 were $51.0 billion, up 22% compared with $41.7 billion in 2020. The increase reflected higher end-user demand for equipment and services and the impact from changes in dealer inventories. Dealers decreased their inventories $2.9 billion in 2020, while remaining about flat in 2021. Operating profit margin was 13.5% for 2021, compared with 10.9% for 2020. Full-year profit was $11.83 per share in 2021, compared with profit of $5.46 per share in 2020. Adjusted profit per share in 2021 was $10.81, compared with adjusted profit per share of $6.56 in 2020.
“I’m proud of our global team’s continued resilience in what proved to be a challenging and dynamic operating environment. We delivered adjusted operating profit margins and ME&T free cash flows consistent with our long-term targets established during our 2019 Investor Day,” said Chairman and CEO Jim Umpleby. “Amid ongoing supply chain constraints, our team continues to execute our strategy for long-term profitable growth while striving to meet customer demand.”
In 2021, adjusted profit per share excluded mark-to-market gains for remeasurement of pension and other postemployment benefit (OPEB) plans and restructuring costs. In 2020, adjusted profit per share excluded mark-to-market losses for remeasurement of pension and OPEB plans and restructuring costs. Please see a reconciliation of GAAP to non-GAAP financial measures in the appendix on page 14.
For the full year of 2021, enterprise operating cash flow was $7.2 billion. During the year, the company repurchased $2.7 billion of Caterpillar common stock and paid dividends of $2.3 billion. Liquidity remained strong with an enterprise cash balance of $9.3 billion at the end of 2021.
CONSOLIDATED RESULTS
Consolidated Sales and Revenues
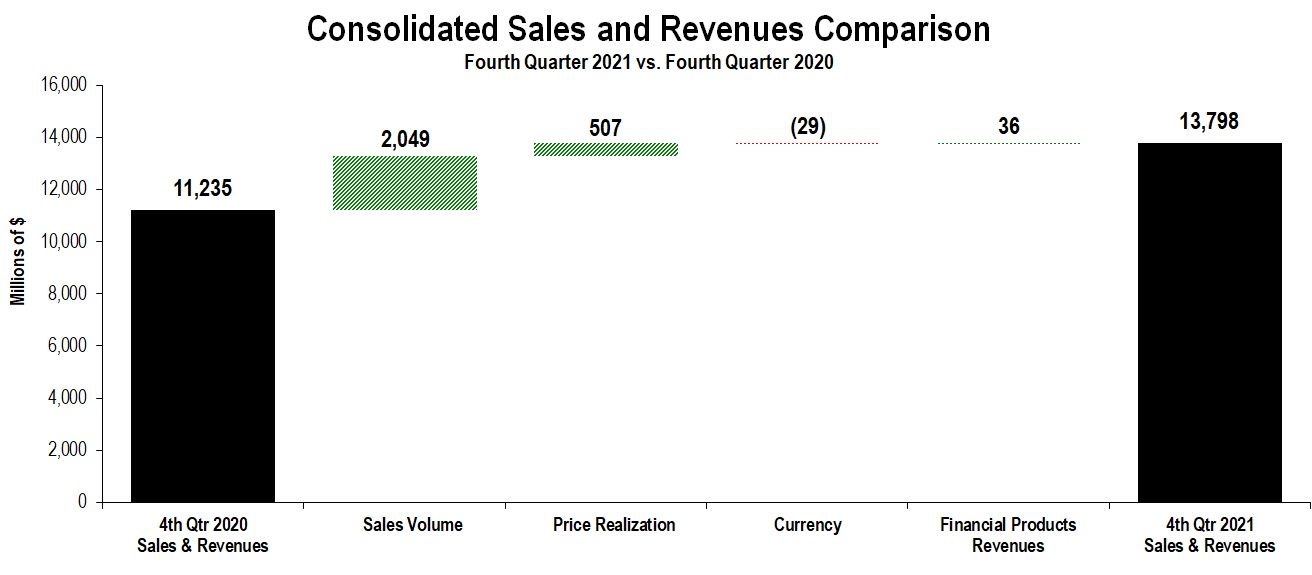
The chart above graphically illustrates reasons for the change in consolidated sales and revenues between the fourth quarter of 2020 (at left) and the fourth quarter of 2021 (at right). Caterpillar management utilizes these charts internally to visually communicate with the company’s Board of Directors and employees.
Total sales and revenues for the fourth quarter of 2021 were $13.798 billion, an increase of $2.563 billion, or 23%, compared with $11.235 billion in the fourth quarter of 2020. The increase was mostly due to higher sales volume, driven by higher end-user demand for equipment and services and the impact from changes in dealer inventories, along with favorable price realization. Dealers decreased inventories during the fourth quarter of 2020, compared to remaining about flat during the fourth quarter of 2021.
Sales were higher across the three primary segments.
| | | | | | | | | | | | | | | | | | | | | | | | | | | | | | | | | | | | | | | | | | | | | | | |
| Sales and Revenues by Segment |
| (Millions of dollars) | Fourth Quarter 2020 | | Sales
Volume | | Price
Realization | | Currency | | Inter-Segment / Other | | Fourth Quarter 2021 | | $
Change | | %
Change |
| | | | | | | | | | | | | | | |
| Construction Industries | $ | 4,508 | | | $ | 929 | | | $ | 299 | | | $ | (23) | | | $ | 23 | | | $ | 5,736 | | | $ | 1,228 | | | 27% |
| Resource Industries | 2,180 | | | 467 | | | 121 | | | 2 | | | (8) | | | 2,762 | | | 582 | | | 27% |
| Energy & Transportation | 4,811 | | | 640 | | | 88 | | | (7) | | | 196 | | | 5,728 | | | 917 | | | 19% |
| All Other Segment | 137 | | | 7 | | | — | | | (1) | | | (9) | | | 134 | | | (3) | | | (2%) |
| Corporate Items and Eliminations | (1,066) | | | 6 | | | (1) | | | — | | | (202) | | | (1,263) | | | (197) | | | |
| Machinery, Energy & Transportation | 10,570 | | | 2,049 | | | 507 | | | (29) | | | — | | | 13,097 | | | 2,527 | | | 24% |
| | | | | | | | | | | | | | | |
| Financial Products Segment | 743 | | | — | | | — | | | — | | | 33 | | | 776 | | | 33 | | | 4% |
| Corporate Items and Eliminations | (78) | | | — | | | — | | | — | | | 3 | | | (75) | | | 3 | | | |
| Financial Products Revenues | 665 | | | — | | | — | | | — | | | 36 | | | 701 | | | 36 | | | 5% |
| | | | | | | | | | | | | | | |
| Consolidated Sales and Revenues | $ | 11,235 | | | $ | 2,049 | | | $ | 507 | | | $ | (29) | | | $ | 36 | | | $ | 13,798 | | | $ | 2,563 | | | 23% |
| | | | | | | | | | | | | | | |
| | | | | | | | | | | | | | | | | | | | | | | | | | | | | | | | | | | | | | | | | | | | | | | | | | | | | | | | | | | | | | | | | | | | | | | | | | | | | | | | | | | |
| Sales and Revenues by Geographic Region |
| North America | | Latin America | | EAME | | Asia/Pacific | | External Sales and Revenues | | Inter-Segment | | Total Sales and Revenues |
| (Millions of dollars) | $ | | % Chg | | $ | | % Chg | | $ | | % Chg | | $ | | % Chg | | $ | | % Chg | | $ | | % Chg | | $ | | % Chg |
| Fourth Quarter 2021 | | | | | | | | | | | | | | | | | | | | | | | | | | | |
| Construction Industries | $ | 2,635 | | | 39% | | $ | 563 | | | 74% | | $ | 1,246 | | | 47% | | $ | 1,245 | | | (12%) | | $ | 5,689 | | | 27% | | $ | 47 | | | 96% | | $ | 5,736 | | | 27% |
| Resource Industries | 857 | | | 44% | | 415 | | | 5% | | 532 | | | 29% | | 839 | | | 29% | | 2,643 | | | 29% | | 119 | | | (6%) | | 2,762 | | | 27% |
| Energy & Transportation | 1,913 | | | 12% | | 398 | | | 50% | | 1,475 | | | 9% | | 965 | | | 36% | | 4,751 | | | 18% | | 977 | | | 25% | | 5,728 | | | 19% |
| All Other Segment | 14 | | | 180% | | 1 | | | —% | | 8 | | | (11%) | | 15 | | | (17%) | | 38 | | | 19% | | 96 | | | (9%) | | 134 | | | (2%) |
| Corporate Items and Eliminations | (17) | | | | | — | | | | | — | | | | | (7) | | | | | (24) | | | | | (1,239) | | | | | (1,263) | | | |
| Machinery, Energy & Transportation | 5,402 | | | 29% | | 1,377 | | | 40% | | 3,261 | | | 24% | | 3,057 | | | 9% | | 13,097 | | | 24% | | — | | | —% | | 13,097 | | | 24% |
| | | | | | | | | | | | | | | | | | | | | | | | | | | |
| Financial Products Segment | 493 | | | 6% | | 70 | | | 9% | | 101 | | | 7% | | 112 | | | (7%) | | 776 | | | 4% | | — | | | —% | | 776 | | | 4% |
| Corporate Items and Eliminations | (37) | | | | | (15) | | | | | (9) | | | | | (14) | | | | | (75) | | | | | — | | | | | (75) | | | |
| Financial Products Revenues | 456 | | | 8% | | 55 | | | 2% | | 92 | | | 10% | | 98 | | | (6%) | | 701 | | | 5% | | — | | | —% | | 701 | | | 5% |
| | | | | | | | | | | | | | | | | | | | | | | | | | | |
| Consolidated Sales and Revenues | $ | 5,858 | | | 27% | | $ | 1,432 | | | 38% | | $ | 3,353 | | | 24% | | $ | 3,155 | | | 9% | | $ | 13,798 | | | 23% | | $ | — | | | —% | | $ | 13,798 | | | 23% |
| | | | | | | | | | | | | | | | | | | | | | | | | | | |
| Fourth Quarter 2020 | | | | | | | | | | | | | | | | | | | | | | | | | | | |
| Construction Industries | $ | 1,895 | | | | | $ | 324 | | | | | $ | 848 | | | | | $ | 1,417 | | | | | $ | 4,484 | | | | | $ | 24 | | | | | $ | 4,508 | | | |
| Resource Industries | 596 | | | | | 394 | | | | | 412 | | | | | 651 | | | | | 2,053 | | | | | 127 | | | | | 2,180 | | | |
| Energy & Transportation | 1,705 | | | | | 265 | | | | | 1,353 | | | | | 707 | | | | | 4,030 | | | | | 781 | | | | | 4,811 | | | |
| All Other Segment | 5 | | | | | — | | | | | 9 | | | | | 18 | | | | | 32 | | | | | 105 | | | | | 137 | | | |
| Corporate Items and Eliminations | (27) | | | | | 1 | | | | | (2) | | | | | (1) | | | | | (29) | | | | | (1,037) | | | | | (1,066) | | | |
| Machinery, Energy & Transportation | 4,174 | | | | | 984 | | | | | 2,620 | | | | | 2,792 | | | | | 10,570 | | | | | — | | | | | 10,570 | | | |
| | | | | | | | | | | | | | | | | | | | | | | | | | | |
| Financial Products Segment | 464 | | | | | 64 | | | | | 94 | | | | | 121 | | | | | 743 | | | | | — | | | | | 743 | | | |
| Corporate Items and Eliminations | (41) | | | | | (10) | | | | | (10) | | | | | (17) | | | | | (78) | | | | | — | | | | | (78) | | | |
| Financial Products Revenues | 423 | | | | | 54 | | | | | 84 | | | | | 104 | | | | | 665 | | | | | — | | | | | 665 | | | |
| | | | | | | | | | | | | | | | | | | | | | | | | | | |
| Consolidated Sales and Revenues | $ | 4,597 | | | | | $ | 1,038 | | | | | $ | 2,704 | | | | | $ | 2,896 | | | | | $ | 11,235 | | | | | $ | — | | | | | $ | 11,235 | | | |
| | | | | | | | | | | | | | | | | | | | | | | | | | | |
Consolidated Operating Profit
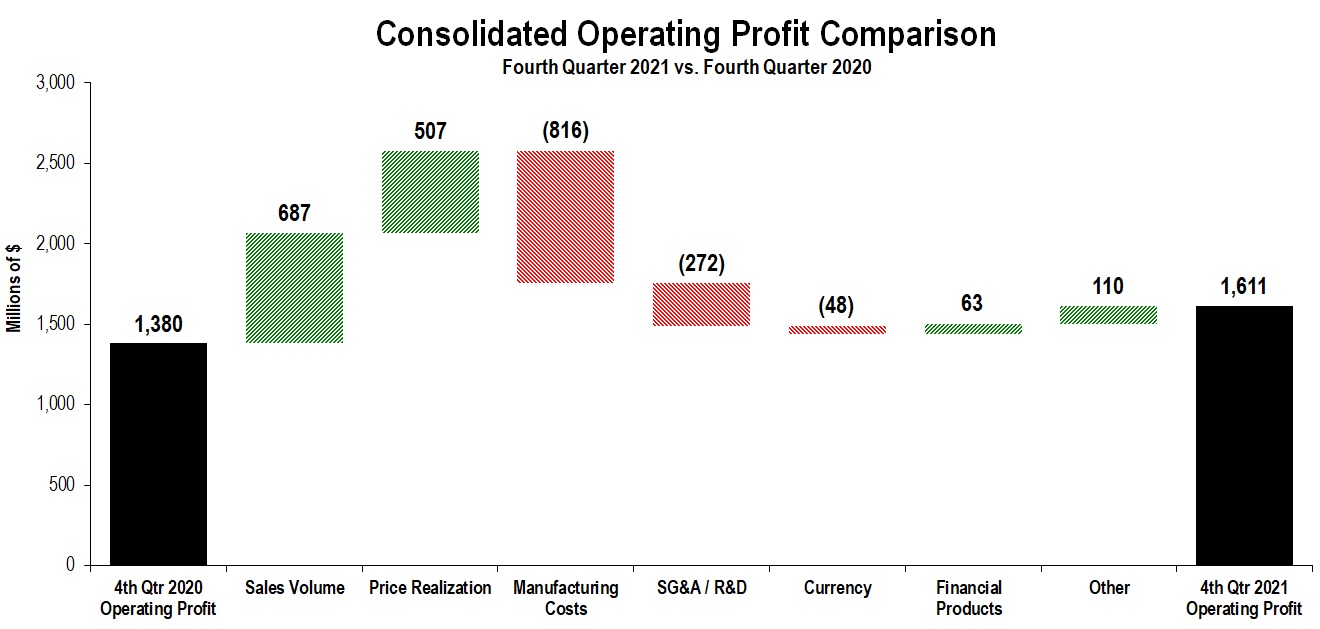
The chart above graphically illustrates reasons for the change in consolidated operating profit between the fourth quarter of 2020 (at left) and the fourth quarter of 2021 (at right). Caterpillar management utilizes these charts internally to visually communicate with the company’s Board of Directors and employees. The bar titled Other includes consolidating adjustments and Machinery, Energy & Transportation’s other operating (income) expenses.
Operating profit for the fourth quarter of 2021 was $1.611 billion, an increase of $231 million, or 17%, compared with $1.380 billion in the fourth quarter of 2020. Higher manufacturing costs and selling, general and administrative (SG&A) and research and development (R&D) expenses were more than offset by higher sales volume, favorable price realization and net restructuring income due to a gain on the sale of a facility.
Unfavorable manufacturing costs primarily reflected higher freight and material costs.
The increase in SG&A/R&D expenses was driven by higher short-term incentive compensation expense, which was reinstated in 2021, higher labor costs due to increased headcount and investments aligned with the company's strategy for profitable growth, including acquisition-related expenses. | | | | | | | | | | | | | | | | | | | | | | | |
| Profit (Loss) by Segment |
| (Millions of dollars) | Fourth Quarter 2021 | | Fourth Quarter 2020 | | $
Change | | % Change |
| Construction Industries | $ | 788 | | | $ | 630 | | | $ | 158 | | | 25 | % |
| Resource Industries | 305 | | | 273 | | | 32 | | | 12 | % |
| Energy & Transportation | 675 | | | 687 | | | (12) | | | (2 | %) |
| All Other Segment | (12) | | | (3) | | | (9) | | | (300 | %) |
| Corporate Items and Eliminations | (281) | | | (281) | | | — | | | |
| Machinery, Energy & Transportation | 1,475 | | | 1,306 | | | 169 | | | 13 | % |
| | | | | | | |
| Financial Products Segment | 248 | | | 195 | | | 53 | | | 27 | % |
| Corporate Items and Eliminations | (37) | | | (47) | | | 10 | | | |
| Financial Products | 211 | | | 148 | | | 63 | | | 43 | % |
| | | | | | | |
| Consolidating Adjustments | (75) | | | (74) | | | (1) | | | |
| | | | | | | |
| Consolidated Operating Profit | $ | 1,611 | | | $ | 1,380 | | | $ | 231 | | | 17 | % |
| | | | | | | |
Other Profit/Loss and Tax Items
•Other income (expense) in the fourth quarter of 2021 was income of $1.063 billion, compared with expense of $309 million in the fourth quarter of 2020. The change was primarily driven by mark-to-market gains for remeasurement of pension and OPEB plans in the fourth quarter of 2021, compared with mark-to-market losses in the fourth quarter of 2020 (see a reconciliation of GAAP to non-GAAP financial measures in the appendix on page 14).
•The provision for income taxes for the fourth quarter of 2021 reflected an annual effective tax rate of approximately 23%, compared with approximately 28% for the fourth quarter of 2020, excluding the discrete items discussed below. The decrease from 2020 was primarily related to changes in the geographic mix of profits from a tax perspective.
In the fourth quarter of 2021, the company recorded a $118 million tax benefit due to the change from the third-quarter estimated annual tax rate of 25%, compared to a $96 million benefit for the reduction in the annual effective tax rate in the fourth quarter of 2020. In addition, the company recorded a tax charge of $190 million related to $833 million of pension and OPEB mark-to-market gains in the fourth quarter of 2021, compared to a tax benefit of $92 million related to $438 million of mark-to-market losses in the fourth quarter of 2020. Finally, the company recorded a tax benefit of $40 million in the fourth quarter of 2021 primarily related to recognition of U.S. capital losses compared to other discrete tax benefits of $28 million in the fourth quarter of 2020.
| | | | | | | | | | | | | | | | | | | | | | | | | | | | | | | | | | | | | | | | | | | | | | | | | | |
| CONSTRUCTION INDUSTRIES |
| (Millions of dollars) | | | | | | | | | | | | | | | | |
| Segment Sales | | | | | | | | | | | | | | |
| | Fourth Quarter 2020 | | Sales Volume | | Price Realization | | Currency | | Inter-Segment | | Fourth Quarter 2021 | | $
Change | | %
Change |
| Total Sales | | $ | 4,508 | | | $ | 929 | | | $ | 299 | | | $ | (23) | | | $ | 23 | | | $ | 5,736 | | | $ | 1,228 | | | 27 | % |
| | | | | | | | | | | | | | | | |
| Sales by Geographic Region | | | | | | | | |
| | Fourth Quarter 2021 | | Fourth Quarter 2020 | | $
Change | | %
Change | | | | | | | | |
| North America | | $ | 2,635 | | | $ | 1,895 | | | $ | 740 | | | 39 | % | | | | | | | | |
| Latin America | | 563 | | | 324 | | | 239 | | | 74 | % | | | | | | | | |
| EAME | | 1,246 | | | 848 | | | 398 | | | 47 | % | | | | | | | | |
| Asia/Pacific | | 1,245 | | | 1,417 | | | (172) | | | (12 | %) | | | | | | | | |
| External Sales | | 5,689 | | | 4,484 | | | 1,205 | | | 27 | % | | | | | | | | |
| Inter-segment | | 47 | | | 24 | | | 23 | | | 96 | % | | | | | | | | |
| Total Sales | | $ | 5,736 | | | $ | 4,508 | | | $ | 1,228 | | | 27 | % | | | | | | | | |
| | | | | | | | | | | | | | | | |
| Segment Profit | | | | | | | | |
| | Fourth Quarter 2021 | | Fourth Quarter 2020 | |
Change | | %
Change | | | | | | | | |
| Segment Profit | | $ | 788 | | | $ | 630 | | | $ | 158 | | | 25 | % | | | | | | | | |
| Segment Profit Margin | | 13.7 | % | | 14.0 | % | | (0.3 | pts) | | | | | | | | | | |
| | | | | | | | | | | | | | | | |
Construction Industries’ total sales were $5.736 billion in the fourth quarter of 2021, an increase of $1.228 billion, or 27%, compared with $4.508 billion in the fourth quarter of 2020. The increase was due to higher sales volume, driven by the impact from changes in dealer inventories and higher end-user demand, along with favorable price realization. Dealers decreased inventories more during the fourth quarter of 2020 than during the fourth quarter of 2021.
▪In North America, sales increased due to higher sales volume and favorable price realization. Higher sales volume was driven by the impact from changes in dealer inventories as dealers decreased inventories more during the fourth quarter of 2020 than during the fourth quarter of 2021.
▪Sales increased in Latin America primarily due to higher sales volume and favorable price realization. Higher sales volume was driven by higher end-user demand and the impact from changes in dealer inventories. Dealers increased inventories during the fourth quarter of 2021, compared to a decrease during the fourth quarter of 2020.
▪In EAME, sales increased due to higher sales volume from higher end-user demand and the impact of changes in dealer inventories. Dealers decreased inventories more during the fourth quarter of 2020 than during the fourth quarter of 2021.
▪Sales decreased in Asia/Pacific primarily due to lower sales volume, partially offset by favorable price realization. Decreased sales volume reflected lower end-user demand, partially offset by the impact from changes in dealer inventories. Lower sales in China, driven by lower end-user demand, were partially offset by higher sales across most of the rest of the region. Dealers decreased inventories during the fourth quarter of 2020, compared to an increase during the fourth quarter of 2021.
Construction Industries’ profit was $788 million in the fourth quarter of 2021, an increase of $158 million, or 25%, compared with $630 million in the fourth quarter of 2020. Higher manufacturing costs and SG&A/R&D expenses
were more than offset by higher sales volume and favorable price realization. Unfavorable manufacturing costs primarily reflected higher freight, material and labor costs.
The increase in SG&A/R&D expenses was driven by higher short-term incentive compensation expense.
| | | | | | | | | | | | | | | | | | | | | | | | | | | | | | | | | | | | | | | | | | | | | | | | | | |
| RESOURCE INDUSTRIES |
| (Millions of dollars) | | | | | | | | | | | | | | | | |
| Segment Sales | | | | | | | | | | | | | | |
| | Fourth Quarter 2020 | | Sales Volume | | Price Realization | | Currency | | Inter-Segment | | Fourth Quarter 2021 | | $
Change | | %
Change |
| Total Sales | | $ | 2,180 | | | $ | 467 | | | $ | 121 | | | $ | 2 | | | $ | (8) | | | $ | 2,762 | | | $ | 582 | | | 27 | % |
| | | | | | | | | | | | | | | | |
| Sales by Geographic Region | | | | | | | | |
| | Fourth Quarter 2021 | | Fourth Quarter 2020 | | $
Change | | %
Change | | | | | | | | |
| North America | | $ | 857 | | | $ | 596 | | | $ | 261 | | | 44 | % | | | | | | | | |
| Latin America | | 415 | | | 394 | | | 21 | | | 5 | % | | | | | | | | |
| EAME | | 532 | | | 412 | | | 120 | | | 29 | % | | | | | | | | |
| Asia/Pacific | | 839 | | | 651 | | | 188 | | | 29 | % | | | | | | | | |
| External Sales | | 2,643 | | | 2,053 | | | 590 | | | 29 | % | | | | | | | | |
| Inter-segment | | 119 | | | 127 | | | (8) | | | (6 | %) | | | | | | | | |
| Total Sales | | $ | 2,762 | | | $ | 2,180 | | | $ | 582 | | | 27 | % | | | | | | | | |
| | | | | | | | | | | | | | | | |
| Segment Profit | | | | | | | | |
| | Fourth Quarter 2021 | | Fourth Quarter 2020 | |
Change | | %
Change | | | | | | | | |
| Segment Profit | | $ | 305 | | | $ | 273 | | | $ | 32 | | | 12 | % | | | | | | | | |
| Segment Profit Margin | | 11.0 | % | | 12.5 | % | | (1.5 | pts) | | | | | | | | | | |
| | | | | | | | | | | | | | | | |
Resource Industries’ total sales were $2.762 billion in the fourth quarter of 2021, an increase of $582 million, or 27%, compared with $2.180 billion in the fourth quarter of 2020. The increase was primarily due to higher sales volume, driven by higher end-user demand for equipment and aftermarket parts, and favorable price realization. End-user demand was higher in mining as well as heavy construction and quarry and aggregates.
Resource Industries’ profit was $305 million in the fourth quarter of 2021, an increase of $32 million, or 12%, compared with $273 million in the fourth quarter of 2020. Increased manufacturing costs and SG&A/R&D expenses were more than offset by higher sales volume and favorable price realization. Unfavorable manufacturing costs primarily reflected higher freight and material costs.
The increase in SG&A/R&D expenses was driven by investments aligned with growth initiatives, primarily labor, and higher short-term incentive compensation expense.
| | | | | | | | | | | | | | | | | | | | | | | | | | | | | | | | | | | | | | | | | | | | | | | | | | |
| ENERGY & TRANSPORTATION |
| (Millions of dollars) | | | | | | | | | | | | | | | | |
| Segment Sales | | | | | | | | | | | | | | |
| | Fourth Quarter 2020 | | Sales Volume | | Price Realization | | Currency | | Inter-Segment | | Fourth Quarter 2021 | | $
Change | | %
Change |
| Total Sales | | $ | 4,811 | | | $ | 640 | | | $ | 88 | | | $ | (7) | | | $ | 196 | | | $ | 5,728 | | | $ | 917 | | | 19 | % |
| | | | | | | | | | | | | | | | |
| Sales by Application | | | | | | | | |
| | Fourth Quarter 2021 | | Fourth Quarter 2020 | | $
Change | | %
Change | | | | | | | | |
| Oil and Gas | | $ | 1,320 | | | $ | 1,079 | | | $ | 241 | | | 22 | % | | | | | | | | |
| Power Generation | | 1,267 | | | 1,180 | | | 87 | | | 7 | % | | | | | | | | |
| Industrial | | 952 | | | 736 | | | 216 | | | 29 | % | | | | | | | | |
| Transportation | | 1,212 | | | 1,035 | | | 177 | | | 17 | % | | | | | | | | |
| External Sales | | 4,751 | | | 4,030 | | | 721 | | | 18 | % | | | | | | | | |
| Inter-segment | | 977 | | | 781 | | | 196 | | | 25 | % | | | | | | | | |
| Total Sales | | $ | 5,728 | | | $ | 4,811 | | | $ | 917 | | | 19 | % | | | | | | | | |
| | | | | | | | | | | | | | | | |
| Segment Profit | | | | | | | | |
| | Fourth Quarter 2021 | | Fourth Quarter 2020 | |
Change | | %
Change | | | | | | | | |
| Segment Profit | | $ | 675 | | | $ | 687 | | | $ | (12) | | | (2 | %) | | | | | | | | |
| Segment Profit Margin | | 11.8 | % | | 14.3 | % | | (2.5 | pts) | | | | | | | | | | |
| | | | | | | | | | | | | | | | |
Energy & Transportation’s total sales were $5.728 billion in the fourth quarter of 2021, an increase of $917 million, or 19%, compared with $4.811 billion in the fourth quarter of 2020. Sales increased across all applications and inter-segment sales.
▪Oil and Gas – Sales increased for reciprocating engines aftermarket parts across all regions, turbines and turbine-related services and reciprocating engines used in gas compression.
▪Power Generation – Sales rose due to higher sales volume in reciprocating engines aftermarket parts and small reciprocating engine applications.
▪Industrial – Sales were up due to higher demand across all regions.
▪Transportation – Sales increased due to higher deliveries of locomotives, which were primarily international, and rail services.
Energy & Transportation’s profit was $675 million in the fourth quarter of 2021, a decrease of $12 million, or 2%, compared with $687 million in the fourth quarter of 2020. The decrease was due to unfavorable manufacturing costs and higher SG&A/R&D expenses, mostly offset by higher sales volume and favorable price realization. Unfavorable manufacturing costs reflected higher freight and material costs, as well as increased period manufacturing costs.
Both SG&A/R&D expenses and period manufacturing costs increased primarily due to higher short-term incentive compensation expense and investments aligned with growth initiatives, including acquisition-related expenses.
| | | | | | | | | | | | | | | | | | | | | | | | | | | | | | | | | | | | | | | | | | | | | | | | | | |
| FINANCIAL PRODUCTS SEGMENT |
| (Millions of dollars) | | | | | | | | | | | | | | | | |
| Revenues by Geographic Region | | | | | | | | |
| | Fourth Quarter 2021 | | Fourth Quarter 2020 | | $
Change | | %
Change | | | | | | | | |
| North America | | $ | 493 | | | $ | 464 | | | $ | 29 | | | 6 | % | | | | | | | | |
| Latin America | | 70 | | | 64 | | | 6 | | | 9 | % | | | | | | | | |
| EAME | | 101 | | | 94 | | | 7 | | | 7 | % | | | | | | | | |
| Asia/Pacific | | 112 | | | 121 | | | (9) | | | (7 | %) | | | | | | | | |
| Total Revenues | | $ | 776 | | | $ | 743 | | | $ | 33 | | | 4 | % | | | | | | | | |
| | | | | | | | | | | | | | | | |
| Segment Profit | | | | | | | | |
| | Fourth Quarter 2021 | | Fourth Quarter 2020 | |
Change | | %
Change | | | | | | | | |
| Segment Profit | | $ | 248 | | | $ | 195 | | | $ | 53 | | | 27 | % | | | | | | | | |
| | | | | | | | | | | | | | | | |
Financial Products’ segment revenues were $776 million in the fourth quarter of 2021, an increase of $33 million, or 4%, from the fourth quarter of 2020.
Financial Products’ segment profit was $248 million in the fourth quarter of 2021, an increase of $53 million, or 27%, compared with $195 million in the fourth quarter of 2020. The increase was mainly due to a favorable impact from returned or repossessed equipment and lower provision for credit losses at Cat Financial, partially offset by an increase in SG&A expenses primarily due to higher short-term incentive compensation expense.
At the end of 2021, past dues at Cat Financial were 1.95%, compared with 3.49% at the end of 2020. Past dues decreased across all portfolio segments as global markets generally improved. Write-offs, net of recoveries, were $205 million for 2021, compared with $222 million for 2020. As of December 31, 2021, Cat Financial's allowance for credit losses totaled $337 million, or 1.22% of finance receivables, compared with $479 million, or 1.77% of finance receivables at December 31, 2020.
Corporate Items and Eliminations
Expense for corporate items and eliminations was $318 million in the fourth quarter of 2021, about flat to the fourth quarter of 2020.
Notes
i.Glossary of terms is included on the Caterpillar website at https://investors.caterpillar.com/overview/default.aspx.
ii.End-user demand is demonstrated by the company’s Rolling 3 Month Retail Sales Statistics filed in a Form 8-K on Friday, January 28, 2022.
iii.Information on non-GAAP financial measures is included in the appendix on page 14.
iv.Some amounts within this report are rounded to the millions or billions and may not add.
v.Caterpillar will conduct a teleconference and live webcast, with a slide presentation, beginning at 7:30 a.m. Central Time on Friday, January 28, 2022, to discuss its 2021 fourth-quarter and full-year results. The accompanying slides will be available before the webcast on the Caterpillar website at https://investors.caterpillar.com/events-presentations/default.aspx.
About Caterpillar
With 2021 sales and revenues of $51.0 billion, Caterpillar Inc. is the world’s leading manufacturer of construction and mining equipment, off-highway diesel and natural gas engines, industrial gas turbines and diesel-electric locomotives. For nearly 100 years, we’ve been helping customers build a better, more sustainable world and are committed and contributing to a reduced-carbon future. Our innovative products and services, backed by our global dealer network, provide exceptional value that helps customers succeed. Caterpillar does business on every continent, principally operating through three primary segments – Construction Industries, Resource Industries and Energy & Transportation – and providing financing and related services through our Financial Products segment. Visit us at caterpillar.com or join the conversation on our social media channels at caterpillar.com/en/news/social-media.html.
Caterpillar’s latest financial results are also available online:
https://investors.caterpillar.com/overview/default.aspx
https://investors.caterpillar.com/financials/quarterly-results/default.aspx (live broadcast/replays of quarterly conference call)
Caterpillar investor relations contact: Jennifer Driscoll, +1 224-551-4382 or [email protected]
Forward-Looking Statements
Certain statements in this press release relate to future events and expectations and are forward-looking statements within the meaning of the Private Securities Litigation Reform Act of 1995. Words such as “believe,” “estimate,” “will be,” “will,” “would,” “expect,” “anticipate,” “plan,” “forecast,” “target,” “guide,” “project,” “intend,” “could,” “should” or other similar words or expressions often identify forward-looking statements. All statements other than statements of historical fact are forward-looking statements, including, without limitation, statements regarding our outlook, projections, forecasts or trend descriptions. These statements do not guarantee future performance and speak only as of the date they are made, and we do not undertake to update our forward-looking statements.
Caterpillar’s actual results may differ materially from those described or implied in our forward-looking statements based on a number of factors, including, but not limited to: (i) global and regional economic conditions and economic conditions in the industries we serve; (ii) commodity price changes, material price increases, fluctuations in demand for our products or significant shortages of material; (iii) government monetary or fiscal policies; (iv) political and economic risks, commercial instability and events beyond our control in the countries in which we operate; (v) international trade policies and their impact on demand for our products and our competitive position, including the imposition of new tariffs or changes in existing tariff rates; (vi) our ability to develop, produce and market quality products that meet our customers’ needs; (vii) the impact of the highly competitive environment in which we operate on our sales and pricing; (viii) information technology security threats and computer crime; (ix) inventory management decisions and sourcing practices of our dealers and our OEM customers; (x) a failure to realize, or a delay in realizing, all of the anticipated benefits of our acquisitions, joint ventures or divestitures; (xi) union disputes or other employee relations issues; (xii) adverse effects of unexpected events; (xiii) disruptions or volatility in global financial markets limiting our sources of liquidity or the liquidity of our customers, dealers and suppliers; (xiv) failure to maintain our credit ratings and potential resulting increases to our cost of borrowing and adverse effects on our cost of funds, liquidity, competitive position and access to capital markets; (xv) our Financial Products segment’s risks associated with the financial services industry; (xvi) changes in interest rates or market liquidity conditions; (xvii) an increase in delinquencies, repossessions or net losses of Cat Financial’s customers; (xviii) currency fluctuations; (xix) our or Cat Financial’s compliance with financial and other restrictive covenants in debt agreements; (xx) increased pension plan funding obligations; (xxi) alleged or actual violations of trade or anti-corruption laws and regulations; (xxii) additional tax expense or exposure, including the impact of U.S. tax reform; (xxiii) significant legal proceedings, claims, lawsuits or government investigations; (xxiv) new regulations or changes in financial services regulations; (xxv) compliance with environmental laws and regulations; (xxvi) the duration and geographic spread of, business disruptions caused by, and the overall global economic impact of, the COVID-19 pandemic; and (xxvii) other factors described in more detail in Caterpillar’s Forms 10-Q, 10-K and other filings with the Securities and Exchange Commission.
APPENDIX
NON-GAAP FINANCIAL MEASURES
The following definitions are provided for the non-GAAP financial measures. These non-GAAP financial measures have no standardized meaning prescribed by U.S. GAAP and therefore are unlikely to be comparable to the calculation of similar measures for other companies. Management does not intend these items to be considered in isolation or as a substitute for the related GAAP measures.
The company believes it is important to separately quantify the profit impact of two significant items in order for the company’s results to be meaningful to readers. These items consist of (i) pension and OPEB mark-to-market gains/losses resulting from plan remeasurements and (ii) restructuring income/costs, which were incurred to generate longer-term benefits. The company does not consider these items indicative of earnings from ongoing business activities and believes the non-GAAP measure provides investors with useful perspective on underlying business results and trends and aids with assessing the company’s period-over-period results.
Reconciliations of adjusted results to the most directly comparable GAAP measure are as follows:
| | | | | | | | | | | | | | | | | | | | | | | | | | | | | | | | | | | | | | | | | | | | |
| (Dollars in millions except per share data) | | Operating Profit | | Operating Profit Margin | | Profit Before Taxes | | Provision (Benefit) for Income Taxes | | Effective Tax Rate | | Profit | | Profit per Share |
| | | | | | | | | | | | | | |
| Three Months Ended December 31, 2021 - U.S. GAAP | | $ | 1,611 | | | 11.7 | % | | $ | 2,562 | | | $ | 429 | | | 16.7 | % | | $ | 2,120 | | | $ | 3.91 | |
| Pension/OPEB mark-to-market (gains) losses | | — | | | — | % | | (833) | | | (190) | | | 22.8 | % | | (643) | | | $ | (1.19) | |
| Restructuring (income) costs | | (34) | | | (0.2) | % | | (34) | | | (15) | | | 44.1 | % | | (19) | | | $ | (0.03) | |
| Three Months Ended December 31, 2021 - Adjusted | | $ | 1,577 | | | 11.4 | % | | $ | 1,695 | | | $ | 224 | | | 13.2 | % | | $ | 1,458 | | | $ | 2.69 | |
| | | | | | | | | | | | | | |
| Three Months Ended December 31, 2020 - U.S. GAAP | | $ | 1,380 | | | 12.3 | % | | $ | 941 | | | $ | 167 | | | 17.7 | % | | $ | 780 | | | $ | 1.42 | |
| Pension/OPEB mark-to-market (gains) losses | | — | | | — | % | | 438 | | | 92 | | | 21.0 | % | | 346 | | | $ | 0.63 | |
| Restructuring (income) costs | | 58 | | | 0.5 | % | | 58 | | | 18 | | | 31.0 | % | | 40 | | | $ | 0.07 | |
| Three Months Ended December 31, 2020 - Adjusted | | $ | 1,438 | | | 12.8 | % | | $ | 1,437 | | | $ | 277 | | | 19.3 | % | | $ | 1,166 | | | $ | 2.12 | |
| | | | | | | | | | | | | | |
| Twelve Months Ended December 31, 2021 - U.S. GAAP | | $ | 6,878 | | | 13.5 | % | | $ | 8,204 | | | $ | 1,742 | | | 21.2 | % | | $ | 6,489 | | | $ | 11.83 | |
| Pension/OPEB mark-to-market (gains) losses | | — | | | — | % | | (833) | | | (190) | | | 22.8 | % | | (643) | | | $ | (1.17) | |
| Restructuring (income) costs | | 90 | | | 0.2 | % | | 90 | | | 4 | | | 4.4 | % | | 86 | | | $ | 0.15 | |
| Twelve Months Ended December 31, 2021 - Adjusted | | $ | 6,968 | | | 13.7 | % | | $ | 7,461 | | | $ | 1,556 | | | 20.9 | % | | $ | 5,932 | | | $ | 10.81 | |
| | | | | | | | | | | | | | |
| Twelve Months Ended December 31, 2020 - U.S. GAAP | | $ | 4,553 | | | 10.9 | % | | $ | 3,995 | | | $ | 1,006 | | | 25.2 | % | | $ | 2,998 | | | $ | 5.46 | |
| Pension/OPEB mark-to-market (gains) losses | | — | | | — | % | | 383 | | | 82 | | | 21.4 | % | | 301 | | | $ | 0.55 | |
| Restructuring (income) costs | | 354 | | | 0.8 | % | | 354 | | | 53 | | | 15.0 | % | | 301 | | | $ | 0.55 | |
| Twelve Months Ended December 31, 2020 - Adjusted | | $ | 4,907 | | | 11.8 | % | | $ | 4,732 | | | $ | 1,141 | | | 24.1 | % | | $ | 3,600 | | | $ | 6.56 | |
Supplemental Consolidating Data
The company is providing supplemental consolidating data for the purpose of additional analysis. The data has been grouped as follows:
Consolidated – Caterpillar Inc. and its subsidiaries.
Machinery, Energy & Transportation (ME&T) – The company defines ME&T as it is presented in the supplemental data as Caterpillar Inc. and its subsidiaries, excluding Financial Products. ME&T’s information relates to the design, manufacturing and marketing of its products.
Financial Products – The company defines Financial Products as it is presented in the supplemental data as its finance and insurance subsidiaries, primarily Caterpillar Financial Services Corporation (Cat Financial) and Caterpillar Insurance Holdings Inc. (Insurance Services). Financial Products’ information relates to the financing to customers and dealers for the purchase and lease of Caterpillar and other equipment.
Consolidating Adjustments – Eliminations of transactions between ME&T and Financial Products.
The nature of the ME&T and Financial Products businesses is different, especially with regard to the financial position and cash flow items. Caterpillar management utilizes this presentation internally to highlight these differences. The company believes this presentation will assist readers in understanding its business.
Pages 16 to 26 reconcile ME&T and Financial Products to Caterpillar Inc. consolidated financial information.
Caterpillar Inc.
Condensed Consolidated Statement of Results of Operations
(Unaudited)
(Dollars in millions except per share data)
| | | | | | | | | | | | | | | | | | | | | | | |
| Three Months Ended December 31, | | Twelve Months Ended December 31, |
| 2021 | | 2020 | | 2021 | | 2020 |
| Sales and revenues: | | | | | | | |
| Sales of Machinery, Energy & Transportation | $ | 13,097 | | | $ | 10,570 | | | $ | 48,188 | | | $ | 39,022 | |
| Revenues of Financial Products | 701 | | | 665 | | | 2,783 | | | 2,726 | |
| Total sales and revenues | 13,798 | | | 11,235 | | | 50,971 | | | 41,748 | |
| | | | | | | |
| Operating costs: | | | | | | | |
| Cost of goods sold | 10,003 | | | 7,784 | | | 35,513 | | | 29,082 | |
| Selling, general and administrative expenses | 1,422 | | | 1,216 | | | 5,365 | | | 4,642 | |
| Research and development expenses | 439 | | | 374 | | | 1,686 | | | 1,415 | |
| Interest expense of Financial Products | 103 | | | 128 | | | 455 | | | 589 | |
| Other operating (income) expenses | 220 | | | 353 | | | 1,074 | | | 1,467 | |
| Total operating costs | 12,187 | | | 9,855 | | | 44,093 | | | 37,195 | |
| | | | | | | |
| Operating profit | 1,611 | | | 1,380 | | | 6,878 | | | 4,553 | |
| | | | | | | |
| Interest expense excluding Financial Products | 112 | | | 130 | | | 488 | | | 514 | |
| Other income (expense) | 1,063 | | | (309) | | | 1,814 | | | (44) | |
| | | | | | | |
| Consolidated profit before taxes | 2,562 | | | 941 | | | 8,204 | | | 3,995 | |
| | | | | | | |
| Provision (benefit) for income taxes | 429 | | | 167 | | | 1,742 | | | 1,006 | |
| Profit of consolidated companies | 2,133 | | | 774 | | | 6,462 | | | 2,989 | |
| | | | | | | |
| Equity in profit (loss) of unconsolidated affiliated companies | (13) | | | 6 | | | 31 | | | 14 | |
| | | | | | | |
| Profit of consolidated and affiliated companies | 2,120 | | | 780 | | | 6,493 | | | 3,003 | |
| | | | | | | |
| Less: Profit (loss) attributable to noncontrolling interests | — | | | — | | | 4 | | | 5 | |
| | | | | | | |
Profit 1 | $ | 2,120 | | | $ | 780 | | | $ | 6,489 | | | $ | 2,998 | |
| | | | | | | |
| | | | | | | |
| Profit per common share | $ | 3.94 | | | $ | 1.43 | | | $ | 11.93 | | | $ | 5.51 | |
Profit per common share — diluted 2 | $ | 3.91 | | | $ | 1.42 | | | $ | 11.83 | | | $ | 5.46 | |
| | | | | | | |
| Weighted-average common shares outstanding (millions) | | | | | | | |
| – Basic | 538.7 | | | 544.5 | | | 544.0 | | | 544.1 | |
– Diluted 2 | 542.6 | | | 549.5 | | | 548.5 | | | 548.6 | |
| | | | | | | |
| | | | | |
| 1 | Profit attributable to common shareholders. |
| 2 | Diluted by assumed exercise of stock-based compensation awards using the treasury stock method. |
Caterpillar Inc.
Condensed Consolidated Statement of Financial Position
(Unaudited)
(Millions of dollars)
| | | | | | | | | | | |
| December 31,
2021 | | December 31,
2020 |
| Assets | | | |
| Current assets: | | | |
| Cash and cash equivalents | $ | 9,254 | | | $ | 9,352 | |
| Receivables – trade and other | 8,477 | | | 7,317 | |
| Receivables – finance | 8,898 | | | 9,463 | |
| Prepaid expenses and other current assets | 2,788 | | | 1,930 | |
| Inventories | 14,038 | | | 11,402 | |
| Total current assets | 43,455 | | | 39,464 | |
| | | |
| Property, plant and equipment – net | 12,090 | | | 12,401 | |
| Long-term receivables – trade and other | 1,204 | | | 1,185 | |
| Long-term receivables – finance | 12,707 | | | 12,222 | |
| Noncurrent deferred and refundable income taxes | 1,840 | | | 1,523 | |
| Intangible assets | 1,042 | | | 1,308 | |
| Goodwill | 6,324 | | | 6,394 | |
| Other assets | 4,131 | | | 3,827 | |
| Total assets | $ | 82,793 | | | $ | 78,324 | |
| | | |
| Liabilities | | | |
| Current liabilities: | | | |
| Short-term borrowings: | | | |
| -- Machinery, Energy & Transportation | $ | 9 | | | $ | 10 | |
| -- Financial Products | 5,395 | | | 2,005 | |
| Accounts payable | 8,154 | | | 6,128 | |
| Accrued expenses | 3,757 | | | 3,642 | |
| Accrued wages, salaries and employee benefits | 2,242 | | | 1,096 | |
| Customer advances | 1,087 | | | 1,108 | |
| Dividends payable | 595 | | | 562 | |
| Other current liabilities | 2,256 | | | 2,017 | |
| Long-term debt due within one year: | | | |
| -- Machinery, Energy & Transportation | 45 | | | 1,420 | |
| -- Financial Products | 6,307 | | | 7,729 | |
| Total current liabilities | 29,847 | | | 25,717 | |
| | | |
| Long-term debt due after one year: | | | |
| -- Machinery, Energy & Transportation | 9,746 | | | 9,749 | |
| -- Financial Products | 16,287 | | | 16,250 | |
| Liability for postemployment benefits | 5,592 | | | 6,872 | |
| Other liabilities | 4,805 | | | 4,358 | |
| Total liabilities | 66,277 | | | 62,946 | |
| | | |
| Shareholders’ equity | | | |
| Common stock | 6,398 | | | 6,230 | |
| Treasury stock | (27,643) | | | (25,178) | |
| Profit employed in the business | 39,282 | | | 35,167 | |
| Accumulated other comprehensive income (loss) | (1,553) | | | (888) | |
| Noncontrolling interests | 32 | | | 47 | |
| Total shareholders’ equity | 16,516 | | | 15,378 | |
| Total liabilities and shareholders’ equity | $ | 82,793 | | | $ | 78,324 | |
Caterpillar Inc.
Condensed Consolidated Statement of Cash Flow
(Unaudited)
(Millions of dollars)
| | | | | | | | | | | |
| Twelve Months Ended
December 31, |
| 2021 | | 2020 |
| Cash flow from operating activities: | | | |
| Profit of consolidated and affiliated companies | $ | 6,493 | | | $ | 3,003 | |
| Adjustments for non-cash items: | | | |
| Depreciation and amortization | 2,352 | | | 2,432 | |
| Actuarial (gain) loss on pension and postretirement benefits | (833) | | | 383 | |
| Provision (benefit) for deferred income taxes | (383) | | | (74) | |
| | | |
| Other | 216 | | | 1,000 | |
| Changes in assets and liabilities, net of acquisitions and divestitures: | | | |
| Receivables – trade and other | (1,259) | | | 1,442 | |
| Inventories | (2,586) | | | (34) | |
| Accounts payable | 2,041 | | | 98 | |
| Accrued expenses | 196 | | | (366) | |
| Accrued wages, salaries and employee benefits | 1,107 | | | (544) | |
| Customer advances | 34 | | | (126) | |
| Other assets – net | (97) | | | (201) | |
| Other liabilities – net | (83) | | | (686) | |
| Net cash provided by (used for) operating activities | 7,198 | | | 6,327 | |
| Cash flow from investing activities: | | | |
| Capital expenditures – excluding equipment leased to others | (1,093) | | | (978) | |
| Expenditures for equipment leased to others | (1,379) | | | (1,137) | |
| Proceeds from disposals of leased assets and property, plant and equipment | 1,265 | | | 772 | |
| Additions to finance receivables | (13,002) | | | (12,385) | |
| Collections of finance receivables | 12,430 | | | 12,646 | |
| Proceeds from sale of finance receivables | 51 | | | 42 | |
| Investments and acquisitions (net of cash acquired) | (490) | | | (111) | |
| Proceeds from sale of businesses and investments (net of cash sold) | 36 | | | 25 | |
| Proceeds from sale of securities | 785 | | | 345 | |
| Investments in securities | (1,766) | | | (638) | |
| Other – net | 79 | | | (66) | |
| Net cash provided by (used for) investing activities | (3,084) | | | (1,485) | |
| Cash flow from financing activities: | | | |
| Dividends paid | (2,332) | | | (2,243) | |
| Common stock issued, including treasury shares reissued | 135 | | | 229 | |
| Common shares repurchased | (2,668) | | | (1,130) | |
| | | |
| Proceeds from debt issued (original maturities greater than three months) | 6,989 | | | 10,431 | |
| Payments on debt (original maturities greater than three months) | (9,796) | | | (8,237) | |
| Short-term borrowings – net (original maturities three months or less) | 3,488 | | | (2,804) | |
| Other – net | (4) | | | (1) | |
| Net cash provided by (used for) financing activities | (4,188) | | | (3,755) | |
| Effect of exchange rate changes on cash | (29) | | | (13) | |
| Increase (decrease) in cash, cash equivalents and restricted cash | (103) | | | 1,074 | |
| Cash, cash equivalents and restricted cash at beginning of period | 9,366 | | | 8,292 | |
| Cash, cash equivalents and restricted cash at end of period | $ | 9,263 | | | $ | 9,366 | |
| | | |
| | | |
| | | |
| | |
| Cash equivalents primarily represent short-term, highly liquid investments with original maturities of generally three months or less. |
Caterpillar Inc.
Supplemental Data for Results of Operations
For the Three Months Ended December 31, 2021
(Unaudited)
(Millions of dollars)
| | | | | | | | | | | | | | | | | | | | | | | | | | |
| | | | Supplemental Consolidating Data | |
| | Consolidated | | Machinery, Energy & Transportation | | Financial
Products | | Consolidating
Adjustments | |
| Sales and revenues: | | | | | | | | |
| Sales of Machinery, Energy & Transportation | $ | 13,097 | | | $ | 13,097 | | | $ | — | | | $ | — | | |
| Revenues of Financial Products | 701 | | | — | | | 801 | | | (100) | | 1 |
| Total sales and revenues | 13,798 | | | 13,097 | | | 801 | | | (100) | | |
| | | | | | | | |
| Operating costs: | | | | | | | | |
| Cost of goods sold | 10,003 | | | 10,006 | | | — | | | (3) | | 2 |
| Selling, general and administrative expenses | 1,422 | | | 1,253 | | | 171 | | | (2) | | 2 |
| Research and development expenses | 439 | | | 439 | | | — | | | — | | |
| Interest expense of Financial Products | 103 | | | — | | | 103 | | | — | | |
| Other operating (income) expenses | 220 | | | (76) | | | 316 | | | (20) | | 2 |
| Total operating costs | 12,187 | | | 11,622 | | | 590 | | | (25) | | |
| | | | | | | | |
| Operating profit | 1,611 | | | 1,475 | | | 211 | | | (75) | | |
| | | | | | | | |
| Interest expense excluding Financial Products | 112 | | | 112 | | | — | | | — | | |
| Other income (expense) | 1,063 | | | 1,457 | | | 31 | | | (425) | | 3 |
| | | | | | | | |
| Consolidated profit before taxes | 2,562 | | | 2,820 | | | 242 | | | (500) | | |
| | | | | | | | |
| Provision (benefit) for income taxes | 429 | | | 359 | | | 70 | | | — | | |
| Profit of consolidated companies | 2,133 | | | 2,461 | | | 172 | | | (500) | | |
| | | | | | | | |
| Equity in profit (loss) of unconsolidated affiliated companies | (13) | | | (10) | | | — | | | (3) | | 4 |
| | | | | | | | |
| Profit of consolidated and affiliated companies | 2,120 | | | 2,451 | | | 172 | | | (503) | | |
| | | | | | | | |
| Less: Profit (loss) attributable to noncontrolling interests | — | | | — | | | 3 | | | (3) | | 5 |
| | | | | | | | |
Profit 6 | $ | 2,120 | | | $ | 2,451 | | | $ | 169 | | | $ | (500) | | |
| | | | | |
| 1 | Elimination of Financial Products’ revenues earned from ME&T. |
| 2 | Elimination of net expenses recorded by ME&T paid to Financial Products. |
| |
| 3 | Elimination of discount recorded by ME&T on receivables sold to Financial Products and of interest earned between ME&T and Financial Products as well as dividends paid by Financial Products to ME&T. |
| |
| 4 | Elimination of equity profit (loss) earned from Financial Products’ subsidiaries partially owned by ME&T subsidiaries. |
| 5 | Elimination of noncontrolling interest profit (loss) recorded by Financial Products for subsidiaries partially owned by ME&T subsidiaries. |
| 6 | Profit attributable to common shareholders. |
Caterpillar Inc.
Supplemental Data for Results of Operations
For the Three Months Ended December 31, 2020
(Unaudited)
(Millions of dollars)
| | | | | | | | | | | | | | | | | | | | | | | | | | |
| | | | Supplemental Consolidating Data | |
| | Consolidated | | Machinery, Energy & Transportation | | Financial
Products | | Consolidating
Adjustments | |
| Sales and revenues: | | | | | | | | |
| Sales of Machinery, Energy & Transportation | $ | 10,570 | | | $ | 10,570 | | | $ | — | | | $ | — | | |
| Revenues of Financial Products | 665 | | | — | | | 760 | | | (95) | | 1 |
| Total sales and revenues | 11,235 | | | 10,570 | | | 760 | | | (95) | | |
| | | | | | | | |
| Operating costs: | | | | | | | | |
| Cost of goods sold | 7,784 | | | 7,786 | | | — | | | (2) | | 2 |
| Selling, general and administrative expenses | 1,216 | | | 1,048 | | | 174 | | | (6) | | 2 |
| Research and development expenses | 374 | | | 374 | | | — | | | — | | |
| Interest expense of Financial Products | 128 | | | — | | | 129 | | | (1) | | 3 |
| Other operating (income) expenses | 353 | | | 56 | | | 309 | | | (12) | | 2 |
| Total operating costs | 9,855 | | | 9,264 | | | 612 | | | (21) | | |
| | | | | | | | |
| Operating profit | 1,380 | | | 1,306 | | | 148 | | | (74) | | |
| | | | | | | | |
| Interest expense excluding Financial Products | 130 | | | 130 | | | — | | | — | | |
| Other income (expense) | (309) | | | (122) | | | 39 | | | (226) | | 4 |
| | | | | | | | |
| Consolidated profit before taxes | 941 | | | 1,054 | | | 187 | | | (300) | | |
| | | | | | | | |
| Provision (benefit) for income taxes | 167 | | | 133 | | | 34 | | | — | | |
| Profit of consolidated companies | 774 | | | 921 | | | 153 | | | (300) | | |
| | | | | | | | |
| Equity in profit (loss) of unconsolidated affiliated companies | 6 | | | 11 | | | — | | | (5) | | 5 |
| | | | | | | | |
| Profit of consolidated and affiliated companies | 780 | | | 932 | | | 153 | | | (305) | | |
| | | | | | | | |
| Less: Profit (loss) attributable to noncontrolling interests | — | | | 3 | | | 2 | | | (5) | | 6 |
| | | | | | | | |
Profit 7 | $ | 780 | | | $ | 929 | | | $ | 151 | | | $ | (300) | | |
| | | | | |
| 1 | Elimination of Financial Products’ revenues earned from ME&T. |
| 2 | Elimination of net expenses recorded by ME&T paid to Financial Products. |
| 3 | Elimination of interest expense recorded between Financial Products and ME&T. |
| 4 | Elimination of discount recorded by ME&T on receivables sold to Financial Products and of interest earned between ME&T and Financial Products as well as dividends paid by Financial Products to ME&T. |
| 5 | Elimination of equity profit (loss) earned from Financial Products’ subsidiaries partially owned by ME&T subsidiaries. |
| 6 | Elimination of noncontrolling interest profit (loss) recorded by Financial Products for subsidiaries partially owned by ME&T subsidiaries. |
| 7 | Profit attributable to common shareholders. |
| |
Caterpillar Inc.
Supplemental Data for Results of Operations
For the Twelve Months Ended December 31, 2021
(Unaudited)
(Millions of dollars)
| | | | | | | | | | | | | | | | | | | | | | | | | | |
| | | | Supplemental Consolidating Data | |
| | Consolidated | | Machinery, Energy & Transportation | | Financial
Products | | Consolidating
Adjustments | |
| Sales and revenues: | | | | | | | | |
| Sales of Machinery, Energy & Transportation | $ | 48,188 | | | $ | 48,188 | | | $ | — | | | $ | — | | |
| Revenues of Financial Products | 2,783 | | | — | | | 3,172 | | | (389) | | 1 |
| Total sales and revenues | 50,971 | | | 48,188 | | | 3,172 | | | (389) | | |
| | | | | | | | |
| Operating costs: | | | | | | | | |
| Cost of goods sold | 35,513 | | | 35,521 | | | — | | | (8) | | 2 |
| Selling, general and administrative expenses | 5,365 | | | 4,724 | | | 654 | | | (13) | | 2 |
| Research and development expenses | 1,686 | | | 1,686 | | | — | | | — | | |
| Interest expense of Financial Products | 455 | | | — | | | 455 | | | — | | |
| Other operating (income) expenses | 1,074 | | | (106) | | | 1,247 | | | (67) | | 2 |
| Total operating costs | 44,093 | | | 41,825 | | | 2,356 | | | (88) | | |
| | | | | | | | |
| Operating profit | 6,878 | | | 6,363 | | | 816 | | | (301) | | |
| | | | | | | | |
| Interest expense excluding Financial Products | 488 | | | 488 | | | — | | | — | | |
| Other income (expense) | 1,814 | | | 2,276 | | | 87 | | | (549) | | 3 |
| | | | | | | | |
| Consolidated profit before taxes | 8,204 | | | 8,151 | | | 903 | | | (850) | | |
| | | | | | | | |
| Provision (benefit) for income taxes | 1,742 | | | 1,517 | | | 225 | | | — | | |
| Profit of consolidated companies | 6,462 | | | 6,634 | | | 678 | | | (850) | | |
| | | | | | | | |
| Equity in profit (loss) of unconsolidated affiliated companies | 31 | | | 42 | | | — | | | (11) | | 4 |
| | | | | | | | |
| | | | | | | | |
| Profit of consolidated and affiliated companies | 6,493 | | | 6,676 | | | 678 | | | (861) | | |
| | | | | | | | |
| Less: Profit (loss) attributable to noncontrolling interests | 4 | | | 3 | | | 12 | | | (11) | | 5 |
| | | | | | | | |
Profit 6 | $ | 6,489 | | | $ | 6,673 | | | $ | 666 | | | $ | (850) | | |
| | | | | |
| 1 | Elimination of Financial Products’ revenues earned from ME&T. |
| 2 | Elimination of net expenses recorded by ME&T paid to Financial Products. |
| |
| 3 | Elimination of discount recorded by ME&T on receivables sold to Financial Products and of interest earned between ME&T and Financial Products as well as dividends paid by Financial Products to ME&T. |
| 4 | Elimination of equity profit (loss) earned from Financial Products’ subsidiaries partially owned by ME&T subsidiaries. |
| 5 | Elimination of noncontrolling interest profit (loss) recorded by Financial Products for subsidiaries partially owned by ME&T subsidiaries. |
| 6 | Profit attributable to common shareholders. |
| |
Caterpillar Inc.
Supplemental Data for Results of Operations
For the Twelve Months Ended December 31, 2020
(Unaudited)
(Millions of dollars)
| | | | | | | | | | | | | | | | | | | | | | | | | | |
| | | | Supplemental Consolidating Data | |
| | Consolidated | | Machinery, Energy & Transportation | | Financial
Products | | Consolidating
Adjustments | |
| Sales and revenues: | | | | | | | | |
| Sales of Machinery, Energy & Transportation | $ | 39,022 | | | $ | 39,022 | | | $ | — | | | $ | — | | |
| Revenues of Financial Products | 2,726 | | | — | | | 3,110 | | | (384) | | 1 | |
| Total sales and revenues | 41,748 | | | 39,022 | | | 3,110 | | | (384) | | |
| | | | | | | | |
| Operating costs: | | | | | | | | |
| Cost of goods sold | 29,082 | | | 29,088 | | | — | | | (6) | | 2 | |
| Selling, general and administrative expenses | 4,642 | | | 3,915 | | | 746 | | | (19) | | 2 | |
| Research and development expenses | 1,415 | | | 1,415 | | | — | | | — | | |
| Interest expense of Financial Products | 589 | | | — | | | 591 | | | (2) | | 3 | |
| Other operating (income) expenses | 1,467 | | | 283 | | | 1,236 | | | (52) | | 2 | |
| Total operating costs | 37,195 | | | 34,701 | | | 2,573 | | | (79) | | |
| | | | | | | | |
| Operating profit | 4,553 | | | 4,321 | | | 537 | | | (305) | | |
| | | | | | | | |
| Interest expense excluding Financial Products | 514 | | | 513 | | | — | | | 1 | | 3 | |
| Other income (expense) | (44) | | | (62) | | | 32 | | | (14) | | 4 | |
| | | | | | | | |
| Consolidated profit before taxes | 3,995 | | | 3,746 | | | 569 | | | (320) | | |
| | | | | | | | |
| Provision (benefit) for income taxes | 1,006 | | | 853 | | | 153 | | | — | | |
| Profit of consolidated companies | 2,989 | | | 2,893 | | | 416 | | | (320) | | |
| | | | | | | | |
| Equity in profit (loss) of unconsolidated affiliated companies | 14 | | | 29 | | | — | | | (15) | | 5 | |
| | | | | | | | |
| | | | | | | | |
| Profit of consolidated and affiliated companies | 3,003 | | | 2,922 | | | 416 | | | (335) | | |
| | | | | | | | |
| Less: Profit (loss) attributable to noncontrolling interests | 5 | | | 5 | | | 15 | | | (15) | | 6 | |
| | | | | | | | |
Profit 7 | $ | 2,998 | | | $ | 2,917 | | | $ | 401 | | | $ | (320) | | |
| | | | | |
| 1 | Elimination of Financial Products’ revenues earned from ME&T. |
| 2 | Elimination of net expenses recorded by ME&T paid to Financial Products. |
| 3 | Elimination of interest expense recorded between Financial Products and ME&T. |
| 4 | Elimination of discount recorded by ME&T on receivables sold to Financial Products and of interest earned between ME&T and Financial Products as well as dividends paid by Financial Products to ME&T. |
| 5 | Elimination of equity profit (loss) earned from Financial Products’ subsidiaries partially owned by ME&T subsidiaries. |
| 6 | Elimination of noncontrolling interest profit (loss) recorded by Financial Products for subsidiaries partially owned by ME&T subsidiaries. |
| 7 | Profit attributable to common shareholders. |
| |
Caterpillar Inc.
Supplemental Data for Financial Position
At December 31, 2021
(Unaudited)
(Millions of dollars)
| | | | | | | | | | | | | | | | | | | | | | | | | | |
| | | | Supplemental Consolidating Data | |
| | Consolidated | | Machinery,
Energy &
Transportation | | Financial
Products | | Consolidating
Adjustments | |
| Assets | | | | | | | | |
| Current assets: | | | | | | | | |
| Cash and cash equivalents | $ | 9,254 | | | $ | 8,428 | | | $ | 826 | | | $ | — | | |
| Receivables – trade and other | 8,477 | | | 3,279 | | | 435 | | | 4,763 | | 1,2 |
| Receivables – finance | 8,898 | | | — | | | 13,828 | | | (4,930) | | 2 |
| | | | | | | | |
| Prepaid expenses and other current assets | 2,788 | | | 2,567 | | | 358 | | | (137) | | 3 |
| Inventories | 14,038 | | | 14,038 | | | — | | | — | | |
| Total current assets | 43,455 | | | 28,312 | | | 15,447 | | | (304) | | |
| | | | | | | | |
| Property, plant and equipment – net | 12,090 | | | 8,172 | | | 3,918 | | | — | | |
| Long-term receivables – trade and other | 1,204 | | | 375 | | | 204 | | | 625 | | 1,2 |
| Long-term receivables – finance | 12,707 | | | — | | | 13,358 | | | (651) | | 2 |
| | | | | | | | |
| | | | | | | | |
| Noncurrent deferred and refundable income taxes | 1,840 | | | 2,396 | | | 105 | | | (661) | | 4 |
| Intangible assets | 1,042 | | | 1,042 | | | — | | | — | | |
| Goodwill | 6,324 | | | 6,324 | | | — | | | — | | |
| Other assets | 4,131 | | | 3,388 | | | 1,952 | | | (1,209) | | 5 |
| Total assets | $ | 82,793 | | | $ | 50,009 | | | $ | 34,984 | | | $ | (2,200) | | |
| | | | | | | | |
| Liabilities | | | | | | | | |
| Current liabilities: | | | | | | | | |
| Short-term borrowings | $ | 5,404 | | | $ | 9 | | | $ | 5,395 | | | $ | — | | |
| | | | | | | | |
| Accounts payable | 8,154 | | | 8,079 | | | 242 | | | (167) | | 6 |
| Accrued expenses | 3,757 | | | 3,385 | | | 372 | | | — | | |
| Accrued wages, salaries and employee benefits | 2,242 | | | 2,186 | | | 56 | | | — | | |
| Customer advances | 1,087 | | | 1,086 | | | 1 | | | — | | |
| Dividends payable | 595 | | | 595 | | | — | | | — | | |
| Other current liabilities | 2,256 | | | 1,773 | | | 642 | | | (159) | | 4,7 |
| Long-term debt due within one year | 6,352 | | | 45 | | | 6,307 | | | — | | |
| Total current liabilities | 29,847 | | | 17,158 | | | 13,015 | | | (326) | | |
| | | | | | | | |
| Long-term debt due after one year | 26,033 | | | 9,772 | | | 16,287 | | | (26) | | 8 |
| Liability for postemployment benefits | 5,592 | | | 5,592 | | | — | | | — | | |
| Other liabilities | 4,805 | | | 4,106 | | | 1,425 | | | (726) | | 4 |
| Total liabilities | 66,277 | | | 36,628 | | | 30,727 | | | (1,078) | | |
| | | | | | | | |
| Shareholders’ equity | | | | | | | | |
| Common stock | 6,398 | | | 6,398 | | | 919 | | | (919) | | 9 |
| Treasury stock | (27,643) | | | (27,643) | | | — | | | — | | |
| Profit employed in the business | 39,282 | | | 35,390 | | | 3,881 | | | 11 | | 9 |
| Accumulated other comprehensive income (loss) | (1,553) | | | (799) | | | (754) | | | — | | |
| Noncontrolling interests | 32 | | | 35 | | | 211 | | | (214) | | 9 |
| Total shareholders’ equity | 16,516 | | | 13,381 | | | 4,257 | | | (1,122) | | |
| Total liabilities and shareholders’ equity | $ | 82,793 | | | $ | 50,009 | | | $ | 34,984 | | | $ | (2,200) | | |
| | | | | |
| 1 | Elimination of receivables between ME&T and Financial Products. |
| 2 | Reclassification of ME&T’s trade receivables purchased by Financial Products and Financial Products’ wholesale inventory receivables. |
| 3 | Elimination of ME&T's insurance premiums that are prepaid to Financial Products. |
| 4 | Reclassification reflecting required netting of deferred tax assets/liabilities by taxing jurisdiction. |
| 5 | Elimination of other intercompany assets between ME&T and Financial Products. |
| 6 | Elimination of payables between ME&T and Financial Products. |
| 7 | Elimination of prepaid insurance in Financial Products’ other liabilities. |
| |
| 8 | Elimination of debt between ME&T and Financial Products. |
| 9 | Eliminations associated with ME&T’s investments in Financial Products’ subsidiaries. |
| |
Caterpillar Inc.
Supplemental Data for Financial Position
At December 31, 2020
(Unaudited)
(Millions of dollars)
| | | | | | | | | | | | | | | | | | | | | | | | | | |
| | | | Supplemental Consolidating Data | |
| | Consolidated | | Machinery,
Energy &
Transportation | | Financial
Products | | Consolidating
Adjustments | |
| Assets | | | | | | | | |
| Current assets: | | | | | | | | |
| Cash and cash equivalents | $ | 9,352 | | | $ | 8,822 | | | $ | 530 | | | $ | — | | |
| Receivables – trade and other | 7,317 | | | 3,846 | | | 397 | | | 3,074 | | 1,2 |
| Receivables – finance | 9,463 | | | — | | | 13,681 | | | (4,218) | | 2 |
| | | | | | | | |
| Prepaid expenses and other current assets | 1,930 | | | 1,376 | | | 624 | | | (70) | | 3 |
| Inventories | 11,402 | | | 11,402 | | | — | | | — | | |
| Total current assets | 39,464 | | | 25,446 | | | 15,232 | | | (1,214) | | |
| | | | | | | | |
| Property, plant and equipment – net | 12,401 | | | 8,309 | | | 4,092 | | | — | | |
| Long-term receivables – trade and other | 1,185 | | | 363 | | | 164 | | | 658 | | 1,2 |
| Long-term receivables – finance | 12,222 | | | — | | | 12,895 | | | (673) | | 2 |
| | | | | | | | |
| | | | | | | | |
| Noncurrent deferred and refundable income taxes | 1,523 | | | 2,058 | | | 110 | | | (645) | | 4 |
| Intangible assets | 1,308 | | | 1,308 | | | — | | | — | | |
| Goodwill | 6,394 | | | 6,394 | | | — | | | — | | |
| Other assets | 3,827 | | | 3,158 | | | 1,871 | | | (1,202) | | 5 |
| Total assets | $ | 78,324 | | | $ | 47,036 | | | $ | 34,364 | | | $ | (3,076) | | |
| | | | | | | | |
| Liabilities | | | | | | | | |
| Current liabilities: | | | | | | | | |
| Short-term borrowings | $ | 2,015 | | | $ | 10 | | | $ | 2,005 | | | $ | — | | |
| Short-term borrowings with consolidated companies | — | | | — | | | 1,000 | | | (1,000) | | 6 |
| Accounts payable | 6,128 | | | 6,060 | | | 212 | | | (144) | | 7 |
| Accrued expenses | 3,642 | | | 3,099 | | | 543 | | | — | | |
| Accrued wages, salaries and employee benefits | 1,096 | | | 1,081 | | | 15 | | | — | | |
| Customer advances | 1,108 | | | 1,108 | | | — | | | — | | |
| Dividends payable | 562 | | | 562 | | | — | | | — | | |
| Other current liabilities | 2,017 | | | 1,530 | | | 580 | | | (93) | | 4,8 |
| Long-term debt due within one year | 9,149 | | | 1,420 | | | 7,729 | | | — | | |
| Total current liabilities | 25,717 | | | 14,870 | | | 12,084 | | | (1,237) | | |
| | | | | | | | |
| Long-term debt due after one year | 25,999 | | | 9,764 | | | 16,250 | | | (15) | | 6 |
| Liability for postemployment benefits | 6,872 | | | 6,872 | | | — | | | — | | |
| Other liabilities | 4,358 | | | 3,691 | | | 1,385 | | | (718) | | 4 |
| Total liabilities | 62,946 | | | 35,197 | | | 29,719 | | | (1,970) | | |
| | | | | | | | |
| Shareholders’ equity | | | | | | | | |
| Common stock | 6,230 | | | 6,230 | | | 919 | | | (919) | | 9 |
| Treasury stock | (25,178) | | | (25,178) | | | — | | | — | | |
| Profit employed in the business | 35,167 | | | 31,091 | | | 4,065 | | | 11 | | 9 |
| Accumulated other comprehensive income (loss) | (888) | | | (352) | | | (536) | | | — | | |
| Noncontrolling interests | 47 | | | 48 | | | 197 | | | (198) | | 9 |
| Total shareholders’ equity | 15,378 | | | 11,839 | | | 4,645 | | | (1,106) | | |
| Total liabilities and shareholders’ equity | $ | 78,324 | | | $ | 47,036 | | | $ | 34,364 | | | $ | (3,076) | | |
| | | | | |
| 1 | Elimination of receivables between ME&T and Financial Products. |
| 2 | Reclassification of ME&T’s trade receivables purchased by Financial Products and Financial Products’ wholesale inventory receivables. |
| 3 | Elimination of ME&T’s insurance premiums that are prepaid to Financial Products. |
| 4 | Reclassification reflecting required netting of deferred tax assets/liabilities by taxing jurisdiction. |
| 5 | Elimination of other intercompany assets between ME&T and Financial Products. |
| 6 | Elimination of debt between ME&T and Financial Products. |
| 7 | Elimination of payables between ME&T and Financial Products. |
| 8 | Elimination of prepaid insurance in Financial Products’ other liabilities. |
| 9 | Eliminations associated with ME&T’s investments in Financial Products’ subsidiaries. |
| |
Caterpillar Inc.
Supplemental Data for Cash Flow
For the Twelve Months Ended December 31, 2021
(Unaudited)
(Millions of dollars)
| | | | | | | | | | | | | | | | | | | | | | | | | | |
| | | | Supplemental Consolidating Data | |
| | Consolidated | | Machinery, Energy & Transportation | | Financial
Products | | Consolidating
Adjustments | |
| Cash flow from operating activities: | | | | | | | | |
| Profit of consolidated and affiliated companies | $ | 6,493 | | | $ | 6,676 | | | $ | 678 | | | $ | (861) | | 1,5 |
| Adjustments for non-cash items: | | | | | | | | |
| Depreciation and amortization | 2,352 | | | 1,550 | | | 802 | | | — | | |
| | | | | | | | |
| Actuarial (gain) loss on pension and postretirement benefits | (833) | | | (833) | | | — | | | — | | |
| Provision (benefit) for deferred income taxes | (383) | | | (329) | | | (54) | | | — | | |
| | | | | | | | |
| Other | 216 | | | 131 | | | (209) | | | 294 | | 2 |
| | | | | | | | |
| Changes in assets and liabilities, net of acquisitions and divestitures: | | | | | | | | |
| Receivables – trade and other | (1,259) | | | (463) | | | 47 | | | (843) | | 2,3 |
| Inventories | (2,586) | | | (2,581) | | | — | | | (5) | | 2 |
| Accounts payable | 2,041 | | | 2,015 | | | 49 | | | (23) | | 2 |
| Accrued expenses | 196 | | | 288 | | | (92) | | | — | | |
| Accrued wages, salaries and employee benefits | 1,107 | | | 1,066 | | | 41 | | | — | | |
| Customer advances | 34 | | | 33 | | | 1 | | | — | | |
| Other assets – net | (97) | | | (200) | | | 25 | | | 78 | | 2 |
| Other liabilities – net | (83) | | | (176) | | | 132 | | | (39) | | 2 |
| Net cash provided by (used for) operating activities | 7,198 | | | 7,177 | | | 1,420 | | | (1,399) | | |
| Cash flow from investing activities: | | | | | | | | |
| Capital expenditures – excluding equipment leased to others | (1,093) | | | (1,088) | | | (16) | | | 11 | | 2 |
| Expenditures for equipment leased to others | (1,379) | | | (41) | | | (1,347) | | | 9 | | 2 |
| Proceeds from disposals of leased assets and property, plant and equipment | 1,265 | | | 186 | | | 1,095 | | | (16) | | 2 |
| Additions to finance receivables | (13,002) | | | — | | | (13,845) | | | 843 | | 3 |
| Collections of finance receivables | 12,430 | | | — | | | 13,337 | | | (907) | | 3 |
| Net intercompany purchased receivables | — | | | — | | | (609) | | | 609 | | 3 |
| Proceeds from sale of finance receivables | 51 | | | — | | | 51 | | | — | | |
| Net intercompany borrowings | — | | | 1,000 | | | 5 | | | (1,005) | | 4 |
| Investments and acquisitions (net of cash acquired) | (490) | | | (490) | | | — | | | — | | |
| Proceeds from sale of businesses and investments (net of cash sold) | 36 | | | 36 | | | — | | | — | | |
| Proceeds from sale of securities | 785 | | | 274 | | | 511 | | | — | | |
| Investments in securities | (1,766) | | | (1,189) | | | (577) | | | — | | |
| Other – net | 79 | | | 81 | | | (2) | | | — | | |
| Net cash provided by (used for) investing activities | (3,084) | | | (1,231) | | | (1,397) | | | (456) | | |
| Cash flow from financing activities: | | | | | | | | |
| Dividends paid | (2,332) | | | (2,332) | | | (850) | | | 850 | | 5 |
| | | | | | | | |
| Common stock issued, including treasury shares reissued | 135 | | | 135 | | | — | | | — | | |
| Common shares repurchased | (2,668) | | | (2,668) | | | — | | | — | | |
| Net intercompany borrowings | — | | | (5) | | | (1,000) | | | 1,005 | | 4 |
| Proceeds from debt issued > 90 days | 6,989 | | | 494 | | | 6,495 | | | — | | |
| Payments on debt > 90 days | (9,796) | | | (1,919) | | | (7,877) | | | — | | |
| Short-term borrowings – net < 90 days | 3,488 | | | (1) | | | 3,489 | | | — | | |
| Other – net | (4) | | | (4) | | | — | | | — | | |
| Net cash provided by (used for) financing activities | (4,188) | | | (6,300) | | | 257 | | | 1,855 | | |
| Effect of exchange rate changes on cash | (29) | | | (35) | | | 6 | | | — | | |
| Increase (decrease) in cash, cash equivalents and restricted cash | (103) | | | (389) | | | 286 | | | — | | |
| Cash, cash equivalents and restricted cash at beginning of period | 9,366 | | | 8,822 | | | 544 | | | — | | |
| Cash, cash equivalents and restricted cash at end of period | $ | 9,263 | | | $ | 8,433 | | | $ | 830 | | | $ | — | | |
| | | | | | | | |
| | | | | |
| 1 | Elimination of equity profit earned from Financial Products' subsidiaries partially owned by ME&T subsidiaries. |
| 2 | Elimination of non-cash adjustments and changes in assets and liabilities related to consolidated reporting. |
| 3 | Reclassification of Financial Products’ cash flow activity from investing to operating for receivables that arose from the sale of inventory. |
| 4 | Elimination of net proceeds and payments to/from ME&T and Financial Products. |
| 5 | Elimination of dividend activity between Financial Products and ME&T. |
| |
| |
| |
Caterpillar Inc.
Supplemental Data for Cash Flow
For the Twelve Months Ended December 31, 2020
(Unaudited)
(Millions of dollars)
| | | | | | | | | | | | | | | | | | | | | | | | | | |
| | | | Supplemental Consolidating Data | |
| | Consolidated | | Machinery, Energy & Transportation | | Financial
Products | | Consolidating
Adjustments | |
| Cash flow from operating activities: | | | | | | | | |
| Profit of consolidated and affiliated companies | $ | 3,003 | | | $ | 2,922 | | | $ | 416 | | | $ | (335) | | 1,5 |
| Adjustments for non-cash items: | | | | | | | | |
| Depreciation and amortization | 2,432 | | | 1,630 | | | 802 | | | — | | |
| | | | | | | | |
| Actuarial (gain) loss on pension and postretirement benefits | 383 | | | 384 | | | (1) | | | — | | |
Provision (benefit) for deferred income taxes
| (74) | | | (85) | | | 11 | | | — | | |
| | | | | | | | |
| Other | 1,000 | | | 613 | | | 98 | | | 289 | | 2 |
| | | | | | | | |
| Changes in assets and liabilities, net of acquisitions and divestitures: | | | | | | | | |
| Receivables – trade and other | 1,442 | | | 395 | | | 50 | | | 997 | | 2,3 |
| Inventories | (34) | | | (29) | | | — | | | (5) | | 2 |
| Accounts payable | 98 | | | 51 | | | 18 | | | 29 | | 2 |
| Accrued expenses | (366) | | | (364) | | | (2) | | | — | | |
| Accrued wages, salaries and employee benefits | (544) | | | (510) | | | (34) | | | — | | |
| Customer advances | (126) | | | (126) | | | — | | | — | | |
| Other assets – net | (201) | | | (133) | | | (71) | | | 3 | | 2 |
| Other liabilities – net | (686) | | | (694) | | | (22) | | | 30 | | 2 |
| Net cash provided by (used for) operating activities | 6,327 | | | 4,054 | | | 1,265 | | | 1,008 | | |
| Cash flow from investing activities: | | | | | | | | |
| Capital expenditures – excluding equipment leased to others | (978) | | | (976) | | | (14) | | | 12 | | 2 |
| Expenditures for equipment leased to others | (1,137) | | | (18) | | | (1,139) | | | 20 | | 2 |
| Proceeds from disposals of leased assets and property, plant and equipment | 772 | | | 147 | | | 651 | | | (26) | | 2 |
| Additions to finance receivables | (12,385) | | | — | | | (13,525) | | | 1,140 | | 3 |
| Collections of finance receivables | 12,646 | | | — | | | 14,077 | | | (1,431) | | 3 |
| Net intercompany purchased receivables | — | | | — | | | 1,043 | | | (1,043) | | 3 |
| Proceeds from sale of finance receivables | 42 | | | — | | | 42 | | | — | | |
| Net intercompany borrowings | — | | | (401) | | | 7 | | | 394 | | 4 |
| Investments and acquisitions (net of cash acquired) | (111) | | | (111) | | | — | | | — | | |
| Proceeds from sale of businesses and investments (net of cash sold) | 25 | | | 25 | | | — | | | — | | |
| Proceeds from sale of securities | 345 | | | 24 | | | 321 | | | — | | |
| Investments in securities | (638) | | | (21) | | | (617) | | | — | | |
| Other – net | (66) | | | (11) | | | (55) | | | — | | |
| Net cash provided by (used for) investing activities | (1,485) | | | (1,342) | | | 791 | | | (934) | | |
| Cash flow from financing activities: | | | | | | | | |
| Dividends paid | (2,243) | | | (2,243) | | | (320) | | | 320 | | 5 |
| | | | | | | | |
| Common stock issued, including treasury shares reissued | 229 | | | 229 | | | — | | | — | | |
| Common shares repurchased | (1,130) | | | (1,130) | | | — | | | — | | |
| Net intercompany borrowings | — | | | (7) | | | 401 | | | (394) | | 4 |
| Proceeds from debt issued > 90 days | 10,431 | | | 1,991 | | | 8,440 | | | — | | |
| Payments on debt > 90 days | (8,237) | | | (26) | | | (8,211) | | | — | | |
| Short-term borrowings – net < 90 days | (2,804) | | | 5 | | | (2,809) | | | — | | |
| Other – net | (1) | | | (1) | | | — | | | — | | |
| Net cash provided by (used for) financing activities | (3,755) | | | (1,182) | | | (2,499) | | | (74) | | |
| Effect of exchange rate changes on cash | (13) | | | (10) | | | (3) | | | — | | |
| Increase (decrease) in cash, cash equivalents and restricted cash | 1,074 | | | 1,520 | | | (446) | | | — | | |
| Cash, cash equivalents and restricted cash at beginning of period | 8,292 | | | 7,302 | | | 990 | | | — | | |
| Cash, cash equivalents and restricted cash at end of period | $ | 9,366 | | | $ | 8,822 | | | $ | 544 | | | $ | — | | |
| | | | | |
| 1 | Elimination of equity profit earned from Financial Products' subsidiaries partially owned by ME&T subsidiaries. |
| 2 | Elimination of non-cash adjustments and changes in assets and liabilities related to consolidated reporting. |
| 3 | Reclassification of Financial Products’ cash flow activity from investing to operating for receivables that arose from the sale of inventory. |
| 4 | Elimination of net proceeds and payments to/from ME&T and Financial Products. |
| 5 | Elimination of dividend activity between Financial Products and ME&T. |
| |
| |
| |
| |
| |
Caterpillar Inc. (“Caterpillar”, “we” or “our”) is furnishing supplemental information concerning (i) retail sales of machines to end users and (ii) retail sales of power systems (including reciprocating and turbine engines and locomotives) to end users and Original Equipment Manufacturers (“OEMs”). Caterpillar sells the majority of its machinery and power systems to independently owned and operated dealers and OEMs to meet the demands of their customers, the end users. Caterpillar believes that this supplemental information may help readers better understand Caterpillar’s business and the industries it serves, particularly in light of the time delay between Caterpillar’s sales to dealers and dealers’ sales to end users.
In this report, we are providing information by geographic region for retail sales of machines in each of our Resource Industries and Construction Industries reportable segments, as well as information regarding retail sales of our machines globally. For our Energy & Transportation reportable segment, we are providing retail sales information by major end use.
The information presented in this report is primarily based on unaudited reports that are voluntarily provided to Caterpillar by its independent dealers and which are not subject to Caterpillar’s internal controls over financial reporting. Accordingly, the data collected from such third parties may not be accurate and/or complete. As such, the information presented in this report is intended solely to convey an approximate indication of the trends, direction and magnitude of retail sales and is not intended to be an estimate, approximation or prediction of, or substitute for, Caterpillar’s audited financial statements filed with the U.S. Securities and Exchange Commission. This information is furnished under this report with the U.S. Securities and Exchange Commission. Caterpillar does not undertake to update or adjust prior period information.
| | | | | | | | | | | | | | | | | |
Caterpillar Inc.
Quarterly Retail Sales Statistics | |
|
| | | | | | |
| Machines and E&T Combined | 4th Quarter 2021 | 3rd Quarter 2021 | 2nd Quarter 2021 | 1st Quarter 2021 | |
| World | UP 7% | UP 14% | UP 15% | UP 8% | |
| | | | | | |
| Machines | 4th Quarter 2021 | 3rd Quarter 2021 | 2nd Quarter 2021 | 1st Quarter 2021 | |
| Asia/Pacific | DOWN 8% | DOWN 4% | UP 1% | UP 27% | |
| EAME | UP 24% | UP 22% | UP 16% | UP 5% | |
| Latin America | UP 15% | UP 57% | UP 55% | UP 54% | |
| North America | UP 1% | UP 19% | UP 32% | DOWN 1% | |
| World | UP 5% | UP 17% | UP 20% | UP 13% | |
| Resource Industries (RI) | 4th Quarter 2021 | 3rd Quarter 2021 | 2nd Quarter 2021 | 1st Quarter 2021 | |
| Asia/Pacific | UP 47% | UP 18% | UP 31% | UP 1% | |
| EAME | UP 13% | UP 20% | DOWN 9% | DOWN 9% | |
| Latin America | DOWN 20% | UP 130% | UP 23% | UP 85% | |
| North America | DOWN 7% | UP 30% | UP 44% | DOWN 21% | |
| World | UP 10% | UP 33% | UP 21% | UNCHANGED | |
| Construction Industries (CI) | 4th Quarter 2021 | 3rd Quarter 2021 | 2nd Quarter 2021 | 1st Quarter 2021 | |
| Asia/Pacific | DOWN 23% | DOWN 10% | DOWN 7% | UP 36% | |
| EAME | UP 29% | UP 23% | UP 27% | UP 11% | |
| Latin America | UP 40% | UP 31% | UP 76% | UP 38% | |
| North America | UP 3% | UP 17% | UP 30% | UP 5% | |
| World | UP 4% | UP 12% | UP 20% | UP 17% | |
| Reported in dollars and based on unit sales as reported primarily by dealers. | | |
| | | | | | |
Energy & Transportation (E&T) Retail Sales by industry for the quarter ended as indicated compared with the same period of the prior year: | |
| Energy & Transportation (E&T) | 4th Quarter 2021 | 3rd Quarter 2021 | 2nd Quarter 2021 | 1st Quarter 2021 | |
| Power Gen | UP 3% | DOWN 8% | DOWN 6% | UP 7% | |
| Industrial | UP 30% | UP 36% | UP 44% | DOWN 4% | |
| Transportation | UP 42% | DOWN 12% | UP 5% | DOWN 40% | |
| Oil & Gas | UP 9% | UP 21% | DOWN 6% | DOWN 9% | |
| Total | UP 12% | UP 8% | UP 1% | DOWN 5% | |
| Reported in dollars based on reporting from dealers and direct sales. | | | |
Glossary of Terms
Construction Industries: Our Construction Industries segment is primarily responsible for supporting customers using machinery in infrastructure, forestry and building construction. The majority of machine sales in this segment are made in the heavy and general construction, rental, quarry and aggregates markets and mining. The Construction Industries product portfolio primarily includes the following machines:
| | | | | | | | |
| · asphalt pavers | · forestry excavators | · small and medium |
· backhoe loaders | · motorgraders | track-type tractors |
· compactors | · pipelayers | · track-type loaders |
· cold planers | · road reclaimers | · utility vehicles |
· compact track and | · site prep tractors | · wheel excavators |
| multi-terrain loaders | · skid steer loaders | · compact, small and medium |
| · mini, small, medium | · telehandlers | wheel loaders |
| and large excavators | | |
Effective September 2019, Caterpillar has divested its Forestry product segment. Those products have been removed from the Construction Industries product portfolio where any remaining product Dealer Inventory will be reported in Machines as they are depleted.
EAME: Europe, Africa, Commonwealth of Independent States and Middle East.
Energy & Transportation: Our Energy & Transportation segment is primarily responsible for supporting customers using reciprocating engines, generator sets, turbines, diesel-electric locomotives, integrated systems and solutions, and certain related parts across industries serving oil and gas, power generation, industrial and marine applications as well as rail-related businesses.
Resource Industries: Our Resource Industries segment is primarily responsible for supporting customers using machinery in mining, heavy construction, and quarry and aggregates. The Resource Industries product portfolio primarily includes the following machines:
| | | | | | | | |
| · electric rope shovels | · longwall miners | · landfill compactors |
| · draglines | · large wheel loaders | · soil compactors |
| · hydraulic shovels | · off-highway trucks | · machinery components |
| · rotary drills | · articulated trucks | · autonomous ready vehicles and |
| · hard rock vehicles | · wheel tractor scrapers | solutions |
| · large track-type tractors | · wheel dozers | |
| · large mining trucks | | |
For purposes of this report, retail sales of longwall miners are not included in the information presented above for Resource Industries or Machines or Machines and E&T Combined figures.
FORWARD-LOOKING STATEMENTS
Certain statements in this report relate to future events and expectations and are forward-looking statements within the meaning of the Private Securities Litigation Reform Act of 1995. Words such as “believe,” “estimate,” “will be,” “will,” “would,” “expect,” “anticipate,” “plan,” “forecast,” “target,” “guide,” “project,” “intend,” “could,” “should” or other similar words or expressions often identify forward-looking statements. All statements other than statements of historical fact are forward-looking statements, including, without limitation, statements regarding our outlook, projections, forecasts or trend descriptions. These statements do not guarantee future performance and speak only as of the date they are made, and we do not undertake to update our forward-looking statements.
Caterpillar’s actual results may differ materially from those described or implied in our forward-looking statements based on a number of factors, including, but not limited to: (i) global and regional economic conditions and economic conditions in the industries we serve; (ii) commodity price changes, material price increases, fluctuations in demand for our products or significant shortages of material; (iii) government monetary or fiscal policies; (iv) political and economic risks, commercial instability and events beyond our control in the countries in which we operate; (v) international trade policies and their impact on demand for our products and our competitive position, including the imposition of new tariffs or changes in existing tariff rates; (vi) our ability to develop, produce and market quality products that meet our customers’ needs; (vii) the impact of the highly competitive environment in which we operate on our sales and pricing; (viii) information technology security threats and computer crime; (ix) inventory management decisions and sourcing practices of our dealers and our OEM customers; (x) a failure to realize, or a delay in realizing, all of the anticipated benefits of our acquisitions, joint ventures or divestitures; (xi) union disputes or other employee relations issues; (xii) adverse effects of unexpected events; (xiii) disruptions or volatility in global financial markets limiting our sources of liquidity or the liquidity of our customers, dealers and suppliers; (xiv) failure to maintain our credit ratings and potential resulting increases to our cost of borrowing and adverse effects on our cost of funds, liquidity, competitive position and access to capital markets; (xv) our Financial Products segment’s risks associated with the financial services industry; (xvi) changes in interest rates or market liquidity conditions; (xvii) an increase in delinquencies, repossessions or net losses of Cat Financial’s customers; (xviii) currency fluctuations; (xix) our or Cat Financial’s compliance with financial and other restrictive covenants in debt agreements; (xx) increased pension plan funding obligations; (xxi) alleged or actual violations of trade or anti-corruption laws and regulations; (xxii) additional tax expense or exposure, including the impact of U.S. tax reform; (xxiii) significant legal proceedings, claims, lawsuits or government investigations; (xxiv) new regulations or changes in financial services regulations; (xxv) compliance with environmental laws and regulations; (xxvi) the duration and geographic spread of, business disruptions caused by, and the overall global economic impact of, the COVID-19 pandemic; and (xxvii) other factors described in more detail in Caterpillar’s Forms 10-Q, 10-K and other filings with the Securities and Exchange Commission.