CARDLYTICS Q4 2022 Earnings Presentation March 1, 2023

Disclaimer This presentation includes forward-looking statements. All statements contained in this presentation other than statements of historical facts, including statements regarding expectations about future financial performance or results of Cardlytics, Inc. (“Cardlytics,” “we,” “us,” or “our) including the potential benefits of our acquisitions of Dosh, Bridg and Entertainment, becoming cash flow positive by the second half of 2023, earnings guidance for the first quarter of 2023, our path to modest growth, the short- and long-term success of our product initiatives, our ability to achieve liquidity, long-term growth and profitability, Bridg's future gross margin, the anticipated impact of our strategic initiatives to create shareholder value and growth in MAUs and ARPU are forward looking statements. The words “anticipate,” believe,” “continue,” “estimate,” “expect,” “intend,” “may,” “will” and similar expressions are intended to identify forward-looking statements. The future events and trends discussed in this presentation may not occur and actual results could differ materially and adversely from those anticipated or implied in the forward-looking statements. Forward-looking statements are subject to a number of risks and uncertainties, many of which involve factors or circumstances that are beyond our control. Our actual results could differ materially from those stated or implied in forward-looking statements due to a number of factors, including but not limited to: risks related to unfavorable conditions in the global economy and the industries that we serve; our quarterly operating results have fluctuated and may continue to vary from period to period; our ability to sustain our revenue growth and billings; risks related to the integration of Dosh, Bridg and Entertainment with our company; potential payments under the Merger Agreement with Bridg; risks related to our substantial dependence on our Cardlytics platform; risks related to our substantial dependence on JPMorgan Chase Bank, National Association (“Chase”), Bank of America, National Association ("Bank of America"), Wells Fargo Bank, National Association (“Wells Fargo”) and a limited number of other financial institution (“FI”) partners; risks related to our ability to maintain relationships with Chase, Wells Fargo and Bank of America; the amount and timing of budgets by marketers, which are affected by budget cycles, economic conditions and other factors, including the impact of the COVID-19 pandemic; our ability to generate sufficient revenue to offset contractual commitments to FIs; our ability to attract new partners, including FI partners, and maintain relationships with bank processors and digital banking providers; our ability to maintain relationships with marketers; our ability to adapt to changing market conditions, including our ability to adapt to changes in consumer habits, negotiate fee arrangements with new and existing partners and retailers, and develop and launch new services and features; and other risks detailed in the “Risk Factors” section of our Form 10-K filed with the Securities and Exchange Commission on March 1, 2023. Although we believe that the expectations reflected in the forward-looking statements are reasonable, we cannot guarantee future results, levels of activity, performance, achievements or events and circumstances reflected in the forward-looking statements will occur. We are under no duty to update any of these forward-looking statements after the date of this presentation to conform these statements to actual results or revised expectations, except as required by law. In addition to U.S. GAAP financial information, this presentation includes billings, adjusted contribution, adjusted Partner Share and other third-party costs, adjusted EBITDA, adjusted EBITDA margin, non-GAAP net loss and non-GAAP net loss per share, each of which is a non-GAAP financial measure. These non-GAAP financial measures are in addition to, and not a substitute for or superior to, measures of financial performance prepared in accordance with U.S. GAAP. Reconciliations of billings, adjusted contribution, adjusted Partner Share and other third-party costs, adjusted EBITDA, adjusted EBITDA margin, non-GAAP net income (loss) and non-GAAP net income (loss) per share to the most directly comparable GAAP measures are included in the appendix to this presentation. Please see appendix for definitions.

Company overview

© 2021 Cardlytics 4 We power a native ad platform in our partners’ digital channels.
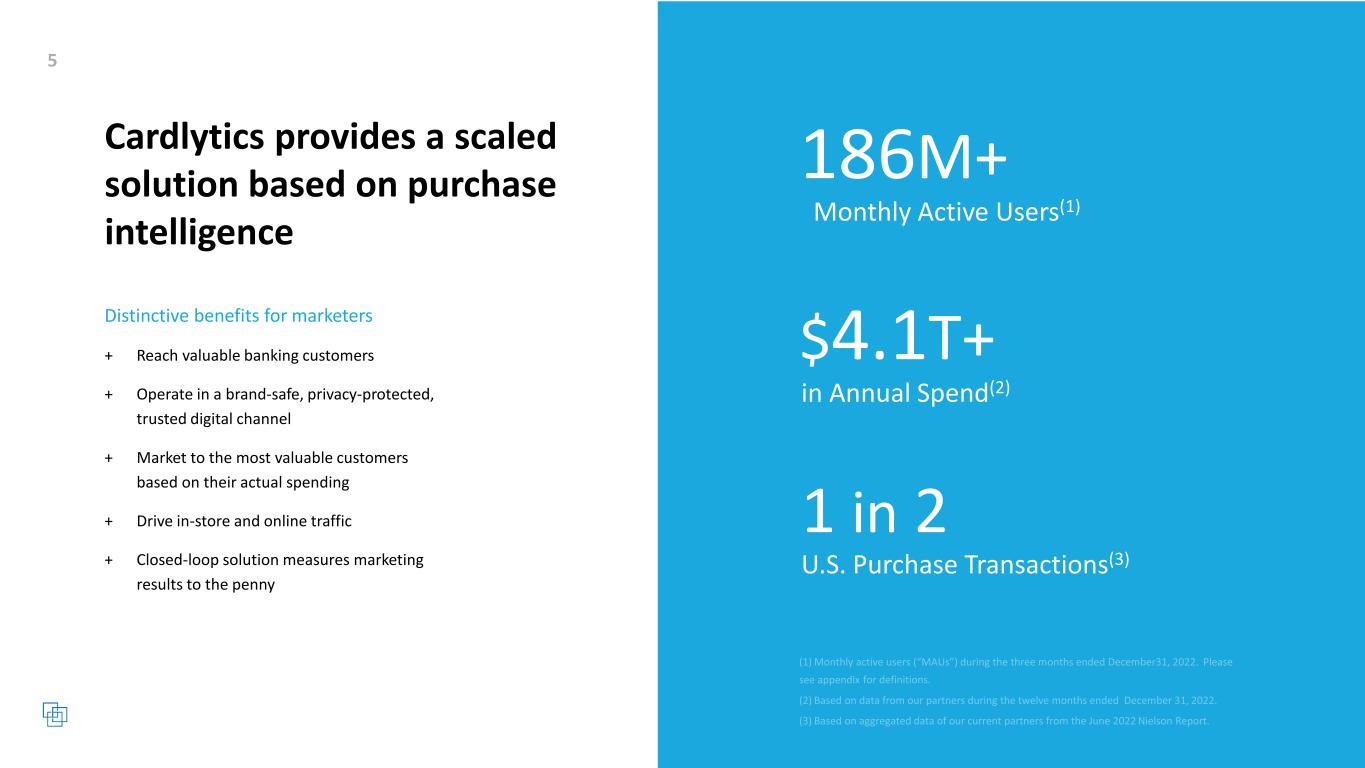
Cardlytics provides a scaled solution based on purchase intelligence 186M+ Monthly Active Users(1) $4.1T+ in Annual Spend(2) 1 in 2 U.S. Purchase Transactions(3) Distinctive benefits for marketers + Reach valuable banking customers + Operate in a brand-safe, privacy-protected, trusted digital channel + Market to the most valuable customers based on their actual spending + Drive in-store and online traffic + Closed-loop solution measures marketing results to the penny
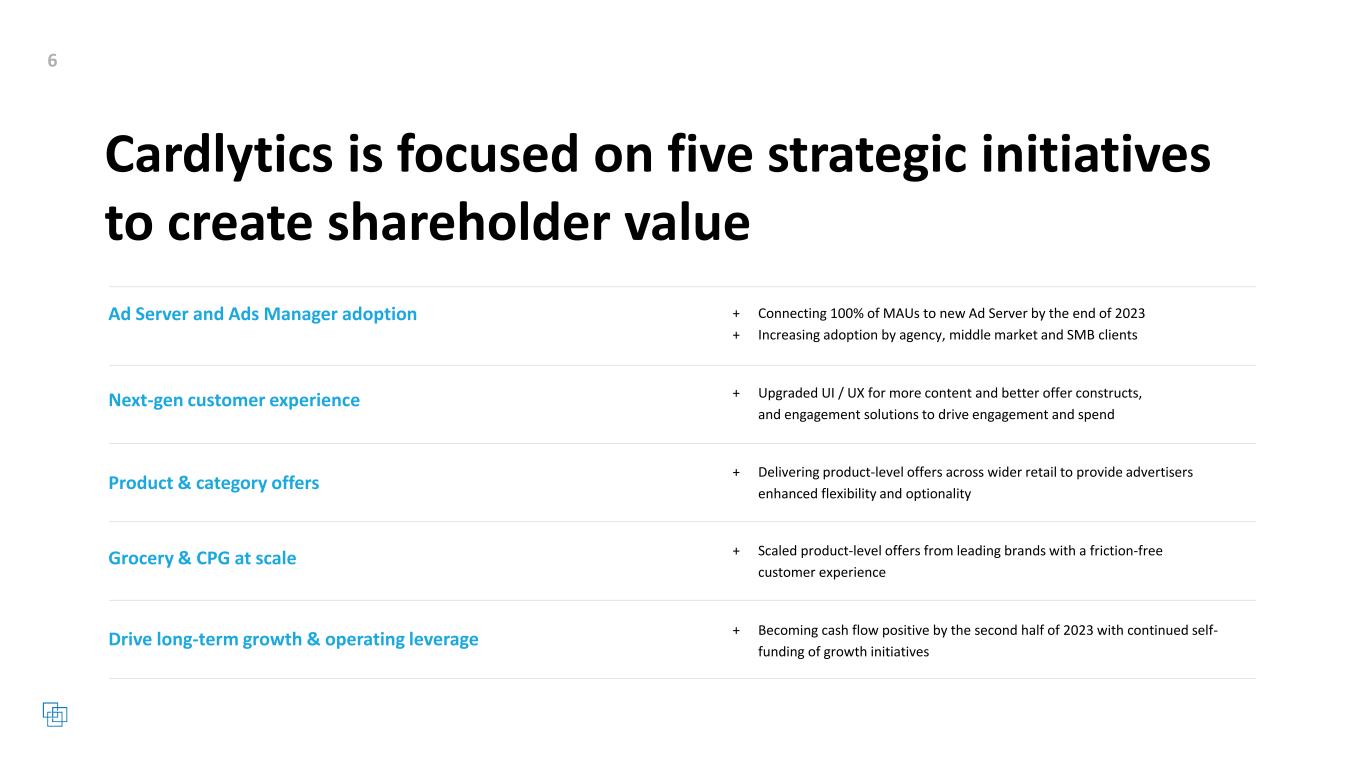
Cardlytics is focused on five strategic initiatives to create shareholder value + Connecting 100% of MAUs to new Ad Server by the end of 2023 + Increasing adoption by agency, middle market and SMB clients Drive long-term growth & operating leverage + Upgraded UI / UX for more content and better offer constructs, and engagement solutions to drive engagement and spend Ad Server and Ads Manager adoption + Delivering product-level offers across wider retail to provide advertisers enhanced flexibility and optionality Next-gen customer experience + Scaled product-level offers from leading brands with a friction-free customer experience Product & category offers + Becoming cash flow positive by the second half of 2023 with continued self- funding of growth initiatives Grocery & CPG at scale
Financial information & operating metrics
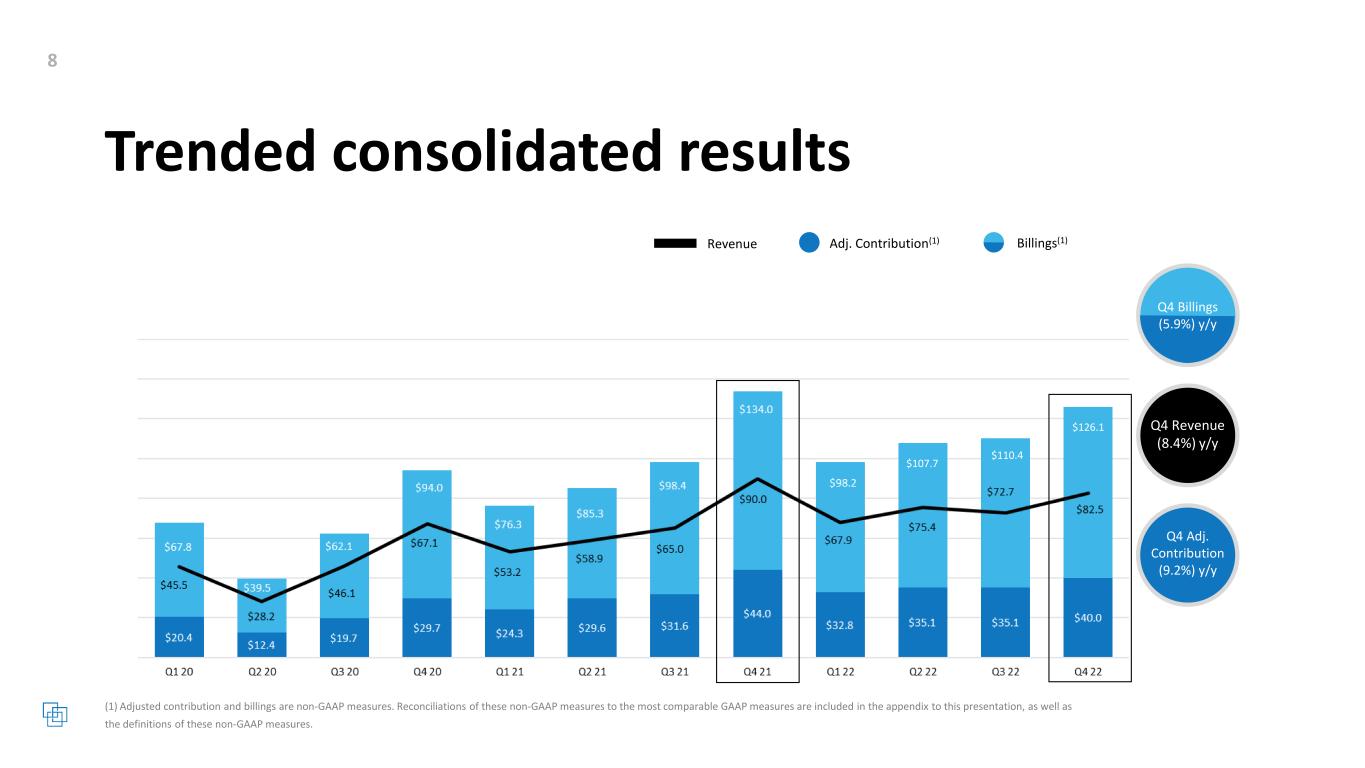
Trended consolidated results Q4 Adj. Contribution (9.2%) y/y Q4 Revenue (8.4%) y/y Q4 Billings (5.9%) y/y Revenue Adj. Contribution(1) Billings(1) $107.7 $110.4 $126.1
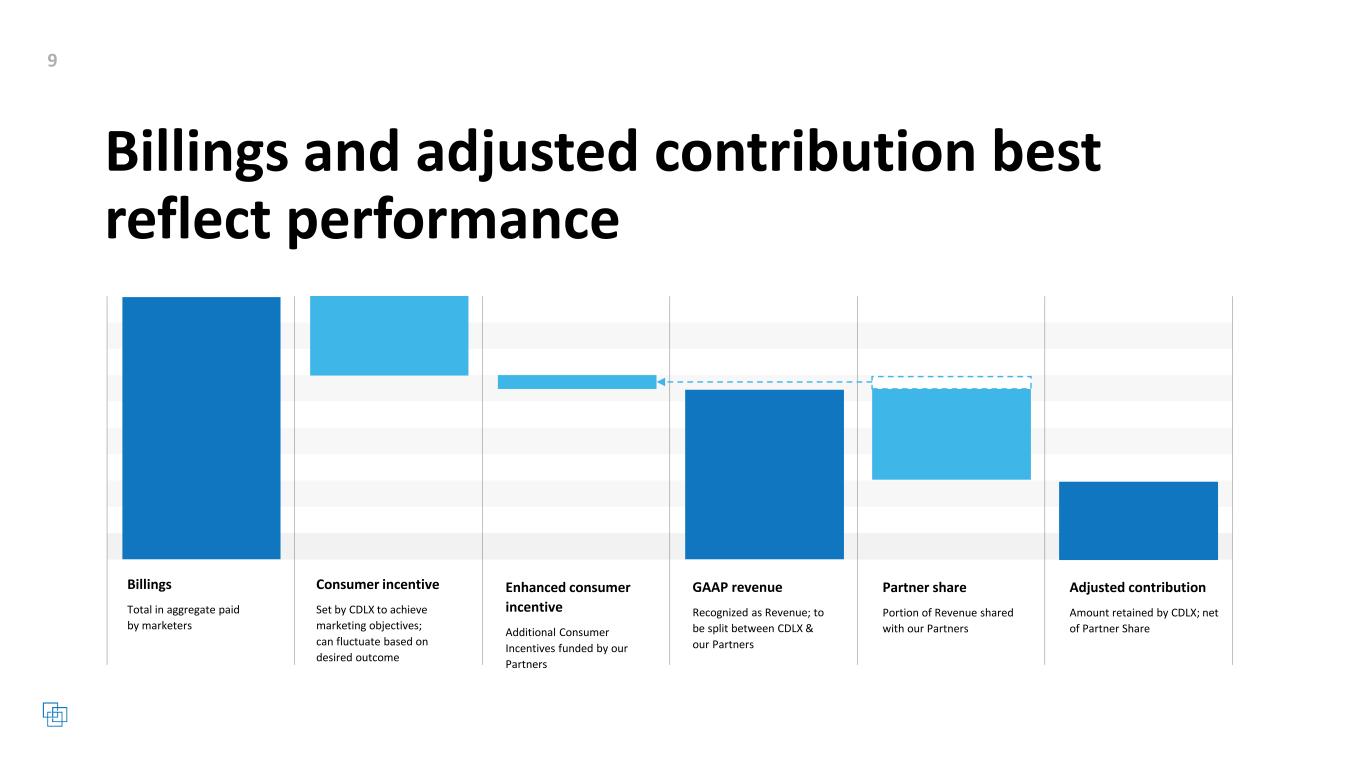
Billings and adjusted contribution best reflect performance Billings Total in aggregate paid by marketers Consumer incentive Set by CDLX to achieve marketing objectives; can fluctuate based on desired outcome Enhanced consumer incentive Additional Consumer Incentives funded by our Partners GAAP revenue Recognized as Revenue; to be split between CDLX & our Partners Partner share Portion of Revenue shared with our Partners Adjusted contribution Amount retained by CDLX; net of Partner Share
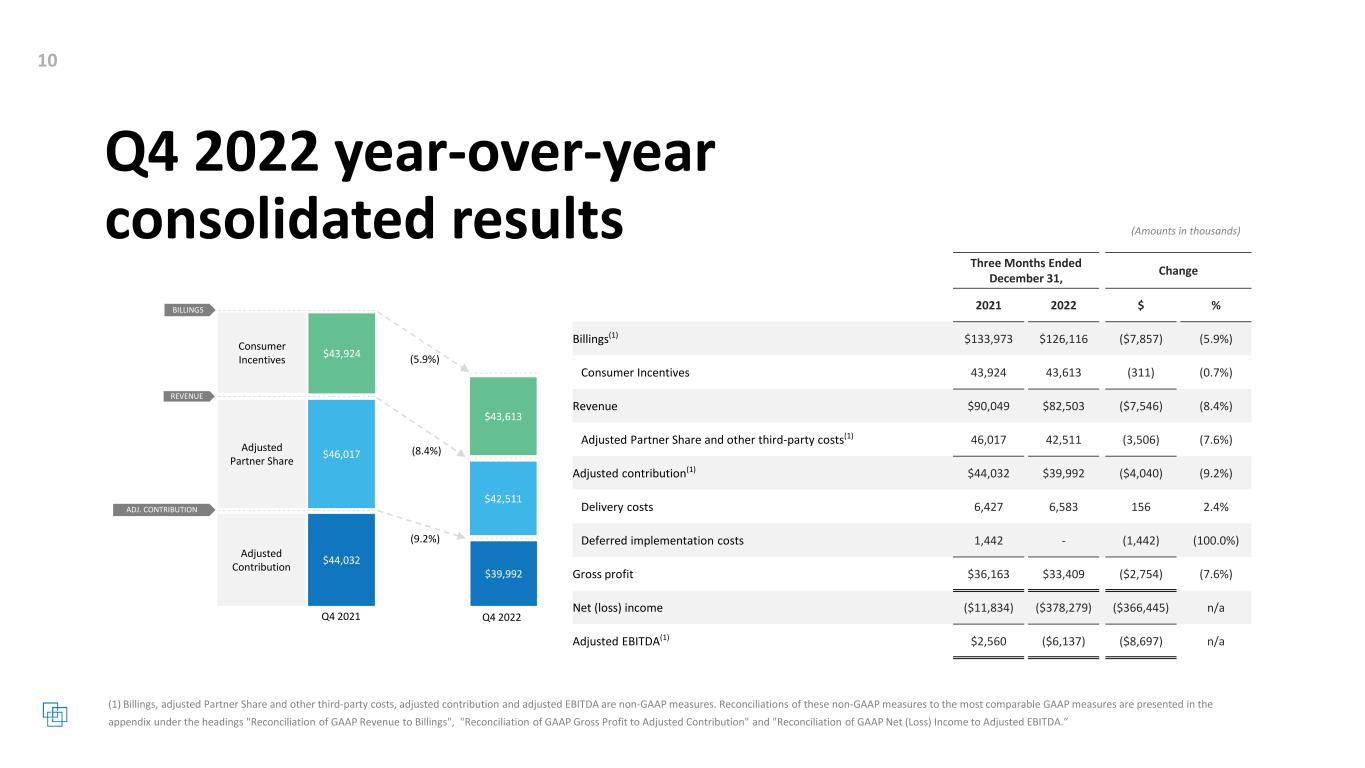
Q4 2022 year-over-year consolidated results Consumer Incentives $43,924 $43,613 Adjusted Partner Share $42,511 $44,032 $39,992 BILLINGS REVENUE ADJ. CONTRIBUTION Adjusted Contribution (5.9%) (8.4%) (9.2%) Q4 2021 Q4 2022 $46,017 Three Months Ended December 31, Change 2021 2022 $ % Billings(1) $133,973 $126,116 ($7,857) (5.9%) Consumer Incentives 43,924 43,613 (311) (0.7%) Revenue $90,049 $82,503 ($7,546) (8.4%) Adjusted Partner Share and other third-party costs(1) 46,017 42,511 (3,506) (7.6%) Adjusted contribution(1) $44,032 $39,992 ($4,040) (9.2%) Delivery costs 6,427 6,583 156 2.4% Deferred implementation costs 1,442 - (1,442) (100.0%) Gross profit $36,163 $33,409 ($2,754) (7.6%) Net (loss) income ($11,834) ($378,279) ($366,445) n/a Adjusted EBITDA(1) $2,560 ($6,137) ($8,697) n/a
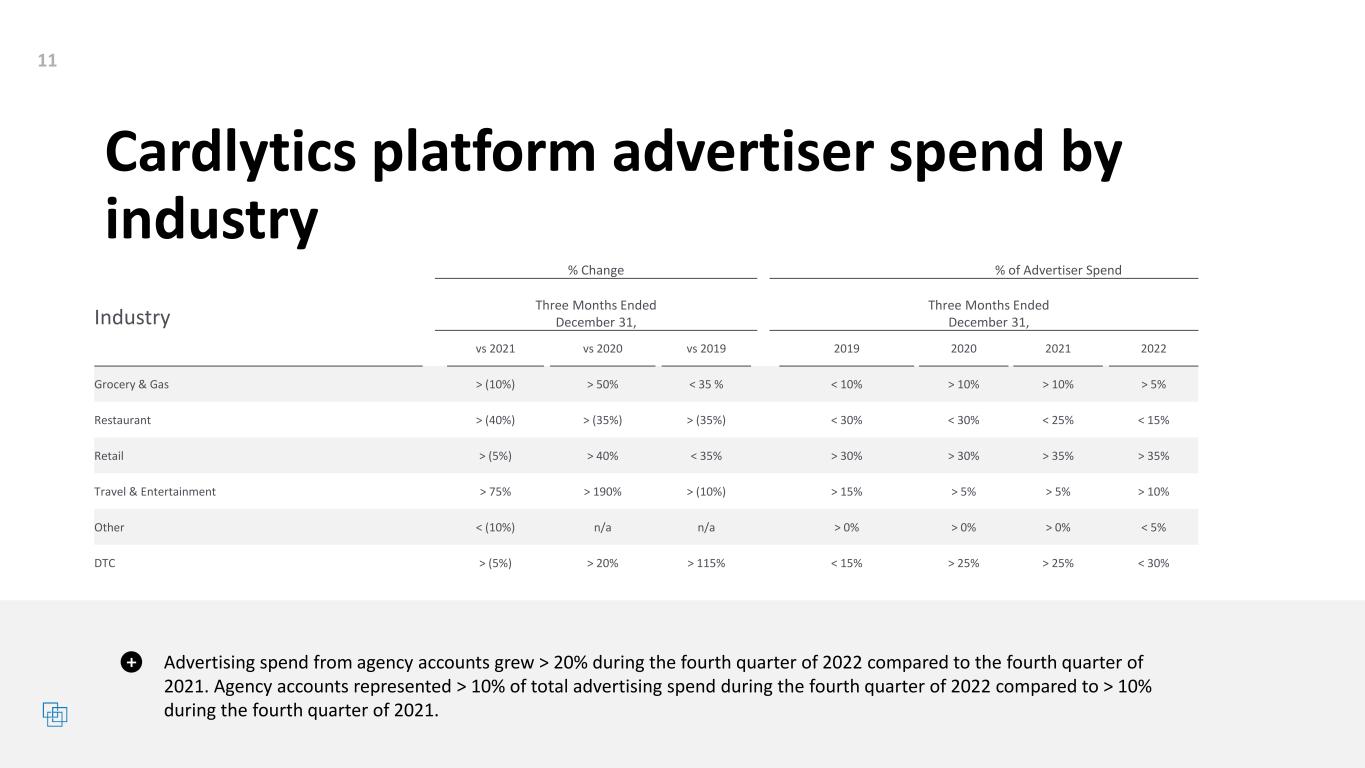
Cardlytics platform advertiser spend by industry Advertising spend from agency accounts grew > 20% during the fourth quarter of 2022 compared to the fourth quarter of 2021. Agency accounts represented > 10% of total advertising spend during the fourth quarter of 2022 compared to > 10% during the fourth quarter of 2021. Industry % Change % of Advertiser Spend Three Months Ended December 31, Three Months Ended December 31, vs 2021 vs 2020 vs 2019 2019 2020 2021 2022 Grocery & Gas > (10%) > 50% < 35 % < 10% > 10% > 10% > 5% Restaurant > (40%) > (35%) > (35%) < 30% < 30% < 25% < 15% Retail > (5%) > 40% < 35% > 30% > 30% > 35% > 35% Travel & Entertainment > 75% > 190% > (10%) > 15% > 5% > 5% > 10% Other < (10%) n/a n/a > 0% > 0% > 0% < 5% DTC > (5%) > 20% > 115% < 15% > 25% > 25% < 30%
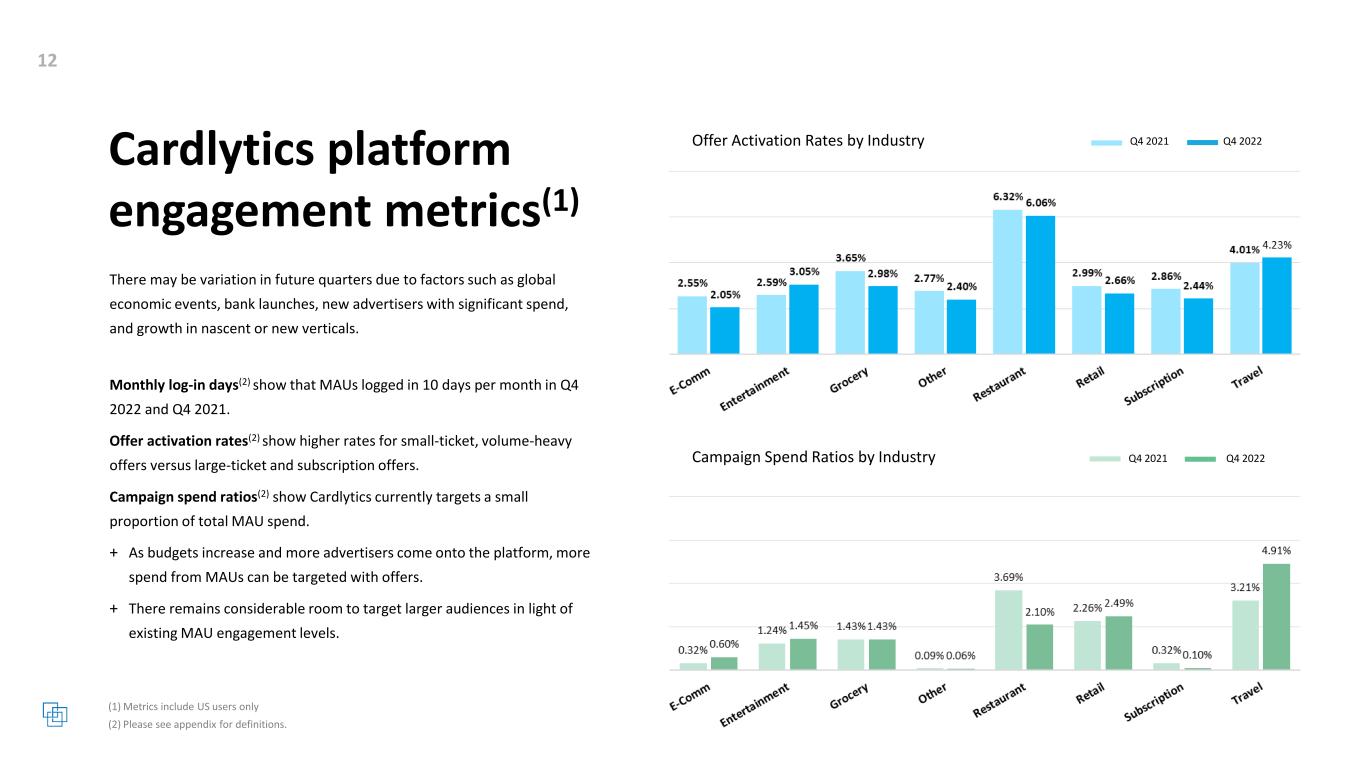
Cardlytics platform engagement metrics(1) There may be variation in future quarters due to factors such as global economic events, bank launches, new advertisers with significant spend, and growth in nascent or new verticals. Monthly log-in days(2) show that MAUs logged in 10 days per month in Q4 2022 and Q4 2021. Offer activation rates(2) show higher rates for small-ticket, volume-heavy offers versus large-ticket and subscription offers. Campaign spend ratios(2) show Cardlytics currently targets a small proportion of total MAU spend. + As budgets increase and more advertisers come onto the platform, more spend from MAUs can be targeted with offers. + There remains considerable room to target larger audiences in light of existing MAU engagement levels. Campaign Spend Ratios by Industry Offer Activation Rates by Industry Q4 2021 Q4 2022 Q4 2021 Q4 2022
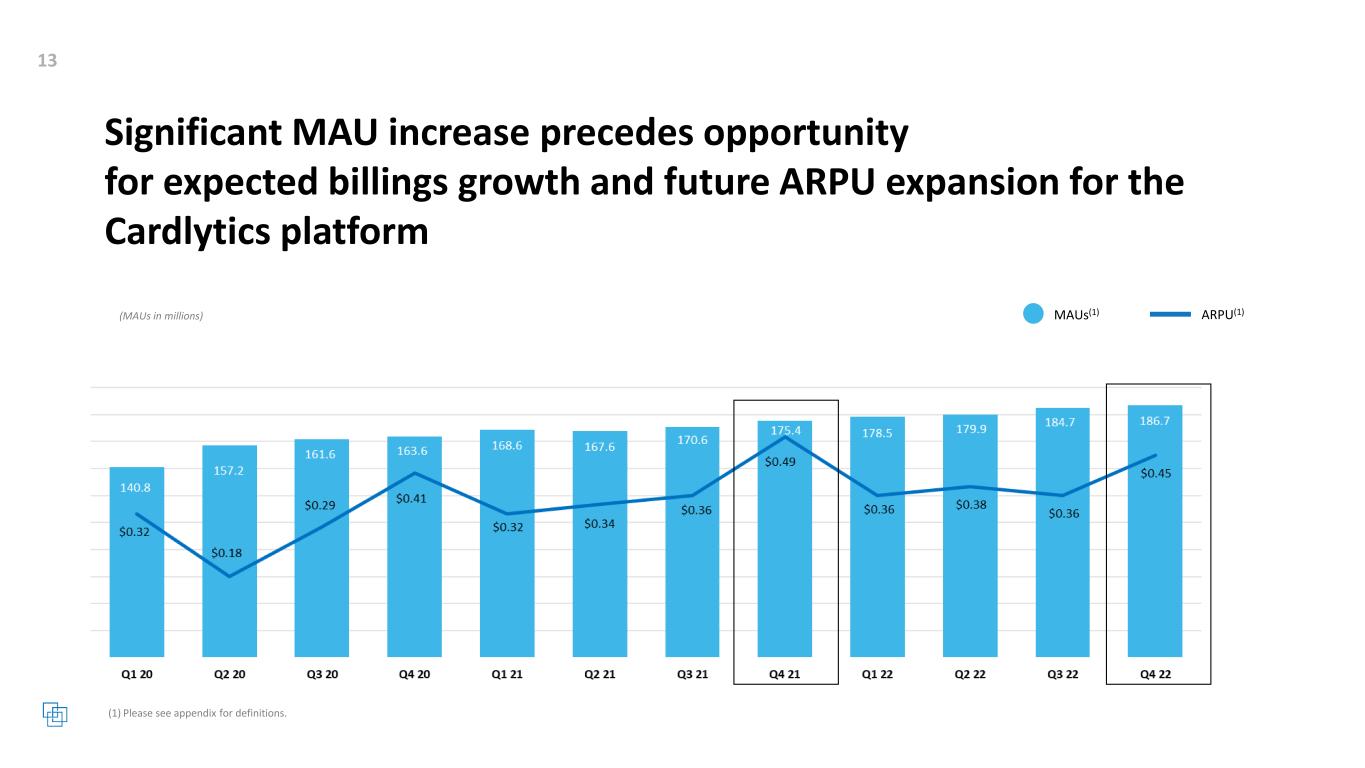
Significant MAU increase precedes opportunity for expected billings growth and future ARPU expansion for the Cardlytics platform ARPU(1)MAUs(1)

Appendix
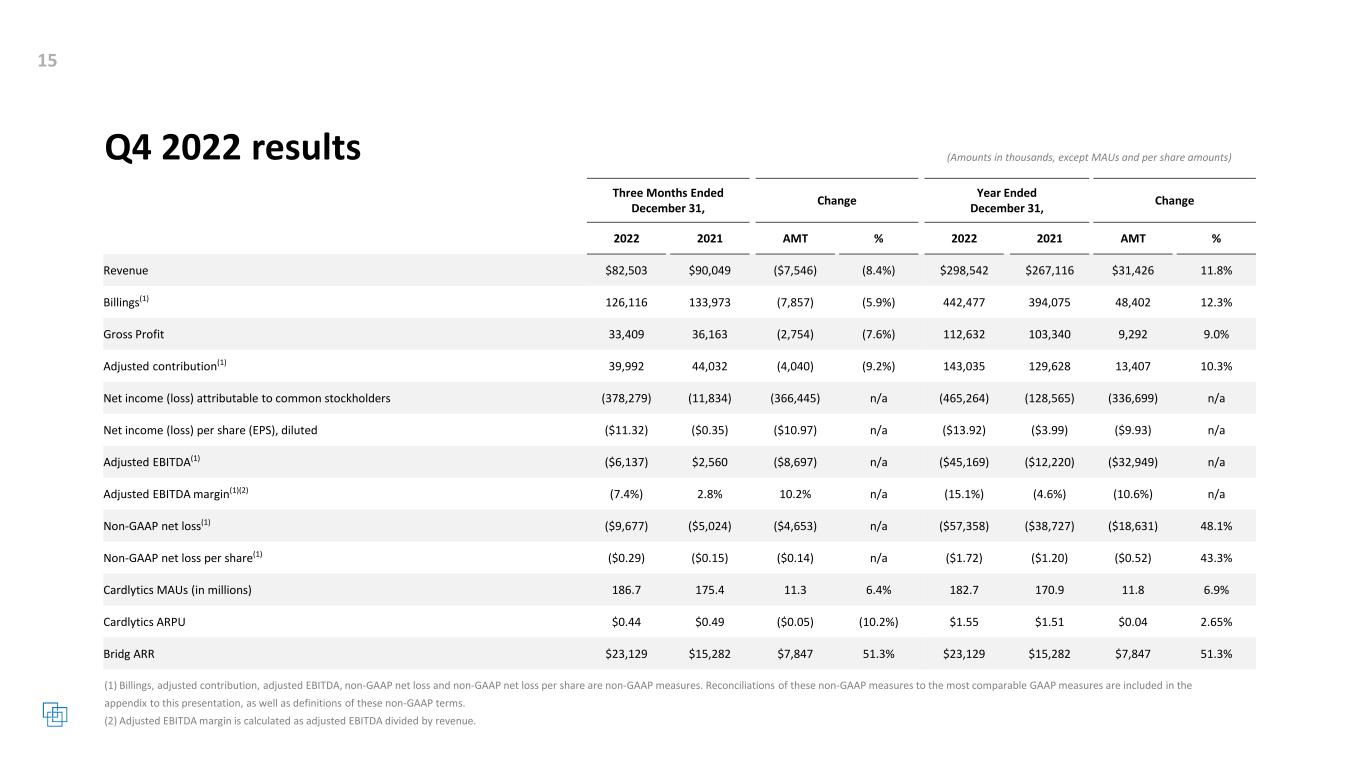
Q4 2022 results Three Months Ended December 31, Change Year Ended December 31, Change 2022 2021 AMT % 2022 2021 AMT % Revenue $82,503 $90,049 ($7,546) (8.4%) $298,542 $267,116 $31,426 11.8% Billings(1) 126,116 133,973 (7,857) (5.9%) 442,477 394,075 48,402 12.3% Gross Profit 33,409 36,163 (2,754) (7.6%) 112,632 103,340 9,292 9.0% Adjusted contribution(1) 39,992 44,032 (4,040) (9.2%) 143,035 129,628 13,407 10.3% Net income (loss) attributable to common stockholders (378,279) (11,834) (366,445) n/a (465,264) (128,565) (336,699) n/a Net income (loss) per share (EPS), diluted ($11.32) ($0.35) ($10.97) n/a ($13.92) ($3.99) ($9.93) n/a Adjusted EBITDA(1) ($6,137) $2,560 ($8,697) n/a ($45,169) ($12,220) ($32,949) n/a Adjusted EBITDA margin(1)(2) (7.4%) 2.8% 10.2% n/a (15.1%) (4.6%) (10.6%) n/a Non-GAAP net loss(1) ($9,677) ($5,024) ($4,653) n/a ($57,358) ($38,727) ($18,631) 48.1% Non-GAAP net loss per share(1) ($0.29) ($0.15) ($0.14) n/a ($1.72) ($1.20) ($0.52) 43.3% Cardlytics MAUs (in millions) 186.7 175.4 11.3 6.4% 182.7 170.9 11.8 6.9% Cardlytics ARPU $0.44 $0.49 ($0.05) (10.2%) $1.55 $1.51 $0.04 2.65% Bridg ARR $23,129 $15,282 $7,847 51.3% $23,129 $15,282 $7,847 51.3%
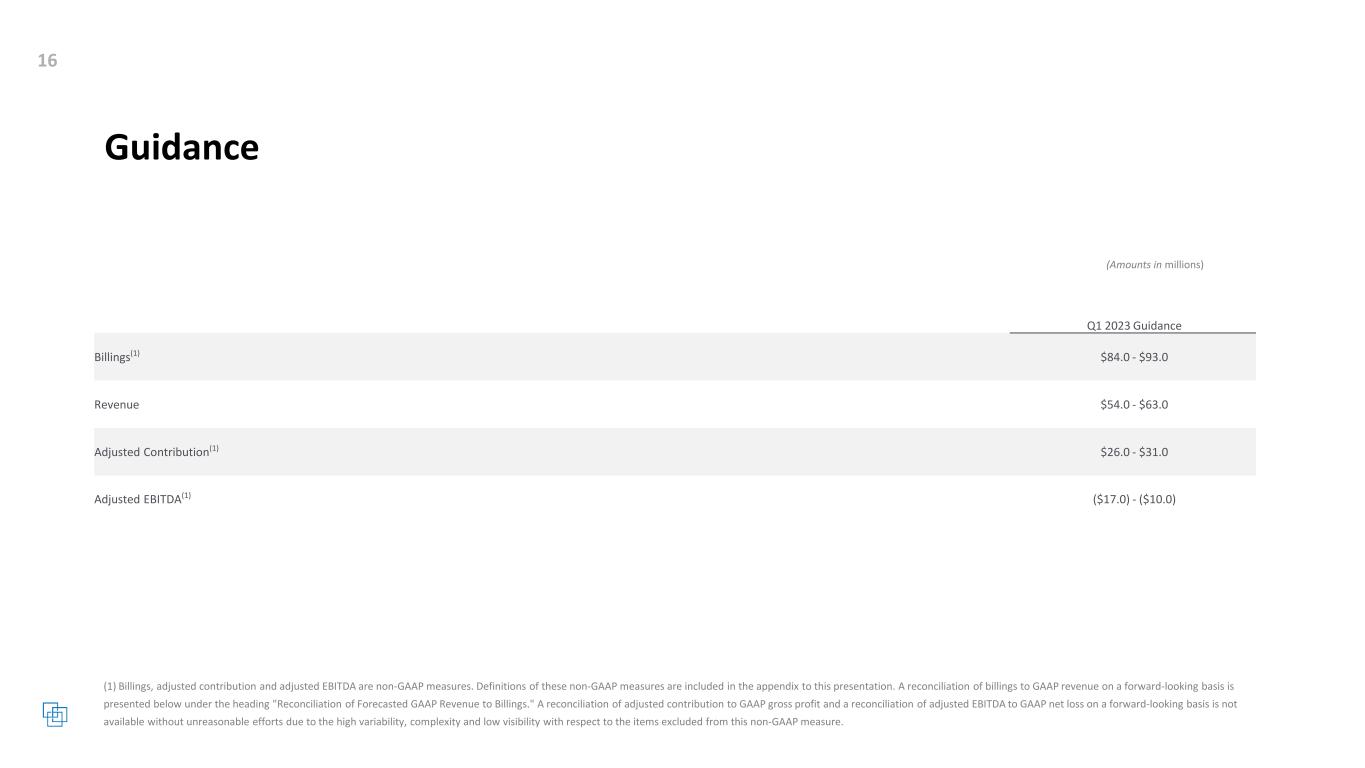
Guidance Q1 2023 Guidance Billings(1) $84.0 - $93.0 Revenue $54.0 - $63.0 Adjusted Contribution(1) $26.0 - $31.0 Adjusted EBITDA(1) ($17.0) - ($10.0)
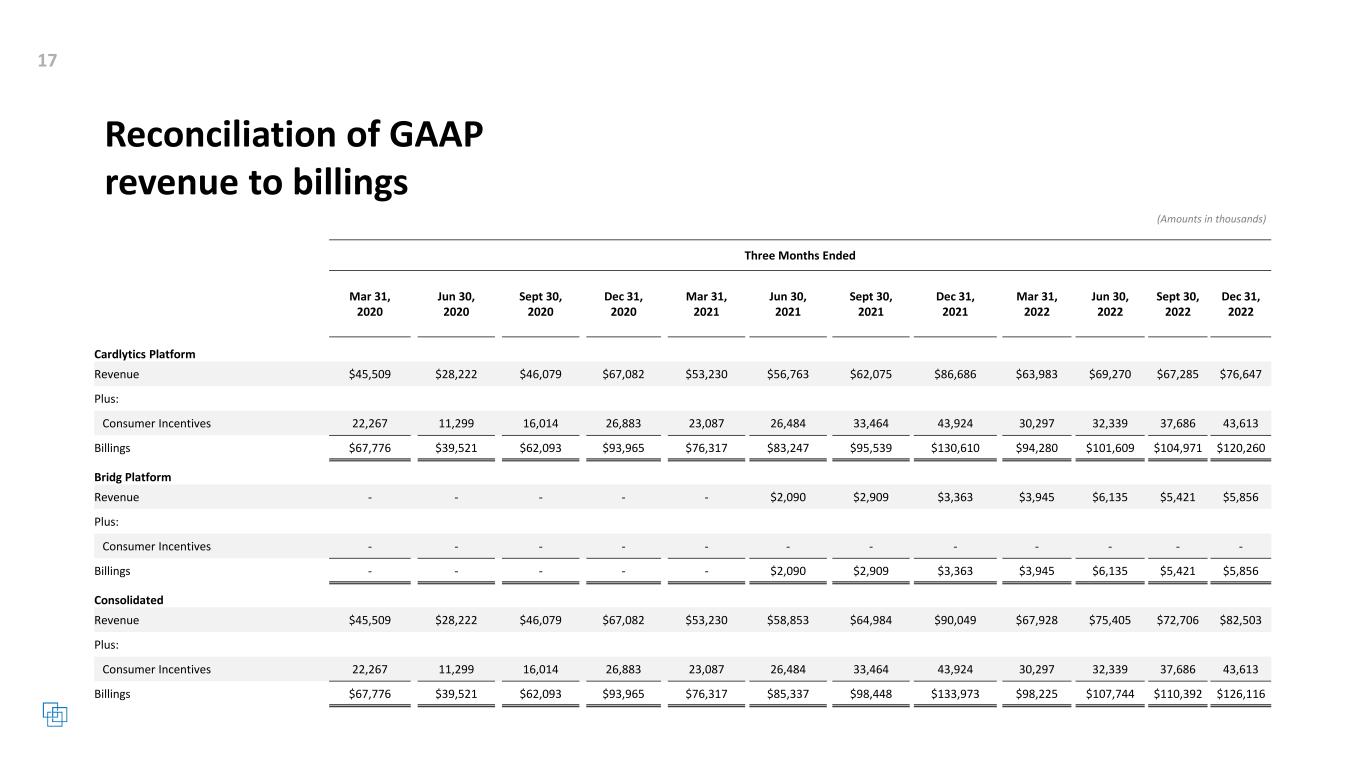
Reconciliation of GAAP revenue to billings Three Months Ended Mar 31, 2020 Jun 30, 2020 Sept 30, 2020 Dec 31, 2020 Mar 31, 2021 Jun 30, 2021 Sept 30, 2021 Dec 31, 2021 Mar 31, 2022 Jun 30, 2022 Sept 30, 2022 Dec 31, 2022 Cardlytics Platform Revenue $45,509 $28,222 $46,079 $67,082 $53,230 $56,763 $62,075 $86,686 $63,983 $69,270 $67,285 $76,647 Plus: Consumer Incentives 22,267 11,299 16,014 26,883 23,087 26,484 33,464 43,924 30,297 32,339 37,686 43,613 Billings $67,776 $39,521 $62,093 $93,965 $76,317 $83,247 $95,539 $130,610 $94,280 $101,609 $104,971 $120,260 Bridg Platform Revenue - - - - - $2,090 $2,909 $3,363 $3,945 $6,135 $5,421 $5,856 Plus: Consumer Incentives - - - - - - - - - - - - Billings - - - - - $2,090 $2,909 $3,363 $3,945 $6,135 $5,421 $5,856 Consolidated Revenue $45,509 $28,222 $46,079 $67,082 $53,230 $58,853 $64,984 $90,049 $67,928 $75,405 $72,706 $82,503 Plus: Consumer Incentives 22,267 11,299 16,014 26,883 23,087 26,484 33,464 43,924 30,297 32,339 37,686 43,613 Billings $67,776 $39,521 $62,093 $93,965 $76,317 $85,337 $98,448 $133,973 $98,225 $107,744 $110,392 $126,116
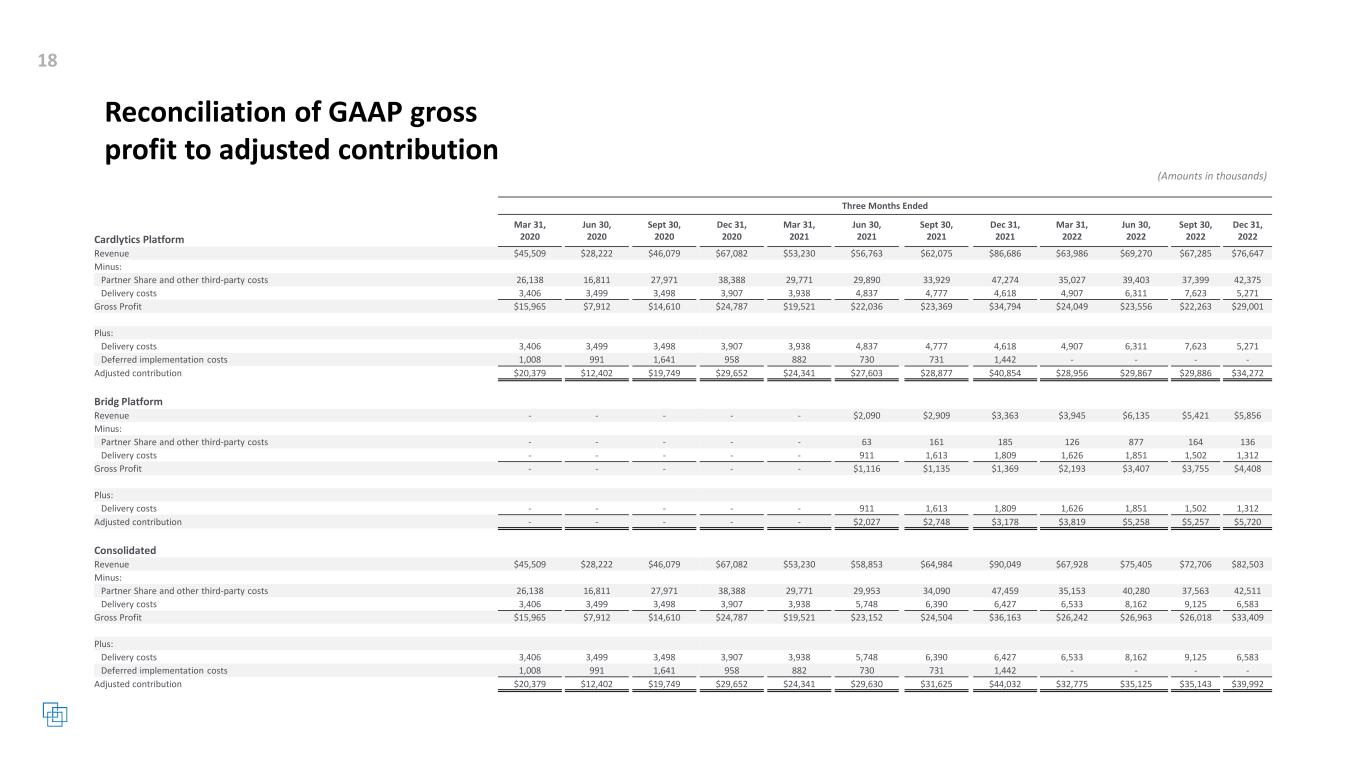
Reconciliation of GAAP gross profit to adjusted contribution Three Months Ended Mar 31, 2020 Jun 30, 2020 Sept 30, 2020 Dec 31, 2020 Mar 31, 2021 Jun 30, 2021 Sept 30, 2021 Dec 31, 2021 Mar 31, 2022 Jun 30, 2022 Sept 30, 2022 Dec 31, 2022Cardlytics Platform Revenue $45,509 $28,222 $46,079 $67,082 $53,230 $56,763 $62,075 $86,686 $63,986 $69,270 $67,285 $76,647 Minus: Partner Share and other third-party costs 26,138 16,811 27,971 38,388 29,771 29,890 33,929 47,274 35,027 39,403 37,399 42,375 Delivery costs 3,406 3,499 3,498 3,907 3,938 4,837 4,777 4,618 4,907 6,311 7,623 5,271 Gross Profit $15,965 $7,912 $14,610 $24,787 $19,521 $22,036 $23,369 $34,794 $24,049 $23,556 $22,263 $29,001 Plus: Delivery costs 3,406 3,499 3,498 3,907 3,938 4,837 4,777 4,618 4,907 6,311 7,623 5,271 Deferred implementation costs 1,008 991 1,641 958 882 730 731 1,442 - - - - Adjusted contribution $20,379 $12,402 $19,749 $29,652 $24,341 $27,603 $28,877 $40,854 $28,956 $29,867 $29,886 $34,272 Bridg Platform Revenue - - - - - $2,090 $2,909 $3,363 $3,945 $6,135 $5,421 $5,856 Minus: Partner Share and other third-party costs - - - - - 63 161 185 126 877 164 136 Delivery costs - - - - - 911 1,613 1,809 1,626 1,851 1,502 1,312 Gross Profit - - - - - $1,116 $1,135 $1,369 $2,193 $3,407 $3,755 $4,408 Plus: Delivery costs - - - - - 911 1,613 1,809 1,626 1,851 1,502 1,312 Adjusted contribution - - - - - $2,027 $2,748 $3,178 $3,819 $5,258 $5,257 $5,720 Consolidated Revenue $45,509 $28,222 $46,079 $67,082 $53,230 $58,853 $64,984 $90,049 $67,928 $75,405 $72,706 $82,503 Minus: Partner Share and other third-party costs 26,138 16,811 27,971 38,388 29,771 29,953 34,090 47,459 35,153 40,280 37,563 42,511 Delivery costs 3,406 3,499 3,498 3,907 3,938 5,748 6,390 6,427 6,533 8,162 9,125 6,583 Gross Profit $15,965 $7,912 $14,610 $24,787 $19,521 $23,152 $24,504 $36,163 $26,242 $26,963 $26,018 $33,409 Plus: Delivery costs 3,406 3,499 3,498 3,907 3,938 5,748 6,390 6,427 6,533 8,162 9,125 6,583 Deferred implementation costs 1,008 991 1,641 958 882 730 731 1,442 - - - - Adjusted contribution $20,379 $12,402 $19,749 $29,652 $24,341 $29,630 $31,625 $44,032 $32,775 $35,125 $35,143 $39,992
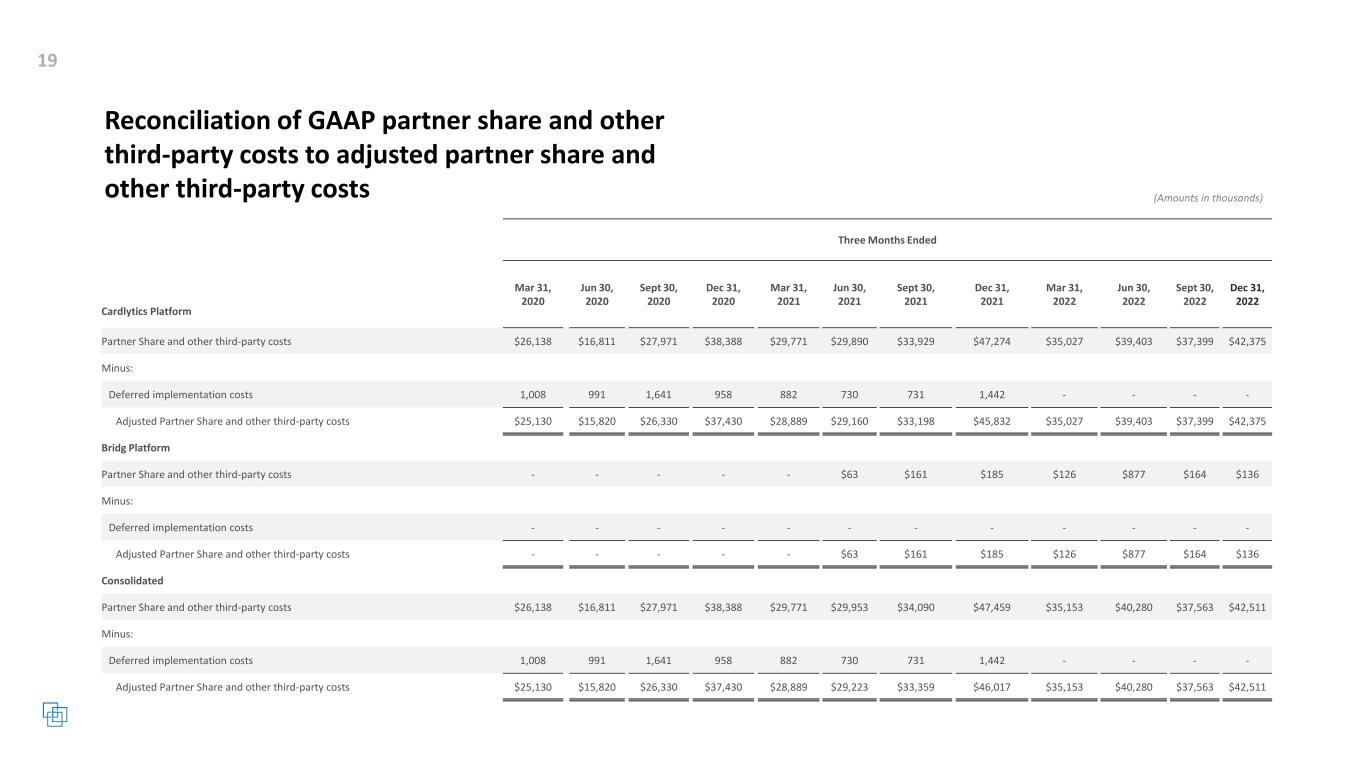
Reconciliation of GAAP partner share and other third-party costs to adjusted partner share and other third-party costs Three Months Ended Mar 31, 2020 Jun 30, 2020 Sept 30, 2020 Dec 31, 2020 Mar 31, 2021 Jun 30, 2021 Sept 30, 2021 Dec 31, 2021 Mar 31, 2022 Jun 30, 2022 Sept 30, 2022 Dec 31, 2022 Cardlytics Platform Partner Share and other third-party costs $26,138 $16,811 $27,971 $38,388 $29,771 $29,890 $33,929 $47,274 $35,027 $39,403 $37,399 $42,375 Minus: Deferred implementation costs 1,008 991 1,641 958 882 730 731 1,442 - - - - Adjusted Partner Share and other third-party costs $25,130 $15,820 $26,330 $37,430 $28,889 $29,160 $33,198 $45,832 $35,027 $39,403 $37,399 $42,375 Bridg Platform Partner Share and other third-party costs - - - - - $63 $161 $185 $126 $877 $164 $136 Minus: Deferred implementation costs - - - - - - - - - - - - Adjusted Partner Share and other third-party costs - - - - - $63 $161 $185 $126 $877 $164 $136 Consolidated Partner Share and other third-party costs $26,138 $16,811 $27,971 $38,388 $29,771 $29,953 $34,090 $47,459 $35,153 $40,280 $37,563 $42,511 Minus: Deferred implementation costs 1,008 991 1,641 958 882 730 731 1,442 - - - - Adjusted Partner Share and other third-party costs $25,130 $15,820 $26,330 $37,430 $28,889 $29,223 $33,359 $46,017 $35,153 $40,280 $37,563 $42,511
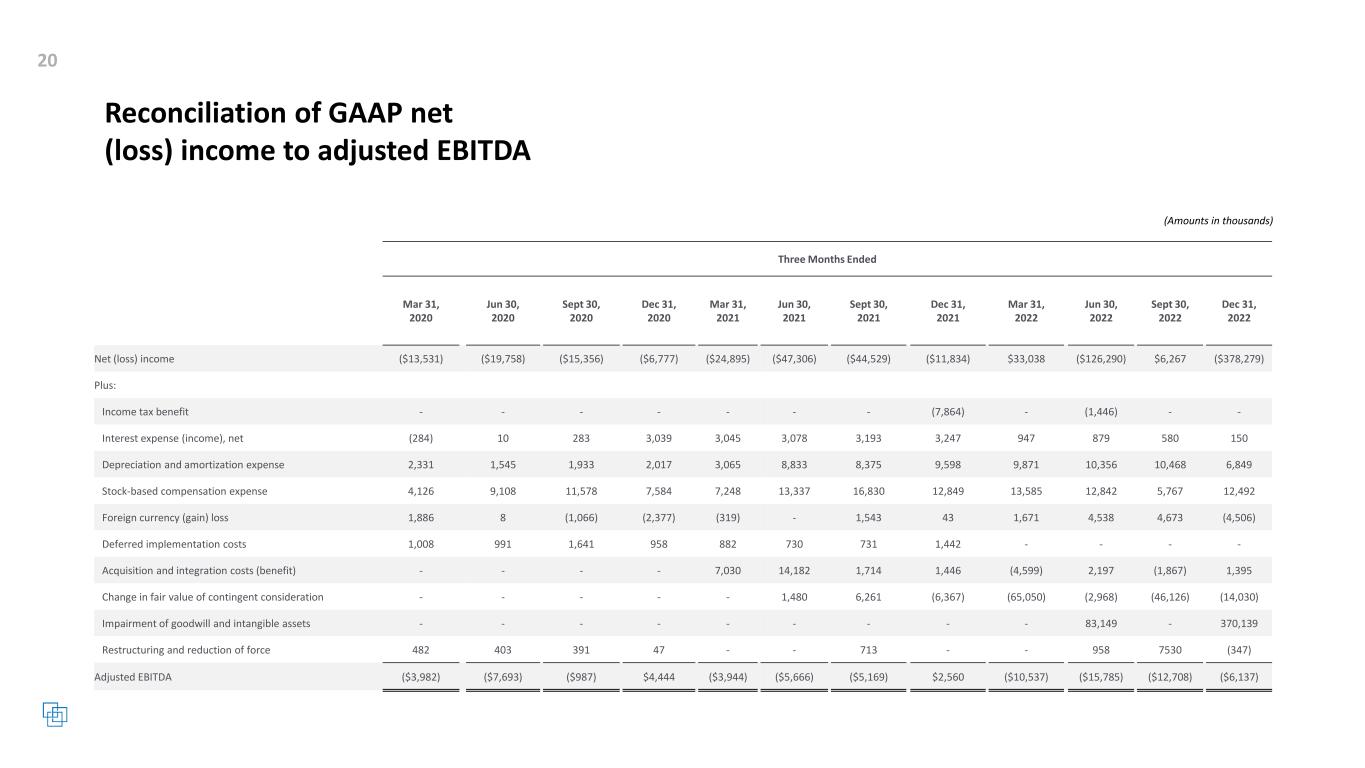
(Amounts in thousands) Reconciliation of GAAP net (loss) income to adjusted EBITDA Three Months Ended Mar 31, 2020 Jun 30, 2020 Sept 30, 2020 Dec 31, 2020 Mar 31, 2021 Jun 30, 2021 Sept 30, 2021 Dec 31, 2021 Mar 31, 2022 Jun 30, 2022 Sept 30, 2022 Dec 31, 2022 Net (loss) income ($13,531) ($19,758) ($15,356) ($6,777) ($24,895) ($47,306) ($44,529) ($11,834) $33,038 ($126,290) $6,267 ($378,279) Plus: Income tax benefit - - - - - - - (7,864) - (1,446) - - Interest expense (income), net (284) 10 283 3,039 3,045 3,078 3,193 3,247 947 879 580 150 Depreciation and amortization expense 2,331 1,545 1,933 2,017 3,065 8,833 8,375 9,598 9,871 10,356 10,468 6,849 Stock-based compensation expense 4,126 9,108 11,578 7,584 7,248 13,337 16,830 12,849 13,585 12,842 5,767 12,492 Foreign currency (gain) loss 1,886 8 (1,066) (2,377) (319) - 1,543 43 1,671 4,538 4,673 (4,506) Deferred implementation costs 1,008 991 1,641 958 882 730 731 1,442 - - - - Acquisition and integration costs (benefit) - - - - 7,030 14,182 1,714 1,446 (4,599) 2,197 (1,867) 1,395 Change in fair value of contingent consideration - - - - - 1,480 6,261 (6,367) (65,050) (2,968) (46,126) (14,030) Impairment of goodwill and intangible assets - - - - - - - - - 83,149 - 370,139 Restructuring and reduction of force 482 403 391 47 - - 713 - - 958 7530 (347) Adjusted EBITDA ($3,982) ($7,693) ($987) $4,444 ($3,944) ($5,666) ($5,169) $2,560 ($10,537) ($15,785) ($12,708) ($6,137)
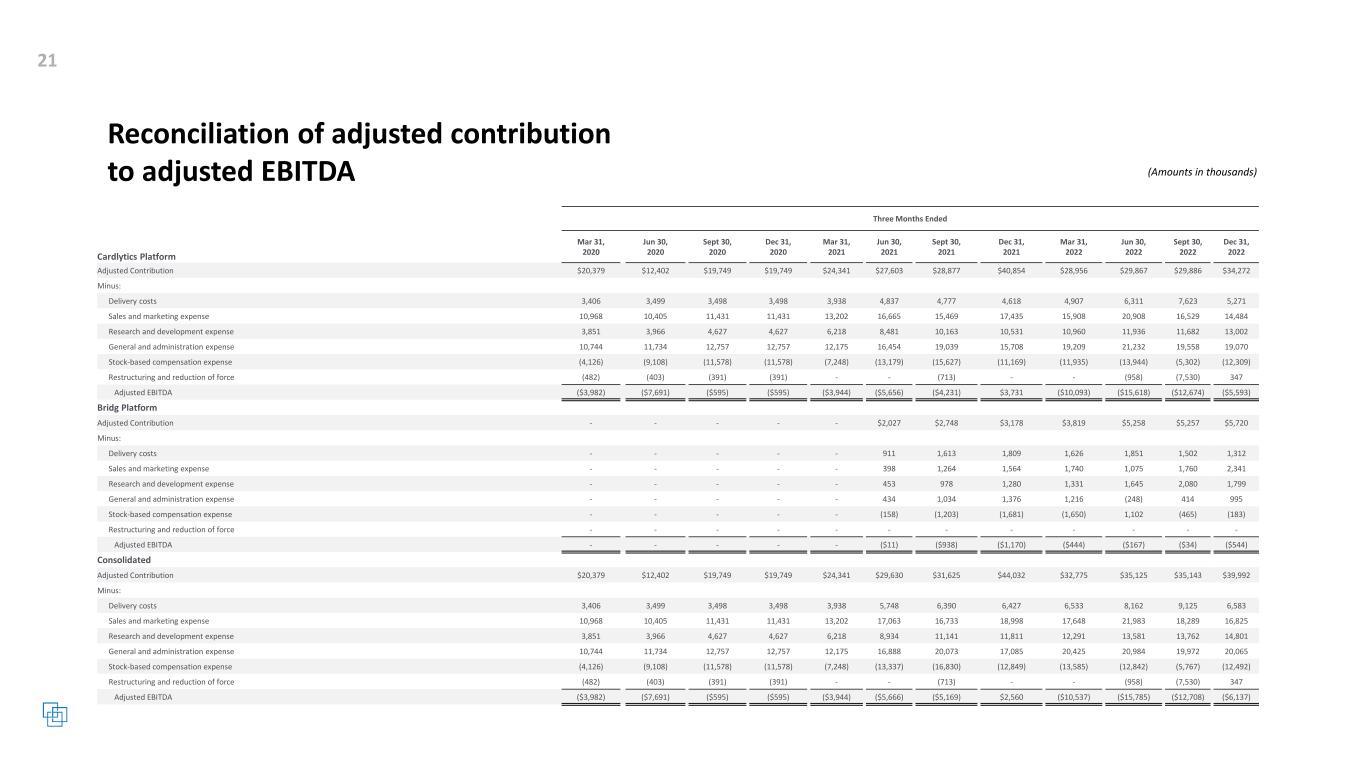
Reconciliation of adjusted contribution to adjusted EBITDA (Amounts in thousands) Three Months Ended Mar 31, 2020 Jun 30, 2020 Sept 30, 2020 Dec 31, 2020 Mar 31, 2021 Jun 30, 2021 Sept 30, 2021 Dec 31, 2021 Mar 31, 2022 Jun 30, 2022 Sept 30, 2022 Dec 31, 2022 Cardlytics Platform Adjusted Contribution $20,379 $12,402 $19,749 $19,749 $24,341 $27,603 $28,877 $40,854 $28,956 $29,867 $29,886 $34,272 Minus: Delivery costs 3,406 3,499 3,498 3,498 3,938 4,837 4,777 4,618 4,907 6,311 7,623 5,271 Sales and marketing expense 10,968 10,405 11,431 11,431 13,202 16,665 15,469 17,435 15,908 20,908 16,529 14,484 Research and development expense 3,851 3,966 4,627 4,627 6,218 8,481 10,163 10,531 10,960 11,936 11,682 13,002 General and administration expense 10,744 11,734 12,757 12,757 12,175 16,454 19,039 15,708 19,209 21,232 19,558 19,070 Stock-based compensation expense (4,126) (9,108) (11,578) (11,578) (7,248) (13,179) (15,627) (11,169) (11,935) (13,944) (5,302) (12,309) Restructuring and reduction of force (482) (403) (391) (391) - - (713) - - (958) (7,530) 347 Adjusted EBITDA ($3,982) ($7,691) ($595) ($595) ($3,944) ($5,656) ($4,231) $3,731 ($10,093) ($15,618) ($12,674) ($5,593) Bridg Platform Adjusted Contribution - - - - - $2,027 $2,748 $3,178 $3,819 $5,258 $5,257 $5,720 Minus: Delivery costs - - - - - 911 1,613 1,809 1,626 1,851 1,502 1,312 Sales and marketing expense - - - - - 398 1,264 1,564 1,740 1,075 1,760 2,341 Research and development expense - - - - - 453 978 1,280 1,331 1,645 2,080 1,799 General and administration expense - - - - - 434 1,034 1,376 1,216 (248) 414 995 Stock-based compensation expense - - - - - (158) (1,203) (1,681) (1,650) 1,102 (465) (183) Restructuring and reduction of force - - - - - - - - - - - - Adjusted EBITDA - - - - - ($11) ($938) ($1,170) ($444) ($167) ($34) ($544) Consolidated Adjusted Contribution $20,379 $12,402 $19,749 $19,749 $24,341 $29,630 $31,625 $44,032 $32,775 $35,125 $35,143 $39,992 Minus: Delivery costs 3,406 3,499 3,498 3,498 3,938 5,748 6,390 6,427 6,533 8,162 9,125 6,583 Sales and marketing expense 10,968 10,405 11,431 11,431 13,202 17,063 16,733 18,998 17,648 21,983 18,289 16,825 Research and development expense 3,851 3,966 4,627 4,627 6,218 8,934 11,141 11,811 12,291 13,581 13,762 14,801 General and administration expense 10,744 11,734 12,757 12,757 12,175 16,888 20,073 17,085 20,425 20,984 19,972 20,065 Stock-based compensation expense (4,126) (9,108) (11,578) (11,578) (7,248) (13,337) (16,830) (12,849) (13,585) (12,842) (5,767) (12,492) Restructuring and reduction of force (482) (403) (391) (391) - - (713) - - (958) (7,530) 347 Adjusted EBITDA ($3,982) ($7,691) ($595) ($595) ($3,944) ($5,666) ($5,169) $2,560 ($10,537) ($15,785) ($12,708) ($6,137)
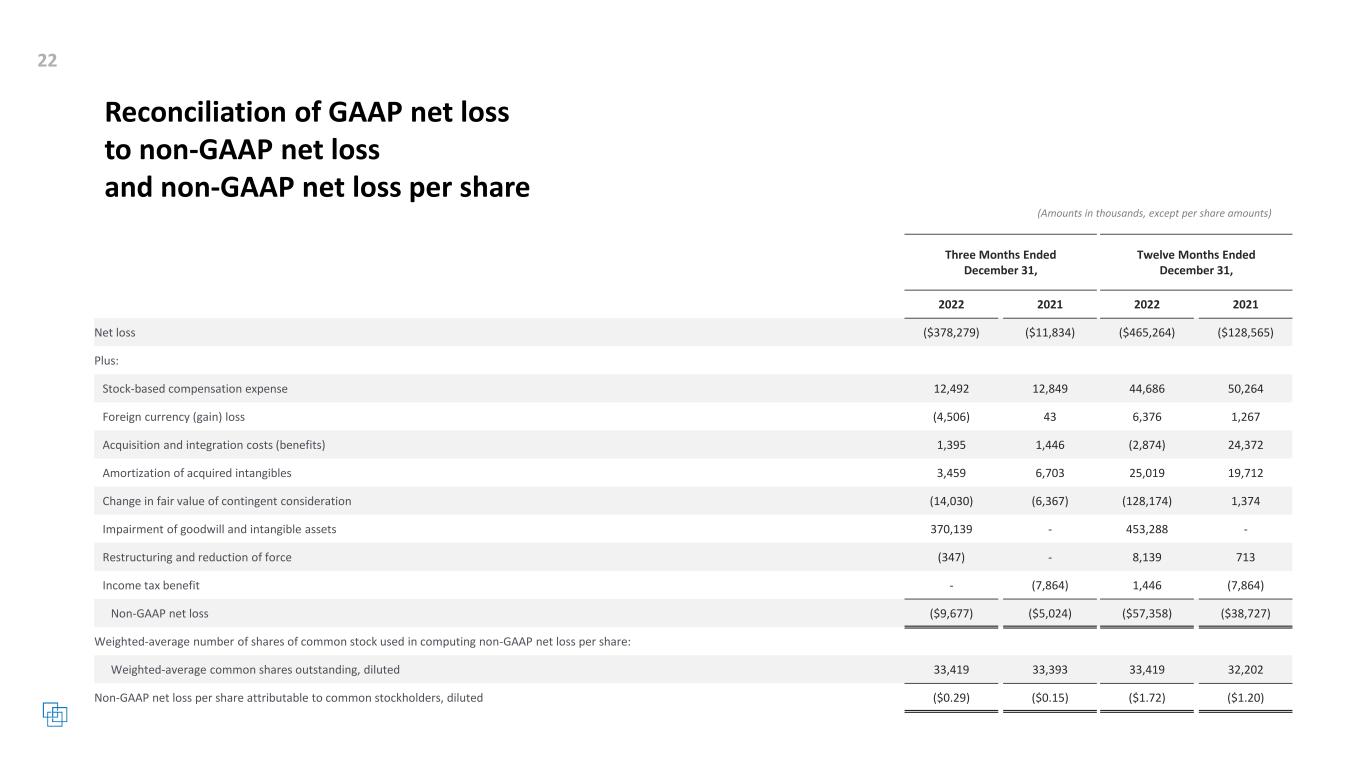
Reconciliation of GAAP net loss to non-GAAP net loss and non-GAAP net loss per share Three Months Ended Twelve Months Ended December 31, December 31, 2022 2021 2022 2021 Net loss ($378,279) ($11,834) ($465,264) ($128,565) Plus: Stock-based compensation expense 12,492 12,849 44,686 50,264 Foreign currency (gain) loss (4,506) 43 6,376 1,267 Acquisition and integration costs (benefits) 1,395 1,446 (2,874) 24,372 Amortization of acquired intangibles 3,459 6,703 25,019 19,712 Change in fair value of contingent consideration (14,030) (6,367) (128,174) 1,374 Impairment of goodwill and intangible assets 370,139 - 453,288 - Restructuring and reduction of force (347) - 8,139 713 Income tax benefit - (7,864) 1,446 (7,864) Non-GAAP net loss ($9,677) ($5,024) ($57,358) ($38,727) Weighted-average number of shares of common stock used in computing non-GAAP net loss per share: Weighted-average common shares outstanding, diluted 33,419 33,393 33,419 32,202 Non-GAAP net loss per share attributable to common stockholders, diluted ($0.29) ($0.15) ($1.72) ($1.20)
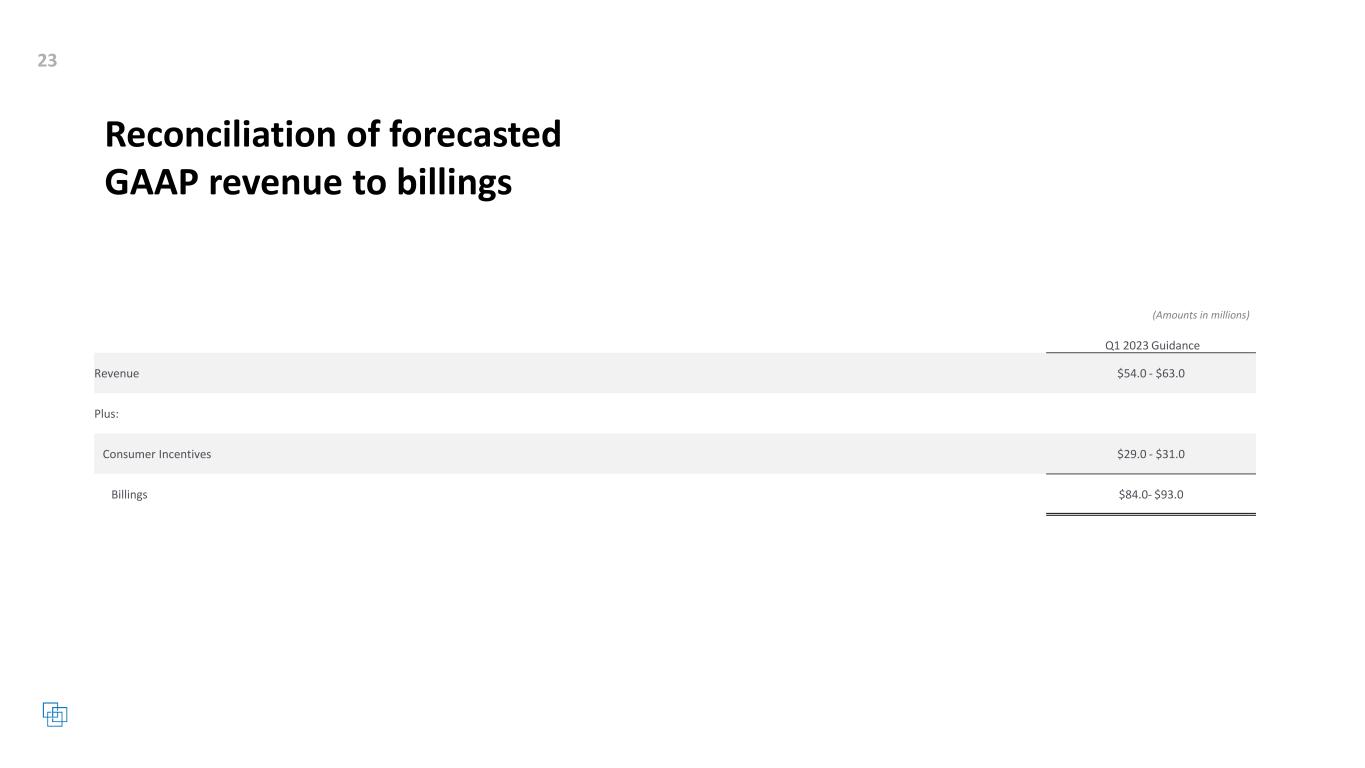
Reconciliation of forecasted GAAP revenue to billings Q1 2023 Guidance Revenue $54.0 - $63.0 Plus: Consumer Incentives $29.0 - $31.0 Billings $84.0- $93.0
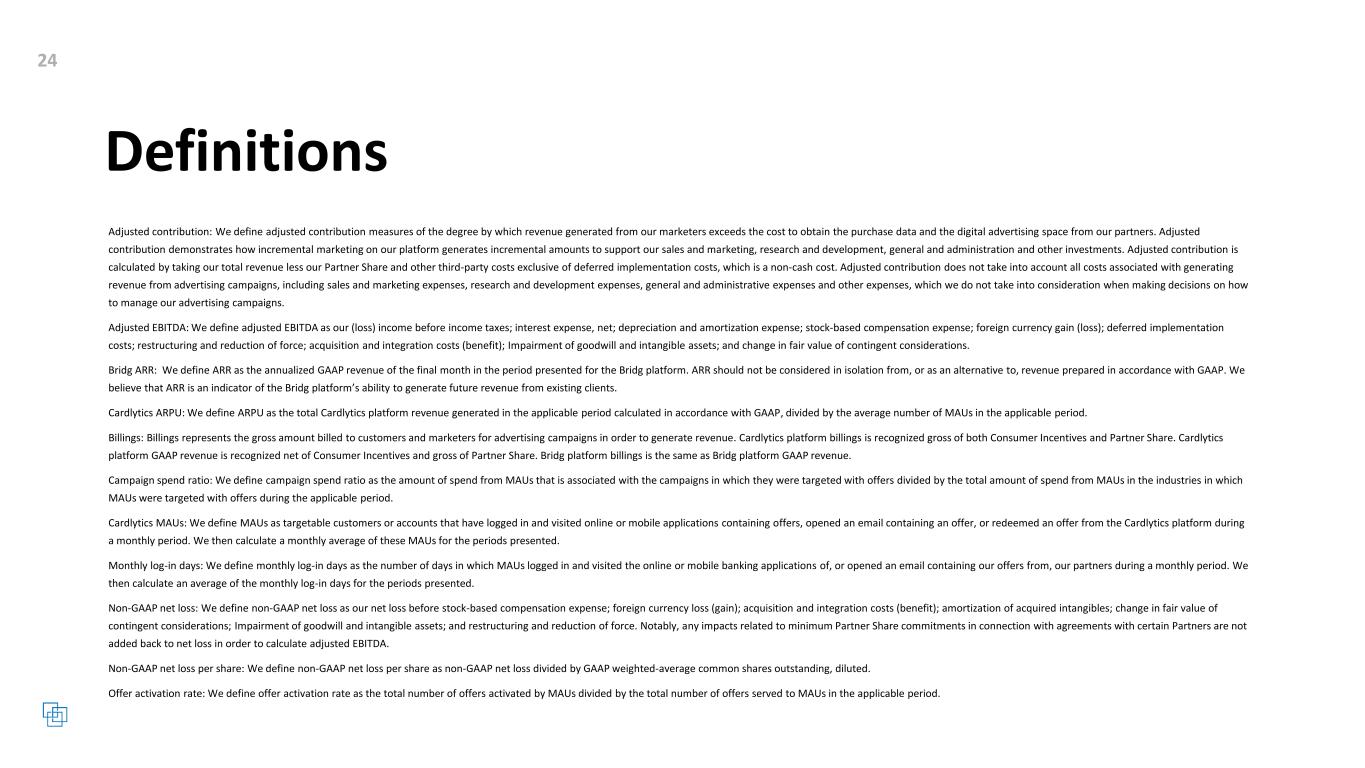
Definitions Adjusted contribution: We define adjusted contribution measures of the degree by which revenue generated from our marketers exceeds the cost to obtain the purchase data and the digital advertising space from our partners. Adjusted contribution demonstrates how incremental marketing on our platform generates incremental amounts to support our sales and marketing, research and development, general and administration and other investments. Adjusted contribution is calculated by taking our total revenue less our Partner Share and other third-party costs exclusive of deferred implementation costs, which is a non-cash cost. Adjusted contribution does not take into account all costs associated with generating revenue from advertising campaigns, including sales and marketing expenses, research and development expenses, general and administrative expenses and other expenses, which we do not take into consideration when making decisions on how to manage our advertising campaigns. Adjusted EBITDA: We define adjusted EBITDA as our (loss) income before income taxes; interest expense, net; depreciation and amortization expense; stock-based compensation expense; foreign currency gain (loss); deferred implementation costs; restructuring and reduction of force; acquisition and integration costs (benefit); Impairment of goodwill and intangible assets; and change in fair value of contingent considerations. Bridg ARR: We define ARR as the annualized GAAP revenue of the final month in the period presented for the Bridg platform. ARR should not be considered in isolation from, or as an alternative to, revenue prepared in accordance with GAAP. We believe that ARR is an indicator of the Bridg platform’s ability to generate future revenue from existing clients. Cardlytics ARPU: We define ARPU as the total Cardlytics platform revenue generated in the applicable period calculated in accordance with GAAP, divided by the average number of MAUs in the applicable period. Billings: Billings represents the gross amount billed to customers and marketers for advertising campaigns in order to generate revenue. Cardlytics platform billings is recognized gross of both Consumer Incentives and Partner Share. Cardlytics platform GAAP revenue is recognized net of Consumer Incentives and gross of Partner Share. Bridg platform billings is the same as Bridg platform GAAP revenue. Campaign spend ratio: We define campaign spend ratio as the amount of spend from MAUs that is associated with the campaigns in which they were targeted with offers divided by the total amount of spend from MAUs in the industries in which MAUs were targeted with offers during the applicable period. Cardlytics MAUs: We define MAUs as targetable customers or accounts that have logged in and visited online or mobile applications containing offers, opened an email containing an offer, or redeemed an offer from the Cardlytics platform during a monthly period. We then calculate a monthly average of these MAUs for the periods presented. Monthly log-in days: We define monthly log-in days as the number of days in which MAUs logged in and visited the online or mobile banking applications of, or opened an email containing our offers from, our partners during a monthly period. We then calculate an average of the monthly log-in days for the periods presented. Non-GAAP net loss: We define non-GAAP net loss as our net loss before stock-based compensation expense; foreign currency loss (gain); acquisition and integration costs (benefit); amortization of acquired intangibles; change in fair value of contingent considerations; Impairment of goodwill and intangible assets; and restructuring and reduction of force. Notably, any impacts related to minimum Partner Share commitments in connection with agreements with certain Partners are not added back to net loss in order to calculate adjusted EBITDA. Non-GAAP net loss per share: We define non-GAAP net loss per share as non-GAAP net loss divided by GAAP weighted-average common shares outstanding, diluted. Offer activation rate: We define offer activation rate as the total number of offers activated by MAUs divided by the total number of offers served to MAUs in the applicable period.
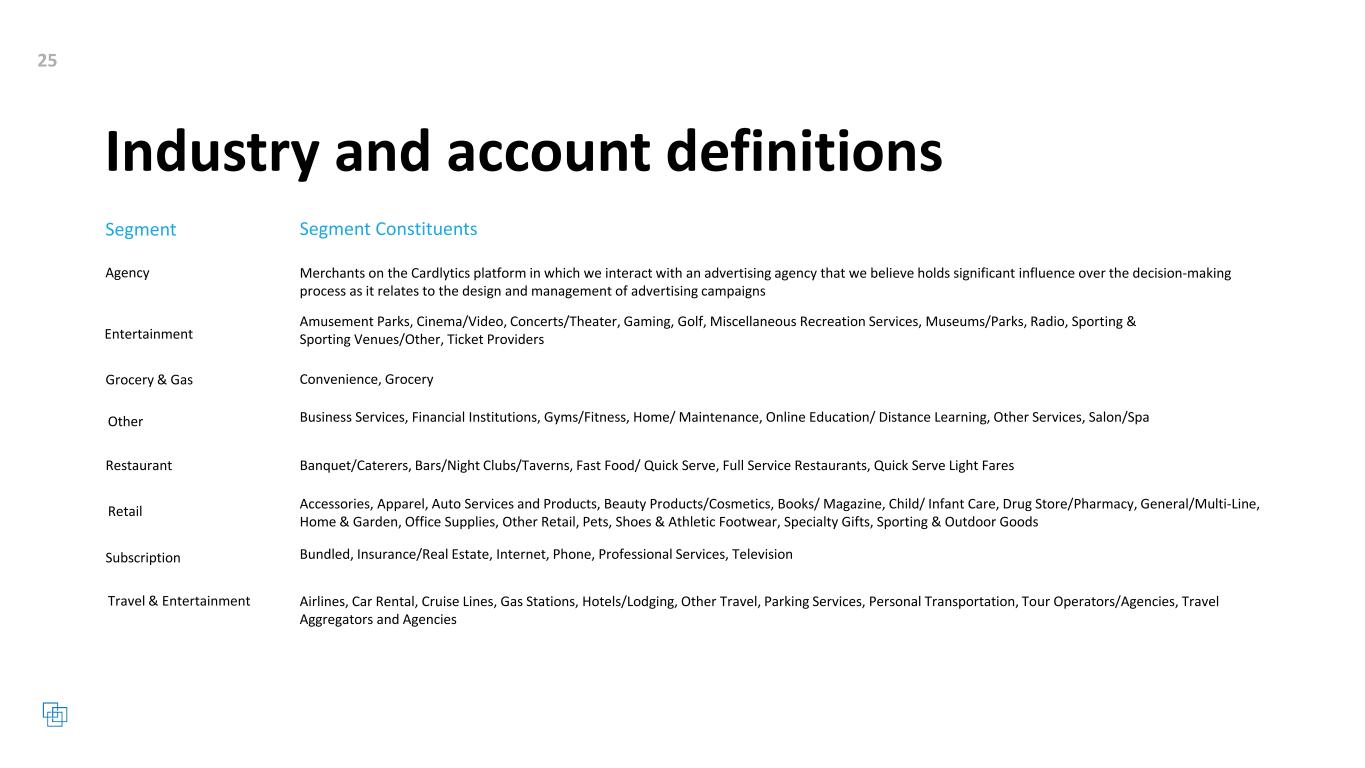
Industry and account definitions Segment Segment Constituents Entertainment Amusement Parks, Cinema/Video, Concerts/Theater, Gaming, Golf, Miscellaneous Recreation Services, Museums/Parks, Radio, Sporting & Sporting Venues/Other, Ticket Providers Grocery & Gas Convenience, Grocery Other Business Services, Financial Institutions, Gyms/Fitness, Home/ Maintenance, Online Education/ Distance Learning, Other Services, Salon/Spa Restaurant Banquet/Caterers, Bars/Night Clubs/Taverns, Fast Food/ Quick Serve, Full Service Restaurants, Quick Serve Light Fares Retail Accessories, Apparel, Auto Services and Products, Beauty Products/Cosmetics, Books/ Magazine, Child/ Infant Care, Drug Store/Pharmacy, General/Multi-Line, Home & Garden, Office Supplies, Other Retail, Pets, Shoes & Athletic Footwear, Specialty Gifts, Sporting & Outdoor Goods Subscription Bundled, Insurance/Real Estate, Internet, Phone, Professional Services, Television Travel & Entertainment Airlines, Car Rental, Cruise Lines, Gas Stations, Hotels/Lodging, Other Travel, Parking Services, Personal Transportation, Tour Operators/Agencies, Travel Aggregators and Agencies Merchants on the Cardlytics platform in which we interact with an advertising agency that we believe holds significant influence over the decision-making process as it relates to the design and management of advertising campaigns Agency