United States
Securities and Exchange Commission
Washington, D.C. 20549
Form
Current Report
Pursuant to Section 13 or 15(d) of the Securities Exchange Act of 1934
Date of Report (Date of earliest event reported):
(Exact name of registrant as specified in its charter)
(State or other jurisdiction | (Commission File Number) | (IRS Employer |
of incorporation) |
| Identification Number) |
(Zip Code) | |
(Address of principal executive offices) |
|
Registrant’s telephone number, including area code: (
N/A
(Former name or former address, if changed since last report.)
Check the appropriate box below if the Form 8-K filing is intended to simultaneously satisfy the filing obligation of the registrant under any of the following provisions:
Securities registered pursuant to Section 12(b) of the Act:
Title of each class | Trading Symbol | Name of each exchange on which registered |
Indicate by check mark whether the registrant is an emerging growth company as defined in Rule 405 of the Securities Act of 1933 (§230.405 of this chapter) or Rule 12b-2 of the Securities Exchange Act of 1934 (§240.12b-2 of this chapter).
Emerging growth company |
If an emerging growth company, indicate by check mark if the registrant has elected not to use the extended transition period for complying with any new or revised financial accounting standards provided pursuant to Section 13(a) of the Exchange Act.
Item 2.02 Results of Operations and Financial Condition
On August 11, 2022, Cadre Holdings, Inc. (the “Company”) issued a press release announcing its financial results for the quarter ended June 30, 2022. A copy of this press release is attached hereto as Exhibit 99.1 and is incorporated herein by reference. Attached hereto as Exhibit 99.2 and incorporated herein by reference is a presentation regarding the Company’s financial results for the quarter ended June 30, 2022.
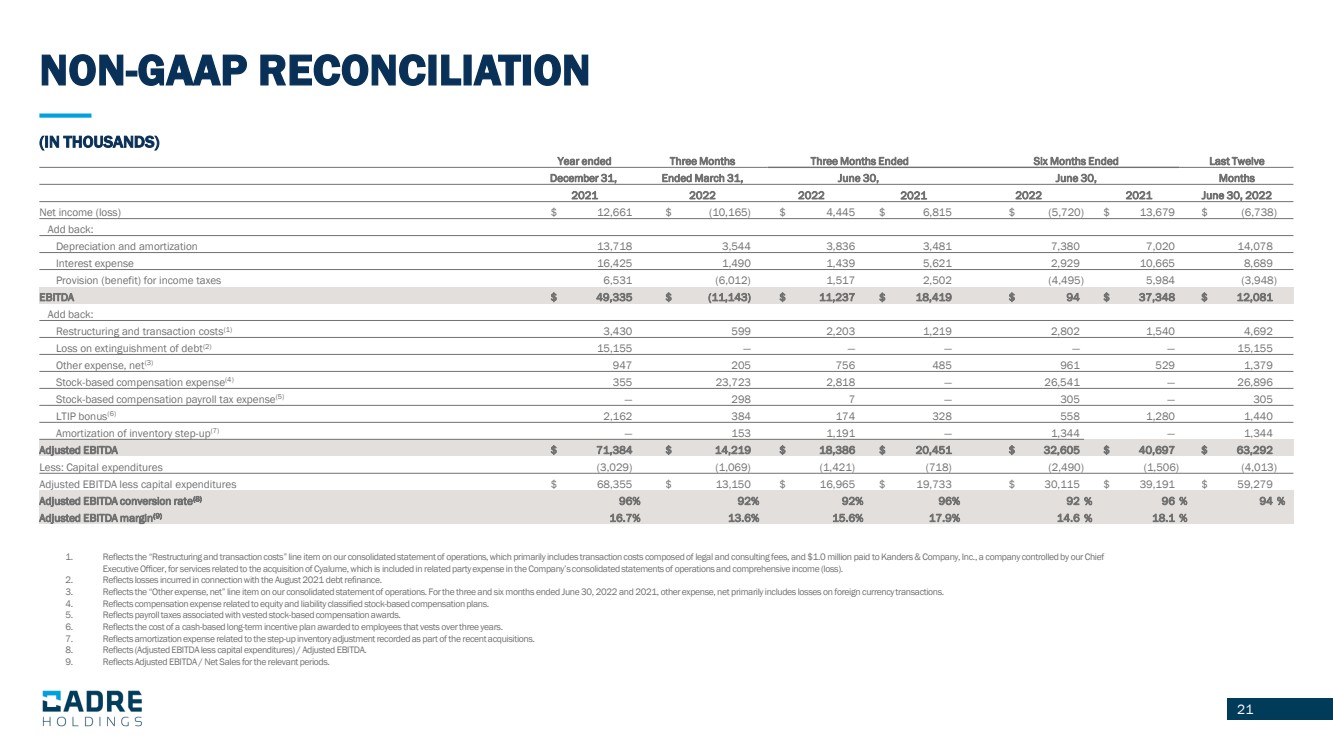
The press release and presentation contain the non-GAAP measures: (i) earnings before interest, taxes, other income or expense, depreciation and amortization (“EBITDA”), (ii) adjusted EBITDA, (iii) adjusted EBITDA margin, (iv) adjusted EBITDA conversion rate and (v) LTM adjusted EBITDA. The Company believes that the presentation of these non-GAAP measures provides useful information for the understanding of its ongoing operations and enables investors to focus on period-over-period operating performance, and thereby enhances the user's overall understanding of the Company's current financial performance relative to past performance and provides, along with the nearest GAAP measures, a baseline for modeling future earnings expectations. The non-GAAP measures are reconciled to comparable GAAP financial measures within the press release and the presentation. The Company cautions that non-GAAP measures should be considered in addition to, but not as a substitute for, the Company’s reported GAAP results. Additionally, the Company notes that there can be no assurance that the above referenced non-GAAP financial measures are comparable to similarly titled financial measures used by other publicly traded companies.
The information in Items 2.02 and 7.01 of this Current Report on Form 8-K (including Exhibits 99.1 and 99.2 attached hereto) shall not be deemed “filed” for purposes of Section 18 of the Securities Act of 1934, as amended, nor shall it be deemed incorporated by reference in any filing under the Securities Act of 1933, as amended, except as shall be expressly set forth by specific reference in such filing.
Item 7.01. Regulation FD Disclosure
The information set forth under Item 2.02 “Results of Operations and Financial Condition” is incorporated into this Item 7.01 by reference.
Item 9.01. Financial Statements and Exhibits
(d) Exhibits.
Exhibit | Description | |
|
|
|
99.1 |
| |
99.2 |
| Slide Presentation for Conference Call held on August 11, 2022 (furnished only). |
104 |
| Cover Page Interactive Data File (embedded within the Inline XBRL document). |
SIGNATURES
Pursuant to the requirements of the Securities Exchange Act of 1934, as amended, the Company has duly caused this report to be signed on its behalf by the undersigned hereunto duly authorized.
Dated: August 11, 2022
| CADRE HOLDINGS, INC. | |
|
| |
|
| |
| By: | /s/ Blaine Browers |
|
| Name:Blaine Brower |
|
| Title:Chief Financial Officer |
Exhibit 99.1
Cadre Holdings Reports Second Quarter 2022 Financial Results
Exceeds Pricing Growth Target Above Inflation, Generates Strong Adjusted EBITDA Conversion, and Increases Orders Backlog
Further Expands International Presence and Focus on High Margin Businesses with Strong Recurring Revenues and Cash Flows Following Second Accretive Acquisition Since IPO
Reaffirms 2022 Full-Year Guidance
JACKSONVILLE, Fla., August 11, 2022 – Cadre Holdings, Inc. (NYSE: CDRE) ("Cadre" or "the Company"), a global leader in the manufacturing and distribution of safety and survivability equipment for first responders, announced today its consolidated operating results for the three and six months ended June 30, 2022.
Second Quarter and June 2022 Year-to-Date Highlights
| ● | Net sales of $118.2 million for the second quarter; net sales of $222.6 million for the six months ended June 30, 2022 |
| ● | Gross profit margin of 36.6% for the second quarter; gross profit margin of 37.5% for the six months ended June 30, 2022 |
| ● | Net income of $4.4 million, or $0.12 per diluted share, for the second quarter; net loss of $5.7 million, or $0.16 per diluted share, for the six months ended June 30, 2022 |
| ● | Adjusted EBITDA of $18.4 million for the second quarter; Adjusted EBITDA of $32.6 million for the six months ended June 30, 2022 |
| ● | Adjusted EBITDA margin of 15.6% for the second quarter; Adjusted EBITDA margin of 14.6% for the six months ended June 30, 2022 |
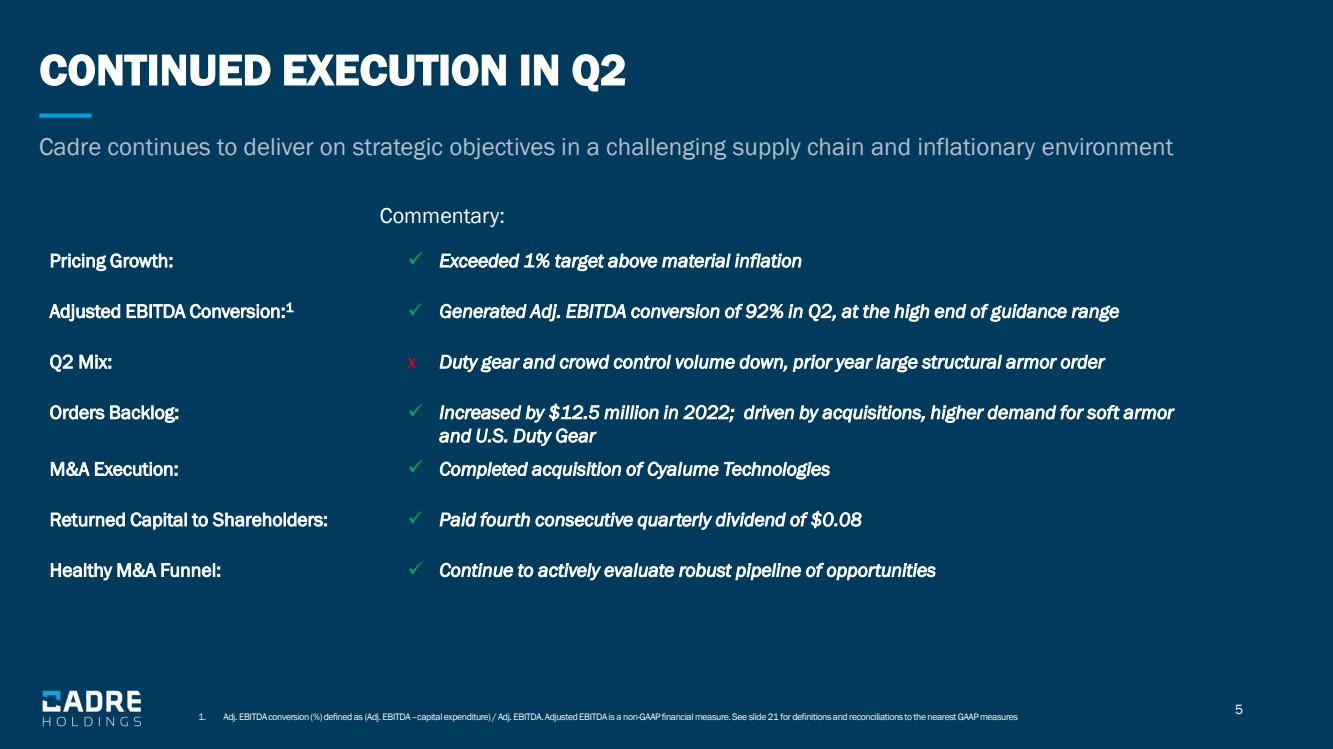
| ● | Adjusted EBITDA conversion of 92% for the second quarter; Adjusted EBITDA conversion of 92 % for the six months ended June 30, 2022 |
| ● | Declared quarterly cash dividend of $0.08 per share in July 2022 |
“During the quarter, we took important steps to position Cadre to further enhance our leadership in providing mission-critical safety and survivability equipment, as we seek to create long-term shareholder value,” said Warren Kanders, CEO and Chairman. “During the quarter, and against a backdrop of ongoing supply chain disruptions, we exceeded our 1% pricing growth target above inflation, while drawing on our low Cap-Ex model to generate strong Adjusted EBITDA conversion. We also grew our orders backlog, as demand for our trusted products remains strong, and we continue to expect our product portfolio mix to normalize in the second half of 2022. Our entrenched positions in law enforcement, first responder and military markets continue to serve us well, and we remain focused on further implementing our resilient and proven operating model aimed at creating significant value for customers and all Cadre stakeholders, as well as driving margin expansion over the long term.”
Mr. Kanders added, “We continue to draw on our strong cash flow to capitalize on attractive opportunities, and during the second quarter we further enhanced our liquidity position with an oversubscribed secondary offering. Complementing our core organic growth initiatives, we maintain a robust acquisition pipeline and are poised to build on our significant progress to date. We are pleased with the efficient integration of the two acquisitions since our IPO, and we continue to actively evaluate and are excited about additional opportunities, consistent with our focus on high margin companies with leading market positions and strong recurring revenues and cash flows.”
Second Quarter and June 2022 Year-to-Date Operating Results
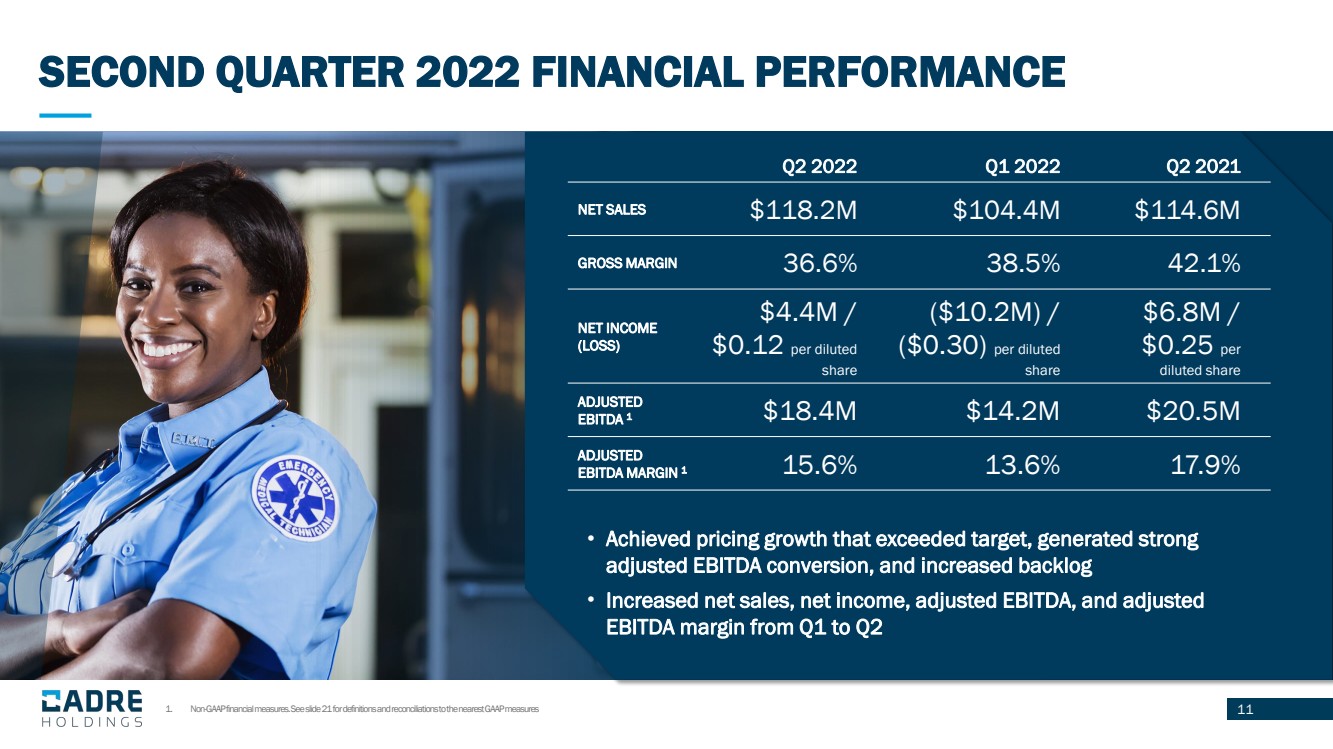
For the quarter ended June 30, 2022, Cadre generated net sales of $118.2 million, as compared to $114.6 million for the quarter ended June 30, 2021. The increase was primarily the result of recent acquisitions and increased armor demand.
For the six months ended June 30, 2022, Cadre generated net sales of $222.6 million, as compared to $225.1 million for the prior year period mainly driven by prior year US Federal and crowd control shipments.
For the quarter ended June 30, 2022, Cadre generated gross profit of $43.2 million, as compared to $48.2 million for the quarter ended June 30, 2021. For the six months ended June 30, 2022, Cadre generated gross profit of $83.4 million, as compared to $92.2 million for the prior year period.
Gross profit margin was 36.6% for the quarter ended June 30, 2022, as compared to 42.1% for the quarter ended June 30, 2021, mainly driven by amortization of inventory step-up of 101 basis points and less favorable portfolio mix, partially offset by pricing in excess of material inflation.
Gross profit margin was 37.5% for the six months ended June 30, 2022, as compared to 41.0% for the prior year period, mainly driven by amortization of inventory step-up of 60 basis points and less favorable portfolio mix, partially offset by pricing in excess of material inflation.
Net income was $4.4 million for the quarter ended June 30, 2022, as compared to net income of $6.8 million for the quarter ended June 30, 2021. The decrease resulted primarily from increased stock-based compensation expense, losses on foreign currency transactions and discrete acquisition-related expenses, partially offset by increased revenue.
Net loss was $5.7 million for the six months ended June 30, 2022, as compared to net income of $13.7 million for the prior year period, primarily as a result of increased stock-based compensation expense.
Cadre generated $18.4 million of Adjusted EBITDA for the quarter ended June 30, 2022, as compared to $20.5 million for the quarter ended June 30, 2021. Adjusted EBITDA margin was 15.6% for the quarter ended June 30, 2022, as compared to 17.9% for the prior year period.
Cadre generated $32.6 million of Adjusted EBITDA for the six months ended June 30, 2022, as compared to $40.7 million for the prior year period. Adjusted EBITDA margin was 14.6% for the six months ended June 30, 2022, as compared to 18.1% for the prior year period.
Product segment gross margin was 39.0% and 39.5% for the second quarter and first half of 2022, respectively, compared to 43.5% and 42.1% for the respective prior year periods.
Distribution segment gross margin was 18.2% and 21.4% for the second quarter and first half of 2022, respectively, compared to 25.5% and 25.4% for the respective prior year periods.
Liquidity, Cash Flows and Capital Allocation
| ● | Cash and cash equivalents decreased by $5.0 million from $33.9 million as of December 31, 2021 to $28.9 million as of June 30, 2022. |
| ● | Total debt decreased by $7.1 million from $159.7 million as of December 31, 2021, to $152.6 million as of June 30, 2022. |
| ● | Net debt (total debt net of cash and cash equivalents) decreased by $2.1 million from $125.8 million as of December 31, 2021, to $123.7 million as of June 30, 2022. |
| ● | Capital expenditures totaled $1.4 million for the second quarter and $2.5 million for the six months ended June 30, 2022, compared with $0.7 million for the second quarter and $1.5 million for the six months ended June 30, 2021. |
Secondary Offering
On June 9, 2022, Cadre completed a secondary offering in which the Company issued and sold 2,250,000 shares of common stock at a price of $23.50 per share, resulting in net proceeds to the Company of $47.0 million after underwriter discounts and commissions, fees and expenses.
On July 14, 2022, the underwriters exercised a portion of their over-allotment option and purchased an additional 300,000 shares of common stock at a price of $23.50 per share, resulting in net proceeds to the Company of $6.6 million after underwriter discounts and commissions, fees and expenses.
Acquisition of Cyalume Technologies
On May 5, 2022, Cadre announced the completion of its accretive acquisition of Cyalume Technologies, a leading manufacturer of proprietary chemical illumination solutions for military, first responder and other commercial applications. The purchase price for the acquisition was $35.7 million, net of cash acquired, subject to customary adjustments for net working capital, transaction expenses and indebtedness, and was funded through a draw on its existing credit facilities.
Dividend
On July 20, 2022, the Company announced that its Board of Directors declared a quarterly cash dividend of $0.08 per share, or $0.32 per share on an annualized basis. Cadre's dividend payment will be made on August 12, 2022, to shareholders of record as of the close of business on the record date of August 1, 2022. The declaration of any future dividend is subject to the discretion of the Company's Board of Directors.
2022 Outlook
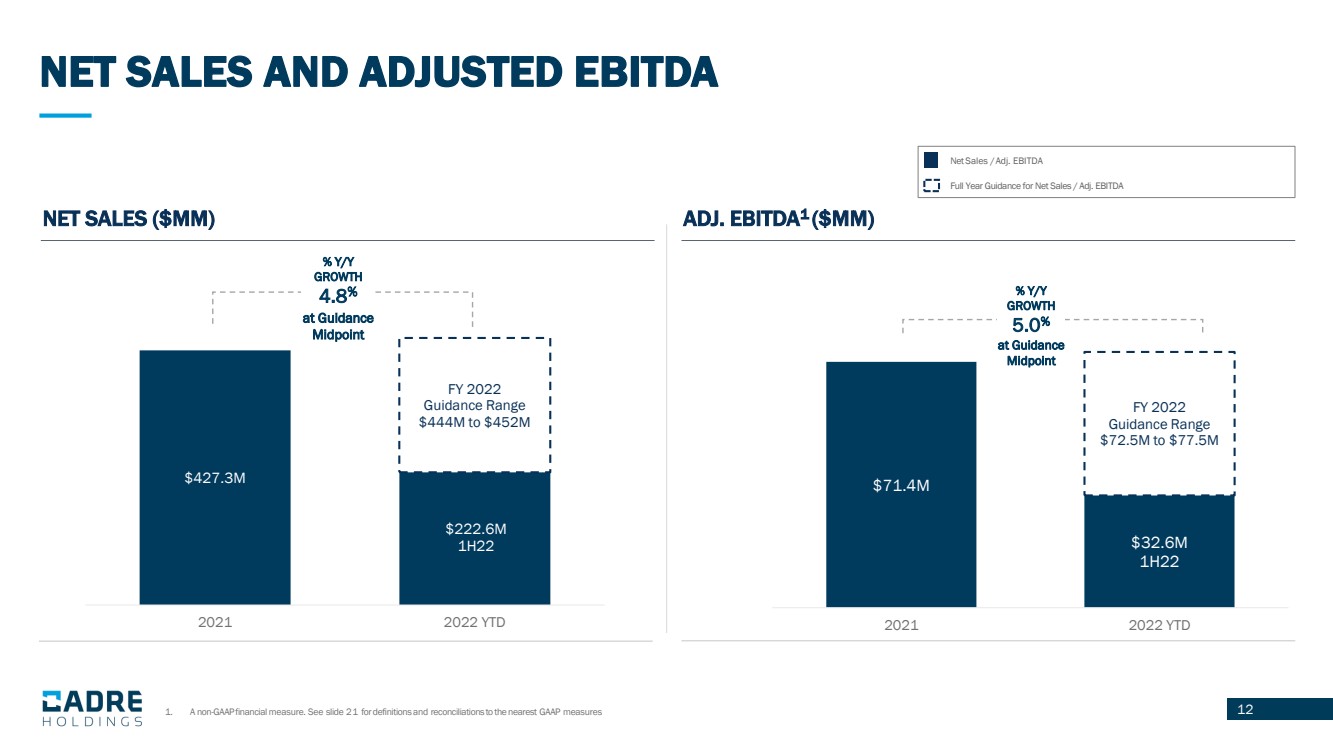
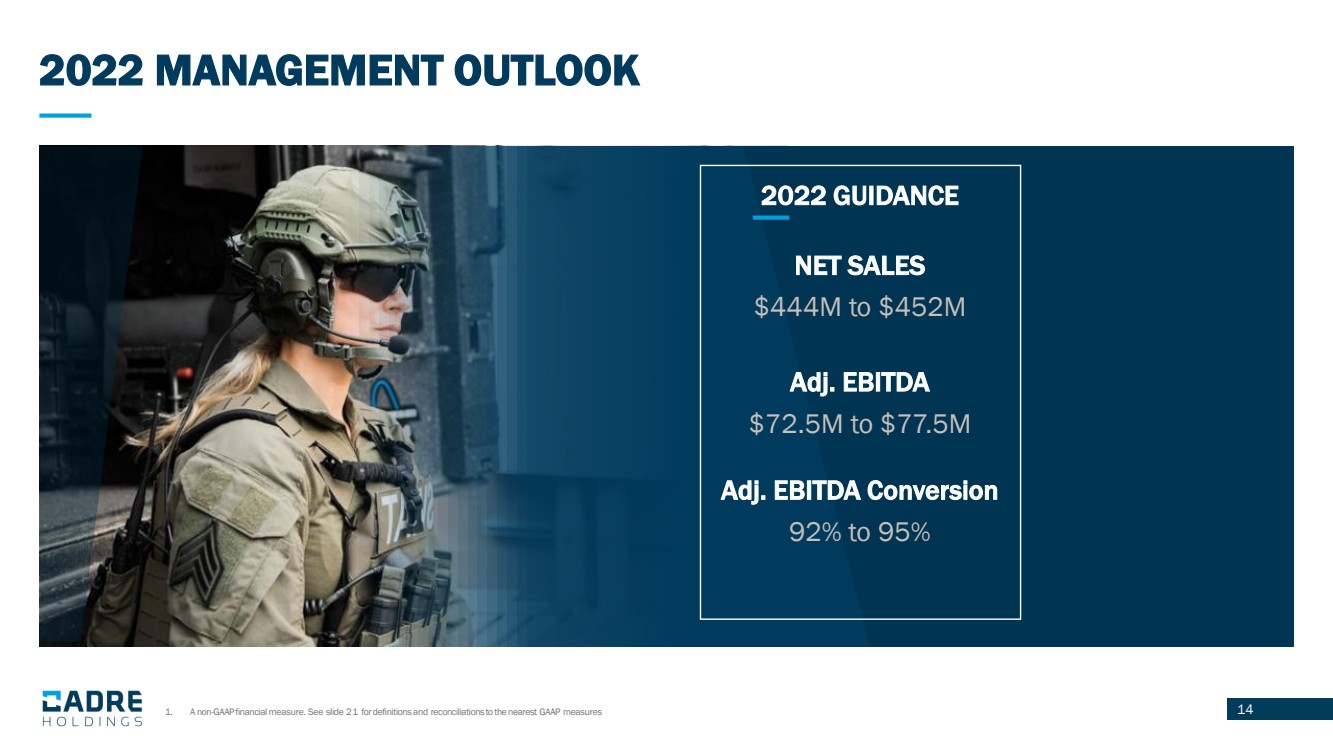
For the full year 2022, Cadre expects to generate net sales in the range of $444.0 million to $452.0 million and Adjusted EBITDA in the range of $72.5 million and $77.5 million. Cadre expects Adjusted EBITDA conversion in the range of 92-95% for the full year.
Conference Call
Cadre management will host a conference call on Thursday, August 11, 2022, at 5:00 PM EST to discuss the latest corporate developments and financial results. The dial-in number for callers in the US is (888)-510-2553 and the dial-in number for international callers is 646-960-0473. The access code for all callers is 1410384. A live webcast will also be available on the Company’s website at https://www.cadre-holdings.com/.
A replay of the call will be available through August 25, 2022. To access the replay, please dial 800-770-2030 in the U.S. or +1-647-362-9199 if outside the U.S., and then enter the access code 1410384.
About Cadre
Headquartered in Jacksonville, Florida, Cadre is a global leader in the manufacturing and distribution of safety and survivability products for first responders. Cadre's equipment provides critical protection to allow users to safely and securely perform their duties and protect those around them in hazardous or life-threatening situations. The Company's core products include body armor, explosive ordnance disposal equipment, and duty gear. Our highly engineered products are utilized in over 100 countries by federal, state and local law enforcement, fire and rescue professionals, explosive ordnance disposal teams, and emergency medical technicians. Our key brands include Safariland® and Med-Eng®, amongst others.
Use of Non-GAAP Measures
The Company reports its financial results in accordance with U.S. generally accepted accounting principles (“GAAP”). The press release contains the non-GAAP measures: (i) earnings before interest, taxes, other income or expense, depreciation and amortization (“EBITDA”), (ii) adjusted EBITDA, (iii) adjusted EBITDA margin, (iv) adjusted EBITDA conversion rate and (v) LTM adjusted EBITDA. The Company believes the presentation of these non-GAAP measures provides useful information for the understanding of its ongoing operations and enables investors to focus on period- over-period operating performance, and thereby enhances the user’s overall understanding of the Company’s current financial performance relative to past performance and provides, along with the nearest GAAP measures, a baseline for modeling future earnings expectations. Non-GAAP measures are reconciled to comparable GAAP financial measures within this press release. The Company cautions that non-GAAP measures should be considered in addition to, but not as a substitute for, the Company’s reported GAAP results. Additionally, the Company notes that there can be no assurance that the above referenced non-GAAP financial measures are comparable to similarly titled financial measures used by other publicly traded companies.
Forward-Looking Statements
Except for historical information, certain matters discussed in this press release may be forward-looking statements within the meaning of the Private Securities Litigation Reform Act of 1995. Forward-looking statements include but are not limited to all projections and anticipated levels of future performance. Forward-looking statements involve risks, uncertainties and other factors that may cause our actual results to differ materially from those discussed herein. Any number of factors could cause actual results to differ materially from projections or forward-looking statements, including without limitation, changes to global, social and political economic conditions, spending patterns of government agencies, competitive pressures, the impact of acquisitions and related integration activities, logistical challenges related to disruptions and delays, product liability claims, the success of new product introductions, currency exchange rate fluctuations and the risks of doing business in the markets in which we operate, including foreign countries. More information on potential factors that could affect the Company’s financial results are more fully described from time to time in the Company’s public reports filed with the Securities and Exchange Commission, including the Company’s Annual Report on Form 10-K, Quarterly Reports on Form 10-Q, and Current Reports on Form 8-K. All forward-looking statements included in this press release are based upon information available to the Company as of the date of this press release, and speak only as of the date hereof. We assume no obligation to update any forward-looking statements to reflect events or circumstances after the date of this press release.
Contact:
Gray Hudkins
Cadre Holdings, Inc.
203-550-7148
Investor Relations:
The IGB Group
Leon Berman / Matt Berkowitz
212-477-8438 / 212-227-7098
[email protected] / [email protected]
Media Contact:
Jonathan Keehner / Andrew Siegel
Joele Frank, Wilkinson Brimmer Katcher
212-355-4449
CADRE HOLDINGS, INC.
CONSOLIDATED BALANCE SHEETS
(Unaudited)
(In thousands, except share and per share amounts)
| | June 30, 2022 |
| December 31, 2021 | ||
Assets |
| |
|
| |
|
Current assets |
| |
|
| |
|
Cash and cash equivalents | | $ | 28,862 | | $ | 33,857 |
Accounts receivable, net of allowance for doubtful accounts of $817 and $645, respectively | |
| 56,521 | |
| 48,344 |
Inventories | |
| 76,630 | |
| 63,978 |
Prepaid expenses | |
| 6,932 | |
| 10,353 |
Other current assets | |
| 5,956 | |
| 3,171 |
Assets held for sale | |
| 251 | |
| 278 |
Total current assets | |
| 175,152 | |
| 159,981 |
Property and equipment, net of accumulated depreciation and amortization of $40,111 and $37,171, respectively | |
| 46,997 | |
| 33,053 |
Deferred tax assets, net | |
| 8,133 | |
| 7,059 |
Intangible assets, net | |
| 55,177 | |
| 42,415 |
Goodwill | |
| 78,027 | |
| 66,262 |
Other assets | |
| 5,990 | |
| 3,026 |
Total assets | | $ | 369,476 | | $ | 311,796 |
| | | | | | |
Liabilities, Mezzanine Equity and Shareholders' Equity | |
|
| |
|
|
Current liabilities | |
|
| |
|
|
Accounts payable | | $ | 29,145 | | $ | 19,328 |
Accrued liabilities | |
| 35,896 | |
| 40,736 |
Income tax payable | |
| 918 | |
| 1,255 |
Liabilities held for sale | | | 106 | | | 128 |
Current portion of long-term debt | |
| 10,321 | |
| 13,174 |
Total current liabilities | |
| 76,386 | |
| 74,621 |
Long-term debt | |
| 142,244 | |
| 146,516 |
Deferred tax liabilities | |
| 3,589 | |
| 1,297 |
Other liabilities | |
| 959 | |
| 722 |
Total liabilities | |
| 223,178 | |
| 223,156 |
| | | | | | |
Mezzanine equity | |
| | |
|
|
Preferred stock ($0.0001 par value, 10,000,000 shares authorized, no shares issued and outstanding as of June 30, 2022 and December 31, 2021) | |
| — | |
| — |
| | | | | | |
Shareholders' equity | |
| | |
|
|
Common stock ($0.0001 par value, 190,000,000 shares authorized, 37,032,271 and 34,383,350 shares issued and outstanding as of June 30, 2022 and December 31, 2021, respectively) | |
| 4 | |
| 3 |
Additional paid-in capital | |
| 194,704 | |
| 127,606 |
Accumulated other comprehensive loss | |
| (105) | |
| (1,917) |
Accumulated deficit | |
| (48,305) | |
| (37,052) |
Total shareholders’ equity | |
| 146,298 | |
| 88,640 |
Total liabilities, mezzanine equity and shareholders' equity | | $ | 369,476 | | $ | 311,796 |
CADRE HOLDINGS, INC.
CONSOLIDATED STATEMENTS OF OPERATIONS
(Unaudited)
(In thousands, except share and per share amounts)
| | Three Months Ended June 30, | | Six Months Ended June 30, | ||||||||
|
| 2022 |
| 2021 |
| 2022 |
| 2021 | ||||
Net sales | | $ | 118,232 | | $ | 114,561 | | $ | 222,638 | | $ | 225,097 |
Cost of goods sold | |
| 75,011 | |
| 66,333 | |
| 139,228 | |
| 132,910 |
Gross profit | |
| 43,221 | |
| 48,228 | |
| 83,410 | |
| 92,187 |
Operating expenses | |
|
| |
|
| |
|
| |
|
|
Selling, general and administrative | |
| 32,749 | |
| 31,444 | |
| 86,699 | |
| 59,495 |
Restructuring and transaction costs | |
| 1,203 | |
| 1,219 | |
| 1,802 | |
| 1,540 |
Related party expense | |
| 1,112 | |
| 142 | |
| 1,234 | |
| 295 |
Total operating expenses | |
| 35,064 | |
| 32,805 | |
| 89,735 | |
| 61,330 |
Operating income (loss) | |
| 8,157 | |
| 15,423 | |
| (6,325) | |
| 30,857 |
Other expense | |
|
| |
|
| |
|
| |
|
|
Interest expense | |
| (1,439) | |
| (5,621) | |
| (2,929) | |
| (10,665) |
Other expense, net | |
| (756) | |
| (485) | |
| (961) | |
| (529) |
Total other expense, net | |
| (2,195) | |
| (6,106) | |
| (3,890) | |
| (11,194) |
Income (loss) before provision for income taxes | |
| 5,962 | |
| 9,317 | |
| (10,215) | |
| 19,663 |
(Provision) benefit for income taxes | |
| (1,517) | |
| (2,502) | |
| 4,495 | |
| (5,984) |
Net income (loss) | | $ | 4,445 | | $ | 6,815 | | $ | (5,720) | | $ | 13,679 |
| | | | | | | | | | | | |
Net income (loss) per share: | |
|
| |
|
| |
|
| |
|
|
Basic | | $ | 0.13 | | $ | 0.25 | | $ | (0.16) | | $ | 0.50 |
Diluted | | $ | 0.12 | | $ | 0.25 | | $ | (0.16) | | $ | 0.50 |
Weighted average shares outstanding: | |
|
| |
|
| |
|
| |
|
|
Basic | |
| 35,320,314 | |
| 27,483,350 | |
| 34,888,703 | |
| 27,483,350 |
Diluted | |
| 35,688,620 | |
| 27,483,350 | |
| 34,888,703 | |
| 27,483,350 |
CADRE HOLDINGS, INC.
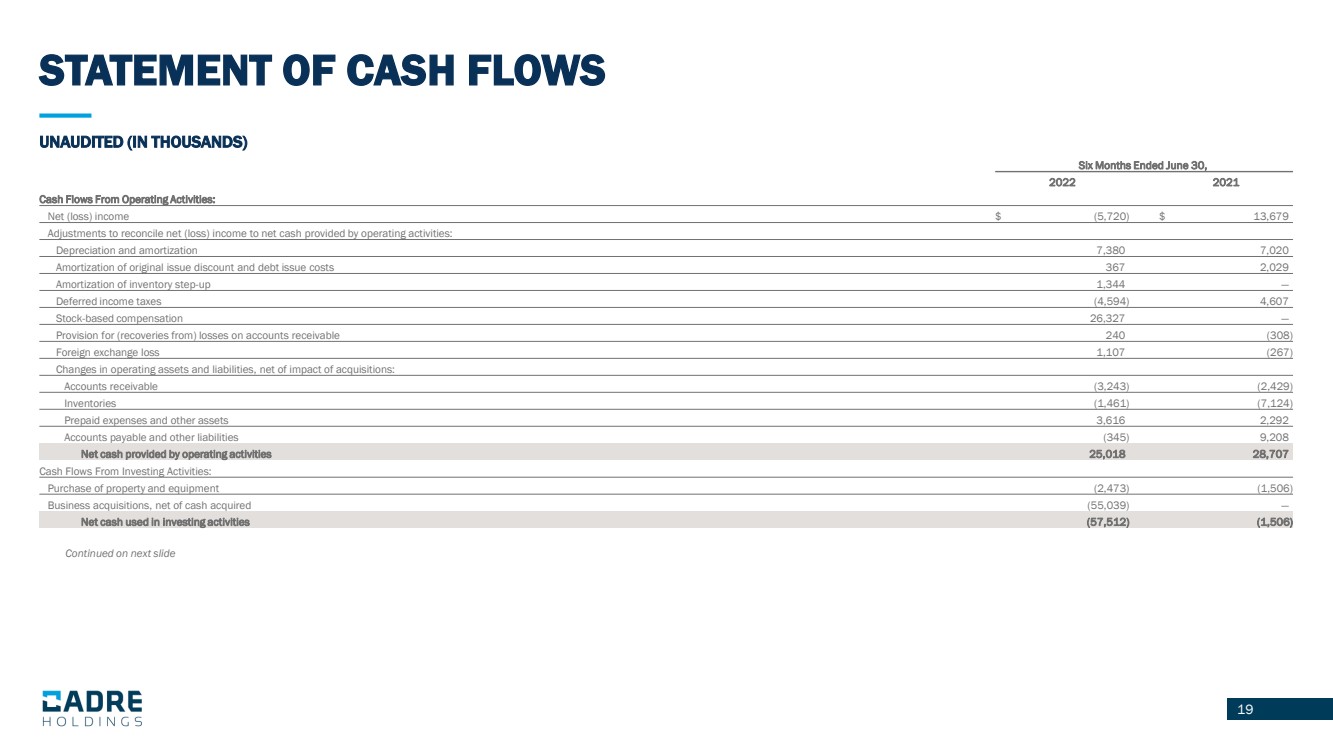
CONSOLIDATED STATEMENTS OF CASH FLOWS
(Unaudited)
(In thousands)
| | Six Months Ended June 30, | ||||
|
| 2022 |
| 2021 | ||
Cash Flows From Operating Activities: |
| |
|
| |
|
Net (loss) income | | $ | (5,720) | | $ | 13,679 |
Adjustments to reconcile net (loss) income to net cash provided by operating activities: | |
|
| |
|
|
Depreciation and amortization | |
| 7,380 | |
| 7,020 |
Amortization of original issue discount and debt issue costs | |
| 367 | |
| 2,029 |
Amortization of inventory step-up | | | 1,344 | | | — |
Deferred income taxes | |
| (4,594) | |
| 4,607 |
Stock-based compensation | | | 26,327 | | | — |
Provision for (recoveries from) losses on accounts receivable | |
| 240 | |
| (308) |
Foreign exchange loss | |
| 1,107 | |
| (267) |
Changes in operating assets and liabilities, net of impact of acquisitions: | |
| | |
|
|
Accounts receivable | |
| (3,243) | |
| (2,429) |
Inventories | |
| (1,461) | |
| (7,124) |
Prepaid expenses and other assets | |
| 3,616 | |
| 2,292 |
Accounts payable and other liabilities | |
| (345) | |
| 9,208 |
Net cash provided by operating activities | |
| 25,018 | |
| 28,707 |
Cash Flows From Investing Activities: | |
|
| |
|
|
Purchase of property and equipment | |
| (2,473) | |
| (1,506) |
Business acquisitions, net of cash acquired | |
| (55,039) | |
| — |
Net cash used in investing activities | |
| (57,512) | |
| (1,506) |
Cash Flows From Financing Activities: | |
|
| |
|
|
Proceeds from revolving credit facilities | |
| 48,000 | |
| 176,548 |
Principal payments on revolving credit facilities | |
| (48,000) | |
| (176,548) |
Principal payments on term loans | |
| (5,009) | |
| (13,687) |
Principal payments on insurance premium financing | |
| (2,853) | |
| (1,225) |
Payment of capital leases | |
| (22) | |
| (21) |
Taxes paid in connection with employee stock transactions | | | (6,216) | | | — |
Proceeds from secondary offering, net of underwriter discounts | | | 49,703 | | | — |
Deferred offering costs | | | (2,715) | | | — |
Dividends distributed | |
| (5,533) | |
| — |
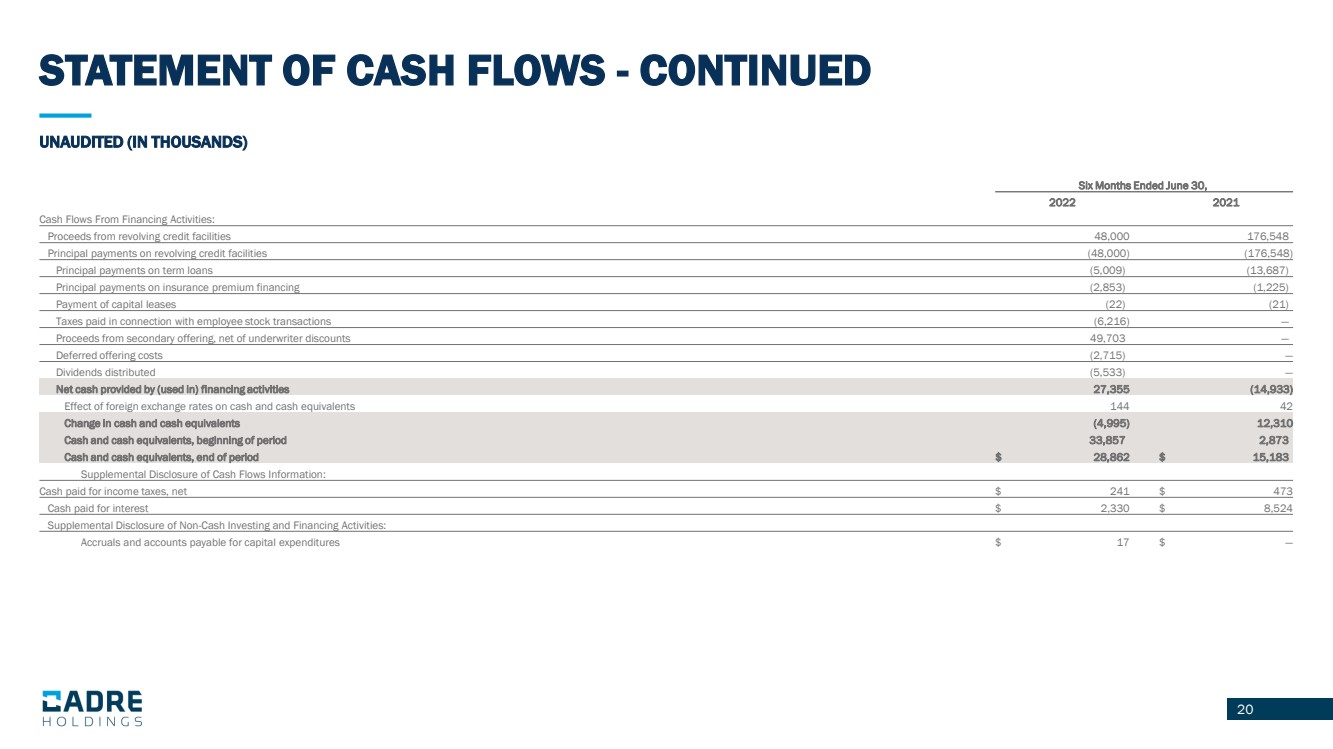
Net cash provided by (used in) financing activities | |
| 27,355 | |
| (14,933) |
Effect of foreign exchange rates on cash and cash equivalents | |
| 144 | |
| 42 |
Change in cash and cash equivalents | |
| (4,995) | |
| 12,310 |
Cash and cash equivalents, beginning of period | |
| 33,857 | |
| 2,873 |
Cash and cash equivalents, end of period | | $ | 28,862 | | $ | 15,183 |
Supplemental Disclosure of Cash Flows Information: | | | | | | |
Cash paid for income taxes, net | | $ | 241 | | $ | 473 |
Cash paid for interest | | $ | 2,330 | | $ | 8,524 |
Supplemental Disclosure of Non-Cash Investing and Financing Activities: | | | | | | |
Accruals and accounts payable for capital expenditures | | $ | 17 | | $ | — |
CADRE HOLDINGS, INC.
SEGMENT INFORMATION
(Unaudited)
(In thousands)
|
| Six months ended June 30, 2022 | ||||||||||
| | | | | | | | Reconciling | | | | |
|
| Products |
| Distribution |
| Items(1) |
| Total | ||||
Net sales |
| $ | 185,223 |
| $ | 47,824 |
| $ | (10,409) |
| $ | 222,638 |
Cost of goods sold | | | 112,067 | | | 37,578 | | | (10,417) | | | 139,228 |
Gross profit | | $ | 73,156 | | $ | 10,246 | | $ | 8 | | $ | 83,410 |
|
| Six months ended June 30, 2021 | ||||||||||
| | | | | | | | Reconciling | | | | |
|
| Products |
| Distribution |
| Items(1) |
| Total | ||||
Net sales |
| $ | 190,121 |
| $ | 47,579 |
| $ | (12,603) |
| $ | 225,097 |
Cost of goods sold | | | 110,028 | | | 35,476 | | | (12,594) | | | 132,910 |
Gross profit | | $ | 80,093 | | $ | 12,103 | | $ | (9) | | $ | 92,187 |
| (1) | Reconciling items consist primarily of intercompany eliminations and items not directly attributable to operating segments. |
CADRE HOLDINGS, INC.
RECONCILIATION OF GAAP TO NON-GAAP FINANCIAL MEASURES
(Unaudited)
(In thousands)
| | Year ended | | Three Months | | Three Months Ended | | Six Months Ended | | Last Twelve | | |||||||||||
| | December 31, | | Ended March 31, | | June 30, | | June 30, | | Months | | |||||||||||
| | 2021 | | 2022 | | 2022 | | 2021 | | 2022 | | 2021 | | June 30, 2022 | | |||||||
Net income (loss) | | $ | 12,661 | | $ | (10,165) | | $ | 4,445 | | $ | 6,815 | | $ | (5,720) | | $ | 13,679 | | $ | (6,738) | |
Add back: | |
|
| |
|
| |
|
| |
|
| |
|
| |
|
| |
|
| |
Depreciation and amortization | |
| 13,718 | |
| 3,544 | |
| 3,836 | |
| 3,481 | |
| 7,380 | |
| 7,020 | |
| 14,078 | |
Interest expense | |
| 16,425 | |
| 1,490 | |
| 1,439 | |
| 5,621 | |
| 2,929 | |
| 10,665 | |
| 8,689 | |
Provision (benefit) for income taxes | |
| 6,531 | |
| (6,012) | |
| 1,517 | |
| 2,502 | |
| (4,495) | |
| 5,984 | |
| (3,948) | |
EBITDA | | $ | 49,335 | | $ | (11,143) | | $ | 11,237 | | $ | 18,419 | | $ | 94 | | $ | 37,348 | | $ | 12,081 | |
Add back: | |
|
| |
|
| |
|
| |
|
| |
|
| |
|
| |
|
| |
Restructuring and transaction costs(1) | |
| 3,430 | |
| 599 | |
| 2,203 | |
| 1,219 | |
| 2,802 | |
| 1,540 | |
| 4,692 | |
Loss on extinguishment of debt(2) | |
| 15,155 | |
| — | |
| — | |
| — | |
| — | |
| — | |
| 15,155 | |
Other expense, net(3) | |
| 947 | |
| 205 | |
| 756 | |
| 485 | |
| 961 | |
| 529 | |
| 1,379 | |
Stock-based compensation expense(4) | | | 355 | | | 23,723 | | | 2,818 | | | — | | | 26,541 | | | — | | | 26,896 | |
Stock-based compensation payroll tax expense(5) | | | — | | | 298 | | | 7 | | | — | | | 305 | | | — | | | 305 | |
LTIP bonus(6) | |
| 2,162 | |
| 384 | |
| 174 | |
| 328 | |
| 558 | |
| 1,280 | |
| 1,440 | |
Amortization of inventory step-up(7) | | | — | | | 153 | | | 1,191 | | | — | | | 1,344 | | | — | | | 1,344 | |
Adjusted EBITDA | | $ | 71,384 | | $ | 14,219 | | $ | 18,386 | | $ | 20,451 | | $ | 32,605 | | $ | 40,697 | | $ | 63,292 | |
Less: Capital expenditures | |
| (3,029) | |
| (1,069) | |
| (1,421) | |
| (718) | |
| (2,490) | |
| (1,506) | |
| (4,013) | |
Adjusted EBITDA less capital expenditures | | $ | 68,355 | | $ | 13,150 | | $ | 16,965 | | $ | 19,733 | | $ | 30,115 | | $ | 39,191 | | $ | 59,279 | |
Adjusted EBITDA conversion rate(8) | |
| 96 | % |
| 92 | % |
| 92 | % |
| 96 | % |
| 92 | % |
| 96 | % |
| 94 | % |
Adjusted EBITDA margin(9) | |
| 16.7 | % |
| 13.6 | % |
| 15.6 | % |
| 17.9 | % |
| 14.6 | % |
| 18.1 | % |
| | |
| (1) | Reflects the “Restructuring and transaction costs” line item on our consolidated statement of operations, which primarily includes transaction costs composed of legal and consulting fees, and $1.0 million paid to Kanders & Company, Inc., a company controlled by our Chief Executive Officer, for services related to the acquisition of Cyalume, which is included in related party expense in the Company’s consolidated statements of operations and comprehensive income (loss). |
| (2) | Reflects losses incurred in connection with the August 2021 debt refinance. |
| (3) | Reflects the “Other expense, net” line item on our consolidated statement of operations. For the three and six months ended June 30, 2022 and 2021, other expense, net primarily includes losses on foreign currency transactions. |
| (4) | Reflects compensation expense related to equity and liability classified stock-based compensation plans. |
| (5) | Reflects payroll taxes associated with vested stock-based compensation awards. |
| (6) | Reflects the cost of a cash-based long-term incentive plan awarded to employees that vests over three years. |
| (7) | Reflects amortization expense related to the step-up inventory adjustment recorded as part of the recent acquisitions. |
| (8) | Reflects (Adjusted EBITDA less capital expenditures) / Adjusted EBITDA. |
| (9) | Reflects Adjusted EBITDA / Net Sales for the relevant periods. |
| SECOND QUARTER 2022 |

| 2 FORWARD - LOOKING STATEMENTS Except for historical information, certain matters discussed in this presentation may be forward - looking statements within the meaning of the Private Securities Litigation Reform Act of 1995. Forward - looking statements include but are not limited to all projections and anticipated levels of future performance. Forward - looking statements involve risks, uncertainties and other factors that may cause our actual results to differ materially from those discussed herein. Any number of factors could cause actual results to differ materially from projections or forward - looking statements, including without limitation, changes to global economic, social and political conditions, spending patterns of government agencies, competitive pressures, the impact of acquisitions and related integration activities, logistical challenges related to disruptions and delays, product liability claims, the success of new product introductions, currency exchange rate fluctuations and the risks of doin g business in the markets in which we operate, including foreign countries. More information on potential factors that could affect the Company’s financial results are more fully described from time to time in the Company’s public reports filed with the Securities and Exchange Commission, including the Company’s Annual Report on Form 10 - K, Quarterly Reports on Form 10 - Q, and Current Reports on Form 8 - K. All forward - looking statements included in this presentation are based upon information available to the Company as of the date of this presentation, and speak only as of the date hereof. We assume no obligation to update any forward - looking statements to reflect events or circumstances after the date of this presentation .. 2 |
| TODAY’S PRESENTERS 3 BRAD WILLIAMS President BLAINE BROWERS Chief Financial Officer WARREN KANDERS Chief Executive Officer and Chairman of the Board |

| 4 AGENDA • Q2 Review • Business Overview • Financial Summary • Full Year Outlook • Conclusion and Q&A |
| 5 CONTINUED EXECUTION IN Q2 5 Cadre continues to deliver on strategic objectives in a challenging supply chain and inflationary environment Pricing Growth: ✓ Exceeded 1% target above material inflation Adjusted EBITDA Conversion: 1 ✓ Generated Adj. EBITDA conversion of 92% in Q2, at the high end of guidance range Q2 Mix: x Duty gear and crowd control volume down, prior year large structural armor order Orders Backlog: ✓ Increased by $12.5 million in 2022; driven by acquisitions, higher demand for soft armor and U.S. Duty Gear M&A Execution: ✓ Completed acquisition of Cyalume Technologies Returned Capital to Shareholders: ✓ Paid fourth consecutive quarterly dividend of $0.08 Healthy M&A Funnel: ✓ Continue to actively evaluate robust pipeline of opportunities Commentary: 1. Adj. EBITDA conversion (%) defined as (Adj. EBITDA – capital expenditure) / Adj. EBITDA. Adjusted EBITDA is a non - GAAP financial measure. See slide 21 for definitions and reconciliations to the nearest GAAP measures |
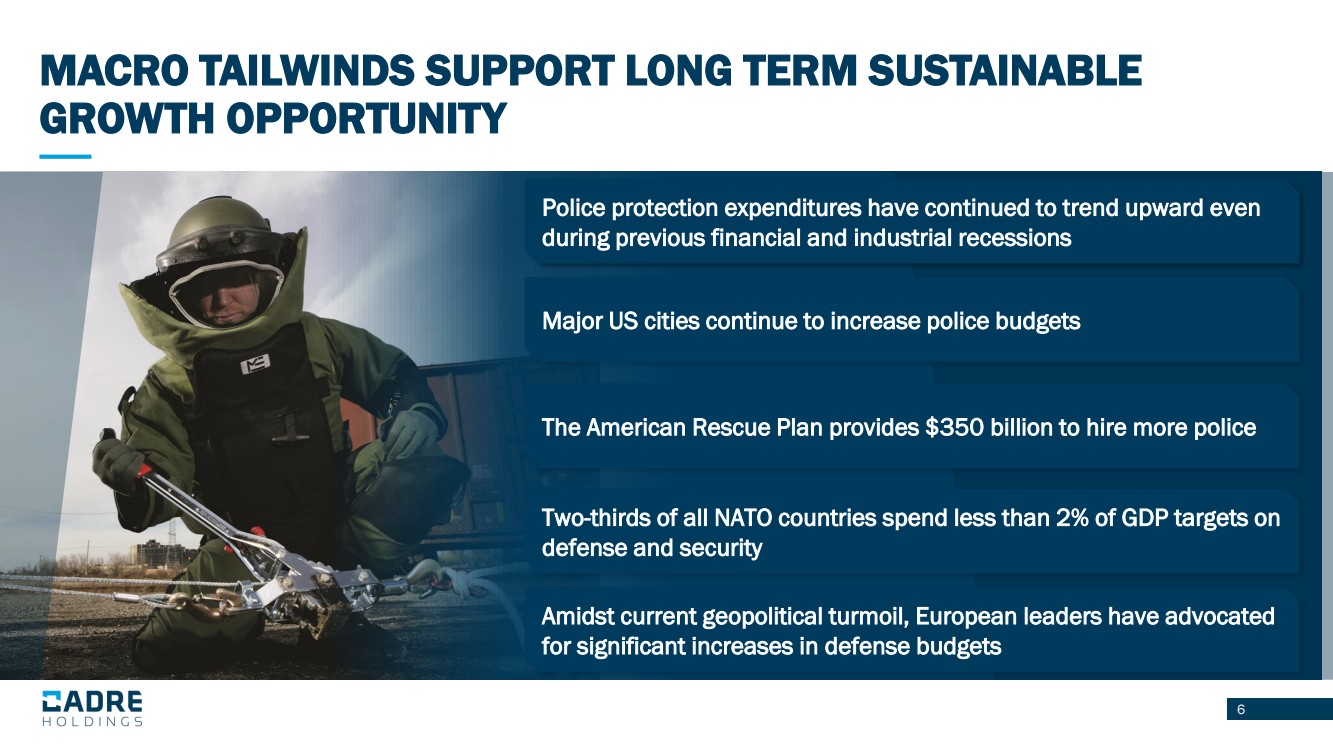
| 6 MACRO TAILWINDS SUPPORT LONG TERM SUSTAINABLE GROWTH OPPORTUNITY Two - thirds of all NATO countries spend less than 2% of GDP targets on defense and security Amidst current geopolitical turmoil, European leaders have advocated for significant increases in defense budgets Police protection expenditures have continued to trend upward even during previous financial and industrial recessions Major US cities continue to increase police budgets The American Rescue Plan provides $350 billion to hire more police |
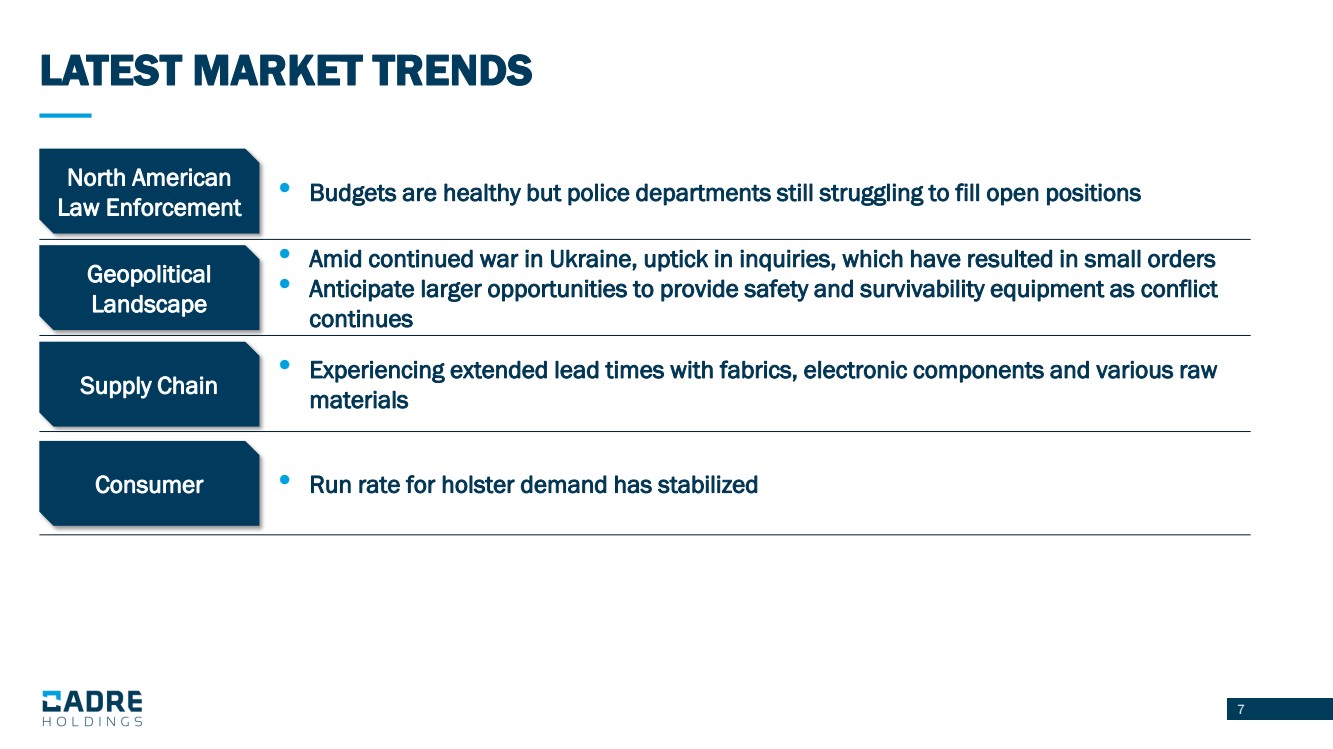
| 7 7 • Budgets are healthy but police departments still struggling to fill open positions • Amid continued war in Ukraine, uptick in inquiries, which have resulted in small orders • Anticipate larger opportunities to provide safety and survivability equipment as conflict continues • Experiencing extended lead times with fabrics, electronic components and various raw materials • Run rate for holster demand has stabilized North American Law Enforcement Geopolitical Landscape Supply Chain Consumer LATEST MARKET TRENDS |
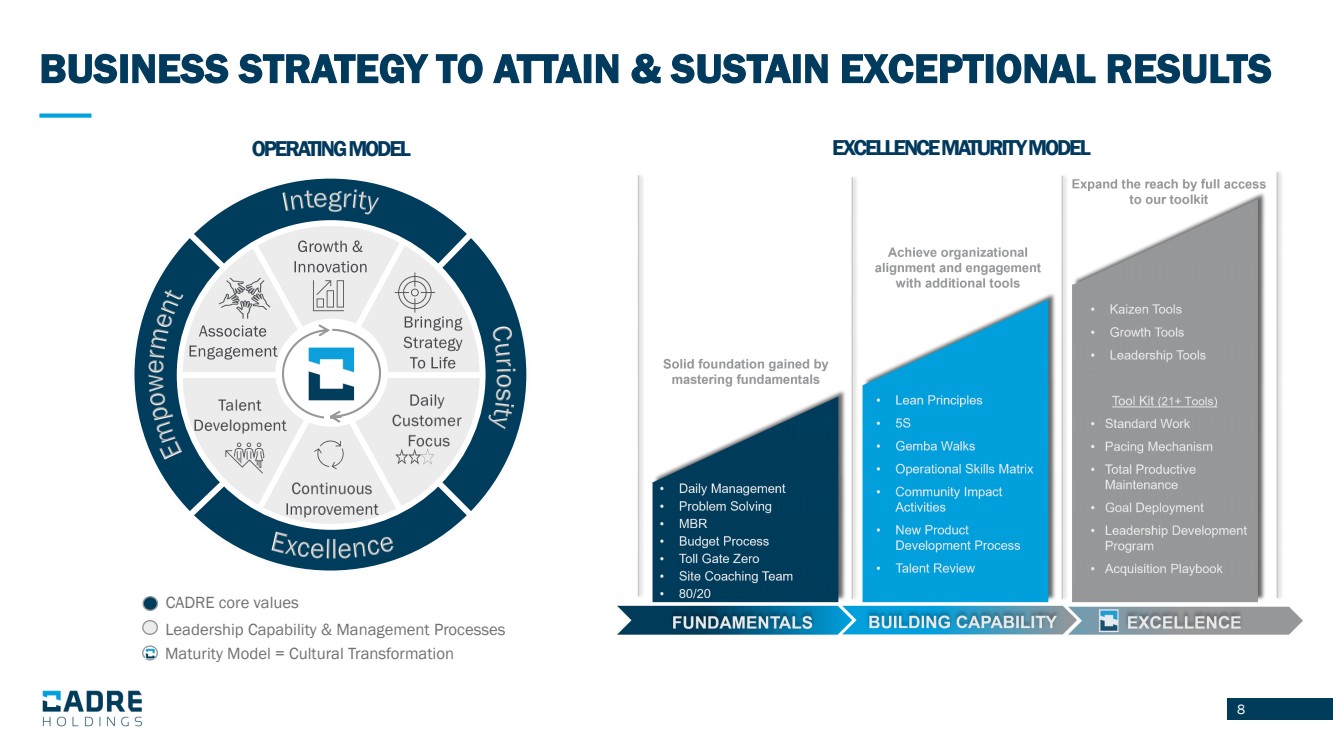
| 8 BUSINESS STRATEGY TO ATTAIN & SUSTAIN EXCEPTIONAL RESULTS OPERATING MODEL EXCELLENCE MATURITY MODEL CADRE core values Leadership Capability & Management Processes Maturity Model = Cultural Transformation |
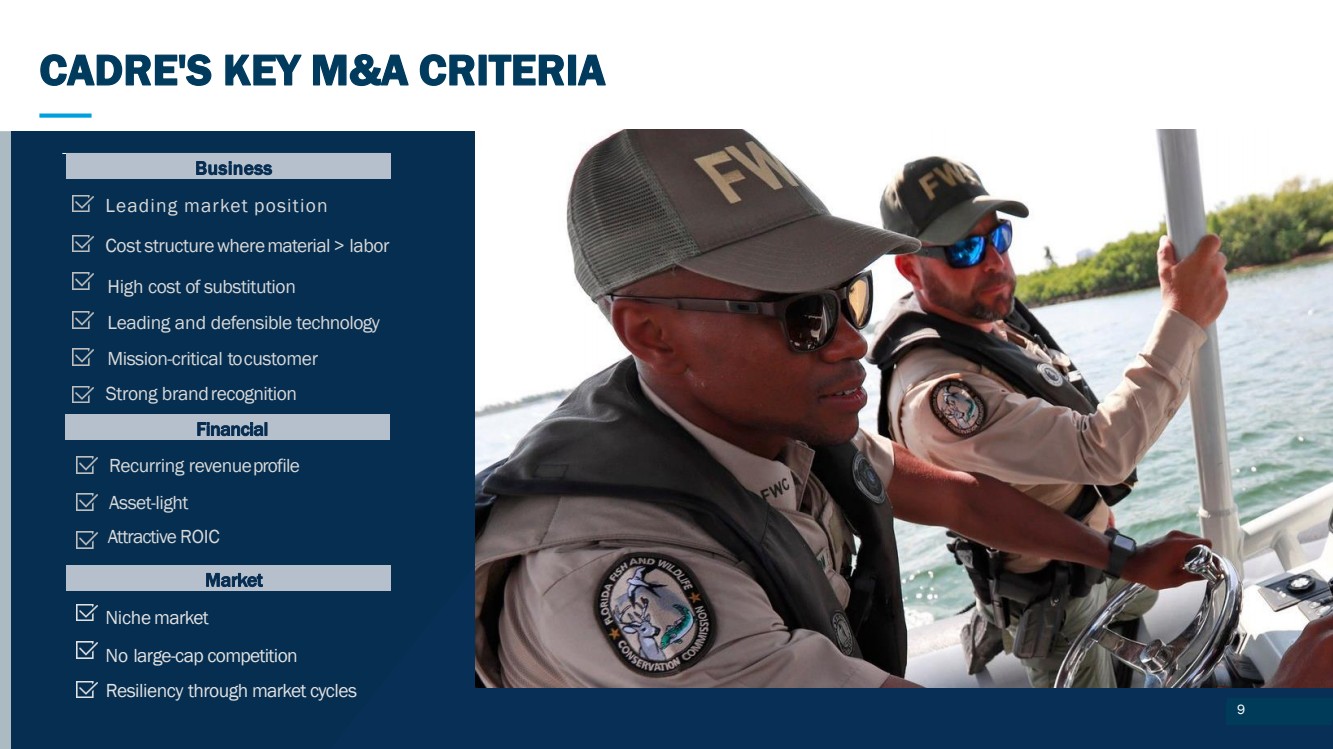
| 9 20 20 13 CADRE'S KEY M&A CRITERIA Niche market No large - cap competition Leading market position Cost structure where material > labor Leading a nd d efensible technology High cost of substitution Mission - critical to customer Recurring revenue profile Asset - light Business Financial Market Strong brand recognition Attractive ROIC Resiliency through market c ycles CADRE'S KEY M&A CRITERIA 9 |
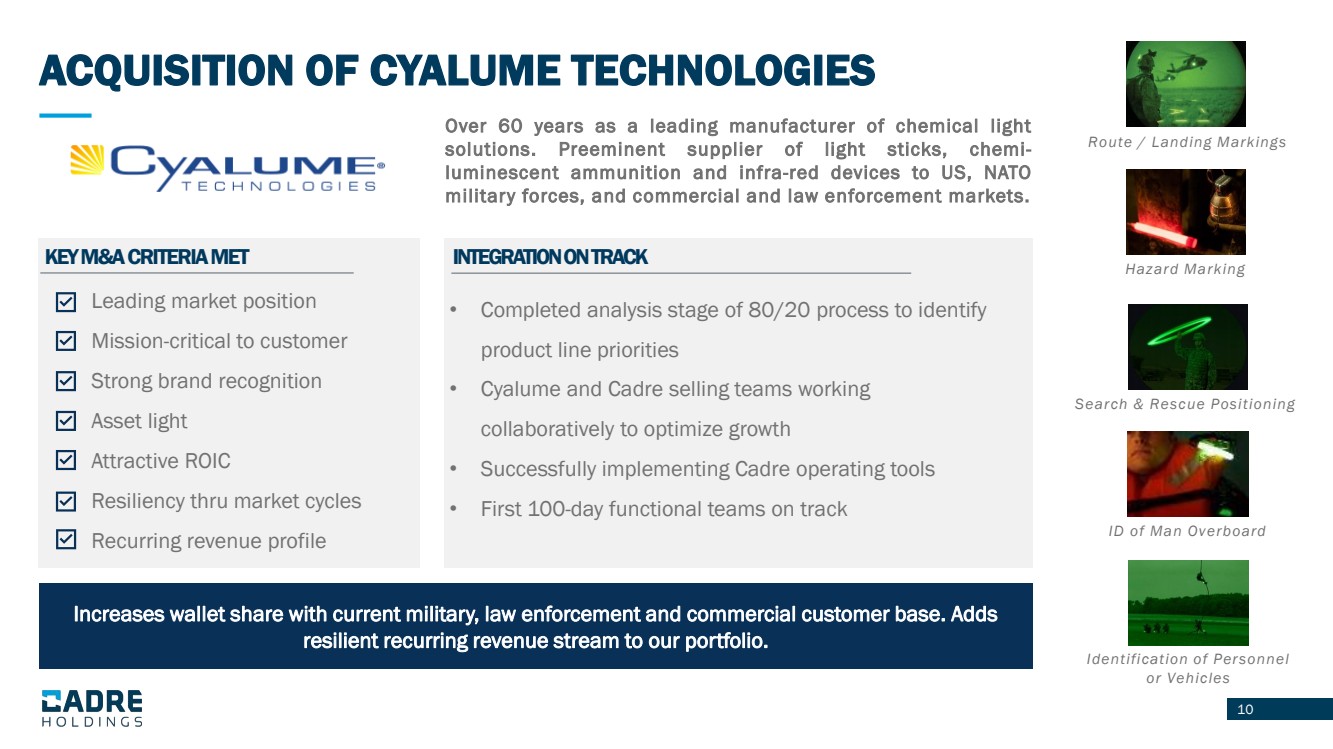
| 10 Over 60 years as a leading manufacturer of chemical light solutions .. Preeminent supplier of light sticks, chemi - luminescent ammunition and infra - red devices to US, NATO military forces, and commercial and law enforcement markets .. KEY M&A CRITERIA MET Leading market position Mission - critical to customer Strong brand recognition Asset light Attractive ROIC Resiliency thru market cycles Recurring revenue profile INTEGRATION ON TRACK • Completed analysis stage of 80/20 process to identify product line priorities • Cyalume and Cadre selling teams working collaboratively to optimize growth • Successfully implementing Cadre operating tools • First 100 - day functional teams on track Increases wallet share with current military, law enforcement and commercial customer base. Adds resilient recurring revenue stream to our portfolio. Route / Landing Markings Hazard Marking Search & Rescue Positioning ID of Man Overboard Identification of Personnel or Vehicles ACQUISITION OF CYALUME TECHNOLOGIES |
| SECOND QUARTER 2022 FINANCIAL PERFORMANCE Q2 2022 Q1 2022 Q2 2021 NET SALES $118.2M $104.4M $114.6M GROSS MARGIN 36.6% 38.5% 42.1% NET INCOME (LOSS) $4.4M / $0.12 per diluted share ($10.2M) / ($0.30) per diluted share $6.8M / $0.25 per diluted share ADJUSTED EBITDA 1 $18.4M $14.2M $20.5M ADJUSTED EBITDA MARGIN 1 15.6% 13.6% 17.9% 1. Non - GAAP financial measures. See slide 21 for definitions and reconciliations to the nearest GAAP measures • Achieved pricing growth that exceeded target, generated strong adjusted EBITDA conversion, and increased backlog • Increased net sales, net income, adjusted EBITDA, and adjusted EBITDA margin from Q1 to Q2 11 |
| 12 Net Sales / Adj. EBITDA Full Year Guidance for Net Sales / Adj. EBITDA NET SALES AND ADJUSTED EBITDA NET SALES ($MM) $427.3M $222.6M 1H22 FY 2022 Guidance Range $444M to $452M 2021 2022 YTD % Y/Y GROWTH 4.8 % at Guidance Midpoint ADJ. EBITDA 1 ($MM) $71.4M $32.6M 1H22 FY 2022 Guidance Range $72.5M to $77.5M 2021 2022 YTD % Y/Y GROWTH 5.0 % at Guidance Midpoint 1. A non - GAAP financial measure. See slide 21 for definitions and reconciliations to the nearest GAAP measures |
| 13 Q2 2022 CAPITAL STRUCTURE 1. Non - GAAP financial measures. See slide 21 definitions and reconciliations to the nearest GAAP measures June 30, 2022 (in thousands) Cash and cash equivalents $ 28,862 Debt: Revolver $ — Current portion of long - term debt 10,321 Long - term debt 144,070 Capitalized discount/issuance costs (1,826) Total debt, net $ 152,565 Net debt (Total debt net of cash) $ 123,703 Total debt / LTM Adj. EBITDA (1) 2.4 Net debt / LTM Adj. EBITDA (1) 2.2 LTM Adj. EBITDA (1) $ 63,292 |
| 14 2022 MANAGEMENT OUTLOOK 2022 GUIDANCE NET SALES $444M to $452M Adj. EBITDA $72.5M to $77.5M Adj. EBITDA Conversion 92% to 95% 1. A non - GAAP financial measure. See slide 21 for definitions and reconciliations to the nearest GAAP measures |
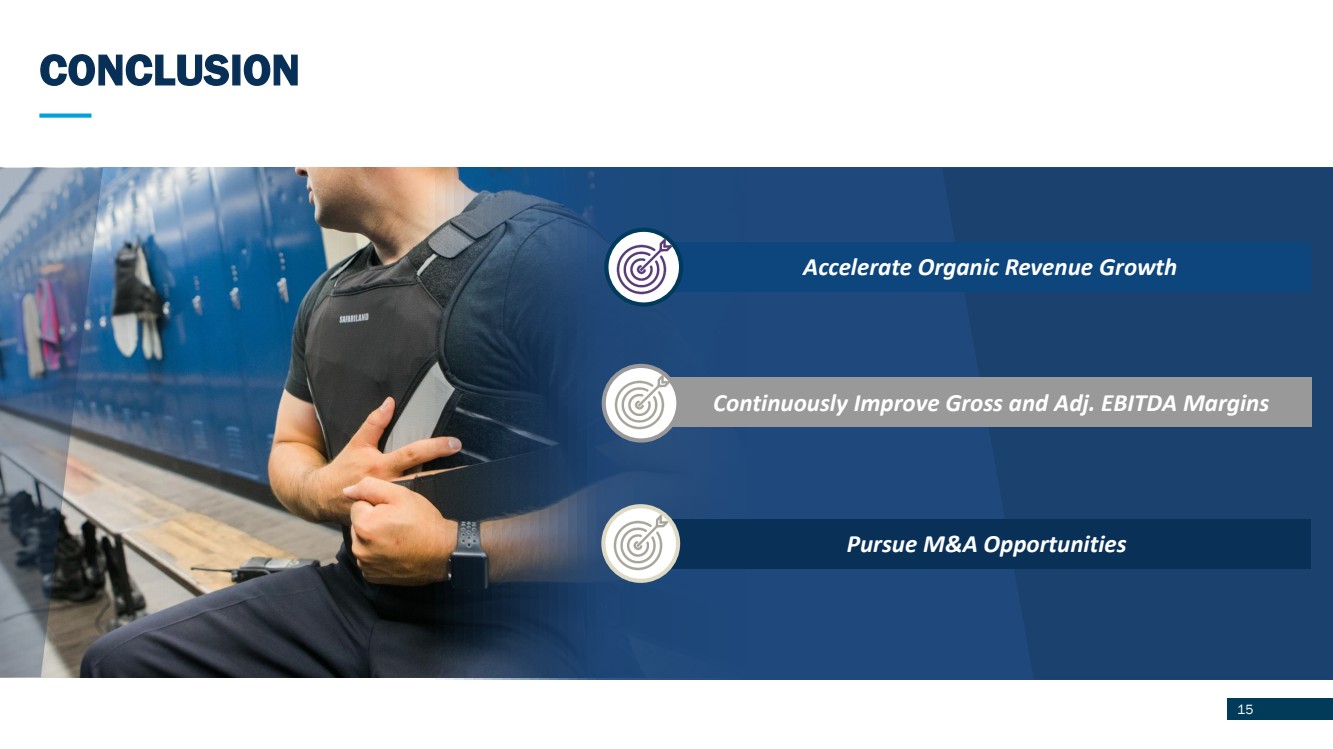
| CONCLUSION 15 Accelerate Organic Revenue Growth Pursue M&A Opportunities Continuously Improve Gross and Adj. EBITDA Margins |
| 16 APPENDIX |
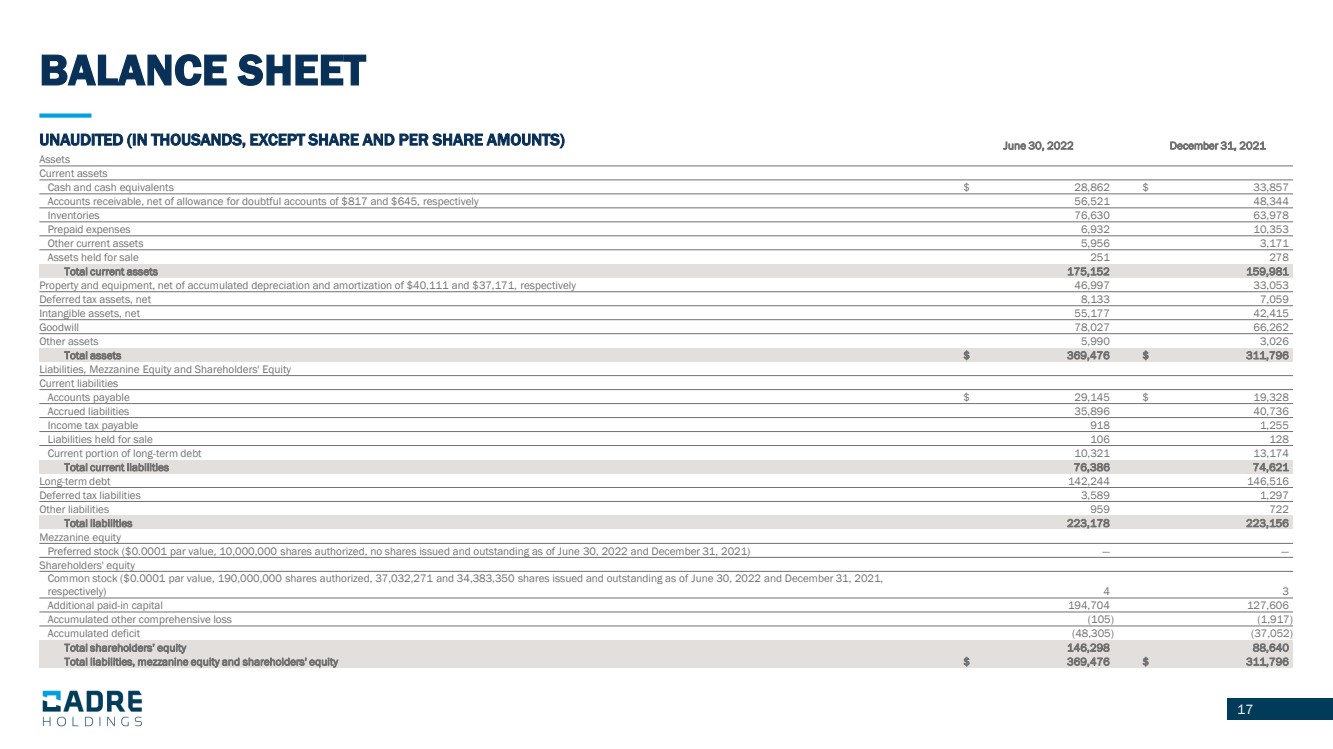
| 17 BALANCE SHEET 17 UNAUDITED (IN THOUSANDS, EXCEPT SHARE AND PER SHARE AMOUNTS) June 30, 2022 December 31, 2021 Assets Current assets Cash and cash equivalents $ 28,862 $ 33,857 Accounts receivable, net of allowance for doubtful accounts of $817 and $645, respectively 56,521 48,344 Inventories 76,630 63,978 Prepaid expenses 6,932 10,353 Other current assets 5,956 3,171 Assets held for sale 251 278 Total current assets 175,152 159,981 Property and equipment, net of accumulated depreciation and amortization of $40,111 and $37,171, respectively 46,997 33,053 Deferred tax assets, net 8,133 7,059 Intangible assets, net 55,177 42,415 Goodwill 78,027 66,262 Other assets 5,990 3,026 Total assets $ 369,476 $ 311,796 Liabilities, Mezzanine Equity and Shareholders' Equity Current liabilities Accounts payable $ 29,145 $ 19,328 Accrued liabilities 35,896 40,736 Income tax payable 918 1,255 Liabilities held for sale 106 128 Current portion of long - term debt 10,321 13,174 Total current liabilities 76,386 74,621 Long - term debt 142,244 146,516 Deferred tax liabilities 3,589 1,297 Other liabilities 959 722 Total liabilities 223,178 223,156 Mezzanine equity Preferred stock ($0.0001 par value, 10,000,000 shares authorized, no shares issued and outstanding as of June 30, 2022 and Decem ber 31, 2021) — — Shareholders' equity Common stock ($0.0001 par value, 190,000,000 shares authorized, 37,032,271 and 34,383,350 shares issued and outstanding as of Ju ne 30, 2022 and December 31, 2021, respectively) 4 3 Additional paid - in capital 194,704 127,606 Accumulated other comprehensive loss (105) (1,917) Accumulated deficit (48,305) (37,052) Total shareholders’ equity 146,298 88,640 Total liabilities, mezzanine equity and shareholders' equity $ 369,476 $ 311,796 |
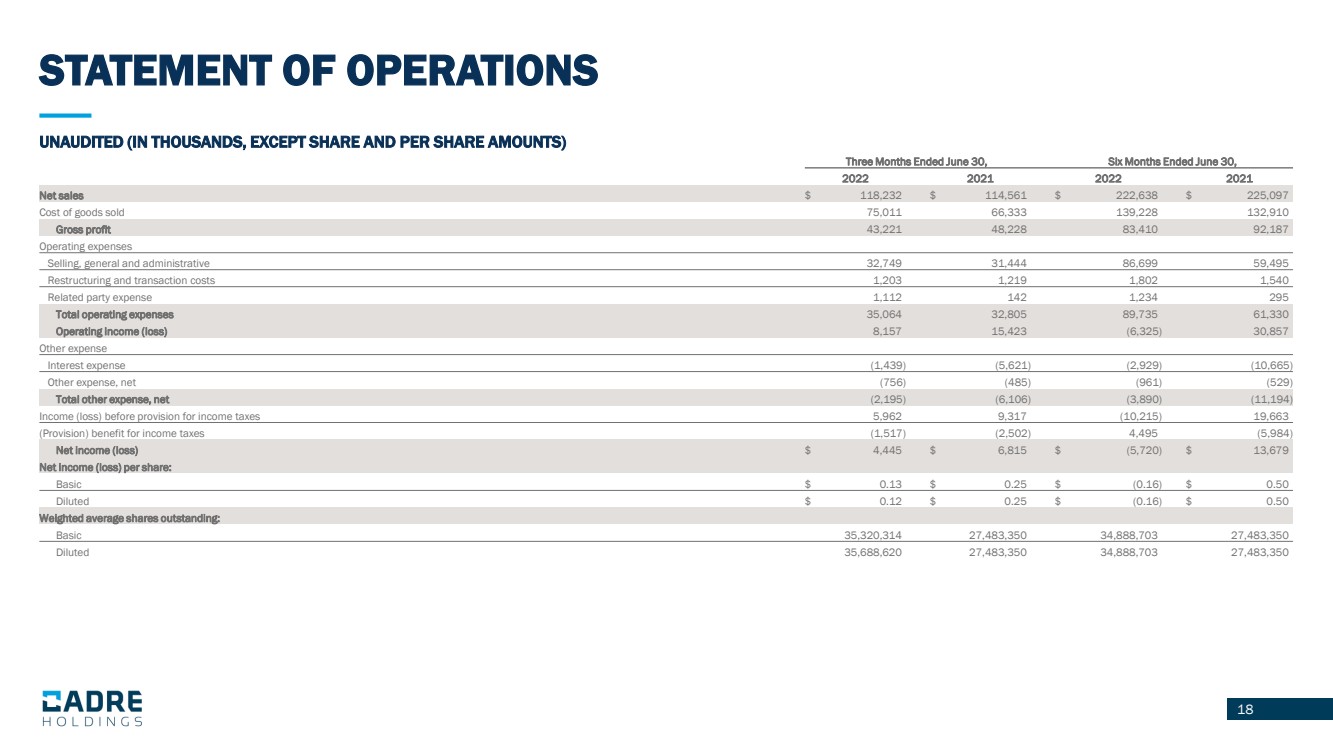
| 18 STATEMENT OF OPERATIONS 18 UNAUDITED (IN THOUSANDS, EXCEPT SHARE AND PER SHARE AMOUNTS) Three Months Ended June 30, Six Months Ended June 30, 2022 2021 2022 2021 Net sales $ 118,232 $ 114,561 $ 222,638 $ 225,097 Cost of goods sold 75,011 66,333 139,228 132,910 Gross profit 43,221 48,228 83,410 92,187 Operating expenses Selling, general and administrative 32,749 31,444 86,699 59,495 Restructuring and transaction costs 1,203 1,219 1,802 1,540 Related party expense 1,112 142 1,234 295 Total operating expenses 35,064 32,805 89,735 61,330 Operating income (loss) 8,157 15,423 (6,325) 30,857 Other expense Interest expense (1,439) (5,621) (2,929) (10,665) Other expense, net (756) (485) (961) (529) Total other expense, net (2,195) (6,106) (3,890) (11,194) Income (loss) before provision for income taxes 5,962 9,317 (10,215) 19,663 (Provision) benefit for income taxes (1,517) (2,502) 4,495 (5,984) Net income (loss) $ 4,445 $ 6,815 $ (5,720) $ 13,679 Net income (loss) per share: Basic $ 0.13 $ 0.25 $ (0.16) $ 0.50 Diluted $ 0.12 $ 0.25 $ (0.16) $ 0.50 Weighted average shares outstanding: Basic 35,320,314 27,483,350 34,888,703 27,483,350 Diluted 35,688,620 27,483,350 34,888,703 27,483,350 |
| 19 STATEMENT OF CASH FLOWS 19 UNAUDITED (IN THOUSANDS) Continued on next slide Six Months Ended June 30, 2022 2021 Cash Flows From Operating Activities: Net (loss) income $ (5,720) $ 13,679 Adjustments to reconcile net (loss) income to net cash provided by operating activities: Depreciation and amortization 7,380 7,020 Amortization of original issue discount and debt issue costs 367 2,029 Amortization of inventory step - up 1,344 — Deferred income taxes (4,594) 4,607 Stock - based compensation 26,327 — Provision for (recoveries from) losses on accounts receivable 240 (308) Foreign exchange loss 1,107 (267) Changes in operating assets and liabilities, net of impact of acquisitions: Accounts receivable (3,243) (2,429) Inventories (1,461) (7,124) Prepaid expenses and other assets 3,616 2,292 Accounts payable and other liabilities (345) 9,208 Net cash provided by operating activities 25,018 28,707 Cash Flows From Investing Activities: Purchase of property and equipment (2,473) (1,506) Business acquisitions, net of cash acquired (55,039) — Net cash used in investing activities (57,512) (1,506) |
| 20 STATEMENT OF CASH FLOWS - CONTINUED 20 UNAUDITED (IN THOUSANDS) Six Months Ended June 30, 2022 2021 Cash Flows From Financing Activities: Proceeds from revolving credit facilities 48,000 176,548 Principal payments on revolving credit facilities (48,000) (176,548) Principal payments on term loans (5,009) (13,687) Principal payments on insurance premium financing (2,853) (1,225) Payment of capital leases (22) (21) Taxes paid in connection with employee stock transactions (6,216) — Proceeds from secondary offering, net of underwriter discounts 49,703 — Deferred offering costs (2,715) — Dividends distributed (5,533) — Net cash provided by (used in) financing activities 27,355 (14,933) Effect of foreign exchange rates on cash and cash equivalents 144 42 Change in cash and cash equivalents (4,995) 12,310 Cash and cash equivalents, beginning of period 33,857 2,873 Cash and cash equivalents, end of period $ 28,862 $ 15,183 Supplemental Disclosure of Cash Flows Information: Cash paid for income taxes, net $ 241 $ 473 Cash paid for interest $ 2,330 $ 8,524 Supplemental Disclosure of Non - Cash Investing and Financing Activities: Accruals and accounts payable for capital expenditures $ 17 $ — |
| 21 1. Reflects the “Restructuring and transaction costs” line item on our consolidated statement of operations, which primarily inc lud es transaction costs composed of legal and consulting fees, and $1.0 million paid to Kanders & Company, Inc., a company controlled by our Chief Executive Officer, for services related to the acquisition of Cyalume , which is included in related party expense in the Company’s consolidated statements of operations and comprehensive income (lo ss). 2. Reflects losses incurred in connection with the August 2021 debt refinance. 3. Reflects the “Other expense, net” line item on our consolidated statement of operations. For the three and six months ended J une 30, 2022 and 2021, other expense, net primarily includes losses on foreign currency transactions. 4. Reflects compensation expense related to equity and liability classified stock - based compensation plans. 5. Reflects payroll taxes associated with vested stock - based compensation awards. 6. Reflects the cost of a cash - based long - term incentive plan awarded to employees that vests over three years. 7. Reflects amortization expense related to the step - up inventory adjustment recorded as part of the recent acquisitions. 8. Reflects (Adjusted EBITDA less capital expenditures) / Adjusted EBITDA. 9. Reflects Adjusted EBITDA / Net Sales for the relevant periods. 21 (IN THOUSANDS) NON - GAAP RECONCILIATION Year ended Three Months Three Months Ended Six Months Ended Last Twelve December 31, Ended March 31, June 30, June 30, Months 2021 2022 2022 2021 2022 2021 June 30, 2022 Net income (loss) $ 12,661 $ (10,165) $ 4,445 $ 6,815 $ (5,720) $ 13,679 $ (6,738) Add back: Depreciation and amortization 13,718 3,544 3,836 3,481 7,380 7,020 14,078 Interest expense 16,425 1,490 1,439 5,621 2,929 10,665 8,689 Provision (benefit) for income taxes 6,531 (6,012) 1,517 2,502 (4,495) 5,984 (3,948) EBITDA $ 49,335 $ (11,143) $ 11,237 $ 18,419 $ 94 $ 37,348 $ 12,081 Add back: Restructuring and transaction costs (1) 3,430 599 2,203 1,219 2,802 1,540 4,692 Loss on extinguishment of debt (2) 15,155 — — — — — 15,155 Other expense, net (3) 947 205 756 485 961 529 1,379 Stock - based compensation expense (4) 355 23,723 2,818 — 26,541 — 26,896 Stock - based compensation payroll tax expense (5) — 298 7 — 305 — 305 LTIP bonus (6) 2,162 384 174 328 558 1,280 1,440 Amortization of inventory step - up (7) — 153 1,191 — 1,344 — 1,344 Adjusted EBITDA $ 71,384 $ 14,219 $ 18,386 $ 20,451 $ 32,605 $ 40,697 $ 63,292 Less: Capital expenditures (3,029) (1,069) (1,421) (718) (2,490) (1,506) (4,013) Adjusted EBITDA less capital expenditures $ 68,355 $ 13,150 $ 16,965 $ 19,733 $ 30,115 $ 39,191 $ 59,279 Adjusted EBITDA conversion rate (8) 96 % 92 % 92 % 96 % 92 % 96 % 94 % Adjusted EBITDA margin (9) 16.7 % 13.6 % 15.6 % 17.9 % 14.6 % 18.1 % |