United States
Securities and Exchange Commission
Washington, D.C. 20549
Form
Current Report
Pursuant to Section 13 or 15(d) of the Securities Exchange Act of 1934
Date of Report (Date of earliest event reported):
(Exact name of registrant as specified in its charter)
(State or other jurisdiction | (Commission File Number) | (IRS Employer |
of incorporation) |
| Identification Number) |
(Zip Code) | |
(Address of principal executive offices) |
|
Registrant’s telephone number, including area code: (
N/A
(Former name or former address, if changed since last report.)
Check the appropriate box below if the Form 8-K filing is intended to simultaneously satisfy the filing obligation of the registrant under any of the following provisions:
Securities registered pursuant to Section 12(b) of the Act:
Title of each class | Trading Symbol | Name of each exchange on which registered |
Indicate by check mark whether the registrant is an emerging growth company as defined in Rule 405 of the Securities Act of 1933 (§230.405 of this chapter) or Rule 12b-2 of the Securities Exchange Act of 1934 (§240.12b-2 of this chapter).
Emerging growth company |
If an emerging growth company, indicate by check mark if the registrant has elected not to use the extended transition period for complying with any new or revised financial accounting standards provided pursuant to Section 13(a) of the Exchange Act.
Item 2.02 Results of Operations and Financial Condition
On March 10, 2026, Cadre Holdings, Inc. (the “Company”) issued a press release announcing its financial results for the fourth quarter and year ended December 31, 2025. A copy of this press release is attached hereto as Exhibit 99.1 and is incorporated herein by reference. Attached hereto as Exhibit 99.2 and incorporated herein by reference is a presentation regarding the Company’s financial results for the fourth quarter and year ended December 31, 2025.
The press release and presentation contain the non-GAAP measures earnings before interest, taxes, other income or expense, depreciation and amortization (“EBITDA”), adjusted EBITDA and adjusted EBITDA margin. The Company believes that the presentation of these non-GAAP measures provides useful information to understand its ongoing operations and enables investors to focus on period-over-period operating performance, and thereby enhances the investor’s overall understanding of the Company's current financial performance relative to past performance and provides, along with the nearest GAAP measures, a baseline for modeling future earnings expectations. The non-GAAP measures are reconciled to comparable GAAP financial measures within the press release and the presentation. The Company does not provide a reconciliation of the non-GAAP guidance measure adjusted EBITDA for the fiscal year 2026 to net income for the fiscal year 2026, the most comparable GAAP financial measure, due to the inherent difficulty of forecasting certain types of expenses and gains, without unreasonable effort, which affect net income but not adjusted EBITDA. The Company cautions that non-GAAP measures should be considered in addition to, but not as a substitute for, the Company’s reported GAAP results. Additionally, the Company notes that there can be no assurance that the above referenced non-GAAP financial measures are comparable to similarly titled financial measures used by other publicly traded companies.
The information in Item 2.02 of this Current Report on Form 8-K (including Exhibits 99.1 and 99.2 attached hereto) shall not be deemed “filed” for purposes of Section 18 of the Securities Act of 1934, as amended, nor shall it be deemed incorporated by reference in any filing under the Securities Act of 1933, as amended, except as shall be expressly set forth by specific reference in such filing.
Item 9.01. Financial Statements and Exhibits
(d) Exhibits.
Exhibit | Description | |
|
|
|
99.1 |
| |
99.2 |
| Slide Presentation for Conference Call to be held on March 11, 2026 (furnished only). |
104 |
| Cover Page Interactive Data File (embedded within the Inline XBRL document). |
SIGNATURES
Pursuant to the requirements of the Securities Exchange Act of 1934, as amended, the Company has duly caused this report to be signed on its behalf by the undersigned hereunto duly authorized.
Dated: March 10, 2026
| CADRE HOLDINGS, INC. | |
|
| |
|
| |
| By: | /s/ Blaine Browers |
|
| Name:Blaine Browers |
|
| Title:Chief Financial Officer |
Exhibit 99.1
Cadre Holdings Reports Fourth Quarter and Full Year 2025 Financial Results
Generated Annual Net Sales of $610.3 Million, Gross Margin of 42.5% and Net Income of $44.1 Million
Achieved Record Annual Adjusted EBITDA for Third Consecutive Year
Expects Full Year 2026 Net Sales of $736 to $758 Million and Adjusted EBITDA of $136 to $141 Million, Reflecting Year-Over-Year Growth of 22% and 24%, Respectively, at Midpoints
JACKSONVILLE, Fla., March 10, 2026 – Cadre Holdings, Inc. (NYSE: CDRE) (“Cadre” or “Company”), a global leader in the manufacturing and distribution of safety equipment and other related products for the law enforcement, first responder, military and nuclear markets, announced today its consolidated operating results for the quarter and year ended December 31, 2025.
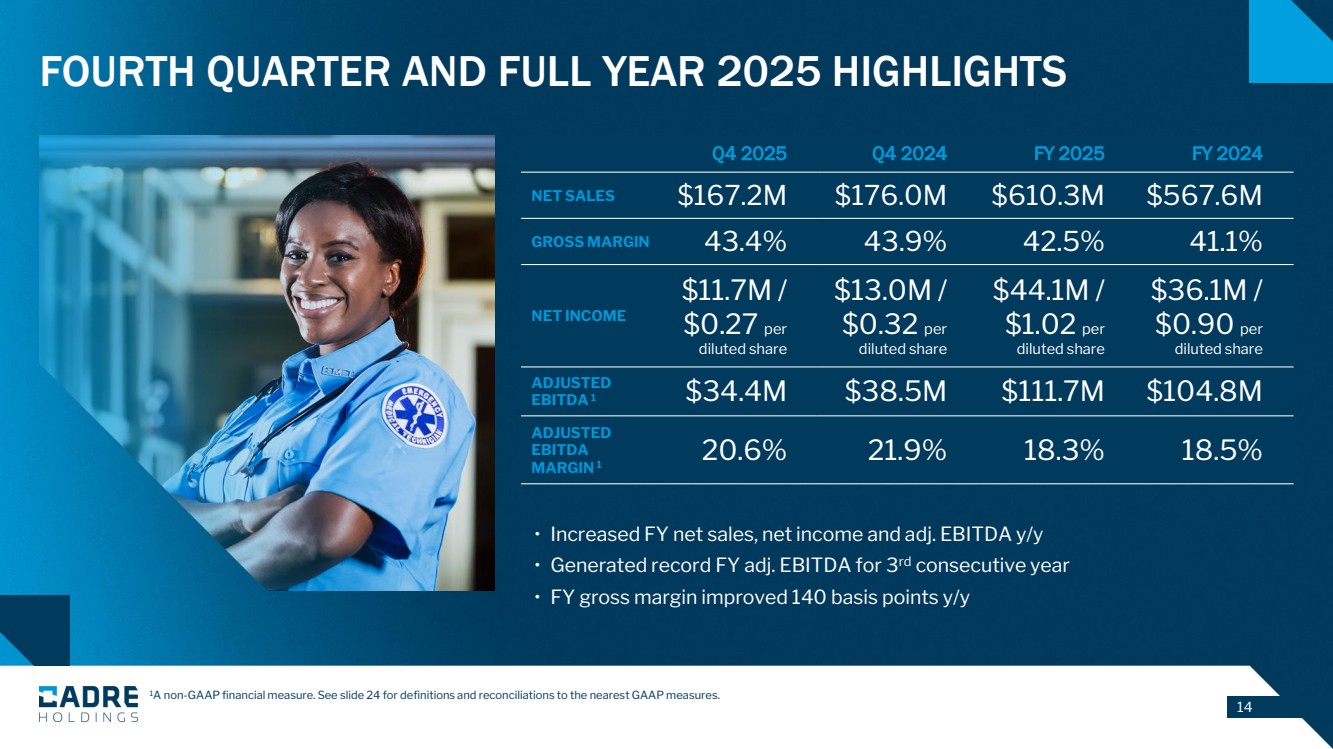
| ● | Net sales of $167.2 million for the fourth quarter; net sales of $610.3 million for the year ended December 31, 2025. |
| ● | Gross profit margin of 43.4% for the fourth quarter; gross profit margin of 42.5% for the year ended December 31, 2025. |
| ● | Net income of $11.7 million, or $0.27 per diluted share, for the fourth quarter; net income of $44.1 million, or $1.02 per diluted share, for the year ended December 31, 2025. |
| ● | Adjusted EBITDA of $34.4 million for the fourth quarter; adjusted EBITDA of $111.7 million for the year ended December 31, 2025. |
| ● | Adjusted EBITDA margin of 20.6% for the fourth quarter; adjusted EBITDA margin of 18.3% for the year ended December 31, 2025. |
| ● | Declared quarterly cash dividend of $0.10 per share in January 2026. On an annualized basis, this dividend represents an increase of $0.02 per share, or 5.3% per share, over the previous annualized dividend of $0.38 per share. |
“2025 marked another year of strong financial and strategic progress for Cadre, underscoring the resilience of our businesses, the market leadership of our brands, and the consistency of our teams’ execution,” said Warren Kanders, CEO and Chairman. “We continued to see strong and recurring demand throughout the year for our suite of leading safety products across our law enforcement, first responder, military and nuclear categories. We delivered higher net sales and profit in 2025, as well as record adjusted EBITDA, while expanding full year gross margin 140 basis points year-over-year. The Cadre operating model drives improvement every day, and we are excited about the potential to unlock further efficiencies and profitability moving forward.”
Mr. Kanders added, “Cadre maintains a relentless focus on disciplined M&A, and we are pleased to have capitalized on two more highly attractive opportunities in 2025. Following the acquisition of Carr's Engineering Division in April, which added scale and a broader international footprint to our nuclear vertical, we took steps to further enhance Cadre's leadership in our core market with the addition of TYR Tactical. A leading provider of plate carriers, vests, hard armor, and shields to tactical teams, TYR has world-class engineering capabilities and a global reach. Looking ahead, we have a robust acquisition pipeline in both the public safety and nuclear markets and intend to continue to grow our diversified portfolio of mission-critical safety businesses through patient and disciplined capital allocation.”
Fourth Quarter and Year-End 2025 Operating Results
For the quarter ended December 31, 2025, Cadre generated net sales of $167.2 million, as compared to $176.0 million for the quarter ended December 31, 2024. This decrease was primarily a result of higher than normal shipments in the prior year due to the cyber incident in the third quarter of 2024.
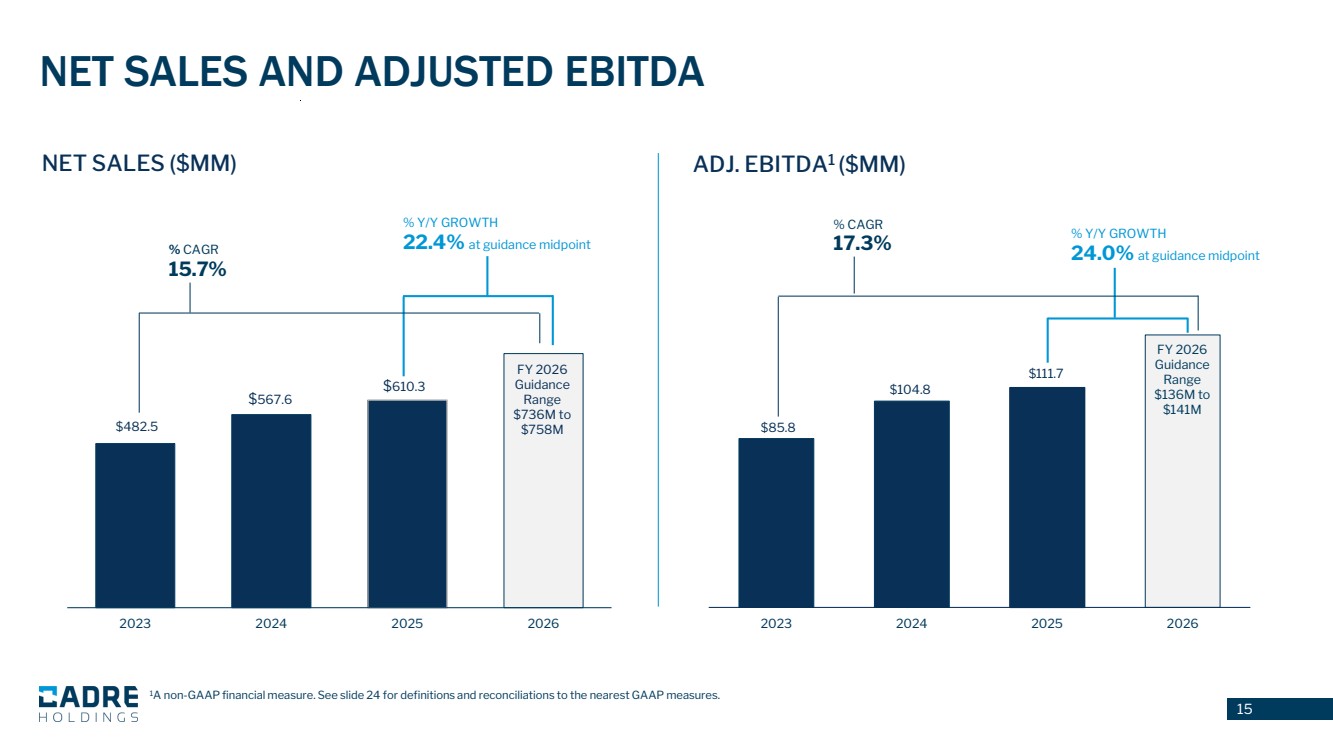
For the year ended December 31, 2025, Cadre generated net sales of $610.3 million, as compared to $567.6 million for the year ended December 31, 2024, mainly driven by recent acquisitions and higher demand for duty gear products, partially offset by a decline in EOD products and existing nuclear safety products.
For the quarter ended December 31, 2025, Cadre generated gross profit of $72.6 million, as compared to $77.2 million for the quarter ended December 31, 2024. For the year ended December 31, 2025, Cadre generated gross profit of $259.6 million, as compared to $233.5 million for the prior year period.
Gross profit margin was 43.4% for the quarter ended December 31, 2025, as compared to 43.9% for the quarter ended December 31, 2024, mainly driven by lower volumes and an increase in inventory step-up amortization, partially offset by favorable pricing net of material inflation. Gross profit margin was 42.5% for the year ended December 31, 2025, as compared to 41.1% for the prior year period.
Net income was $11.7 million for the quarter ended December 31, 2025, as compared to net income of $13.0 million for the quarter ended December 31, 2024, primarily as a result of decreased gross profit year over year.
Net income was $44.1 million for the year ended December 31, 2025, as compared to net income of $36.1 million for the prior year period, primarily as a result of increased gross profit, partially offset by increases in selling, general and administrative expenses from acquisitions, acquisition related costs, interest expense, and stock compensation expense.
Cadre generated $34.4 million of adjusted EBITDA for the quarter ended December 31, 2025, as compared to $38.5 million for the quarter ended December 31, 2024. Adjusted EBITDA margin was 20.6% for the quarter ended December 31, 2025, as compared to 21.9% for the prior year period.
Cadre generated $111.7 million of adjusted EBITDA for the year ended December 31, 2025, as compared to $104.8 million for the prior period. Adjusted EBITDA margin was 18.3% for the year ended December 31, 2025, as compared to 18.5% for the prior year period.
Product segment gross margin was 44.2% and 43.5% for the fourth quarter and full year of 2025, respectively, compared to 45.4% and 42.2% for the prior year periods.
Distribution segment gross margin was 21.9% and 22.0% for the fourth quarter and full year of 2025, respectively, compared to 21.8% and 22.5% for the prior year periods.
Liquidity, Cash Flows and Capital Allocation
| ● | Cash and cash equivalents decreased by $2.0 million from $124.9 million as of December 31, 2024 to $122.9 million as of December 31, 2025. |
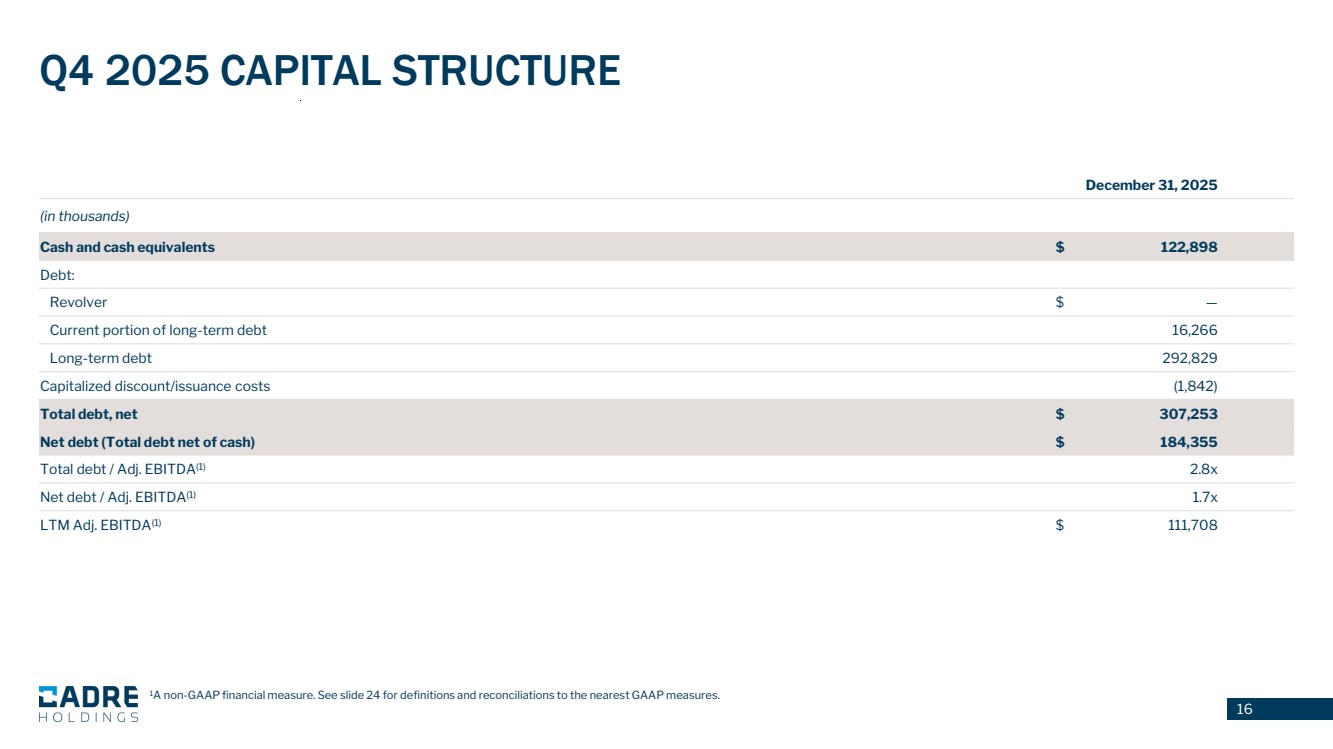
| ● | Total debt increased by $84.1 million from $223.2 million as of December 31, 2024 to $307.3 million as of December 31, 2025. |
| ● | Net debt (total debt net of cash and cash equivalents) increased by $86.1 million from $98.3 million as of December 31, 2024 to $184.4 million as of December 31, 2025. |
| ● | Capital expenditures totaled $3.4 million for the fourth quarter and $7.0 million for the year ended December 31, 2025, compared with $1.4 million for the fourth quarter and $5.8 million for the year ended December 31, 2024. |
Acquisition of TYR Tactical
On January 30, 2026, Cadre completed its acquisition of TYR Tactical, LLC, a leading global manufacturer of tactical gear and equipment for military, law enforcement, and government agencies worldwide. The addition of TYR Tactical is expected to be immediately accretive to earnings and adjusted EBITDA margins.
Increased Dividend
On January 20, 2026, the Company announced that its Board of Directors declared a quarterly cash dividend of $0.10 per share, or $0.40 per share on an annualized basis, which represents an increase of $0.02 per share, or 5.3% per share, over the previous annualized dividend of $0.38 per share. Cadre's dividend payment was made on February 13, 2026 to shareholders of record as of the close of business on the record date of January 30, 2026. The declaration of any future dividend is subject to the discretion of the Company's Board of Directors.
2026 Outlook
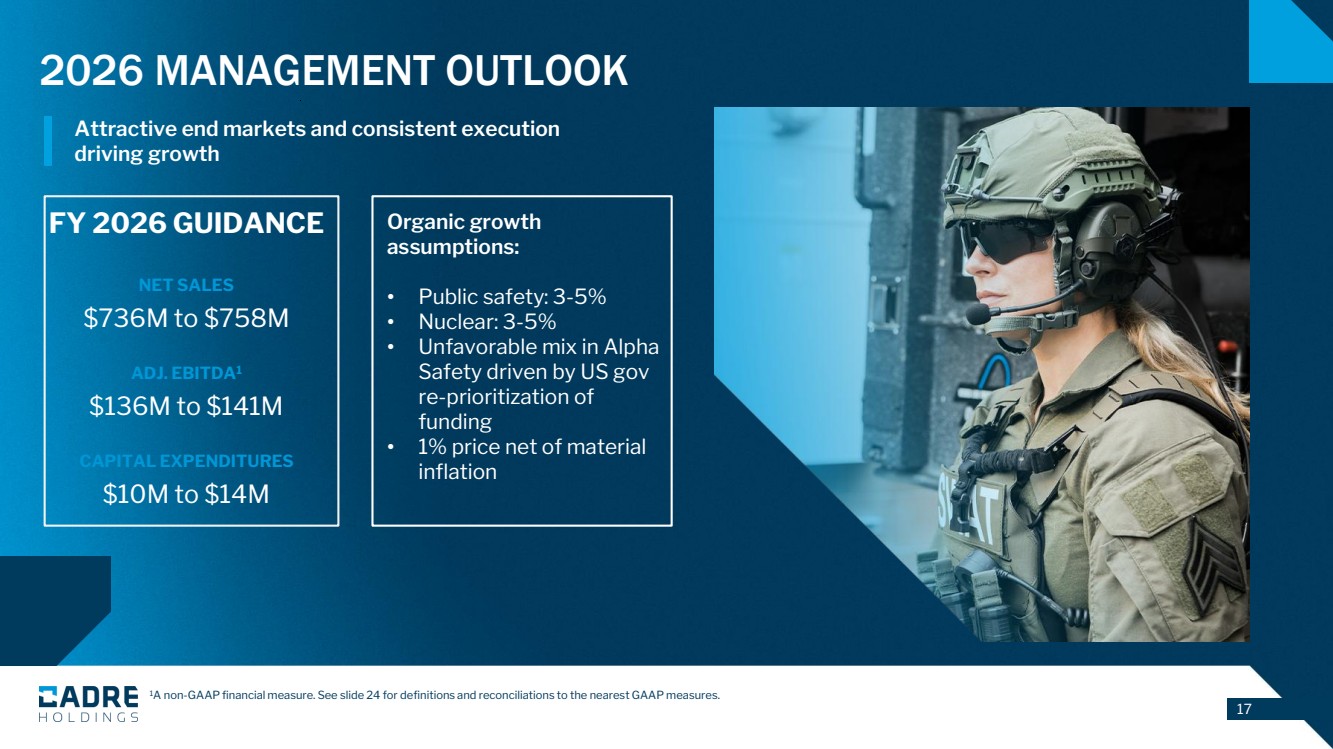
For the full year 2026, Cadre expects to generate net sales in the range of $736 million to $758 million and adjusted EBITDA in the range of $136 million and $141 million. We expect capital expenditures to be in the range of $10 million to $14 million. Cadre has not provided net income guidance due to the inherent difficulty of forecasting certain types of expenses and gains, which affect net income but not adjusted EBITDA. Therefore, we do not provide a reconciliation of adjusted EBITDA guidance to net income guidance.
Conference Call
Management will host a conference call on Wednesday, March 11, 2026, at 10:00 a.m. EST to discuss the latest corporate developments and financial results. The dial-in number for callers in the US is (800)-715-9871 and the dial-in number for international callers is 646-307-1963. The access code for all callers is 9511718. A live webcast will also be available on the Company’s website at https://www.cadre-holdings.com/.
A replay of the call will be available through March 25, 2026. To access the replay, please dial 800-770-2030 in the U.S. or +1-609-800-9909 if outside the U.S., and then enter the access code 9511718.
About Cadre
Headquartered in Jacksonville, Florida, Cadre is a global leader in the manufacturing and distribution of safety products. Cadre's equipment provides critical protection to allow users to safely and securely perform their duties and protect those around them in hazardous or life-threatening situations. The Company's core products include body armor, explosive ordnance disposal equipment, duty gear and nuclear safety products. Our highly engineered products are utilized in over 100 countries by federal, state and local law enforcement, fire and rescue professionals, explosive ordnance disposal teams, and emergency medical technicians. Our key brands include Safariland® and Med-Eng®, amongst others.
Use of Non-GAAP Measures
The Company reports its financial results in accordance with U.S. generally accepted accounting principles (“GAAP”). The press release contains the non-GAAP measures: (i) earnings before interest, taxes, other income or expense, depreciation and amortization (“EBITDA”), (ii) adjusted EBITDA and (iii) adjusted EBITDA margin. The Company believes the presentation of these non-GAAP measures provides useful information for the understanding of its ongoing operations and enables investors to focus on period- over-period operating performance, and thereby enhances the user’s overall understanding of the Company’s current financial performance relative to past performance and provides, along with the nearest GAAP measures, a baseline for modeling future earnings expectations. Non-GAAP measures are reconciled to comparable GAAP financial measures within this press release. We do not provide a reconciliation of the non-GAAP guidance measure adjusted EBITDA for the fiscal year 2026 to net income for the fiscal year 2026, the most comparable GAAP financial measure, due to the inherent difficulty of forecasting certain types of expenses and gains, without unreasonable effort, which affect net income but not adjusted EBITDA. The Company cautions that non-GAAP measures should be considered in addition to, but not as a substitute for, the Company’s reported GAAP results. Additionally, the Company notes that there can be no assurance that the above referenced non-GAAP financial measures are comparable to similarly titled financial measures used by other publicly traded companies.
Forward-Looking Statements
Please note that in this press release we may use words such as “appears,” “anticipates,” “believes,” “plans,” “expects,” “intends,” “future,” and similar expressions which constitute forward-looking statements within the meaning of the safe harbor provisions of the Private Securities Litigation Reform Act of 1995. Forward-looking statements are made based on our expectations and beliefs concerning future events impacting the Company and therefore involve a number of risks and uncertainties. We caution that forward-looking statements are not guarantees and that actual results could differ materially from those expressed or implied in the forward-looking statements. Potential risks and uncertainties that could cause the actual results of operations or financial condition of the Company to differ materially from those expressed or implied by forward-looking statements in this press release, include, but are not limited to, those risks and uncertainties more fully described from time to time in the Company's public reports filed with the Securities and Exchange Commission, including under the section titled “Risk Factors” in the Company's Annual Report on Form 10-K, and/or Quarterly Reports on Form 10-Q, as well as in the Company’s Current Reports on Form 8-K. All forward-looking statements included in this press release are based upon information available to the Company as of the date of this press
release and speak only as of the date hereof. We assume no obligation to update any forward- looking statements to reflect events or circumstances after the date of this press release.
Contact:
Gray Hudkins
Cadre Holdings, Inc.
203-550-7148
Investor Relations:
The IGB Group
Leon Berman / Matt Berkowitz
212-477-8438 / 212-227-7098
CADRE HOLDINGS, INC.
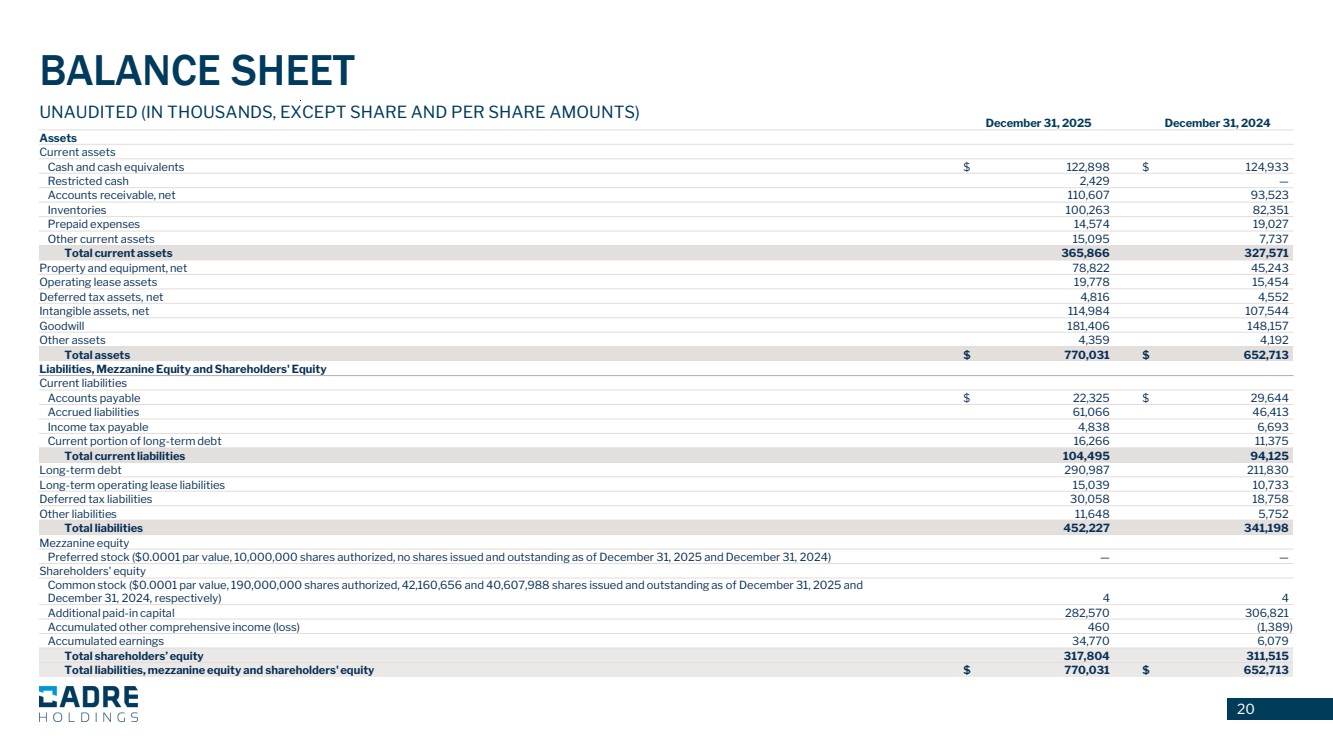
CONDENSED CONSOLIDATED BALANCE SHEETS
(Unaudited)
(In thousands, except share and per share amounts)
| | December 31, 2025 | | December 31, 2024 | ||
Assets |
| | |
| | |
Current assets |
| | |
| | |
Cash and cash equivalents | | $ | 122,898 | | $ | 124,933 |
Restricted cash | | | 2,429 | | | — |
Accounts receivable, net | |
| 110,607 | |
| 93,523 |
Inventories | |
| 100,263 | |
| 82,351 |
Prepaid expenses | |
| 14,574 | |
| 19,027 |
Other current assets | |
| 15,095 | |
| 7,737 |
Total current assets | |
| 365,866 | |
| 327,571 |
Property and equipment, net | | | 78,822 | | | 45,243 |
Operating lease assets | | | 19,778 | | | 15,454 |
Deferred tax assets, net | |
| 4,816 | |
| 4,552 |
Intangible assets, net | |
| 114,984 | |
| 107,544 |
Goodwill | |
| 181,406 | |
| 148,157 |
Other assets | |
| 4,359 | |
| 4,192 |
Total assets | | $ | 770,031 | | $ | 652,713 |
| | | | | | |
Liabilities, Mezzanine Equity and Shareholders' Equity | |
| | |
| |
Current liabilities | |
| | |
| |
Accounts payable | | $ | 22,325 | | $ | 29,644 |
Accrued liabilities | |
| 61,066 | |
| 46,413 |
Income tax payable | |
| 4,838 | |
| 6,693 |
Current portion of long-term debt | |
| 16,266 | |
| 11,375 |
Total current liabilities | |
| 104,495 | |
| 94,125 |
Long-term debt | |
| 290,987 | |
| 211,830 |
Long-term operating lease liabilities | | | 15,039 | | | 10,733 |
Deferred tax liabilities | |
| 30,058 | |
| 18,758 |
Other liabilities | |
| 11,648 | |
| 5,752 |
Total liabilities | |
| 452,227 | |
| 341,198 |
| | | | | | |
Mezzanine equity | |
| | |
| |
Preferred stock ($0.0001 par value, 10,000,000 shares authorized, no shares issued and outstanding as of December 31, 2025 and December 31, 2024) | |
| — | |
| — |
| | | | | | |
Shareholders' equity | |
| | |
| |
Common stock ($0.0001 par value, 190,000,000 shares authorized, 42,160,656 and 40,607,988 shares issued and outstanding as of December 31, 2025 and December 31, 2024, respectively) | |
| 4 | |
| 4 |
Additional paid-in capital | |
| 282,570 | |
| 306,821 |
Accumulated other comprehensive income (loss) | |
| 460 | |
| (1,389) |
Accumulated earnings | |
| 34,770 | |
| 6,079 |
Total shareholders’ equity | |
| 317,804 | |
| 311,515 |
Total liabilities, mezzanine equity and shareholders' equity | | $ | 770,031 | | $ | 652,713 |
CADRE HOLDINGS, INC.
CONDENSED CONSOLIDATED STATEMENTS OF OPERATIONS
(Unaudited)
(In thousands, except share and per share amounts)
| | Three Months Ended December 31, | | Year Ended December 31, | ||||||||
| | 2025 | | 2024 | | 2025 | | 2024 | ||||
Net sales | | $ | 167,224 | | $ | 175,984 | | $ | 610,308 | | $ | 567,561 |
Cost of goods sold | |
| 94,601 | |
| 98,797 | |
| 350,680 | |
| 334,080 |
Gross profit | |
| 72,623 | |
| 77,187 | |
| 259,628 | |
| 233,481 |
Operating expenses | |
| | |
| | |
| | |
| |
Selling, general and administrative | |
| 50,619 | |
| 45,046 | |
| 183,128 | |
| 158,323 |
Restructuring and transaction costs | |
| 1,456 | |
| 2,386 | |
| 7,696 | |
| 6,007 |
Related party expense | |
| 108 | |
| 352 | |
| 1,453 | |
| 2,390 |
Total operating expenses | |
| 52,183 | |
| 47,784 | |
| 192,277 | |
| 166,720 |
Operating income | |
| 20,440 | |
| 29,403 | |
| 67,351 | |
| 66,761 |
Other expense | |
| | |
| | |
| | |
| |
Interest expense, net | |
| (3,631) | |
| (2,191) | |
| (12,480) | |
| (7,822) |
Other income (expense), net | |
| 856 | |
| (4,496) | |
| 7,455 | |
| (4,721) |
Total other expense, net | |
| (2,775) | |
| (6,687) | |
| (5,025) | |
| (12,543) |
Income before provision for income taxes | |
| 17,665 | |
| 22,716 | |
| 62,326 | |
| 54,218 |
Provision for income taxes | |
| (5,926) | |
| (9,733) | |
| (18,187) | |
| (18,085) |
Net income | | $ | 11,739 | | $ | 12,983 | | $ | 44,139 | | $ | 36,133 |
| | | | | | | | | | | | |
Net income per share: | |
| | |
| | |
| | |
| |
Basic | | $ | 0.28 | | $ | 0.32 | | $ | 1.08 | | $ | 0.90 |
Diluted | | $ | 0.27 | | $ | 0.32 | | $ | 1.02 | | $ | 0.90 |
Weighted average shares outstanding: | |
| | |
| | |
| | |
| |
Basic | |
| 41,511,999 | |
| 40,607,988 | |
| 40,866,776 | |
| 39,945,982 |
Diluted | |
| 43,296,723 | |
| 40,977,622 | |
| 43,432,872 | |
| 40,332,042 |
CADRE HOLDINGS, INC.
CONDENSED CONSOLIDATED STATEMENTS OF CASH FLOWS
(Unaudited)
(In thousands)
| | Year Ended December 31, | |||||||
| | 2025 | | 2024 | | 2023 | |||
Cash Flows From Operating Activities: |
| | |
| | |
| | |
Net income | | $ | 44,139 | | $ | 36,133 | | $ | 38,641 |
Adjustments to reconcile net income to net cash provided by operating activities: | |
| | |
| | |
| |
Depreciation and amortization | |
| 18,633 | |
| 16,420 | |
| 15,737 |
Amortization of original issue discount and debt issue costs | |
| 1,321 | |
| 1,109 | |
| 479 |
Amortization of inventory step-up | | | 1,296 | | | 3,858 | | | — |
Deferred income taxes | |
| 2,388 | |
| (2,064) | |
| (210) |
Stock-based compensation | | | 12,239 | | | 8,369 | | | 9,368 |
Remeasurement of contingent consideration | | | 1,927 | | | 1,185 | | | — |
(Recoveries from) provision for losses on accounts receivable | |
| (108) | |
| 764 | |
| 66 |
Unrealized foreign exchange transaction (gain) loss | |
| (2,356) | |
| 1,880 | |
| (602) |
Other loss (gain) | | | 390 | | | 496 | | | (381) |
Changes in operating assets and liabilities, net of impact of acquisitions: | |
| | |
| | |
| |
Accounts receivable | |
| 8,363 | |
| (24,902) | |
| 6,602 |
Inventories | |
| (3,617) | |
| 10,019 | |
| (10,223) |
Prepaid expenses and other assets | |
| (4,503) | |
| (5,866) | |
| (302) |
Accounts payable and other liabilities | |
| (16,407) | |
| (15,624) | |
| 14,034 |
Net cash provided by operating activities | |
| 63,705 | |
| 31,777 | |
| 73,209 |
Cash Flows From Investing Activities: | |
| | |
| | |
| |
Purchase of property and equipment | |
| (6,856) | |
| (5,668) | |
| (6,727) |
Proceeds from disposition of property and equipment | | | 77 | | | 55 | | | 207 |
Business acquisitions, net of cash acquired | |
| (89,590) | |
| (141,813) | |
| — |
Net cash used in investing activities | |
| (96,369) | |
| (147,426) | |
| (6,520) |
Cash Flows From Financing Activities: | |
| | |
| | |
| |
Proceeds from revolving credit facilities | |
| — | |
| 5,500 | |
| — |
Principal payments on revolving credit facilities | |
| — | |
| (5,500) | |
| — |
Proceeds from term loans | | | 97,500 | | | 129,422 | | | — |
Principal payments on term loans | |
| (13,823) | |
| (43,334) | |
| (10,000) |
Proceeds from insurance premium financing | | | — | | | — | | | 3,949 |
Principal payments on insurance premium financing | |
| — | |
| (2,187) | |
| (3,973) |
Payments for debt issuance costs | | | — | | | (3,105) | | | — |
Taxes paid in connection with employee stock transactions | | | (40,227) | | | (5,311) | | | (2,725) |
Proceeds from exercise of stock options | | | 3,377 | | | — | | | — |
Proceeds from secondary offering, net of underwriter discounts | | | — | | | 91,776 | | | — |
Deferred offering costs | | | — | | | (683) | | | — |
Dividends distributed | |
| (15,448) | |
| (13,948) | |
| (12,006) |
Other | | | 207 | | | 37 | | | 33 |
Net cash provided by (used in) financing activities | |
| 31,586 | |
| 152,667 | |
| (24,722) |
Effect of foreign exchange rates on cash, cash equivalents and restricted cash | |
| 1,472 | |
| 224 | |
| 438 |
Change in cash, cash equivalents and restricted cash | |
| 394 | |
| 37,242 | |
| 42,405 |
Cash, cash equivalents and restricted cash, beginning of period | |
| 124,933 | |
| 87,691 | |
| 45,286 |
Cash, cash equivalents and restricted cash, end of period | | $ | 125,327 | | $ | 124,933 | | $ | 87,691 |
Supplemental Disclosure of Cash Flows Information: | | | | | | | | | |
Cash paid for income taxes, net | | $ | 24,920 | | $ | 24,207 | | $ | 8,729 |
Cash paid for interest | | $ | 17,842 | | $ | 14,431 | | $ | 10,090 |
Supplemental Disclosure of Non-Cash Investing and Financing Activities: | | | | | | | | | |
Accruals and accounts payable for capital expenditures | | $ | 139 | | $ | 176 | | $ | 234 |
CADRE HOLDINGS, INC.
SEGMENT INFORMATION
(Unaudited)
(In thousands)
| | Three Months Ended December 31, 2025 | ||||||||||
| | | | | | | | Reconciling | | | | |
| | Product | | Distribution | | Items(1) | | Total | ||||
Net sales | | $ | 152,054 | | $ | 25,051 | | $ | (9,881) | | $ | 167,224 |
Cost of goods sold | | | 84,867 | | | 19,553 | | | (9,819) | | | 94,601 |
Gross profit | | $ | 67,187 | | $ | 5,498 | | $ | (62) | | $ | 72,623 |
| | Three Months Ended December 31, 2024 | ||||||||||
| | | | | | | | Reconciling | | | | |
| | Product | | Distribution | | Items(1) | | Total | ||||
Net sales | | $ | 153,913 | | $ | 33,782 | | $ | (11,711) | | $ | 175,984 |
Cost of goods sold | | | 84,093 | | | 26,415 | | | (11,711) | | | 98,797 |
Gross profit | | $ | 69,820 | | $ | 7,367 | | $ | — | | $ | 77,187 |
| | Year Ended December 31, 2025 | ||||||||||
| | | | | | | | Reconciling | | | | |
| | Product | | Distribution | | Items(1) | | Total | ||||
Net sales | | $ | 543,713 | | $ | 104,904 | | $ | (38,309) | | $ | 610,308 |
Cost of goods sold | | | 307,056 | | | 81,846 | | | (38,222) | | | 350,680 |
Gross profit | | $ | 236,657 | | $ | 23,058 | | $ | (87) | | $ | 259,628 |
| | Year Ended December 31, 2024 | ||||||||||
| | | | | | | | Reconciling | | | | |
| | Product | | Distribution | | Items(1) | | Total | ||||
Net sales | | $ | 497,624 | | $ | 105,397 | | $ | (35,460) | | $ | 567,561 |
Cost of goods sold | | | 287,864 | | | 81,631 | | | (35,415) | | | 334,080 |
Gross profit | | $ | 209,760 | | $ | 23,766 | | $ | (45) | | $ | 233,481 |
| (1) | Reconciling items consist primarily of intercompany eliminations and items not directly attributable to operating segments. |
CADRE HOLDINGS, INC.
RECONCILIATION OF GAAP TO NON-GAAP FINANCIAL MEASURES
(Unaudited)
(In thousands)
| | | | | | | | | |
| | |
|
| | Three Months Ended December 31, | | Year Ended December 31, | | ||||||||
| | 2025 | | 2024 | | 2025 | | 2024 | | ||||
Net income | | $ | 11,739 | | $ | 12,983 | | $ | 44,139 | | $ | 36,133 | |
Add back: | |
| | |
| |
|
| | |
| | |
Depreciation and amortization | |
| 4,725 | |
| 4,095 |
|
| 18,633 | |
| 16,420 | |
Interest expense, net | |
| 3,631 | |
| 2,191 |
|
| 12,480 | |
| 7,822 | |
Provision for income taxes | |
| 5,926 | |
| 9,733 |
|
| 18,187 | |
| 18,085 | |
EBITDA | | $ | 26,021 | | $ | 29,002 |
| $ | 93,439 | | $ | 78,460 | |
Add back: | |
| | |
| |
|
| | |
| | |
Restructuring and transaction costs(1) | |
| 1,456 | |
| 2,386 |
|
| 8,696 | |
| 7,757 | |
Other expense (income), net(2) | |
| (856) | |
| 4,496 |
|
| (7,455) | |
| 4,721 | |
Stock-based compensation expense(3) | | | 5,399 | | | 2,114 | | | 12,239 | | | 8,369 | |
Stock-based compensation payroll tax expense(4) | | | 1,474 | | | — | | | 1,566 | | | 441 | |
LTIP bonus(5) | |
| — | |
| — |
|
| — | |
| 49 | |
Amortization of inventory step-up(6) | | | 470 | |
| 7 |
|
| 1,296 | |
| 3,858 | |
Contingent consideration expense(7) | | | 438 | |
| 500 | | | 1,927 | | | 1,185 | |
Adjusted EBITDA | | $ | 34,402 | | $ | 38,505 |
| $ | 111,708 | | $ | 104,840 | |
Adjusted EBITDA margin(8) | | | 20.6 | % | | 21.9 | % | | 18.3 | % | | 18.5 | % |
| (1) | Reflects the “Restructuring and transaction costs” line item on our consolidated statements of operations and comprehensive income, which primarily includes transaction costs composed of legal and consulting fees. In addition, this line item reflects a $1.0 million fee paid to Kanders & Company, Inc. for services related to the acquisition of Zircaloy for the year ended December 31, 2025 and fees of $1.8 million and $0.3 million paid to Kanders & Company, Inc. for services related to the acquisition of Alpha Safety and execution of our debt refinancing, respectively, for the year ended December 31, 2024, which are included in related party expense in the Company’s consolidated statements of operations. |
| (2) | Reflects the “Other income (expense), net” line item on our condensed consolidated statements of operations and primarily includes transaction gains and losses due to fluctuations in foreign currency exchange rates. |
| (3) | Reflects compensation expense related to equity classified stock-based compensation plans. |
| (4) | Reflects payroll taxes associated with vested stock-based compensation awards. |
| (5) | Reflects the cost of a cash-based long-term incentive plan awarded to employees that vests over three years. |
| (6) | Reflects amortization expense related to the step-up inventory adjustment recorded as a result of our recent acquisitions. |
| (7) | Reflects contingent consideration expense related to the acquisition of ICOR. |
| (8) | Reflects adjusted EBITDA / net sales for the relevant periods. |
| FOURTH QUARTER 2025 March 11, 2025 |

| 2 FORWARD-LOOKING STATEMENTS Please note that in this presentation we may use words such as “appears,” “anticipates,” “believes,” “plans,” “expects,” “intends,” “future,” and similar expressions which constitute forward-looking statements within the meaning of the safe harbor provisions of the Private Securities Litigation Reform Act of 1995. Forward-looking statements are made based on our expectations and beliefs concerning future events impacting the Company and therefore involve a number of risks and uncertainties. We caution that forward-looking statements are not guarantees and that actual results could differ materially from those expressed or implied in the forward-looking statements. Potential risks and uncertainties that could cause the actual results of operations or financial condition of the Company to differ materially from those expressed or implied by forward-looking statements in this presentation, include, but are not limited to those risks and uncertainties more fully described from time to time in the Company's public reports filed with the Securities and Exchange Commission, including under the section titled “Risk Factors” in the Company's Annual Report on Form 10-K, and/or Quarterly Reports on Form 10-Q, as well as in the Company’s Current Reports on Form 8-K. All forward-looking statements included in this presentation are based upon information available to the Company as of the date of this presentation and speak only as of the date hereof. We assume no obligation to update any forward-looking statements to reflect events or circumstances after the date of this presentation. 2 |
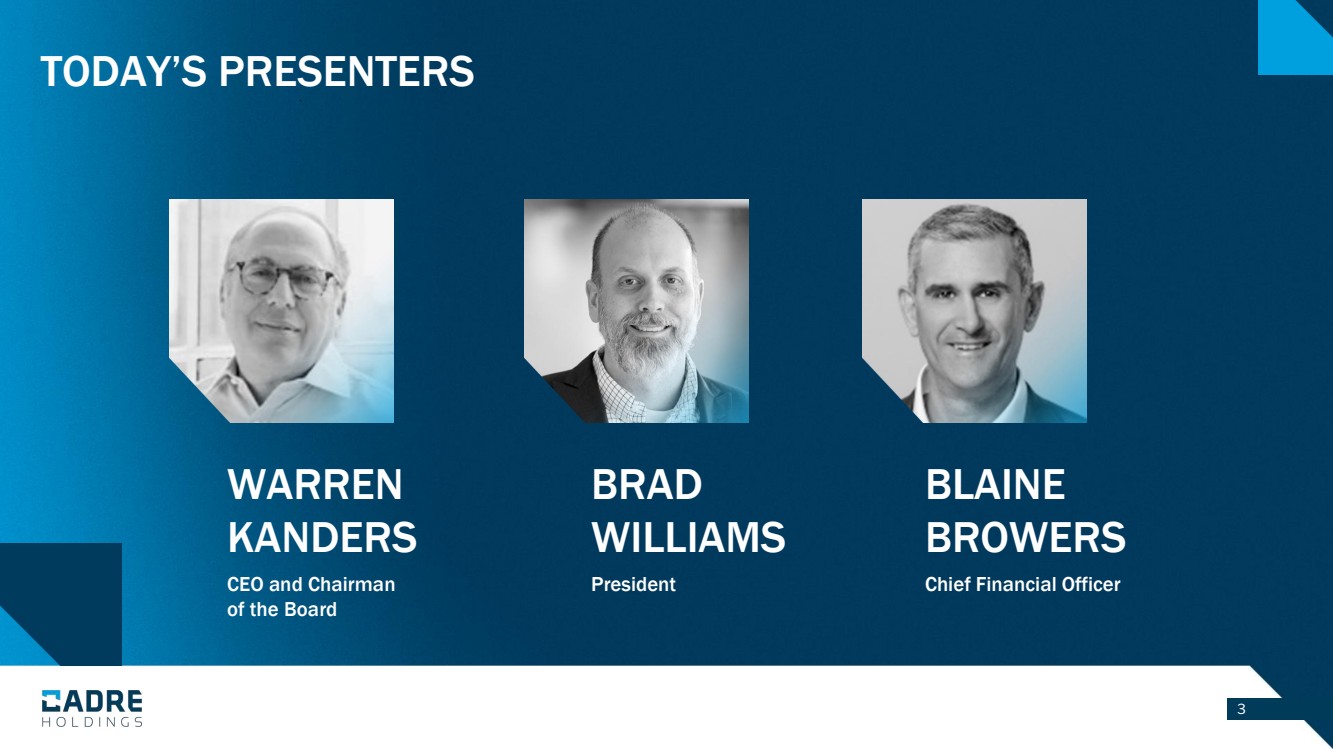
| TODAY’S PRESENTERS 3 WARREN KANDERS CEO and Chairman of the Board BRAD WILLIAMS President BLAINE BROWERS Chief Financial Officer |
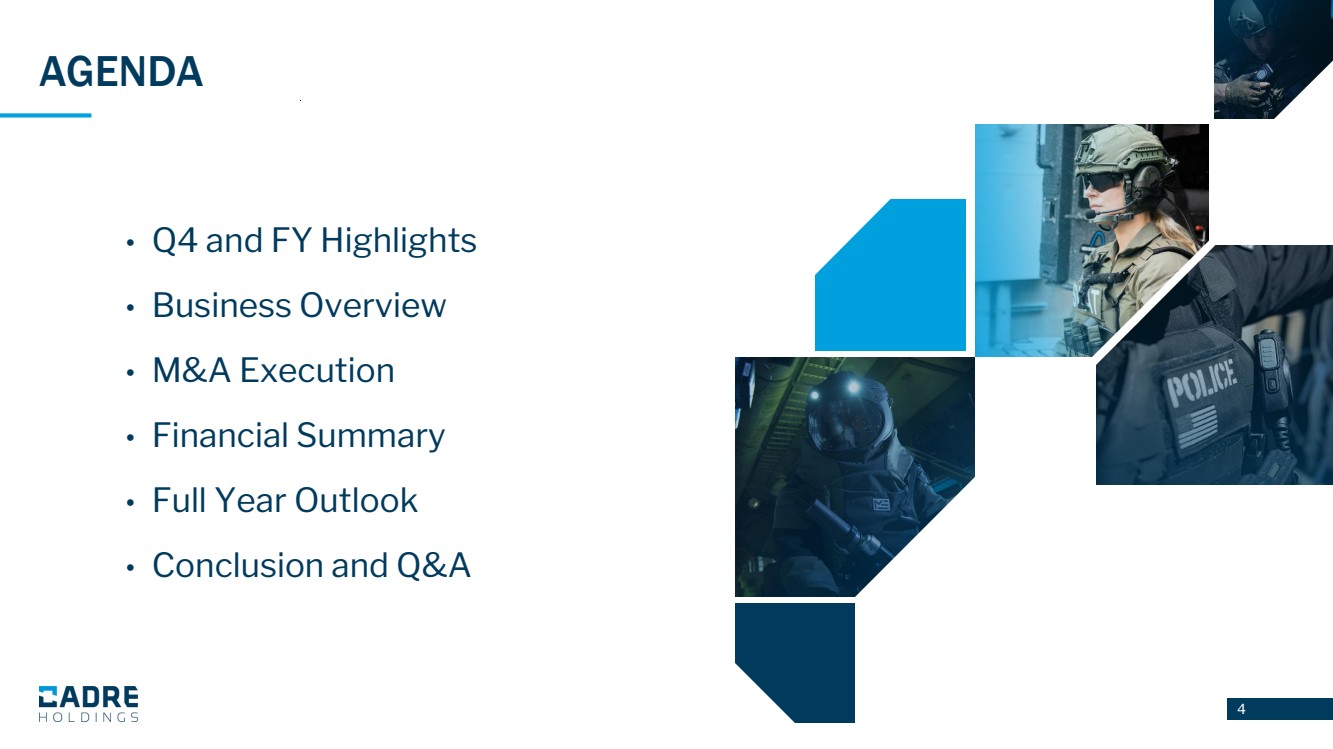
| 4 AGENDA • Q4 and FY Highlights • Business Overview • M&A Execution • Financial Summary • Full Year Outlook • Conclusion and Q&A |
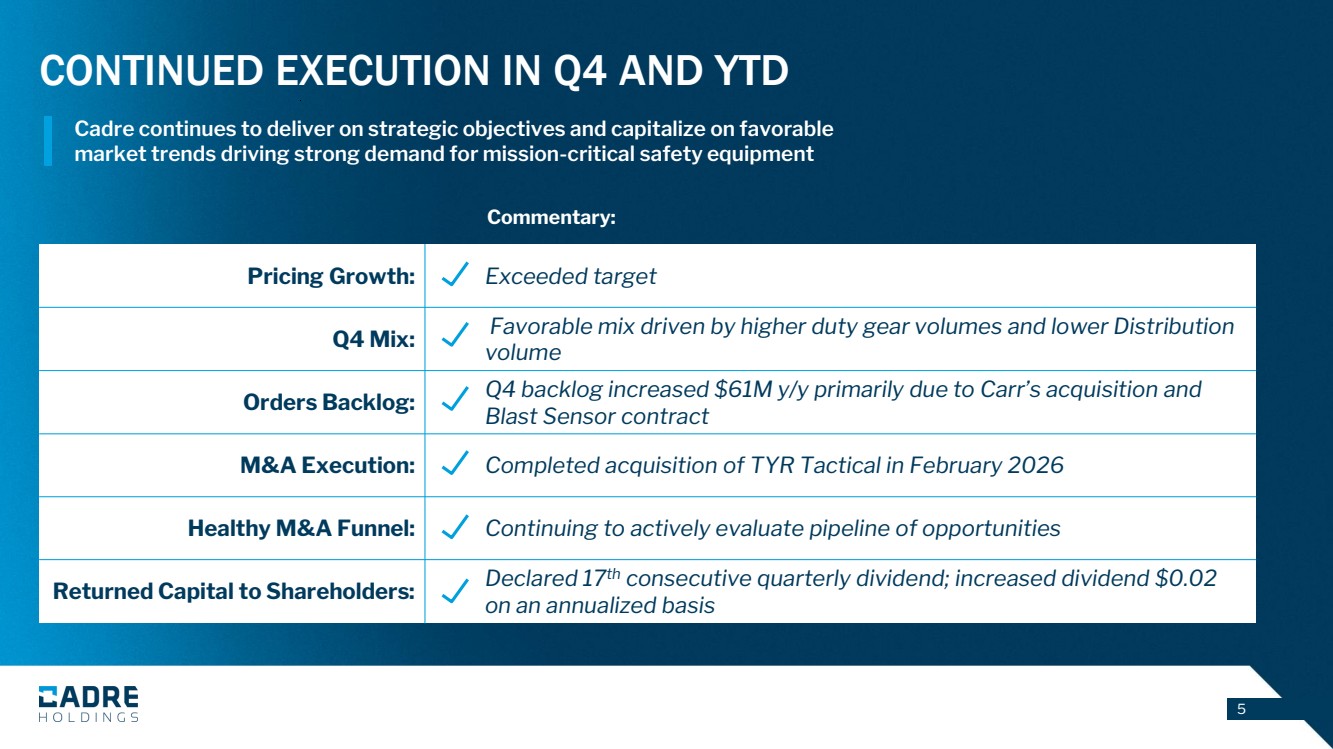
| 5 CONTINUED EXECUTION IN Q4 AND YTD Pricing Growth: Exceeded target Q4 Mix: Favorable mix driven by higher duty gear volumes and lower Distribution volume Orders Backlog: Q4 backlog increased $61M y/y primarily due to Carr’s acquisition and Blast Sensor contract M&A Execution: Completed acquisition of TYR Tactical in February 2026 Healthy M&A Funnel: Continuing to actively evaluate pipeline of opportunities Returned Capital to Shareholders: Declared 17th consecutive quarterly dividend; increased dividend $0.02 on an annualized basis Commentary: Cadre continues to deliver on strategic objectives and capitalize on favorable market trends driving strong demand for mission-critical safety equipment |
| 6 LONG-TERM INDUSTRY TAILWINDS SUPPORTING SUSTAINABLE GROWTH OPPORTUNITY Commercial nuclear energy renaissance Ongoing and expanding national defense initiatives Environmental management to address nuclear clean up Catalysts drive steady, recurring demand Resilient and growing spend worldwide Rising safety threats globally Public Safety Tailwinds Nuclear Safety Tailwinds |

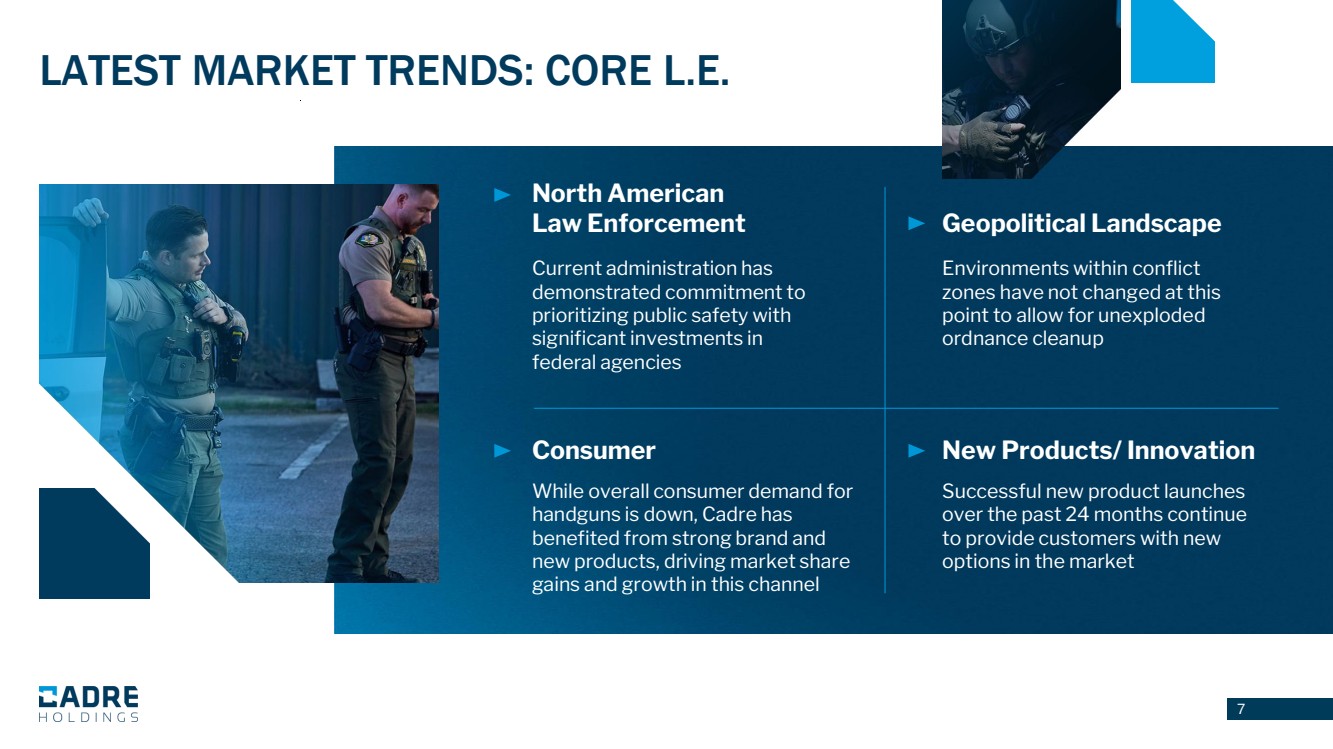
| 7 LATEST MARKET TRENDS: CORE L.E. Current administration has demonstrated commitment to prioritizing public safety with significant investments in federal agencies Environments within conflict zones have not changed at this point to allow for unexploded ordnance cleanup While overall consumer demand for handguns is down, Cadre has benefited from strong brand and new products, driving market share gains and growth in this channel Successful new product launches over the past 24 months continue to provide customers with new options in the market North American Law Enforcement Geopolitical Landscape Consumer New Products/ Innovation |
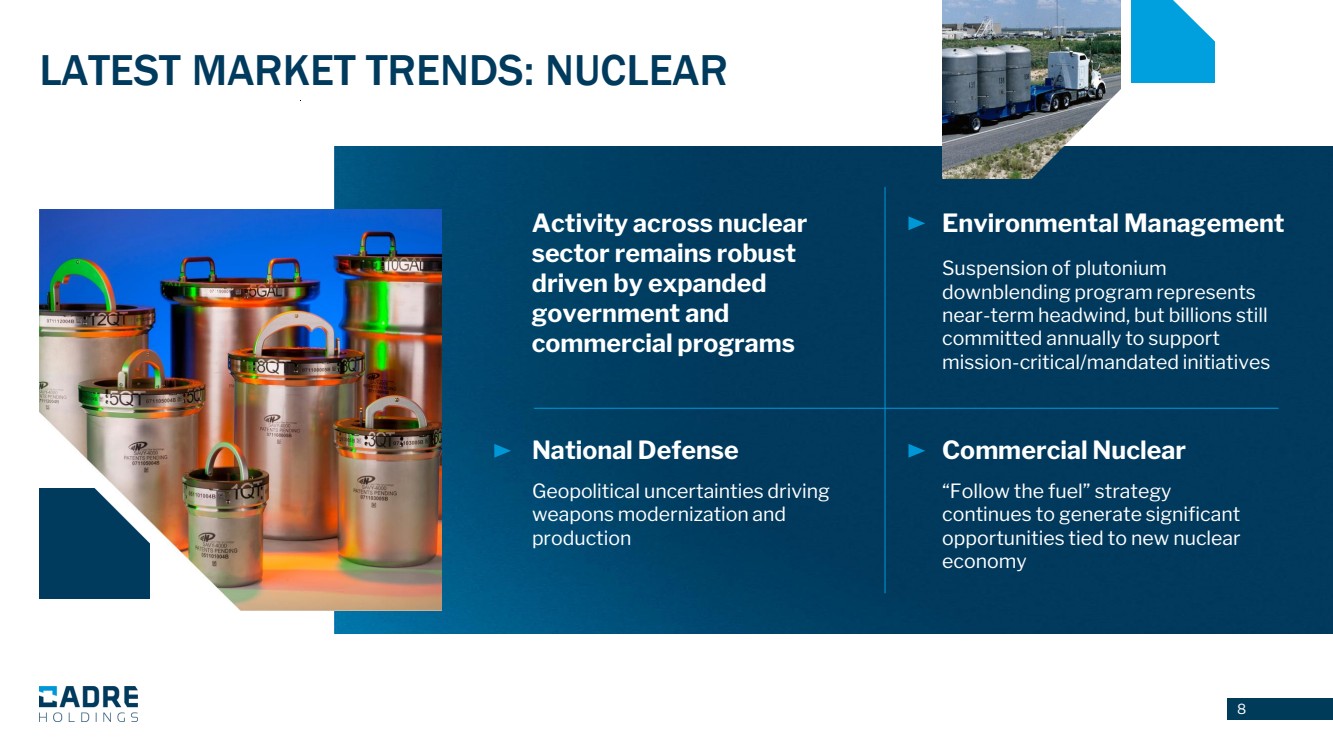
| 8 LATEST MARKET TRENDS: NUCLEAR Suspension of plutonium downblending program represents near-term headwind, but billions still committed annually to support mission-critical/mandated initiatives Geopolitical uncertainties driving weapons modernization and production “Follow the fuel” strategy continues to generate significant opportunities tied to new nuclear economy Activity across nuclear sector remains robust driven by expanded government and commercial programs Environmental Management National Defense Commercial Nuclear |
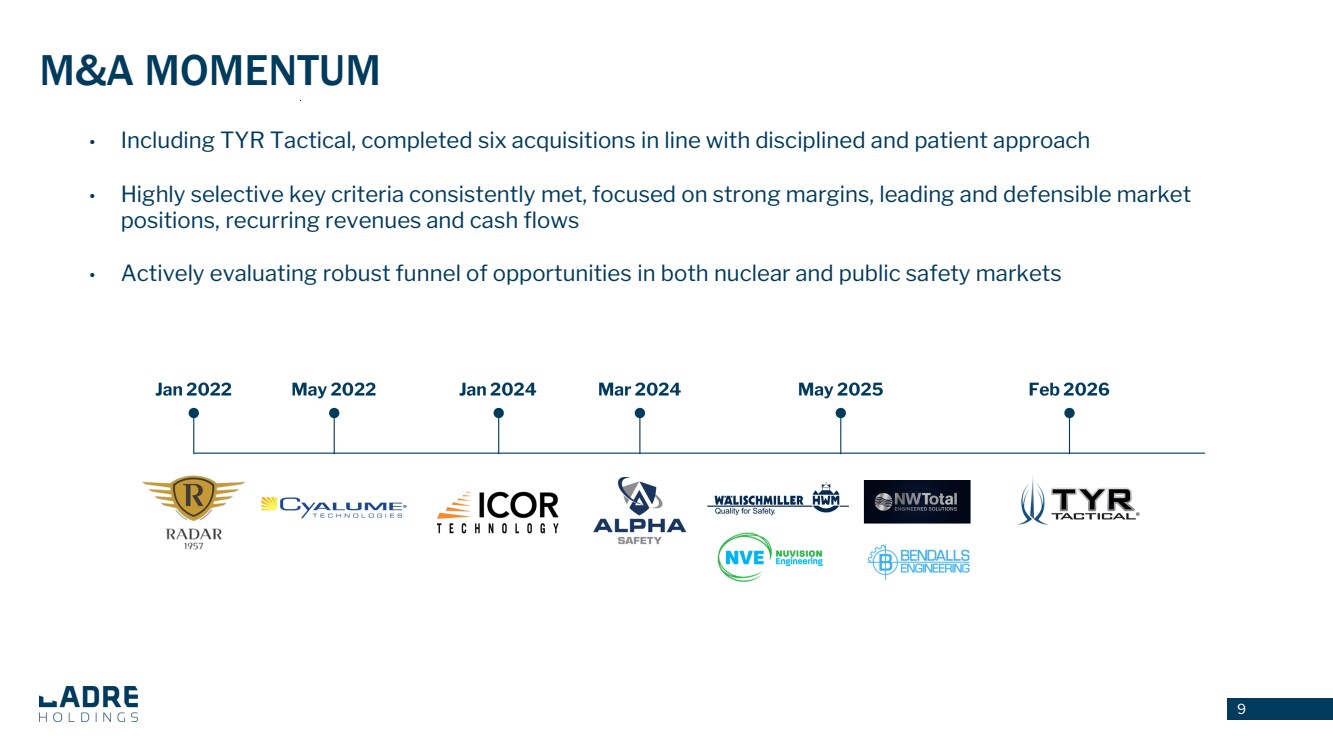
| 9 • Including TYR Tactical, completed six acquisitions in line with disciplined and patient approach • Highly selective key criteria consistently met, focused on strong margins, leading and defensible market positions, recurring revenues and cash flows • Actively evaluating robust funnel of opportunities in both nuclear and public safety markets M&A MOMENTUM |
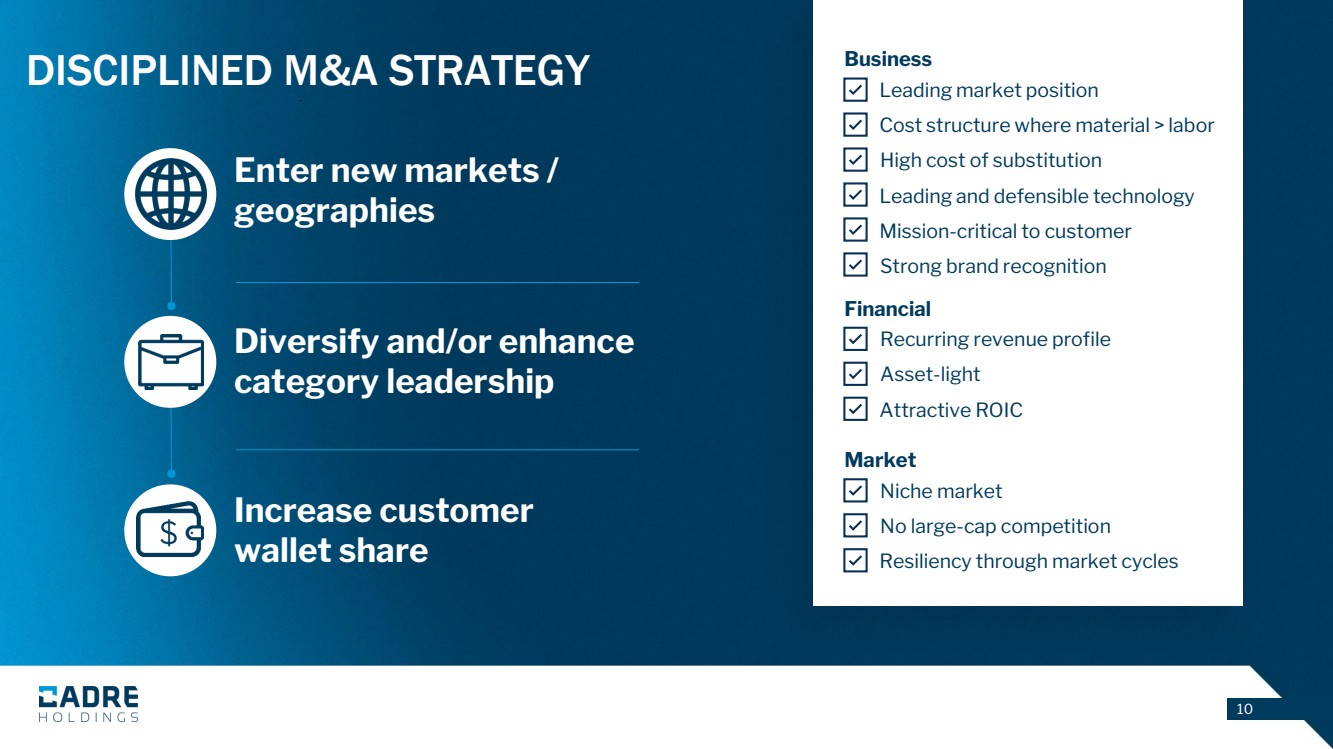
| 10 DISCIPLINED M&A STRATEGY Business Financial Market Leading market position Cost structure where material > labor High cost of substitution Leading and defensible technology Mission-critical to customer Strong brand recognition Recurring revenue profile Asset-light Attractive ROIC Niche market No large-cap competition Resiliency through market cycles Enter new markets / geographies Diversify and/or enhance category leadership Increase customer wallet share |
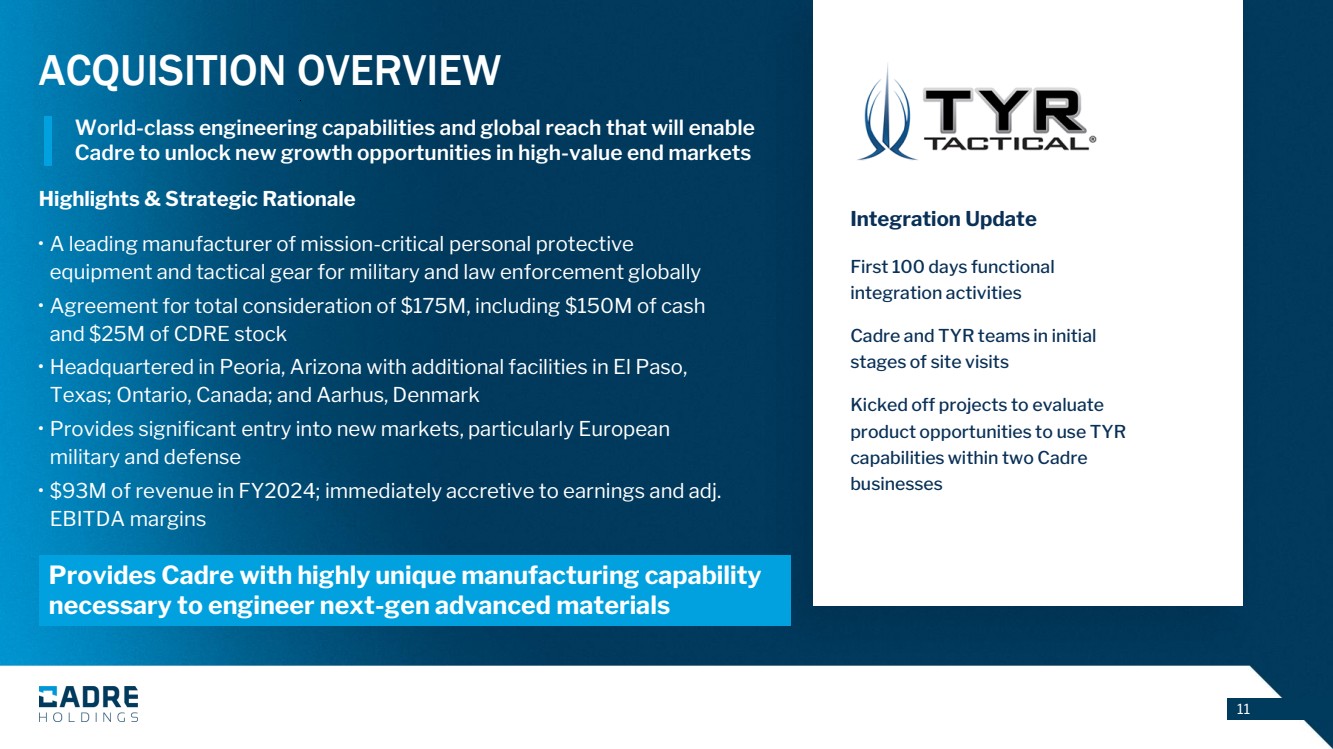
| 11 ACQUISITION OVERVIEW World-class engineering capabilities and global reach that will enable Cadre to unlock new growth opportunities in high-value end markets Highlights & Strategic Rationale • A leading manufacturer of mission-critical personal protective equipment and tactical gear for military and law enforcement globally • Agreement for total consideration of $175M, including $150M of cash and $25M of CDRE stock • Headquartered in Peoria, Arizona with additional facilities in El Paso, Texas; Ontario, Canada; and Aarhus, Denmark • Provides significant entry into new markets, particularly European military and defense • $93M of revenue in FY2024; immediately accretive to earnings and adj. EBITDA margins First 100 days functional integration activities Cadre and TYR teams in initial stages of site visits Kicked off projects to evaluate product opportunities to use TYR capabilities within two Cadre businesses Integration Update Provides Cadre with highly unique manufacturing capability necessary to engineer next-gen advanced materials |
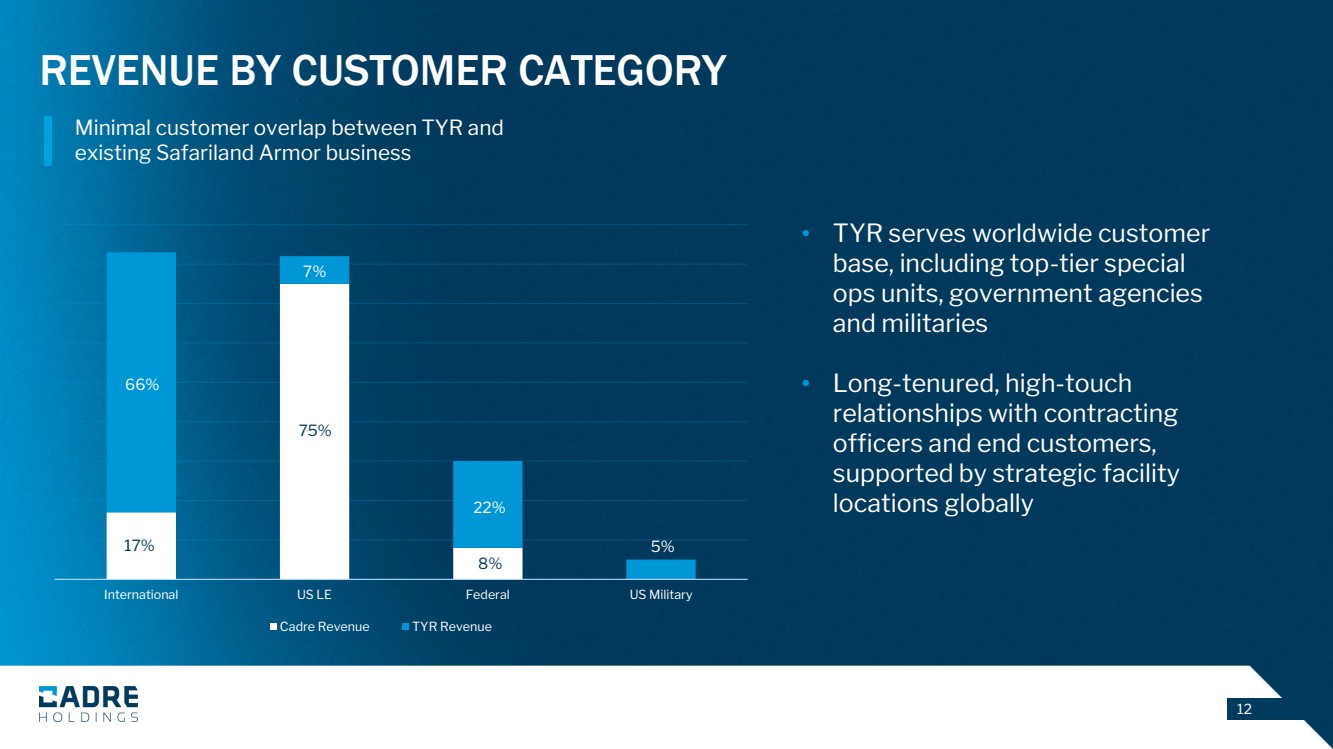
| 12 REVENUE BY CUSTOMER CATEGORY • TYR serves worldwide customer base, including top-tier special ops units, government agencies and militaries • Long-tenured, high-touch relationships with contracting officers and end customers, supported by strategic facility locations globally International US LE Federal US Military Cadre Revenue TYR Revenue 17% 66% 75% 7% 8% 22% 5% Minimal customer overlap between TYR and existing Safariland Armor business |
| 13 Q4 FINANCIAL RESULTS |

| 14 • Increased FY net sales, net income and adj. EBITDA y/y • Generated record FY adj. EBITDA for 3rd consecutive year • FY gross margin improved 140 basis points y/y FOURTH QUARTER AND FULL YEAR 2025 HIGHLIGHTS Q4 2025 Q4 2024 FY 2025 FY 2024 NET SALES $167.2M $176.0M $610.3M $567.6M GROSS MARGIN 43.4% 43.9% 42.5% 41.1% NET INCOME $11.7M / $0.27 per diluted share $13.0M / $0.32 per diluted share $44.1M / $1.02 per diluted share $36.1M / $0.90 per diluted share ADJUSTED EBITDA 1 $34.4M $38.5M $111.7M $104.8M ADJUSTED EBITDA MARGIN 1 20.6% 21.9% 18.3% 18.5% 1A non-GAAP financial measure. See slide 24 for definitions and reconciliations to the nearest GAAP measures. |
| 15 2023 2024 2025 2026 $482.5 $85.8 2023 2024 2025 2026 $610.3 $567.6 NET SALES AND ADJUSTED EBITDA NET SALES ($MM) ADJ. EBITDA1 ($MM) FY 2026 Guidance Range $736M to $758M FY 2026 Guidance Range $136M to $141M % CAGR 15.7% % Y/Y GROWTH 22.4% at guidance midpoint % CAGR 17.3% % Y/Y GROWTH 24.0% at guidance midpoint $104.8 $111.7 1A non-GAAP financial measure. See slide 24 for definitions and reconciliations to the nearest GAAP measures. |
| 16 Q4 2025 CAPITAL STRUCTURE December 31, 2025 (in thousands) Cash and cash equivalents $ 122,898 Debt: Revolver $ — Current portion of long-term debt 16,266 Long-term debt 292,829 Capitalized discount/issuance costs (1,842) Total debt, net $ 307,253 Net debt (Total debt net of cash) $ 184,355 Total debt / Adj. EBITDA(1) 2.8x Net debt / Adj. EBITDA(1) 1.7x LTM Adj. EBITDA(1) $ 111,708 1A non-GAAP financial measure. See slide 24 for definitions and reconciliations to the nearest GAAP measures. |
| 17 FY 2026 GUIDANCE NET SALES $736M to $758M ADJ. EBITDA1 $136M to $141M CAPITAL EXPENDITURES $10M to $14M 2026 MANAGEMENT OUTLOOK Attractive end markets and consistent execution driving growth 1A non-GAAP financial measure. See slide 24 for definitions and reconciliations to the nearest GAAP measures. Organic growth assumptions: • Public safety: 3-5% • Nuclear: 3-5% • Unfavorable mix in Alpha Safety driven by US gov re-prioritization of funding • 1% price net of material inflation |
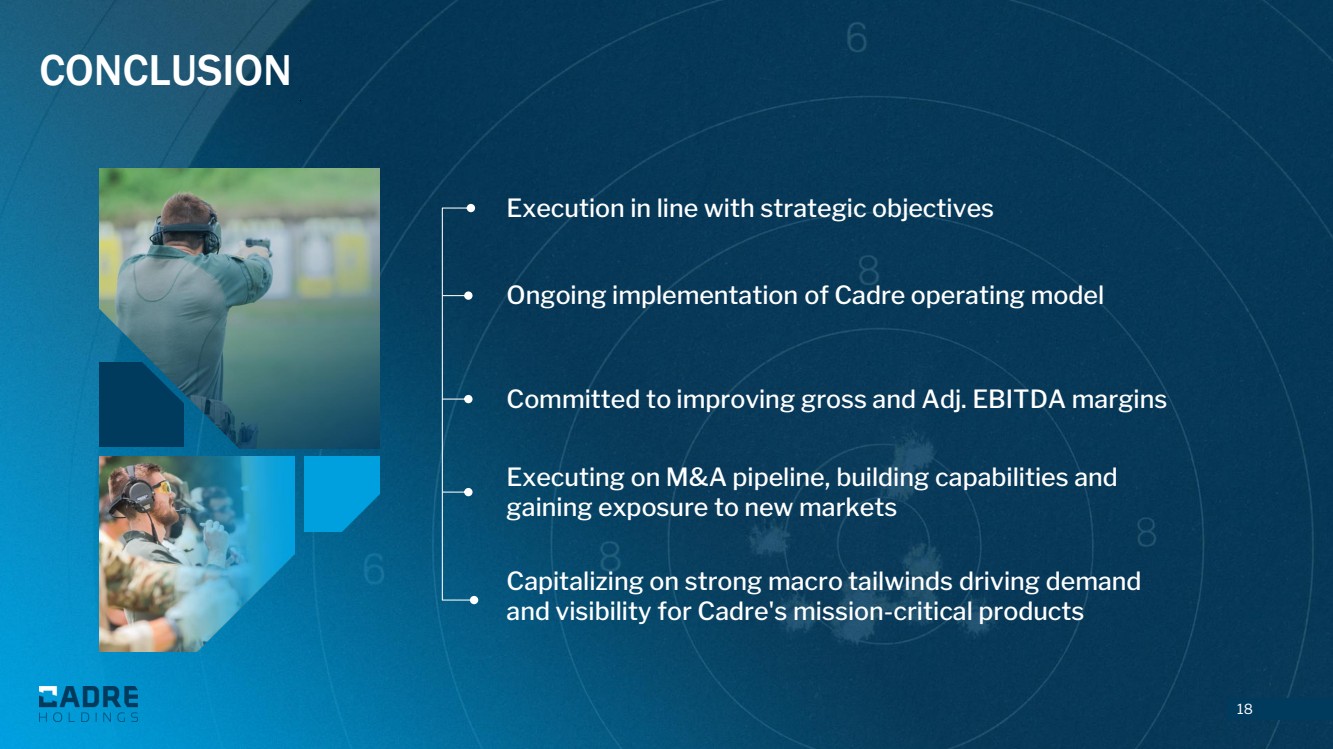
| 18 CONCLUSION Execution in line with strategic objectives Ongoing implementation of Cadre operating model Committed to improving gross and Adj. EBITDA margins Capitalizing on strong macro tailwinds driving demand and visibility for Cadre's mission-critical products Executing on M&A pipeline, building capabilities and gaining exposure to new markets |
| 19 APPENDIX |
| 20 BALANCE SHEET UNAUDITED (IN THOUSANDS, EXCEPT SHARE AND PER SHARE AMOUNTS) December 31, 2025 December 31, 2024 Assets Current assets Cash and cash equivalents $ 122,898 $ 124,933 Restricted cash 2,429 — Accounts receivable, net 110,607 93,523 Inventories 100,263 82,351 Prepaid expenses 14,574 19,027 Other current assets 15,095 7,737 Total current assets 365,866 327,571 Property and equipment, net 78,822 45,243 Operating lease assets 19,778 15,454 Deferred tax assets, net 4,816 4,552 Intangible assets, net 114,984 107,544 Goodwill 181,406 148,157 Other assets 4,359 4,192 Total assets $ 770,031 $ 652,713 Liabilities, Mezzanine Equity and Shareholders' Equity Current liabilities Accounts payable $ 22,325 $ 29,644 Accrued liabilities 61,066 46,413 Income tax payable 4,838 6,693 Current portion of long-term debt 16,266 11,375 Total current liabilities 104,495 94,125 Long-term debt 290,987 211,830 Long-term operating lease liabilities 15,039 10,733 Deferred tax liabilities 30,058 18,758 Other liabilities 11,648 5,752 Total liabilities 452,227 341,198 Mezzanine equity Preferred stock ($0.0001 par value, 10,000,000 shares authorized, no shares issued and outstanding as of December 31, 2025 and December 31, 2024) — — Shareholders' equity Common stock ($0.0001 par value, 190,000,000 shares authorized, 42,160,656 and 40,607,988 shares issued and outstanding as of December 31, 2025 and December 31, 2024, respectively) 4 4 Additional paid-in capital 282,570 306,821 Accumulated other comprehensive income (loss) 460 (1,389) Accumulated earnings 34,770 6,079 Total shareholders’ equity 317,804 311,515 Total liabilities, mezzanine equity and shareholders' equity $ 770,031 $ 652,713 |
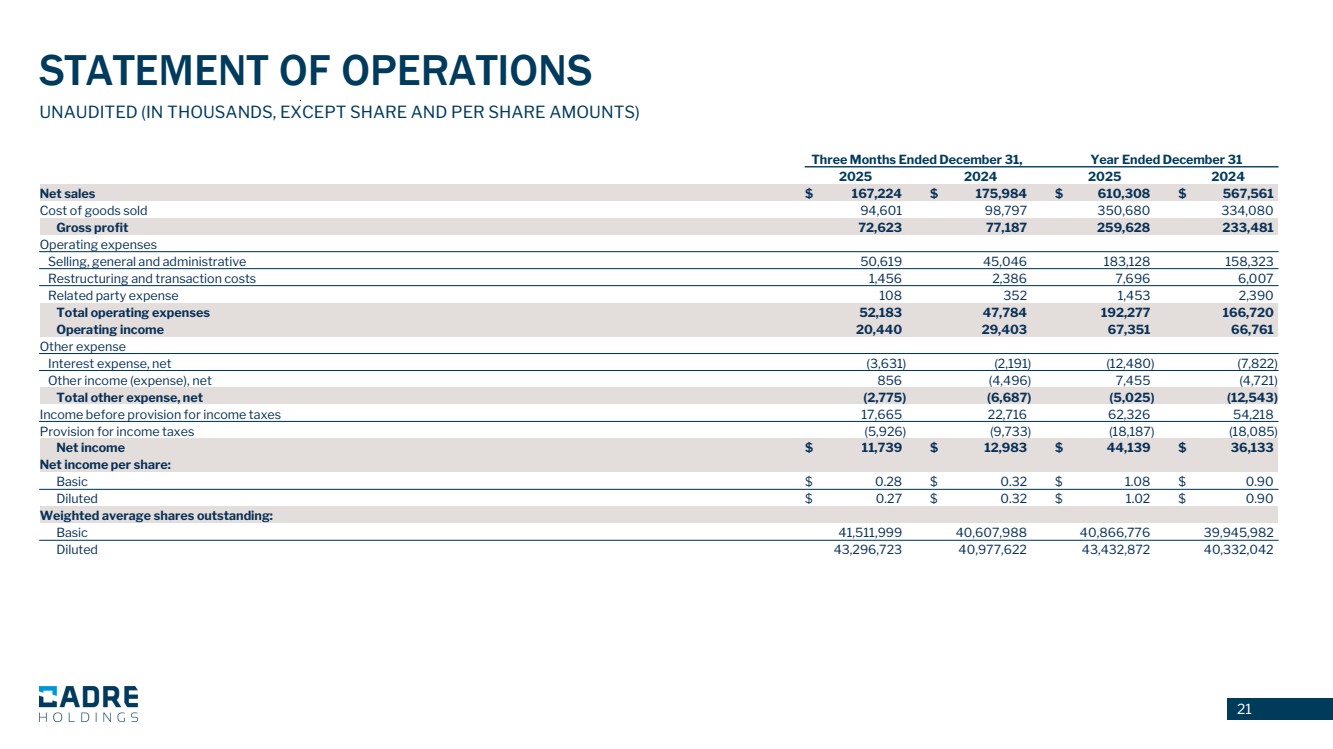
| 21 UNAUDITED (IN THOUSANDS, EXCEPT SHARE AND PER SHARE AMOUNTS) Three Months Ended December 31, Year Ended December 31 2025 2024 2025 2024 Net sales $ 167,224 $ 175,984 $ 610,308 $ 567,561 Cost of goods sold 94,601 98,797 350,680 334,080 Gross profit 72,623 77,187 259,628 233,481 Operating expenses Selling, general and administrative 50,619 45,046 183,128 158,323 Restructuring and transaction costs 1,456 2,386 7,696 6,007 Related party expense 108 352 1,453 2,390 Total operating expenses 52,183 47,784 192,277 166,720 Operating income 20,440 29,403 67,351 66,761 Other expense Interest expense, net (3,631) (2,191) (12,480) (7,822) Other income (expense), net 856 (4,496) 7,455 (4,721) Total other expense, net (2,775) (6,687) (5,025) (12,543) Income before provision for income taxes 17,665 22,716 62,326 54,218 Provision for income taxes (5,926) (9,733) (18,187) (18,085) Net income $ 11,739 $ 12,983 $ 44,139 $ 36,133 Net income per share: Basic $ 0.28 $ 0.32 $ 1.08 $ 0.90 Diluted $ 0.27 $ 0.32 $ 1.02 $ 0.90 Weighted average shares outstanding: Basic 41,511,999 40,607,988 40,866,776 39,945,982 Diluted 43,296,723 40,977,622 43,432,872 40,332,042 STATEMENT OF OPERATIONS |
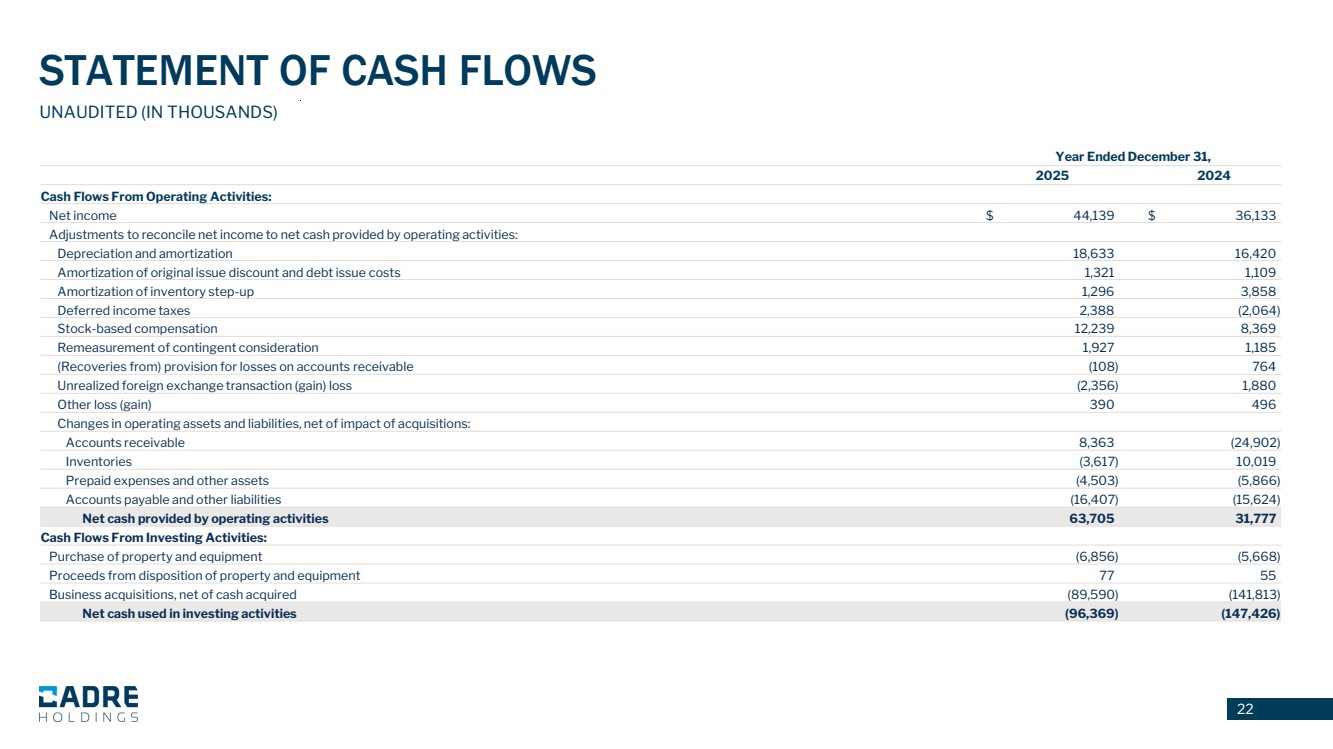
| 22 UNAUDITED (IN THOUSANDS) Year Ended December 31, 2025 2024 Cash Flows From Operating Activities: Net income $ 44,139 $ 36,133 Adjustments to reconcile net income to net cash provided by operating activities: Depreciation and amortization 18,633 16,420 Amortization of original issue discount and debt issue costs 1,321 1,109 Amortization of inventory step-up 1,296 3,858 Deferred income taxes 2,388 (2,064) Stock-based compensation 12,239 8,369 Remeasurement of contingent consideration 1,927 1,185 (Recoveries from) provision for losses on accounts receivable (108) 764 Unrealized foreign exchange transaction (gain) loss (2,356) 1,880 Other loss (gain) 390 496 Changes in operating assets and liabilities, net of impact of acquisitions: Accounts receivable 8,363 (24,902) Inventories (3,617) 10,019 Prepaid expenses and other assets (4,503) (5,866) Accounts payable and other liabilities (16,407) (15,624) Net cash provided by operating activities 63,705 31,777 Cash Flows From Investing Activities: Purchase of property and equipment (6,856) (5,668) Proceeds from disposition of property and equipment 77 55 Business acquisitions, net of cash acquired (89,590) (141,813) Net cash used in investing activities (96,369) (147,426) STATEMENT OF CASH FLOWS |
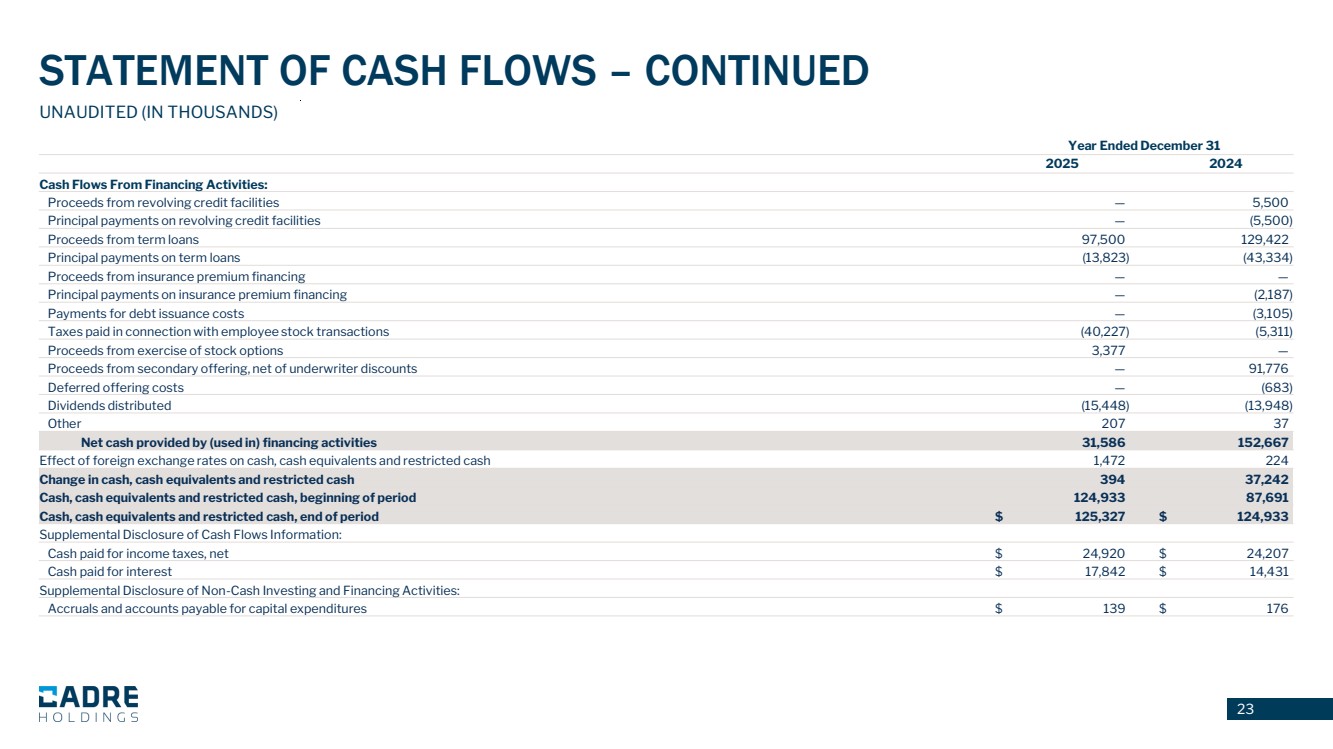
| 23 UNAUDITED (IN THOUSANDS) Year Ended December 31 2025 2024 Cash Flows From Financing Activities: Proceeds from revolving credit facilities — 5,500 Principal payments on revolving credit facilities — (5,500) Proceeds from term loans 97,500 129,422 Principal payments on term loans (13,823) (43,334) Proceeds from insurance premium financing — — Principal payments on insurance premium financing — (2,187) Payments for debt issuance costs — (3,105) Taxes paid in connection with employee stock transactions (40,227) (5,311) Proceeds from exercise of stock options 3,377 — Proceeds from secondary offering, net of underwriter discounts — 91,776 Deferred offering costs — (683) Dividends distributed (15,448) (13,948) Other 207 37 Net cash provided by (used in) financing activities 31,586 152,667 Effect of foreign exchange rates on cash, cash equivalents and restricted cash 1,472 224 Change in cash, cash equivalents and restricted cash 394 37,242 Cash, cash equivalents and restricted cash, beginning of period 124,933 87,691 Cash, cash equivalents and restricted cash, end of period $ 125,327 $ 124,933 Supplemental Disclosure of Cash Flows Information: Cash paid for income taxes, net $ 24,920 $ 24,207 Cash paid for interest $ 17,842 $ 14,431 Supplemental Disclosure of Non-Cash Investing and Financing Activities: Accruals and accounts payable for capital expenditures $ 139 $ 176 STATEMENT OF CASH FLOWS – CONTINUED |
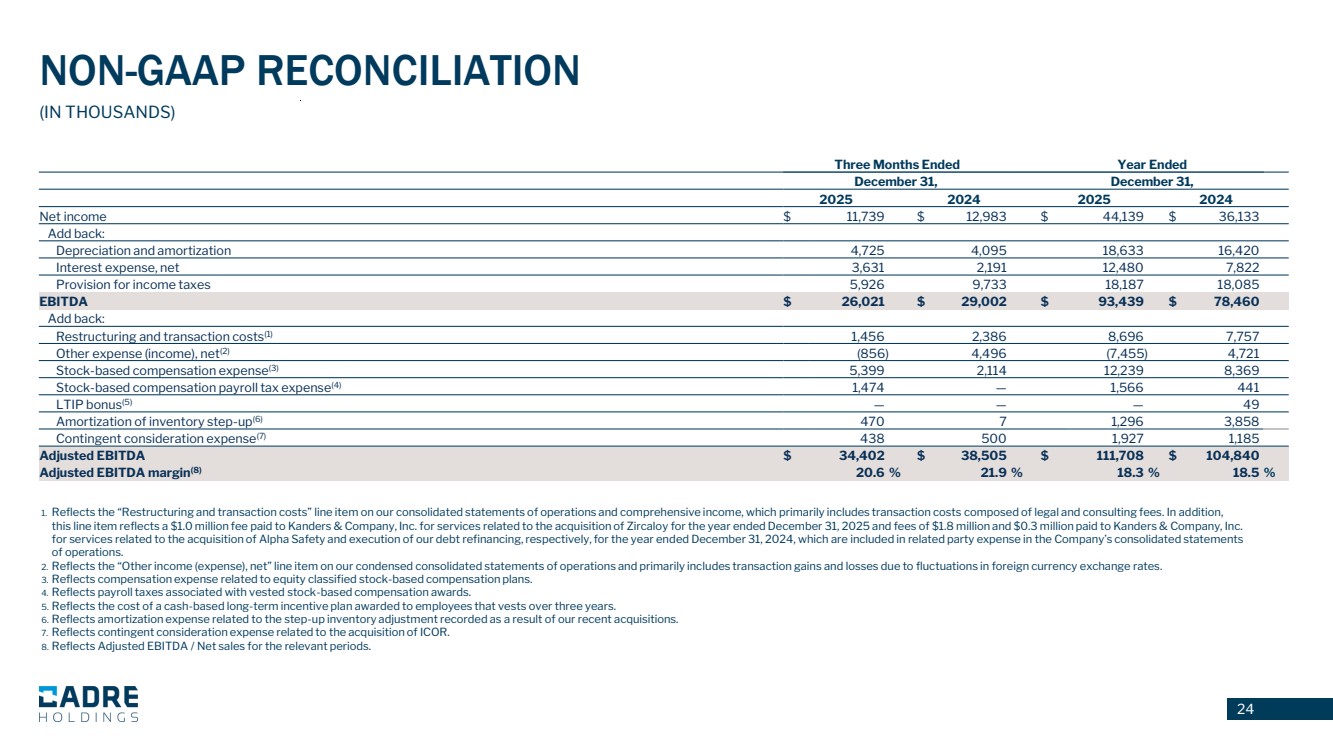
| 24 1. Reflects the “Restructuring and transaction costs” line item on our consolidated statements of operations and comprehensive income, which primarily includes transaction costs composed of legal and consulting fees. In addition, this line item reflects a $1.0 million fee paid to Kanders & Company, Inc. for services related to the acquisition of Zircaloy for the year ended December 31, 2025 and fees of $1.8 million and $0.3 million paid to Kanders & Company, Inc. for services related to the acquisition of Alpha Safety and execution of our debt refinancing, respectively, for the year ended December 31, 2024, which are included in related party expense in the Company’s consolidated statements of operations. 2. Reflects the “Other income (expense), net” line item on our condensed consolidated statements of operations and primarily includes transaction gains and losses due to fluctuations in foreign currency exchange rates. 3. Reflects compensation expense related to equity classified stock-based compensation plans. 4. Reflects payroll taxes associated with vested stock-based compensation awards. 5. Reflects the cost of a cash-based long-term incentive plan awarded to employees that vests over three years. 6. Reflects amortization expense related to the step-up inventory adjustment recorded as a result of our recent acquisitions. 7. Reflects contingent consideration expense related to the acquisition of ICOR. 8. Reflects Adjusted EBITDA / Net sales for the relevant periods. 24 (IN THOUSANDS) NON-GAAP RECONCILIATION Three Months Ended Year Ended December 31, December 31, 2025 2024 2025 2024 Net income $ 11,739 $ 12,983 $ 44,139 $ 36,133 Add back: Depreciation and amortization 4,725 4,095 18,633 16,420 Interest expense, net 3,631 2,191 12,480 7,822 Provision for income taxes 5,926 9,733 18,187 18,085 EBITDA $ 26,021 $ 29,002 $ 93,439 $ 78,460 Add back: Restructuring and transaction costs(1) 1,456 2,386 8,696 7,757 Other expense (income), net(2) (856) 4,496 (7,455) 4,721 Stock-based compensation expense(3) 5,399 2,114 12,239 8,369 Stock-based compensation payroll tax expense(4) 1,474 — 1,566 441 LTIP bonus(5) — — — 49 Amortization of inventory step-up(6) 470 7 1,296 3,858 Contingent consideration expense(7) 438 500 1,927 1,185 Adjusted EBITDA $ 34,402 $ 38,505 $ 111,708 $ 104,840 Adjusted EBITDA margin(8) 20.6 % 21.9 % 18.3 % 18.5 % |
| 25 The Company reports its financial results in accordance with U.S. generally accepted accounting principles (“GAAP”). The press release contains the non-GAAP measures: (i) earnings before interest, taxes, other income or expense, depreciation and amortization (“EBITDA”), (ii) Adjusted EBITDA and (iii) Adjusted EBITDA margin. The Company believes the presentation of these non-GAAP measures provides useful information for the understanding of its ongoing operations and enables investors to focus on period- over-period operating performance, and thereby enhances the user’s overall understanding of the Company’s current financial performance relative to past performance and provides, along with the nearest GAAP measures, a baseline for modeling future earnings expectations. Non-GAAP measures are reconciled to comparable GAAP financial measures within this press release. We do not provide a reconciliation of the non-GAAP guidance measure Adjusted EBITDA for the fiscal year 2026 to net income for the fiscal year 2026, the most comparable GAAP financial measure, due to the inherent difficulty of forecasting certain types of expenses and gains, without unreasonable effort, which affect net income but not Adjusted EBITDA. The Company cautions that non-GAAP measures should be considered in addition to, but not as a substitute for, the Company’s reported GAAP results. Additionally, the Company notes that there can be no assurance that the above referenced non-GAAP financial measures are comparable to similarly titled financial measures used by other publicly traded companies. USE OF NON-GAAP MEASURES |