Exhibit 99.1
Cadre Holdings Reports Third Quarter 2021 Financial
Results
Expanded Gross Profit Margin and Adjusted EBITDA
Margin
Completed
Initial Public Offering, Raising Gross Proceeds of $89.7 million; Announced Quarterly Cash Dividend
JACKSONVILLE,
Fla., December 2, 2021 – Cadre Holdings, Inc. (NYSE: CDRE) ("Cadre" or "the Company"), a global leader
in the manufacturing and distribution of safety and survivability equipment for first responders, announced today its consolidated operating
results for the three and nine months ended
September 30, 2021.
Third Quarter and Nine Month 2021 Highlights
| · | Net sales of $98.7 million for the third quarter; net sales of $323.8 million for the nine months ended September 30, 2021 |
| · | Gross profit margin of 39.8% for the third quarter; gross profit margin of 40.6% for the nine months ended September 30, 2021 |
| · | Net loss of $5.3 million, or $0.19 per share, for the third quarter; net income of $8.4 million, or $0.30 per share, for the nine
months ended September 30, 2021. Both periods reflect a $15.2 million loss on the extinguishment of debt incurred from the execution of
a new credit agreement |
| · | Adjusted EBITDA of $15.4 million for the third quarter; Adjusted EBITDA of $56.1 million for the nine months ended September 30, 2021 |
| · | Cadre generated LTM Adjusted EBITDA of $71.6 million for the period ended September 30, 2021 |
| · | Adjusted EBITDA margin of 15.6% for the third quarter; Adjusted EBITDA margin of 17.3% for the nine months ended September 30, 2021 |
| · | Declared quarterly cash dividend of $0.08 per share in November 2021 |
“Our third quarter and year to date 2021 financial results highlight
Cadre’s ongoing success capitalizing on our leading positions in large and growing markets with recurring demand characteristics,
as well our ability to generate strong operating cash flow,” said Warren Kanders, CEO and Chairman. “We continue to build
on Cadre’s impressive track record of margin expansion and have improved gross profit and Adjusted EBITDA margins in the year to
date period by 250 and 300 basis points, respectively.”
Mr. Kanders continued, “With the recent completion of our successful
IPO, we have achieved an important milestone in our company’s storied history that dates back over 55 years. We believe that we
are in a strong position to take advantage of the attractive tailwinds driving demand for Cadre’s mission critical first responder
products, as we focus on seeking to accelerate growth organically, as well as through our robust acquisition pipeline. As part of our
disciplined capital allocation approach, we are also pleased to have implemented a regular quarterly dividend policy.”
Third Quarter and Nine Month 2021 Operating Results
For the quarter ended September 30, 2021, Cadre generated net sales
of $98.7 million, as compared to $105.7 million for the quarter ended September 30, 2020.
For the nine months ended September 30, 2021, Cadre generated net sales
of $323.8 million, as compared to $297.0 million for the nine months ended September 30, 2020.
For the quarter ended September 30, 2021, Cadre generated gross profit
of $39.3 million, as compared to $40.0 million for the prior year period. For the nine months ended September 30, 2021, Cadre generated
gross profit of $131.5 million, as compared to $113.2 million for the prior year period.
Gross profit margin was 39.8% for the quarter ended September 30, 2021,
as compared to 37.8% for the prior year period, mainly driven by favorable pricing and product mix.
Gross profit margin was 40.6% for the nine months ended September 30,
2021, as compared to 38.1% for the prior year period, mainly driven by favorable pricing and product mix.
Net
loss was $5.3 million for the quarter ended September 30, 2021, as compared to net income of $6.4 million for the three months ended September
30, 2020, primarily as a result of a loss on extinguishment of debt of $15.2 million in connection with the execution of a new
credit agreement during the quarter ended September 30, 2021.
Net
income was $8.4 million for the nine months ended September 30, 2021, as compared to $22.7 million for the nine months ended September
30, 2020, primarily as a result of a loss on extinguishment of debt, an increase in provision for income taxes due to the release
of a valuation allowance on a portion of the Company’s deferred tax assets in December 2020 and non-recurring transactions recognized
in the period ended September 30, 2020, offset by improvements in gross profit due to increased sales, favorable pricing and product mix.
Cadre generated $15.4 million of Adjusted EBITDA for the quarter ended
September 30, 2021, as compared to $15.0 million for the quarter ended September 30, 2020. Adjusted EBITDA margin was 15.6% for the quarter
ended September 30, 2021, as compared to 14.2% for the prior year period,
Cadre
generated $56.1 million of Adjusted EBITDA for the nine months ended September 30, 2021, as compared to $42.5 million for the prior year
period. Adjusted EBITDA margin was 17.3% for the nine months ended September 30, 2021, as compared to 14.3% for the prior year
period.
Product segment gross margin was 40.5% for the third quarter and 41.6%
for the nine months ended September 30, 2021.
Distribution segment gross margin was 24.6% for the third quarter and
25.2% for the nine months ended September 30, 2021.
Liquidity, Cash Flows and Capital Allocation
Cadre’s cash and cash equivalents increased by $12.4 million
from $2.9 million as of December 31, 2020, to $15.3 million as of September 30, 2021. Capital expenditures totaled $0.7 million for the
third quarter and $2.2 million for the nine months ended September 30, 2021, compared with $1.3 million for the third quarter and $3.9
million for the nine months ended September 30, 2020. Net debt increased by $13.1 million from $212.8 million as of December 31, 2020,
to $225.9 million as of September 30, 2021.
During the quarter, the Company refinanced its existing credit facilities
and closed on a new credit agreement that included a term loan, under which Cadre borrowed $200 million, and may borrow up to $100 million
under a revolving credit facility. Both loans mature on July 23, 2026.
On November 3, 2021, the Company completed the closing of its initial
public offering (“IPO”) of 6.9 million shares, including the full exercise of the underwriters’ option, at a price to
the public of $13.00 per share, for net proceeds of approximately $78.3 million.
On November 9, 2021, the Company utilized proceeds received in connection
with the IPO and repaid $38.9 million and $20.5 million, respectively, of borrowings outstanding under its current term loan and revolving
credit facility.
Dividend
On November 11, 2021, the Company announced that its Board of Directors
approved the initiation of a quarterly cash dividend policy of $0.08 per share of the Company’s common stock or $0.32 per share
on an annualized basis. Cadre's first dividend payment will be made on December 7, 2021, to shareholders of record as of the close of
business on November 22, 2021. The declaration of any future dividend is subject to the discretion of the Company’s Board of Directors.
Conference Call
Cadre management will host a conference call on Thursday, December
2, 2021, at 5:00 PM EST to discuss the latest corporate developments and financial results. The dial-in number for callers in the US
is (844)-200-6205 and the dial-in number for international callers is (929)-526-1599. The access code for all callers is 996677. A live
webcast will also be available on the Company’s website at https://www.cadre-holdings.com/.
A replay of the call will be available through December 16, 2021. To
access the replay, please dial 866 813 9403 in the U.S. or +44 204 525 0658 if outside the U.S., and then enter the access code 515899.
About Cadre
Headquartered in Jacksonville, Florida, Cadre is a global leader in
the manufacturing and distribution of safety and survivability products for first responders. Cadre’s equipment provides critical
protection to allow users to safely and securely perform their duties and protect those around them in hazardous or life-threatening situations.
The Company’s core products include body armor, explosive ordnance disposal equipment, and duty gear. Our highly engineered products
are utilized by domestic and international first responders in state and local law enforcement, fire and rescue, explosive ordnance disposal,
emergency medical technicians, as well as numerous federal agencies and foreign government agencies in 104 countries. Our key brands include
Safariland® and Med-Eng®, amongst others.
Use of Non-GAAP Measures
The Company reports its financial results in accordance with U.S. generally
accepted accounting principles (“GAAP”). This press release contains the non-GAAP measures: (i) earnings before interest,
taxes, other income or expense, depreciation and amortization (“EBITDA”), (ii) adjusted EBITDA, (iii) adjusted EBITDA margin,
and (iv) LTM adjusted EBITDA . The Company believes that the presentation of certain non-GAAP measures, i.e.: (i) EBITDA, (ii) adjusted
EBITDA, (iii) adjusted EBITDA margin, and (iv) LTM adjusted EBITDA, provide useful information for the understanding of its ongoing operations
and enables investors to focus on period- over-period operating performance, and thereby enhances the user's overall understanding of
the Company's current financial performance relative to past performance and provides, along with the nearest GAAP measures, a baseline
for modeling future earnings expectations. Non-GAAP measures are reconciled to comparable GAAP financial measures within this press release.
The Company cautions that non-GAAP measures should be considered in addition to, but not as a substitute for, the Company's reported GAAP
results. Additionally, the Company notes that there can be no assurance that the above referenced non-GAAP financial measures are comparable
to similarly titled financial measures used by other publicly traded companies.
Forward-Looking Statements
Except for historical information, certain matters discussed in this
press release may be forward-looking statements within the meaning of the Private Securities Litigation Reform Act of 1995. Forward-looking
statements include but are not limited to all projections and anticipated levels of future performance. Forward-looking statements involve
risks, uncertainties and other factors that may cause our actual results to differ materially from those discussed herein. Any number
of factors could cause actual results to differ materially from projections or forward-looking statements, including without limitation
global economic conditions, spending patterns of government agencies, competitive pressures, the impact of acquisitions and related integration
activities, product liability claims, the success of new product introductions, currency exchange rate fluctuations and the risks of doing
business in in the markets in which we operate, including foreign countries. More information on potential factors that could affect the
Company's financial results are more fully described in our prospectus filed with the Securities and Exchange Commission pursuant to Rule
424(b) under the Securities Act of 1933, as amended, on November 5, 2021, and will be included from time to time in the Company's public
reports filed with the Securities and Exchange Commission, including the Company's Annual Report on Form 10-K, Quarterly Reports on Form
10-Q, and Current Reports on Form 8-K. All forward-looking statements included in this press release are based upon information available
to the Company as of the date of this press release, and speak only as of the date hereof. We assume no obligation to update any forward-looking
statements to reflect events or circumstances after the date of this press release.
Contact:
Gray
Hudkins
Cadre Holdings, Inc.
203-550-7148
[email protected]
Investor Relations:
The IGB Group
Leon Berman / Matt Berkowitz
212-477-8438 / 212-227-7098
[email protected] / [email protected]
Media Contact:
Jonathan Keehner / Andrew Siegel
Joele Frank, Wilkinson Brimmer Katcher
212-355-4449
CADRE HOLDINGS, INC.
CONSOLIDATED BALANCE SHEETS
(Unaudited)
(In thousands, except share and per share amounts)
| | |
September 30, 2021 | | |
December 31, 2020 | |
| Assets | |
| | | |
| | |
| Current assets | |
| | | |
| | |
| Cash and cash equivalents | |
$ | 15,275 | | |
$ | 2,873 | |
| Accounts receivable, net of allowance for doubtful accounts of $624 and $1,113, respectively | |
| 42,230 | | |
| 43,646 | |
| Inventories | |
| 71,067 | | |
| 60,923 | |
| Prepaid expenses | |
| 9,212 | | |
| 6,665 | |
| Other current assets | |
| 5,859 | | |
| 3,362 | |
| | |
| | | |
| | |
| Total current assets | |
| 143,643 | | |
| 117,469 | |
| | |
| | | |
| | |
| Property and equipment, net of accumulated depreciation and amortization of $37,510 and $33,643, respectively | |
| 33,780 | | |
| 35,437 | |
| Deferred tax assets, net | |
| 11,696 | | |
| 12,900 | |
| Intangible assets, net | |
| 44,459 | | |
| 51,009 | |
| Goodwill | |
| 66,227 | | |
| 66,314 | |
| Other assets | |
| 2,219 | | |
| 150 | |
| | |
| | | |
| | |
| Total assets | |
$ | 302,024 | | |
$ | 283,279 | |
| | |
| | | |
| | |
| Liabilities, Mezzanine Equity and Shareholders' Equity | |
| | | |
| | |
| Current liabilities | |
| | | |
| | |
| Accounts payable | |
$ | 21,890 | | |
$ | 21,978 | |
| Accrued liabilities | |
| 40,238 | | |
| 36,004 | |
| Income tax payable | |
| 2,505 | | |
| 1,005 | |
| Current portion of long-term debt | |
| 12,904 | | |
| 3,496 | |
| | |
| | | |
| | |
| Total current liabilities | |
| 77,537 | | |
| 62,483 | |
| | |
| | | |
| | |
| Long-term debt | |
| 212,946 | | |
| 209,310 | |
| Deferred tax liabilities | |
| 2,430 | | |
| 2,085 | |
| Other liabilities | |
| 1,774 | | |
| 550 | |
| | |
| | | |
| | |
| Total liabilities | |
| 294,687 | | |
| 274,428 | |
| | |
| | | |
| | |
| Mezzanine equity | |
| | | |
| | |
| Preferred stock ($0.0001 par value, 10,000,000 shares authorized, no shares issued and outstanding as of September 30, 2021 and December 31, 2020) | |
| — | | |
| — | |
| | |
| | | |
| | |
| Shareholders' equity | |
| | | |
| | |
| Common stock ($0.0001 par value, 190,000,000 shares authorized, 27,483,350 issued and outstanding as of September 30, 2021 and December 31, 2020) | |
| 3 | | |
| 3 | |
| Additional paid-in capital | |
| 48,670 | | |
| 48,670 | |
| Accumulated other comprehensive loss | |
| (2,747 | ) | |
| (2,860 | ) |
| Accumulated deficit | |
| (38,589 | ) | |
| (36,962 | ) |
| | |
| | | |
| | |
| Total shareholders’ equity | |
| 7,337 | | |
| 8,851 | |
| | |
| | | |
| | |
| Total liabilities, mezzanine equity and shareholders' equity | |
$ | 302,024 | | |
$ | 283,279 | |
CADRE HOLDINGS, INC.
CONSOLIDATED
STATEMENTS OF OPERATIONS
(Unaudited)
(In thousands, except share and per share amounts)
| | |
Three Months Ended | | |
Nine Months Ended | |
| | |
September 30, | | |
September 30, | |
| | |
2021 | | |
2020 | | |
2021 | | |
2020 | |
| Net sales | |
$ | 98,654 | | |
$ | 105,735 | | |
$ | 323,751 | | |
$ | 297,019 | |
| Cost of goods sold | |
| 59,346 | | |
| 65,739 | | |
| 192,256 | | |
| 183,869 | |
| Gross profit | |
| 39,308 | | |
| 39,996 | | |
| 131,495 | | |
| 113,150 | |
| | |
| | | |
| | | |
| | | |
| | |
| Operating expenses | |
| | | |
| | | |
| | | |
| | |
| Selling, general and administrative | |
| 27,673 | | |
| 26,908 | | |
| 87,168 | | |
| 79,963 | |
| Restructuring and transaction costs | |
| (49 | ) | |
| 171 | | |
| 1,491 | | |
| 3,143 | |
| Related party expense | |
| 142 | | |
| 159 | | |
| 437 | | |
| 480 | |
| Other general income | |
| — | | |
| — | | |
| — | | |
| (10,950 | ) |
| Total operating expenses | |
| 27,766 | | |
| 27,238 | | |
| 89,096 | | |
| 72,636 | |
| Operating income | |
| 11,542 | | |
| 12,758 | | |
| 42,399 | | |
| 40,514 | |
| Other expense | |
| | | |
| | | |
| | | |
| | |
| Interest expense | |
| (3,464 | ) | |
| (5,668 | ) | |
| (14,129 | ) | |
| (18,275 | ) |
| Loss on extinguishment of debt | |
| (15,155 | ) | |
| — | | |
| (15,155 | ) | |
| — | |
| Other (expense) income, net | |
| (352 | ) | |
| (213 | ) | |
| (881 | ) | |
| 1,925 | |
| | |
| | | |
| | | |
| | | |
| | |
| Total other expense, net | |
| (18,971 | ) | |
| (5,881 | ) | |
| (30,165 | ) | |
| (16,350 | ) |
| | |
| | | |
| | | |
| | | |
| | |
| (Loss) income before provision for income taxes | |
| (7,429 | ) | |
| 6,877 | | |
| 12,234 | | |
| 24,164 | |
| Benefit (provision) for income taxes | |
| 2,123 | | |
| (430 | ) | |
| (3,861 | ) | |
| (1,491 | ) |
| | |
| | | |
| | | |
| | | |
| | |
| Net (loss) income | |
$ | (5,306 | ) | |
$ | 6,447 | | |
$ | 8,373 | | |
$ | 22,673 | |
| | |
| | | |
| | | |
| | | |
| | |
| Net (loss) income per share: | |
| | | |
| | | |
| | | |
| | |
| Basic | |
$ | (0.19 | ) | |
$ | 0.23 | | |
$ | 0.30 | | |
$ | 0.82 | |
| Diluted | |
$ | (0.19 | ) | |
$ | 0.23 | | |
$ | 0.30 | | |
$ | 0.82 | |
| Weighted average shares outstanding: | |
| | | |
| | | |
| | | |
| | |
| Basic | |
| 27,483,350 | | |
| 27,483,350 | | |
| 27,483,350 | | |
| 27,483,350 | |
| Diluted | |
| 27,483,350 | | |
| 27,483,350 | | |
| 27,483,350 | | |
| 27,483,350 | |
CADRE HOLDINGS, INC.
CONSOLIDATED STATEMENTS OF CASH FLOWS
(Unaudited)
(In thousands)
| | |
Nine Months Ended September 30, | |
| | |
2021 | | |
2020 | |
| Cash Flows From Operating Activities: | |
| | | |
| | |
| Net income | |
$ | 8,373 | | |
$ | 22,673 | |
| Adjustments to reconcile net income to net cash provided by operating activities: | |
| | | |
| | |
| Depreciation and amortization | |
| 10,426 | | |
| 11,207 | |
| Amortization of original issue discount and debt issue costs | |
| 2,483 | | |
| 1,012 | |
| Loss on extinguishment of debt | |
| 15,155 | | |
| — | |
| Non cash consideration received from sale of business | |
| — | | |
| (6,821 | ) |
| Deferred income taxes | |
| 1,533 | | |
| 125 | |
| Gain on sale of fixed assets | |
| — | | |
| (6,218 | ) |
| Provision for losses on accounts receivable | |
| (254 | ) | |
| (130 | ) |
| Foreign exchange loss (gain) | |
| 45 | | |
| (752 | ) |
| Changes in operating assets and liabilities: | |
| | | |
| | |
| Accounts receivable | |
| 1,549 | | |
| 10,922 | |
| Inventories | |
| (10,261 | ) | |
| (4,902 | ) |
| Prepaid expenses and other assets | |
| (4,642 | ) | |
| (2,332 | ) |
| Accounts payable and other liabilities | |
| 6,582 | | |
| 3,408 | |
| Net cash provided by operating activities | |
| 30,989 | | |
| 28,192 | |
| Cash Flows From Investing Activities: | |
| | | |
| | |
| Purchase of property and equipment | |
| (2,225 | ) | |
| (3,913 | ) |
| Proceeds from disposition of property and equipment | |
| — | | |
| 12,386 | |
| Proceeds from sale of equity securities | |
| — | | |
| 5,591 | |
| Net cash (used in) provided by investing activities | |
| (2,225 | ) | |
| 14,064 | |
| Cash Flows From Financing Activities: | |
| | | |
| | |
| Proceeds from revolving credit facilities | |
| 248,000 | | |
| 281,730 | |
| Principal payments on revolving credit facilities | |
| (223,132 | ) | |
| (283,887 | ) |
| Proceeds from term loans | |
| 198,735 | | |
| — | |
| Principal payments on term loans | |
| (224,547 | ) | |
| (40,841 | ) |
| Proceeds from insurance premium financing | |
| 4,269 | | |
| 2,733 | |
| Principal payments on insurance premium financing | |
| (2,611 | ) | |
| (1,998 | ) |
| Payment of capital leases | |
| (32 | ) | |
| (35 | ) |
| Payments for debt issuance costs | |
| (2,830 | ) | |
| — | |
| Payments on extinguishment of debt | |
| (4,215 | ) | |
| — | |
| Dividends distributed | |
| (9,996 | ) | |
| — | |
| Net cash used in financing activities | |
| (16,359 | ) | |
| (42,298 | ) |
| Effect of foreign exchange rates on cash and cash equivalents | |
| (3 | ) | |
| 6 | |
| Change in cash and cash equivalents | |
| 12,402 | | |
| (36 | ) |
| Cash and cash equivalents, beginning of period | |
| 2,873 | | |
| 2,520 | |
| Cash and cash equivalents, end of period | |
| 15,275 | | |
| 2,484 | |
CADRE HOLDINGS, INC.
SEGMENT INFORMATION
(Unaudited)
(In thousands)
| | |
Three months ended September 30, 2021 | |
| | |
| | |
| | |
Reconciling | | |
| |
| | |
Products | | |
Distribution | | |
Items(1) | | |
Total | |
| Net sales | |
$ | 83,918 | | |
$ | 21,507 | | |
$ | (6,771 | ) | |
$ | 98,654 | |
| Cost of goods sold | |
| 49,896 | | |
| 16,220 | | |
| (6,770 | ) | |
| 59,346 | |
| Gross profit | |
$ | 34,022 | | |
$ | 5,287 | | |
$ | (1 | ) | |
$ | 39,308 | |
| | |
Three months ended September 30, 2020 | |
| | |
| | |
| | |
Reconciling | | |
| |
| | |
Products | | |
Distribution | | |
Items(1) | | |
Total | |
| Net sales | |
$ | 88,858 | | |
$ | 23,690 | | |
$ | (6,813 | ) | |
$ | 105,735 | |
| Cost of goods sold | |
| 54,325 | | |
| 18,273 | | |
| (6,859 | ) | |
| 65,739 | |
| Gross profit | |
$ | 34,533 | | |
$ | 5,417 | | |
$ | 46 | | |
$ | 39,996 | |
| | |
Nine months ended September 30, 2021 | |
| | |
| | |
| | |
Reconciling | | |
| |
| | |
Products | | |
Distribution | | |
Items(1) | | |
Total | |
| Net sales | |
$ | 274,039 | | |
$ | 69,086 | | |
$ | (19,374 | ) | |
$ | 323,751 | |
| Cost of goods sold | |
| 159,924 | | |
| 51,696 | | |
| (19,364 | ) | |
| 192,256 | |
| Gross profit | |
$ | 114,115 | | |
$ | 17,390 | | |
$ | (10 | ) | |
$ | 131,495 | |
| | |
Nine months ended September 30, 2020 | |
| | |
| | |
| | |
Reconciling | | |
| |
| | |
Products | | |
Distribution | | |
Items(1) | | |
Total | |
| Net sales | |
$ | 251,441 | | |
$ | 62,707 | | |
$ | (17,129 | ) | |
$ | 297,019 | |
| Cost of goods sold | |
| 153,233 | | |
| 47,897 | | |
| (17,261 | ) | |
| 183,869 | |
| Gross profit | |
$ | 98,208 | | |
$ | 14,810 | | |
$ | 132 | | |
$ | 113,150 | |
(1)
Reconciling items consist primarily of intercompany eliminations and items not directly attributable to operating segments.
CADRE HOLDINGS, INC.
RECONCILIATION OF GAAP TO NON-GAAP FINANCIAL
MEASURES
(Unaudited)
(In thousands)
| | |
Three Months Ended September 30, | | |
Nine Months Ended September 30, | |
| | |
2021 | | |
2020 | | |
2021 | | |
2020 | |
| (in thousands) | |
| | |
| | |
| | |
| |
| Net (loss) income | |
$ | (5,306 | ) | |
$ | 6,447 | | |
$ | 8,373 | | |
$ | 22,673 | |
| Add back: | |
| | | |
| | | |
| | | |
| | |
| Depreciation and amortization | |
| 3,406 | | |
| 3,537 | | |
| 10,426 | | |
| 11,207 | |
| Interest expense | |
| 3,464 | | |
| 5,668 | | |
| 14,129 | | |
| 18,275 | |
| Provision for income taxes | |
| (2,123 | ) | |
| 430 | | |
| 3,861 | | |
| 1,491 | |
| EBITDA | |
$ | (559 | ) | |
$ | 16,082 | | |
$ | 36,789 | | |
$ | 53,646 | |
| Add back: | |
| | | |
| | | |
| | | |
| | |
| Restructuring and transaction costs(1) | |
| (49 | ) | |
| 171 | | |
| 1,491 | | |
| 3,143 | |
| Other general income(2) | |
| — | | |
| — | | |
| — | | |
| (10,950 | ) |
| Loss on extinguishment of debt(3) | |
| 15,155 | | |
| — | | |
| 15,155 | | |
| — | |
| Other (expense) income, net(4) | |
| 352 | | |
| 213 | | |
| 881 | | |
| (1,925 | ) |
| Contingent consideration(5) | |
| — | | |
| (1,427 | ) | |
| — | | |
| (1,427 | ) |
| LTIP bonus(6) | |
| 520 | | |
| — | | |
| 1,804 | | |
| — | |
| Adjusted EBITDA | |
$ | 15,419 | | |
$ | 15,039 | | |
$ | 56,120 | | |
$ | 42,487 | |
| Less: Capital expenditures | |
| (719 | ) | |
| (1,275 | ) | |
| (2,225 | ) | |
| (3,913 | ) |
| Adjusted EBITDA less capital expenditures | |
$ | 14,700 | | |
$ | 13,764 | | |
$ | 53,895 | | |
$ | 38,574 | |
| Adjusted EBITDA conversion rate | |
| 95 | % | |
| 92 | % | |
| 96 | % | |
| 91 | % |
| Adjusted EBITDA margin | |
| 15.6 | % | |
| 14.2 | % | |
| 17.3 | % | |
| 14.3 | % |
| (1) | Reflects the “Restructuring and transaction costs” line item on our consolidated statement
of operations, which primarily includes transaction costs composed of legal and consulting fees. |
| (2) | Reflects the “Other general income” line item on our consolidated statement of operations
and includes a gain from a long-lived asset sale as well as earn-out stock payments for the nine months ended September 30,
2020. |
| (3) | Reflects a loss incurred in connection with the August 2021 debt refinance. |
| (4) | Reflects the “Other (expense) income, net” line item on our consolidated statement of operations.
For the three and nine months ended September 30, 2021, other (expense) income, net primarily includes losses on foreign currency
transactions. For the three and nine months ended September 30, 2020, other (expense) income, net primarily includes gains on
foreign exchange transactions and unrealized gains on an investment in equity securities. |
| (5) | Reflects a gain on the settlement of contingent consideration. |
| (6) | Reflects the cost of a cash-based long-term incentive plan awarded to employees that vests over three years. |
| (7) | Reflects Adjusted EBITDA / Net sales for the relevant periods. |
CADRE HOLDINGS, INC.
RECONCILIATION OF GAAP TO NON-GAAP FINANCIAL
MEASURES - CONTINUED
(Unaudited)
(In thousands)
| | |
Year Ended December 31, 2020 | | |
Nine Months Ended September 30, 2020 | | |
Nine Months Ended September 30, 2021 | | |
LTM
September 30, 2021 | |
| (in thousands) | |
| | | |
| | | |
| | | |
| | |
| Net (loss) income | |
$ | 38,453 | | |
$ | 22,673 | | |
$ | 8,373 | | |
$ | 24,153 | |
| Add back: | |
| | | |
| | | |
| | | |
| | |
| Depreciation and amortization | |
| 14,733 | | |
| 11,207 | | |
| 10,426 | | |
| 13,952 | |
| Interest expense | |
| 24,388 | | |
| 18,275 | | |
| 14,129 | | |
| 20,242 | |
| Provision for income taxes | |
| (10,578 | ) | |
| 1,491 | | |
| 3,861 | | |
| (8,208 | ) |
| EBITDA | |
$ | 66,996 | | |
$ | 53,646 | | |
$ | 36,789 | | |
$ | 50,139 | |
| Add back: | |
| | | |
| | | |
| | | |
| | |
| Restructuring and transaction costs(1) | |
| 5,822 | | |
| 3,143 | | |
| 1,491 | | |
| 4,170 | |
| Other general income(2) | |
| (10,950 | ) | |
| (10,950 | ) | |
| - | | |
| - | |
| Loss on extinguishment of debt(3) | |
| 200 | | |
| - | | |
| 15,155 | | |
| 15,355 | |
| Other (expense) income, net(4) | |
| (2,659 | ) | |
| (1,925 | ) | |
| 881 | | |
| 147 | |
| Contingent consideration(5) | |
| (1,427 | ) | |
| (1,427 | ) | |
| - | | |
| - | |
| LTIP bonus(6) | |
| - | | |
| - | | |
| 1,804 | | |
| 1,804 | |
| Adjusted EBITDA | |
$ | 57,982 | | |
$ | 42,487 | | |
$ | 56,120 | | |
$ | 71,615 | |
| Adjusted EBITDA margin | |
| 14.3 | % | |
| 14.3 | % | |
| 17.3 | % |
|
|
|
|
|
| (1) | Reflects the “Restructuring and transaction costs” line item on our consolidated statement
of operations, which primarily includes transaction costs composed of legal and consulting fees. |
| (2) | Reflects the “Other general income” line item on our consolidated statement of operations
and includes a gain from a long-lived asset sale as well as earn-out stock payments for the nine months ended September 30,
2020. |
| (3) | Reflects a loss incurred in connection with the August 2021 debt refinance. |
| (4) | Reflects the “Other (expense) income, net” line item on our consolidated statement of operations.
For the three and nine months ended September 30, 2021, other (expense) income, net primarily includes losses on foreign currency
transactions. For the three and nine months ended September 30, 2020, other (expense) income, net primarily includes gains on
foreign exchange transactions and unrealized gains on an investment in equity securities. |
| (5) | Reflects a gain on the settlement of contingent consideration. |
| (6) | Reflects the cost of a cash-based long-term incentive plan awarded to employees that vests over three years. |
| (7) | Reflects Adjusted EBITDA / Net sales for the relevant periods. |
Exhibit 99.2

THIRD QUARTER 2021
2 FORWARD - LOOKING STATEMENTS Except for historical information, certain matters discussed in this presentation may be forward - looking statements within the meaning of the Private Securities Litigation Reform Act of 1995. Forward - looking statements include but are not limited to all projections and anticipated levels of future performance. Forward - looking statements involve risks, uncertainties and other factors that may cause our actual results to differ materially from those discussed herein. Any number of factors could cause actual results to differ materially from projections or forward - looking statements, including without limitation global economic conditions, spending patterns of government agencies, competitive pressures, the impact of acquisitions and related integrati on activities, product liability claims, the success of new product introductions, currency exchange rate fluctuations and the r isk s of doing business in in the markets in which we operate, including foreign countries. More information on potential factors that could affect the Company's financial results are more fully described in our prospectus filed with the Securities and Exchang e Commission pursuant to Rule 424(b) under the Securities Act of 1933, as amended, on November 5, 2021, and will be included from time to time in the Company's public reports filed with the Securities and Exchange Commission, including the Company's Annual Report on Form 10 - K, Quarterly Reports on Form 10 - Q, and Current Reports on Form 8 - K. All forward - looking statements included in this presentation are based upon information available to the Company as of this date, and speak only as of the date hereof. We assume no obligation to update any forward - looking statements to reflect events or circumstances after the date of this presentation . 2

TODAY’S PRESENTERS 3 BRAD WILLIAMS President BLAINE BROWERS Chief Financial Officer WARREN KANDERS Chief Executive Officer and Chairman of the Board
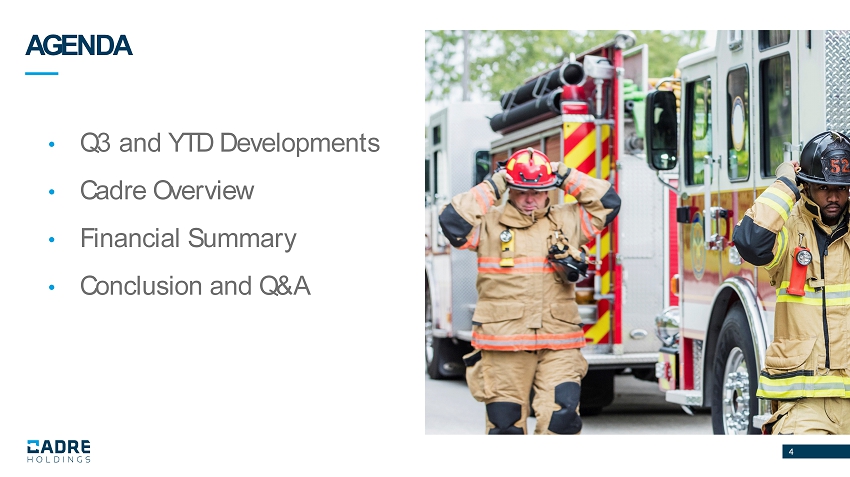
4 AGENDA • Q3 and YTD Developments • Cadre Overview • Financial Summary • Conclusion and Q&A
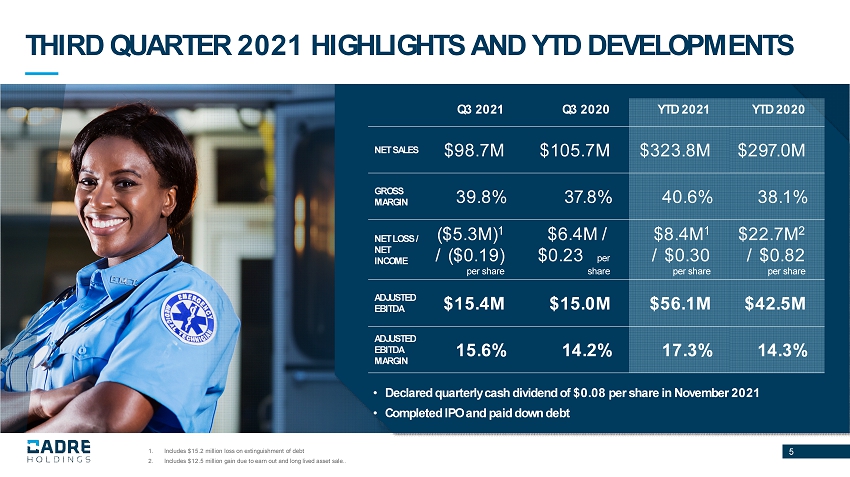
1. Includes $15.2 million loss on extinguishment of debt 2. Includes $12.5 million gain due to earn out and long lived asset sale.. THIRD QUARTER 2021 HIGHLIGHTS AND YTD DEVELOPMENTS 5 Q3 2021 Q3 2020 YTD 2021 YTD 2020 NET SALES $98.7M $105.7M $323.8M $297.0M GROSS MARGIN 39.8% 37.8% 40.6% 38.1% NET LOSS / NET INCOME ($5.3M) 1 / ($0.19) per share $6.4M / $0.23 per share $8.4M 1 / $0.30 per share $22.7M 2 / $0.82 per share ADJUSTED EBITDA $15.4M $15.0M $56.1M $42.5M ADJUSTED EBITDA MARGIN 15.6% 14.2% 17.3% 14.3% • Declared quarterly cash dividend of $0.08 per share in November 2021 • Completed IPO and paid down debt
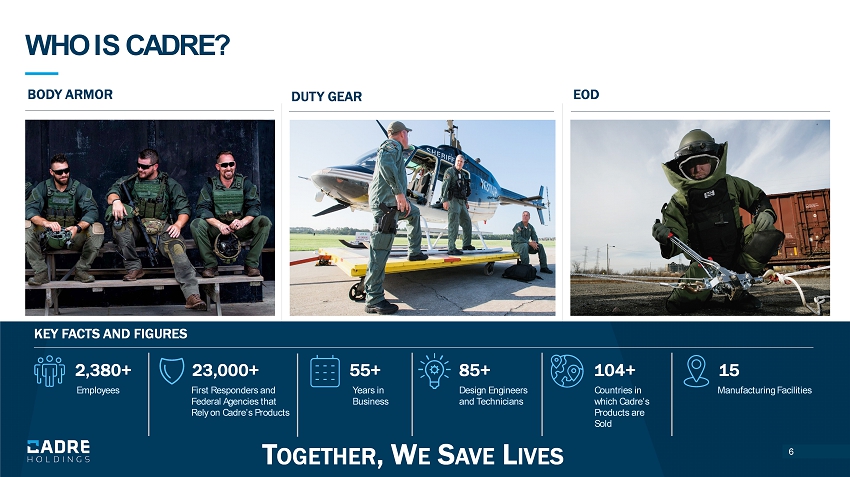
WHO IS CADRE? 5 BODY ARMOR EOD DUTY GEAR KEY FACTS AND FIGURES 2,380+ 23,000+ 55+ 85+ 104+ 15 Employees First Responders and Federal Agencies that Rely on Cadre’s Products Years in Business Design Engineers and Technicians Countries in which Cadre’s Products are Sold Manufacturing Facilities 6 T OGETHER , W E S AVE L IVES
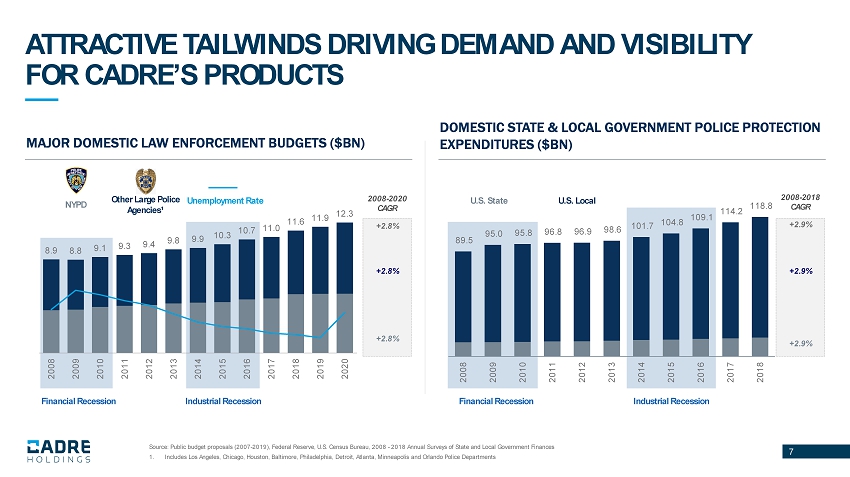
7 8.9 8.8 9.1 9.3 9.4 9.8 9.9 10.3 10.7 11.0 11.6 11.9 12.3 2008 2009 2010 2011 2012 2013 2014 2015 2016 2017 2018 2019 2020 Source: Public budget proposals (2007 - 2019), Federal Reserve, U.S. Census Bureau, 2008 - 2018 Annual Surveys of State and Local Government Finances 1. Includes Los Angeles, Chicago, Houston, Baltimore, Philadelphia, Detroit, Atlanta, Minneapolis and Orlando Police Departments ATTRACTIVE TAILWINDS DRIVING DEMAND AND VISIBILITY FOR CADRE’S PRODUCTS MAJOR DOMESTIC LAW ENFORCEMENT BUDGETS ($BN) NYPD Other Large Police Agencies¹ Unemployment Rate 2008 - 2020 CAGR +2.8% +2.8% +2.8% Industrial Recession Financial Recession 89.5 95.0 95.8 96.8 96.9 98.6 101.7 104.8 109.1 114.2 118.8 2008 2009 2010 2011 2012 2013 2014 2015 2016 2017 2018 2008 - 2018 CAGR +2.9% +2.9% +2.9% DOMESTIC STATE & LOCAL GOVERNMENT POLICE PROTECTION EXPENDITURES ($BN) Industrial Recession Financial Recession U.S. State U.S. Local
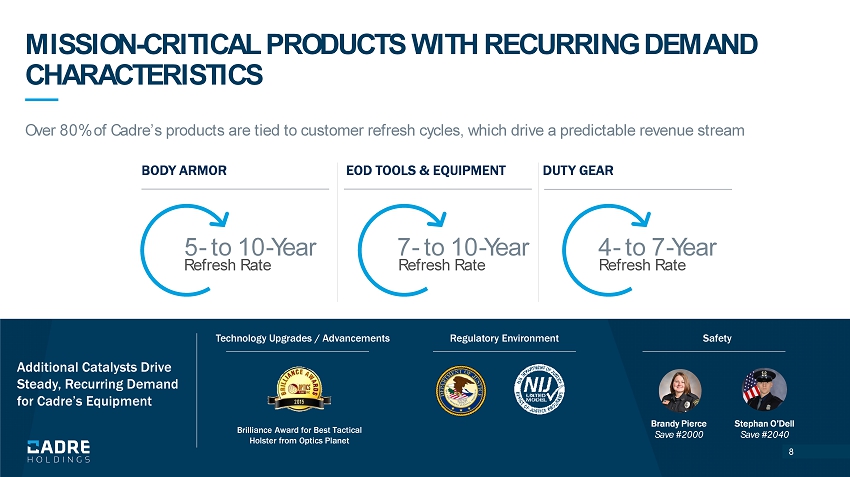
MISSION - CRITICAL PRODUCTS WITH RECURRING DEMAND CHARACTERISTICS Over 80% of Cadre’s products are tied to customer refresh cycles, which drive a predictable revenue stream BODY ARMOR EOD TOOLS & EQUIPMENT DUTY GEAR 5 - to 10 - Year 7 - to 10 - Year 4 - to 7 - Year Refresh Rate Refresh Rate Refresh Rate Technology Upgrades / Advancements Safety Regulatory Environment Brilliance Award for Best Tactical Holster from Optics Planet Additional Catalysts Drive Steady, Recurring Demand for Cadre’s Equipment Brandy Pierce Save #2000 Stephan O’Dell Save #2040 8
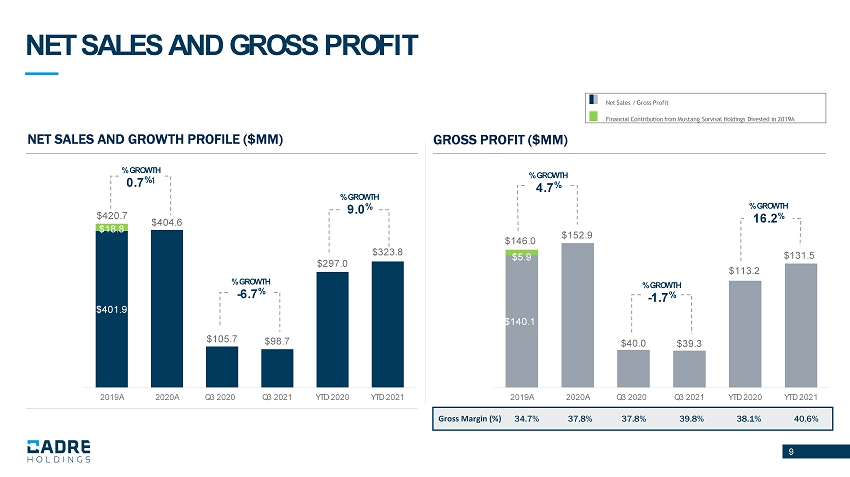
9 $140.1 $152.9 $40.0 $39.3 $113.2 $131.5 $5.9 2019A 2020A Q3 2020 Q3 2021 YTD 2020 YTD 2021 NET SALES AND GROSS PROFIT NET SALES AND GROWTH PROFILE ($MM) GROSS PROFIT ($MM) $401.9 $404.6 $105.7 $98.7 $297.0 $323.8 $18.8 2019A 2020A Q3 2020 Q3 2021 YTD 2020 YTD 2021 $420.7 Gross Margin (%) 34.7% 37.8% 37.8% 39.8% 38.1% 40.6% $146.0 % GROWTH 9 .0 % % GROWTH 0.7 % 1 % GROWTH - 6 .7 % % GROWTH 4.7 % % GROWTH - 1.7 % % GROWTH 16.2 % Net Sales / Gross Profit Financial Contribution from Mustang Survival Holdings Divested in 2019A
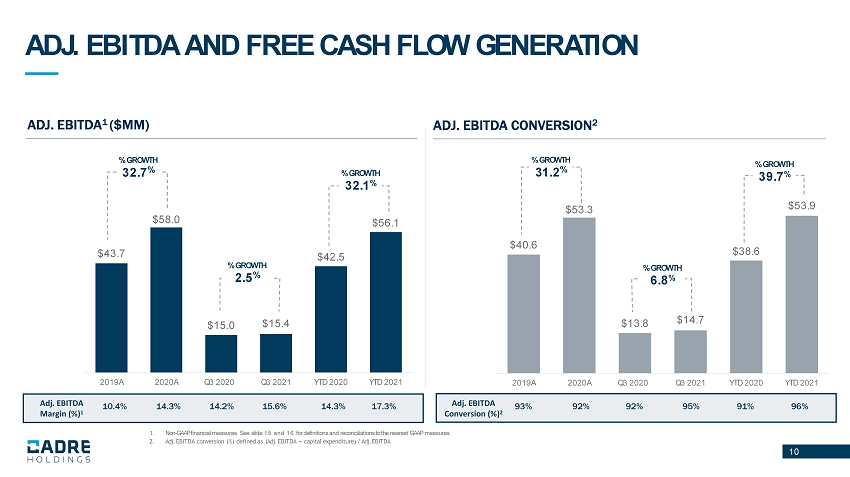
10 1. Non - GAAP financial measures. See slide 15 and 16 for definitions and reconciliations to the nearest GAAP measures 2. Adj. EBITDA conversion (%) defined as (Adj. EBITDA – capital expenditure) / Adj. EBITDA ADJ. EBITDA AND FREE CASH FLOW GENERATION $40.6 $53.3 $13.8 $14.7 $38.6 $53.9 2019A 2020A Q3 2020 Q3 2021 YTD 2020 YTD 2021 ADJ. EBITDA 1 ($MM) ADJ. EBITDA CONVERSION 2 $43.7 $58.0 $15.0 $15.4 $42.5 $56.1 2019A 2020A Q3 2020 Q3 2021 YTD 2020 YTD 2021 Adj. EBITDA Margin (%) 1 10.4% 14.3% 14.2% 15.6% 14.3% 17.3% Adj. EBITDA Conversion (%) 2 93% 92% 92% 95% 91% 96% % GROWTH 32.7 % % GROWTH 2.5 % % GROWTH 32.1 % % GROWTH 31.2 % % GROWTH 6.8 % % GROWTH 39.7 %
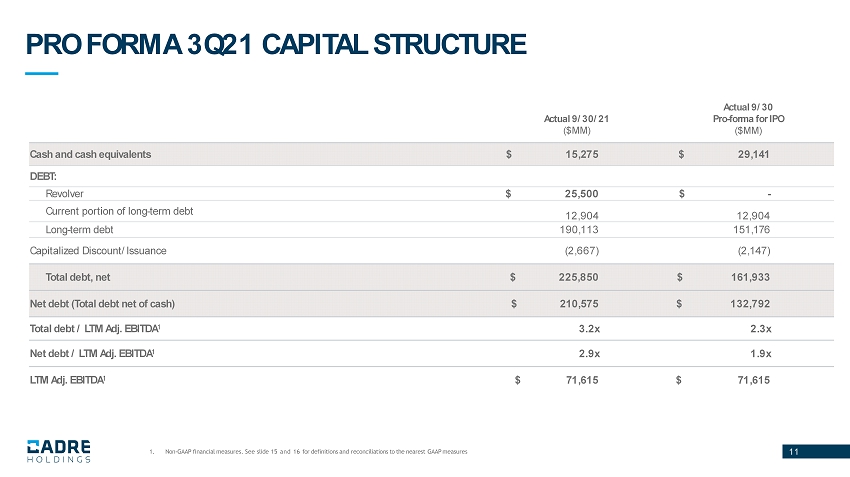
11 PRO FORMA 3Q21 CAPITAL STRUCTURE Actual 9/30/21 ($MM) Actual 9/30 Pro - forma for IPO ($MM) Cash and cash equivalents $ 15,275 $ 29,141 DEBT: Revolver $ 25,500 $ - Current portion of long - term debt 12,904 12,904 Long - term debt 190,113 151,176 Capitalized Discount/Issuance (2,667) (2,147) Total debt, net $ 225,850 $ 161,933 Net debt (Total debt net of cash) $ 210,575 $ 132,792 Total debt / LTM Adj. EBITDA 1 3.2x 2.3x Net debt / LTM Adj. EBITDA 1 2.9x 1.9x LTM Adj. EBITDA 1 $ 71,615 $ 71,615 1. Non - GAAP financial measures. See slide 15 and 16 for definitions and reconciliations to the nearest GAAP measures
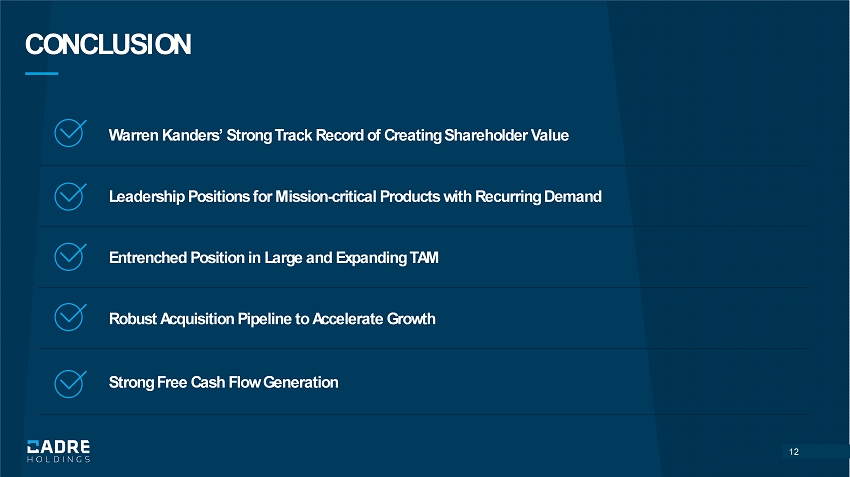
12 CONCLUSION 12 Warren Kanders ’ Strong Track Record of Creating Shareholder Value Leadership Position s for Mission - critical Products with Recurring Demand Entrenched Position in Large and Expanding TAM Robust Acquisition Pipeline to Accelerate Growth Strong Free Cash Flow Generation
13 APPENDIX
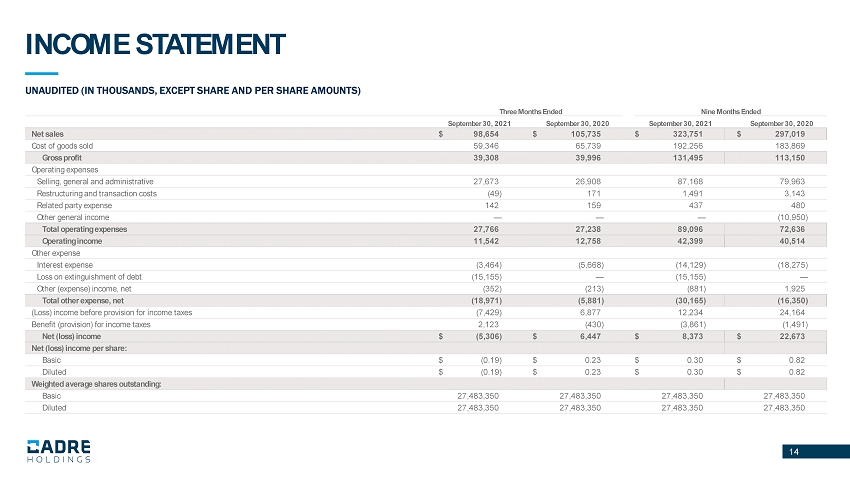
14 INCOME STATEMENT 14 UNAUDITED (IN THOUSANDS, EXCEPT SHARE AND PER SHARE AMOUNTS) Three Months Ended Nine Months Ended September 30, 2021 September 30, 2020 September 30, 2021 September 30, 2020 Net sales $ 98,654 $ 105,735 $ 323,751 $ 297,019 Cost of goods sold 59,346 65,739 192,256 183,869 Gross profit 39,308 39,996 131,495 113,150 Operating expenses Selling, general and administrative 27,673 26,908 87,168 79,963 Restructuring and transaction costs (49) 171 1,491 3,143 Related party expense 142 159 437 480 Other general income — — — (10,950) Total operating expenses 27,766 27,238 89,096 72,636 Operating income 11,542 12,758 42,399 40,514 Other expense Interest expense (3,464) (5,668) (14,129) (18,275) Loss on extinguishment of debt (15,155) — (15,155) — Other (expense) income, net (352) (213) (881) 1,925 Total other expense, net (18,971) (5,881) (30,165) (16,350) (Loss) income before provision for income taxes (7,429) 6,877 12,234 24,164 Benefit (provision) for income taxes 2,123 (430) (3,861) (1,491) Net (loss) income $ (5,306) $ 6,447 $ 8,373 $ 22,673 Net (loss) income per share: Basic $ (0.19) $ 0.23 $ 0.30 $ 0.82 Diluted $ (0.19) $ 0.23 $ 0.30 $ 0.82 Weighted average shares outstanding: Basic 27,483,350 27,483,350 27,483,350 27,483,350 Diluted 27,483,350 27,483,350 27,483,350 27,483,350
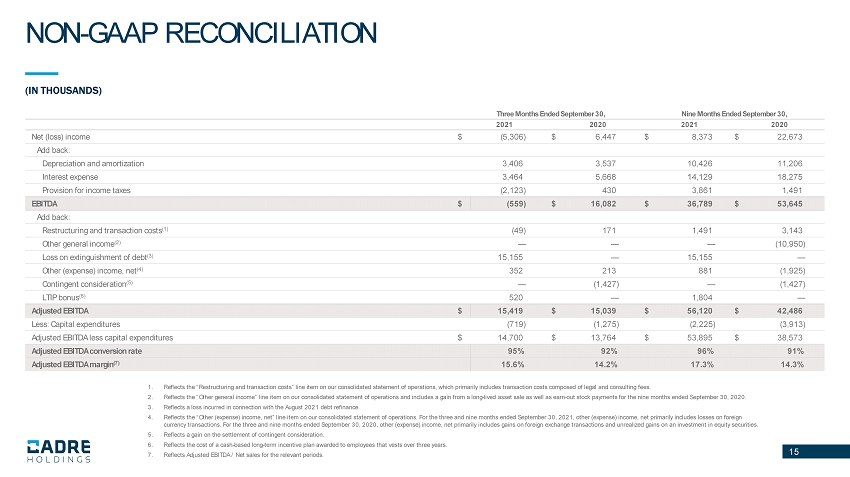
15 1. Reflects the “Restructuring and transaction costs” line item on our consolidated statement of operations, which primarily inc lud es transaction costs composed of legal and consulting fees. 2. Reflects the “Other general income” line item on our consolidated statement of operations and includes a gain from a long - lived asset sale as well as earn - out stock payments for the nine months ended September 30, 2020. 3. Reflects a loss incurred in connection with the August 2021 debt refinance. 4. Reflects the “Other (expense) income, net” line item on our consolidated statement of operations. For the three and nine months ended September 30, 2021, other (expense) income, net primarily includes losses on foreign currency transactions. For the three and nine months ended September 30, 2020, other (expense) income, net primarily includes ga ins on foreign exchange transactions and unrealized gains on an investment in equity securities. 5. Reflects a gain on the settlement of contingent consideration. 6. Reflects the cost of a cash - based long - term incentive plan awarded to employees that vests over three years. 7. Reflects Adjusted EBITDA / Net sales for the relevant periods. NON - GAAP RECONCILIATION 15 (IN THOUSANDS) Three Months Ended September 30, Nine Months Ended September 30, 2021 2020 2021 2020 Net (loss) income $ (5,306) $ 6,447 $ 8,373 $ 22,673 Add back: Depreciation and amortization 3,406 3,537 10,426 11,206 Interest expense 3,464 5,668 14,129 18,275 Provision for income taxes (2,123) 430 3,861 1,491 EBITDA $ (559) $ 16,082 $ 36,789 $ 53,645 Add back: Restructuring and transaction costs (1) (49) 171 1,491 3,143 Other general income (2) — — — (10,950) Loss on extinguishment of debt (3) 15,155 — 15,155 — Other (expense) income, net (4) 352 213 881 (1,925) Contingent consideration (5) — (1,427) — (1,427) LTIP bonus (6) 520 — 1,804 — Adjusted EBITDA $ 15,419 $ 15,039 $ 56,120 $ 42,486 Less: Capital expenditures (719) (1,275) (2,225) (3,913) Adjusted EBITDA less capital expenditures $ 14,700 $ 13,764 $ 53,895 $ 38,573 Adjusted EBITDA conversion rate 95% 92% 96% 91% Adjusted EBITDA margin (7) 15.6% 14.2% 17.3% 14.3%
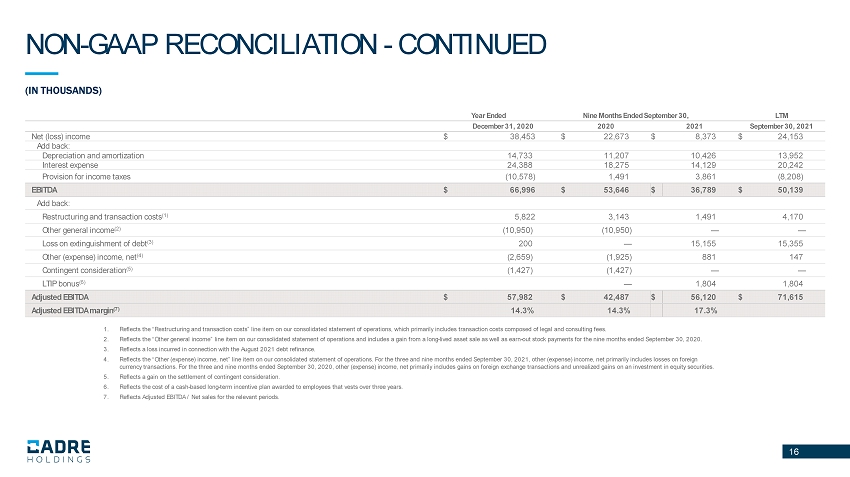
16 1. Reflects the “Restructuring and transaction costs” line item on our consolidated statement of operations, which primarily inc lud es transaction costs composed of legal and consulting fees. 2. Reflects the “Other general income” line item on our consolidated statement of operations and includes a gain from a long - lived asset sale as well as earn - out stock payments for the nine months ended September 30, 2020. 3. Reflects a loss incurred in connection with the August 2021 debt refinance. 4. Reflects the “Other (expense) income, net” line item on our consolidated statement of operations. For the three and nine months ended September 30, 2021, other (expense) income, net primarily includes losses on foreign currency transactions. For the three and nine months ended September 30, 2020, other (expense) income, net primarily includes ga ins on foreign exchange transactions and unrealized gains on an investment in equity securities. 5. Reflects a gain on the settlement of contingent consideration. 6. Reflects the cost of a cash - based long - term incentive plan awarded to employees that vests over three years. 7. Reflects Adjusted EBITDA / Net sales for the relevant periods. NON - GAAP RECONCILIATION - CONTINUED 16 (IN THOUSANDS) Year Ended Nine Months Ended September 30, LTM December 31, 2020 2020 2021 September 30, 2021 Net (loss) income $ 38,453 $ 22,673 $ 8,373 $ 24,153 Add back: Depreciation and amortization 14,733 11,207 10,426 13,952 Interest expense 24,388 18,275 14,129 20,242 Provision for income taxes (10,578) 1,491 3,861 (8,208) EBITDA $ 66,996 $ 53,646 $ 36,789 $ 50,139 Add back: Restructuring and transaction costs (1) 5,822 3,143 1,491 4,170 Other general income (2) (10,950) (10,950) — — Loss on extinguishment of debt (3) 200 — 15,155 15,355 Other (expense) income, net (4) (2,659) (1,925) 881 147 Contingent consideration (5) (1,427) (1,427) — — LTIP bonus (6) — 1,804 1,804 Adjusted EBITDA $ 57,982 $ 42,487 $ 56,120 $ 71,615 Adjusted EBITDA margin (7) 14.3% 14.3% 17.3%
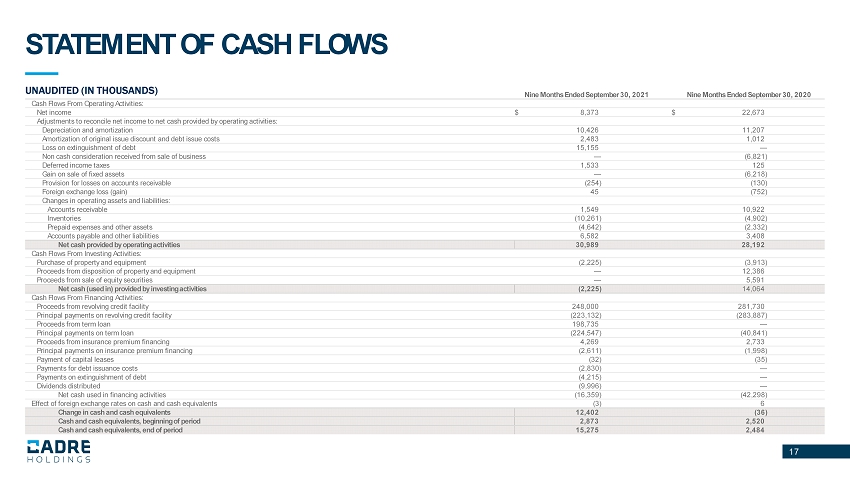
17 STATEMENT OF CASH FLOWS 17 UNAUDITED (IN THOUSANDS) Nine Months Ended September 30, 2021 Nine Months Ended September 30, 2020 Cash Flows From Operating Activities: Net income $ 8,373 $ 22,673 Adjustments to reconcile net income to net cash provided by operating activities: Depreciation and amortization 10,426 11,207 Amortization of original issue discount and debt issue costs 2,483 1,012 Loss on extinguishment of debt 15,155 — Non cash consideration received from sale of business — (6,821) Deferred income taxes 1,533 125 Gain on sale of fixed assets — (6,218) Provision for losses on accounts receivable (254) (130) Foreign exchange loss (gain) 45 (752) Changes in operating assets and liabilities: Accounts receivable 1,549 10,922 Inventories (10,261) (4,902) Prepaid expenses and other assets (4,642) (2,332) Accounts payable and other liabilities 6,582 3,408 Net cash provided by operating activities 30,989 28,192 Cash Flows From Investing Activities: Purchase of property and equipment (2,225) (3,913) Proceeds from disposition of property and equipment — 12,386 Proceeds from sale of equity securities — 5,591 Net cash (used in) provided by investing activities (2,225) 14,064 Cash Flows From Financing Activities: Proceeds from revolving credit facility 248,000 281,730 Principal payments on revolving credit facility (223,132) (283,887) Proceeds from term loan 198,735 — Principal payments on term loan (224,547) (40,841) Proceeds from insurance premium financing 4,269 2,733 Principal payments on insurance premium financing (2,611) (1,998) Payment of capital leases (32) (35) Payments for debt issuance costs (2,830) — Payments on extinguishment of debt (4,215) — Dividends distributed (9,996) — Net cash used in financing activities (16,359) (42,298) Effect of foreign exchange rates on cash and cash equivalents (3) 6 Change in cash and cash equivalents 12,402 (36) Cash and cash equivalents, beginning of period 2,873 2,520 Cash and cash equivalents, end of period 15,275 2,484
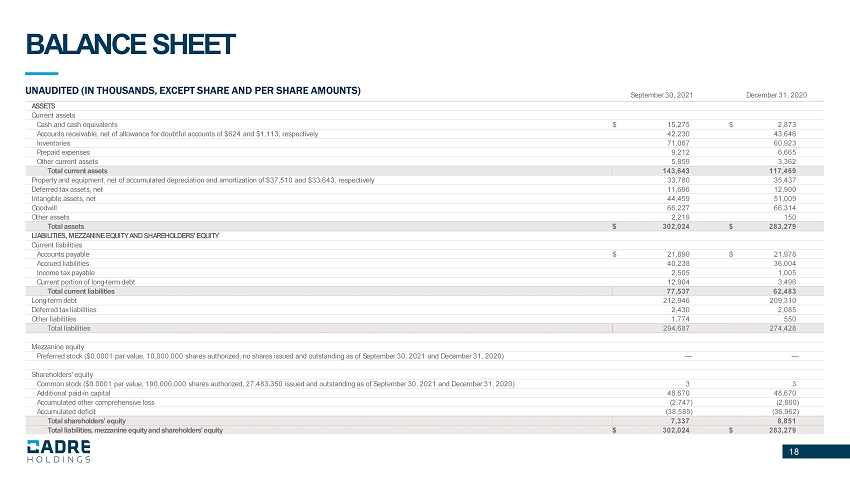
18 BALANCE SHEET 18 UNAUDITED (IN THOUSANDS, EXCEPT SHARE AND PER SHARE AMOUNTS) September 30, 2021 December 31, 2020 ASSETS Current assets Cash and cash equivalents $ 15,275 $ 2,873 Accounts receivable, net of allowance for doubtful accounts of $624 and $1,113, respectively 42,230 43,646 Inventories 71,067 60,923 Prepaid expenses 9,212 6,665 Other current assets 5,859 3,362 Total current assets 143,643 117,469 Property and equipment, net of accumulated depreciation and amortization of $37,510 and $33,643, respectively 33,780 35,437 Deferred tax assets, net 11,696 12,900 Intangible assets, net 44,459 51,009 Goodwill 66,227 66,314 Other assets 2,219 150 Total assets $ 302,024 $ 283,279 LIABILITIES, MEZZANINE EQUITY AND SHAREHOLDERS' EQUITY Current liabilities Accounts payable $ 21,890 $ 21,978 Accrued liabilities 40,238 36,004 Income tax payable 2,505 1,005 Current portion of long - term debt 12,904 3,496 Total current liabilities 77,537 62,483 Long - term debt 212,946 209,310 Deferred tax liabilities 2,430 2,085 Other liabilities 1,774 550 Total liabilities 294,687 274,428 Mezzanine equity Preferred stock ($0.0001 par value, 10,000,000 shares authorized, no shares issued and outstanding as of September 30, 2021 a nd December 31, 2020) — — Shareholders' equity Common stock ($0.0001 par value, 190,000,000 shares authorized, 27,483,350 issued and outstanding as of September 30, 2021 an d D ecember 31, 2020) 3 3 Additional paid - in capital 48,670 48,670 Accumulated other comprehensive loss (2,747) (2,860) Accumulated deficit (38,589) (36,962) Total shareholders’ equity 7,337 8,851 Total liabilities, mezzanine equity and shareholders' equity $ 302,024 $ 283,279