Exhibit 99.1(a)
Second Quarter 2025 Earnings Prepared Comments
Bill Cunningham, Celanese Corporation, Vice President, Investor Relations
This is the Celanese Corporation second quarter 2025 earnings prepared comments. The Celanese Corporation second quarter 2025 earnings release was distributed via Business Wire this afternoon and posted on our investor relations website, investors.celanese.com. As a reminder, some of the matters discussed below may include forward-looking statements concerning, for example, our future objectives and plans. Please note the cautionary language contained at the end of these comments. Also, some of the matters discussed include references to non-GAAP financial measures. Explanations of these measures and reconciliations to the comparable GAAP measures are included on our investor relations website under Financial Information/Non-GAAP Financial Measures. The earnings release and non-GAAP information and the reconciliations are being furnished to the SEC in a Current Report on Form 8-K. These prepared comments are also being furnished to the SEC in a separate Current Report on Form 8-K.
On the earnings conference call tomorrow morning, management will be available to answer questions.
Scott Richardson, Celanese Corporation, President and Chief Executive Officer
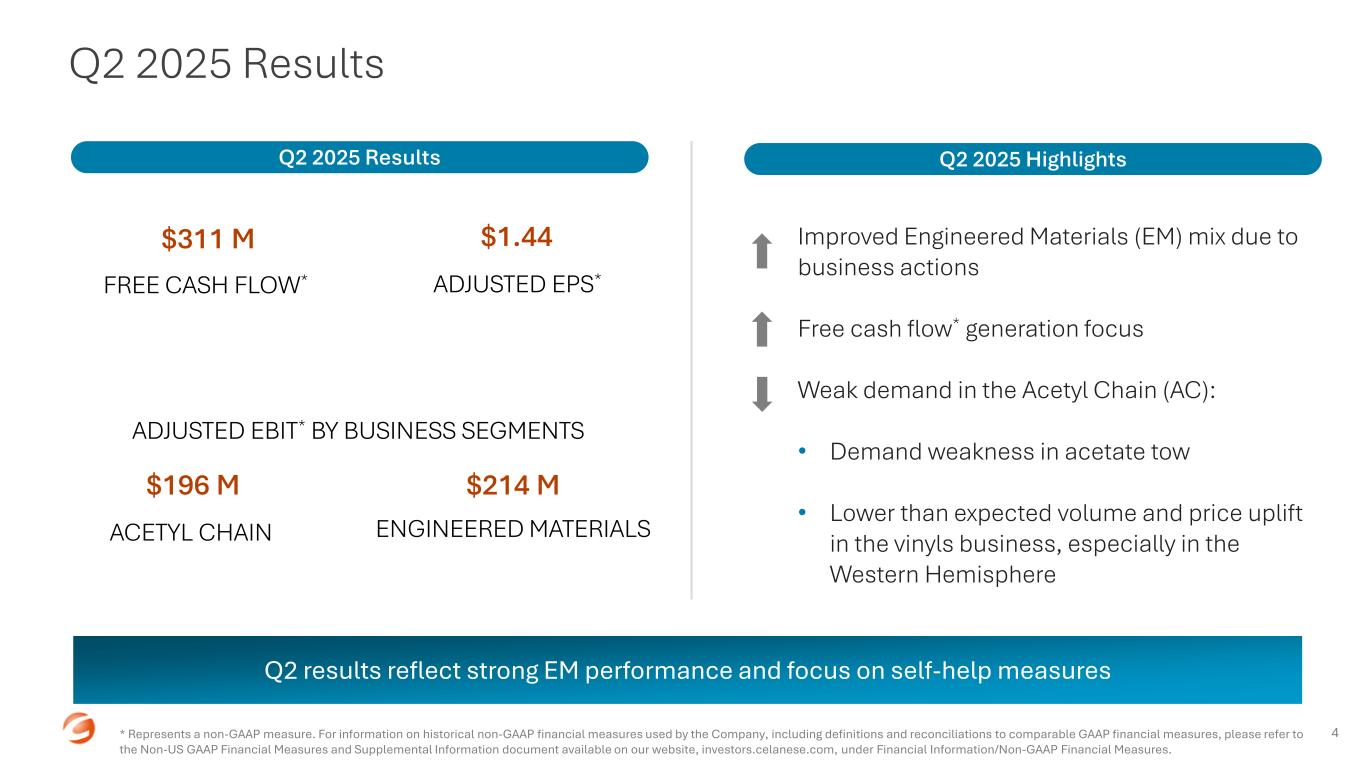
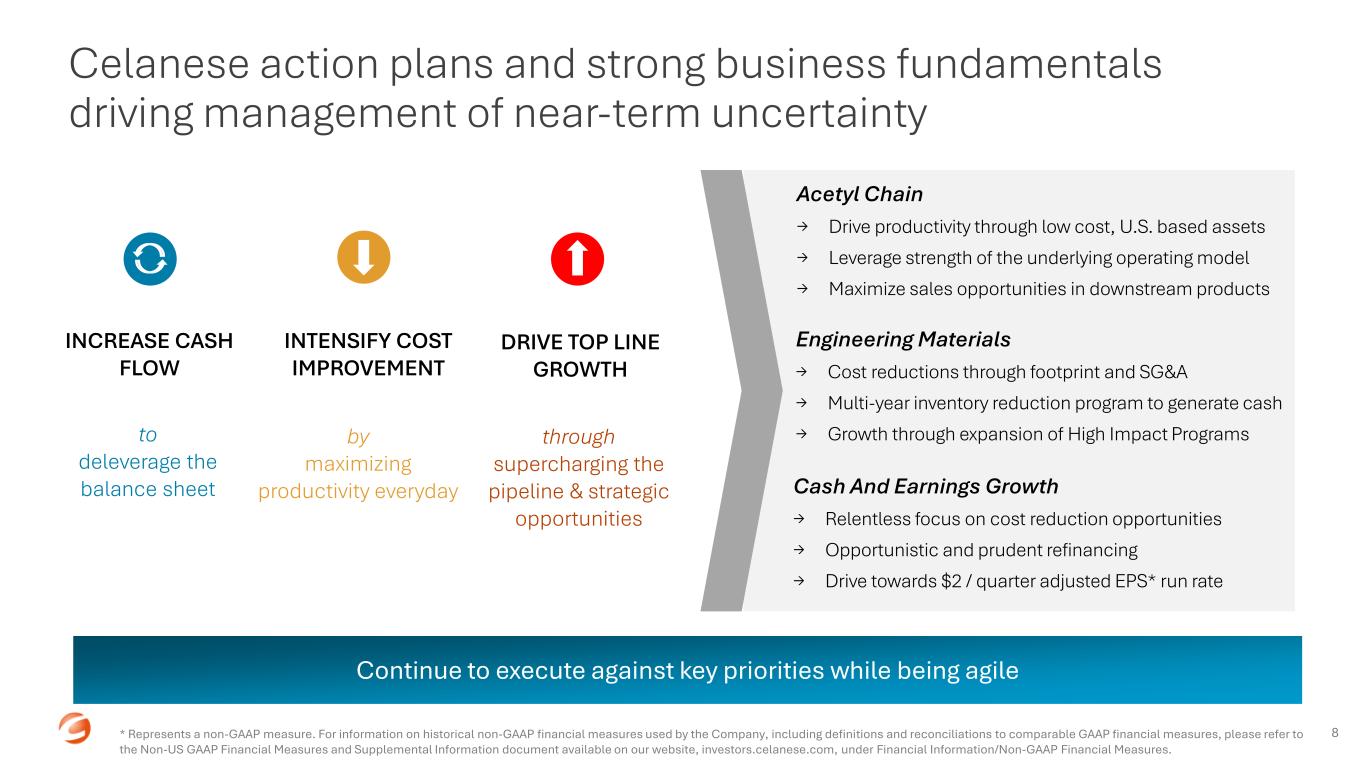
Today, we reported second quarter 2025 adjusted earnings per share of $1.44 (inclusive of approximately $0.38 per share total Celanese transaction amortization1). We are delivering on our key priorities of increasing cash flow to accelerate deleveraging, intensifying cost improvements, and driving top line growth. These imperatives continue to guide our actions as we move forward.
At a high level, our results were driven by favorable Engineered Materials (EM) product mix, reflecting actions taken to position production and inventory in-region, as well as our continued progress realizing significant cost reductions across both businesses. The results were partially offset by continued demand weakness in acetate tow as well as a lower than expected uplift in the quarter from volume and pricing initiatives in the vinyls business.
1 Calculated as intangible amortization from transactions divided by diluted weighted average shares outstanding.
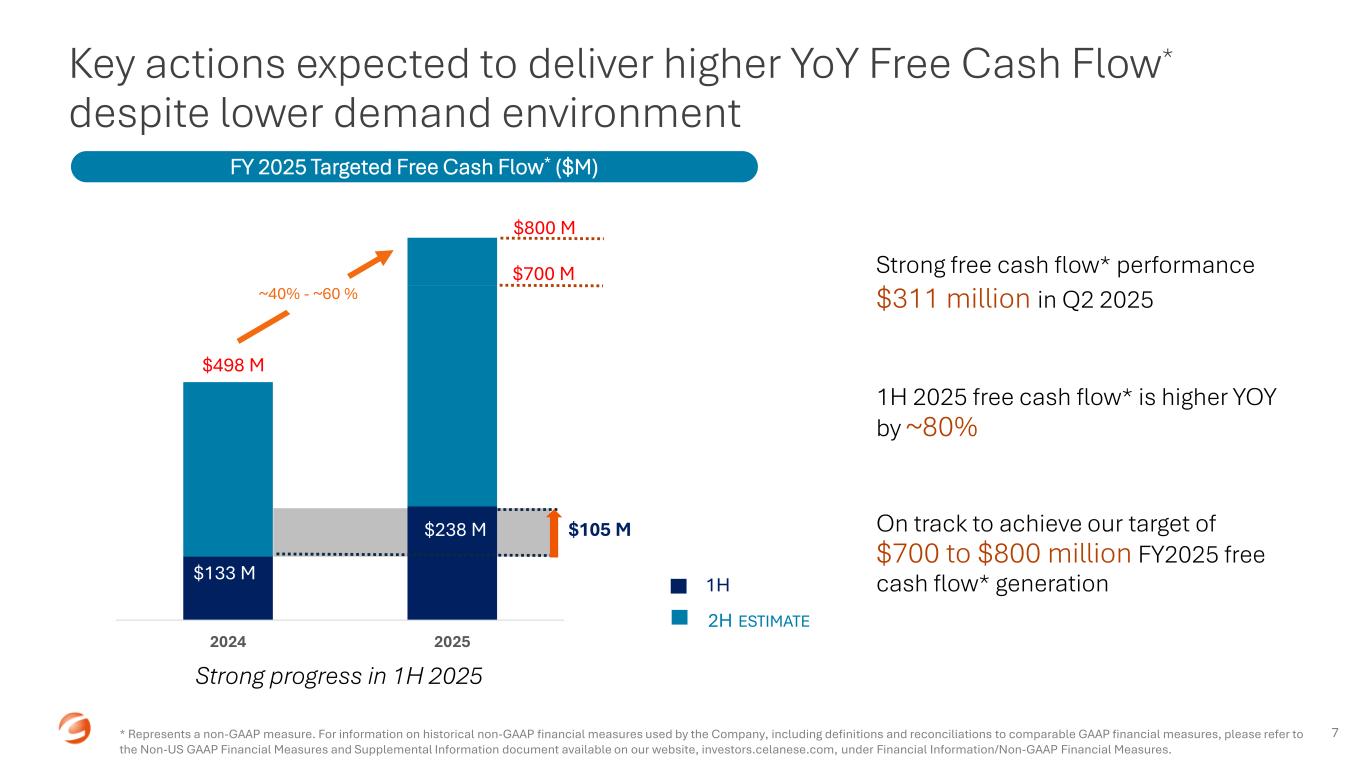
Since the beginning of 2025, we have stressed the importance of increasing our free cash flow, and I am proud of the efforts made by our teams across all business lines and functions to advance this priority. In the second quarter, we generated free cash flow of $311 million. This result was an approximate 80 percent improvement in free cash flow for the first half of 2025 as compared to the first half of 2024, and represents meaningful progress towards our target of $700 to $800 million of free cash flow for the year.
In the second quarter, end-markets across both businesses remained challenged, especially in China. Key EM end-markets like automotive, industrial, and electronics developed largely as anticipated, with demand remaining at lower than normal levels. Key end-markets of the Acetyl Chain (AC) experienced greater headwinds due to persistent weakness in paints, coatings, and construction, among others. Additionally, customer inventory rebalancing in acetate tow did not ease as expected in the quarter, and we anticipate continued weakness through the remainder of the year. Against this demand setting, our focus remains on driving self-help measures that advance our strategic priorities and sustain momentum.
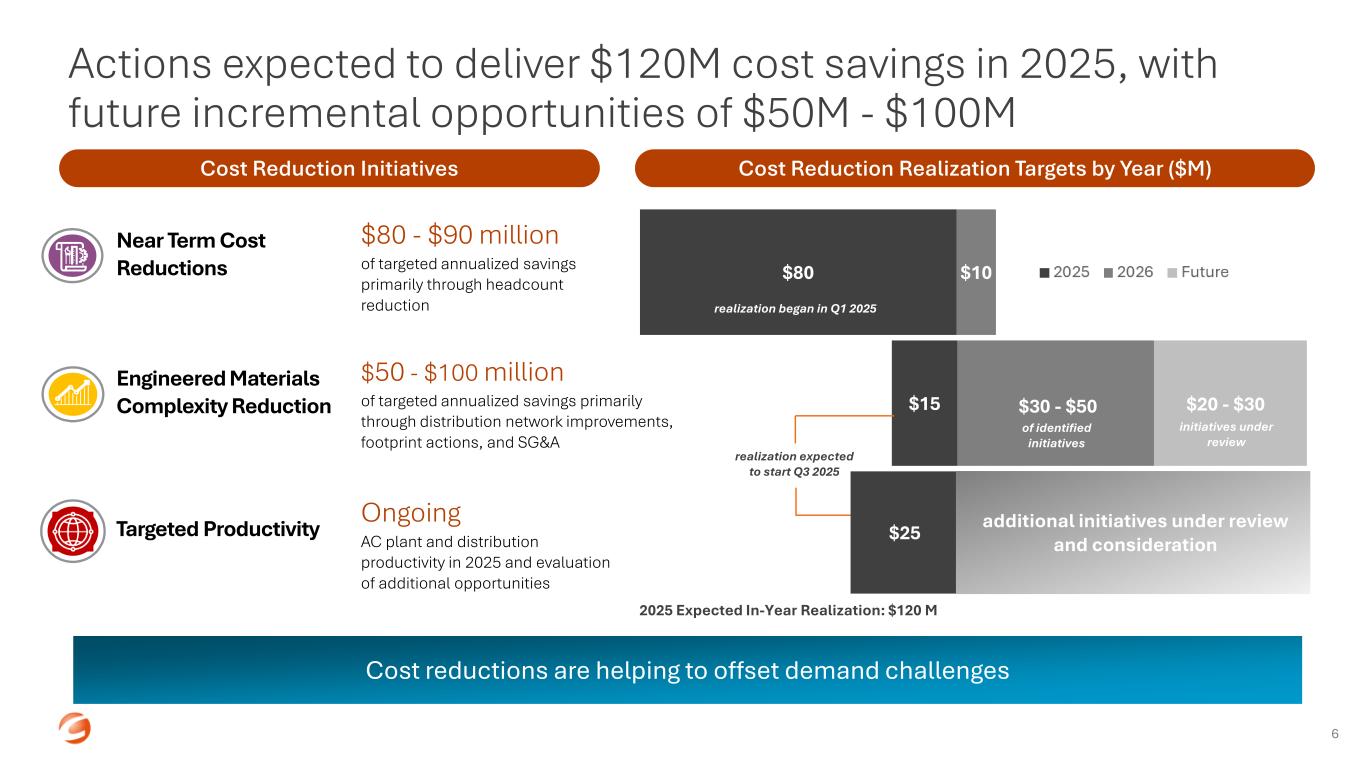
We have completed all actions associated with the target of $120 million in cost reduction initiatives that are expected to be realized in 2025. Realization of the initial $80 million of savings, mainly from sales, general, and administration (SG&A) reductions, began in the first quarter. Realization of the remaining $40 million of reductions, evenly split between EM and AC, is expected through the second half of the year. The EM cost reductions are planned to come from streamlining areas such as the logistics and distribution network, discretionary spending, and SG&A. Within AC, the additional cost reductions are planned to contribute to plant and distribution productivity, while maximizing the utilization of our industry-leading lowest-cost gulf coast assets.
In addition to these actions, we have taken the following steps to advance our strategic priorities:
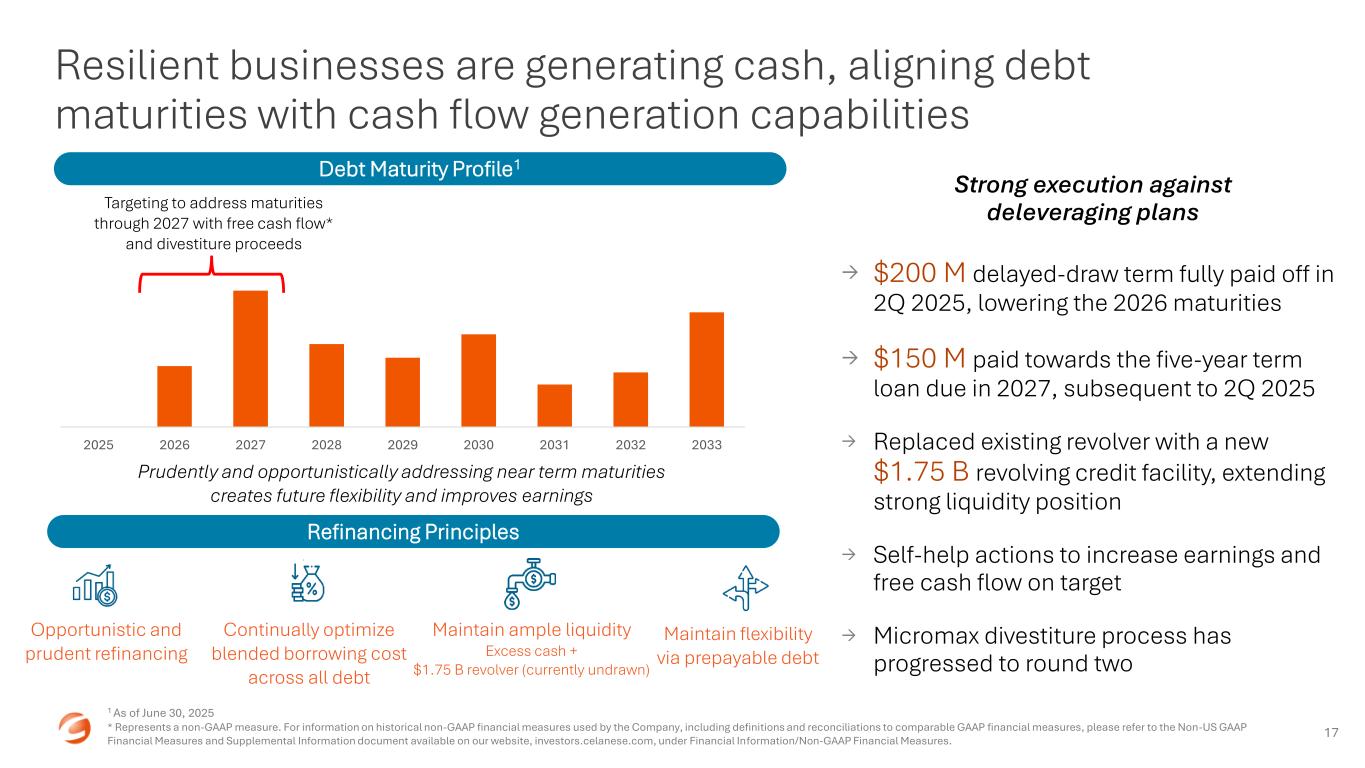
•Fully repaid the approximate $200 million balance on the delayed draw term loan that was due in the first quarter of 2026, which marks a significant step in our deleveraging journey. Additionally, since the close of the second quarter, we have paid down an incremental $150 million of our five-year senior unsecured loan due 2027, reducing the outstanding balance to $330 million.
•Completed a new credit agreement and a new $1.75 billion senior unsecured revolving credit facility. Chuck will provide additional details on this transaction which further reinforces our strong liquidity position through 2030.
•Progressed to the second round of the Micromax® divestiture process, with significant interest from a diverse set of potential buyers. We plan to drive Micromax® as well as other divestiture opportunities to achieve our goal of approximately $1 billion in divestitures through 2027.
•Announced two additional footprint optimization opportunities which we expect to deliver approximately $5 to $10 million in cost improvements in 2026. We expect to exit the Sempach, Switzerland, Elotex® redispersible powders location and the EM Vamac® location at Sarnia (St. Clair) Canada. All activities and capabilities from the two sites will be consolidated into our reduced footprint.
We are confident in our ability to continually identify and implement additional cash generation and cost saving actions to build on our momentum. We believe our actions, when combined with the fundamental strength of our core business models, will help us navigate the uncertain macroeconomic environment.
Now, let me turn to the performance specifics of our businesses.
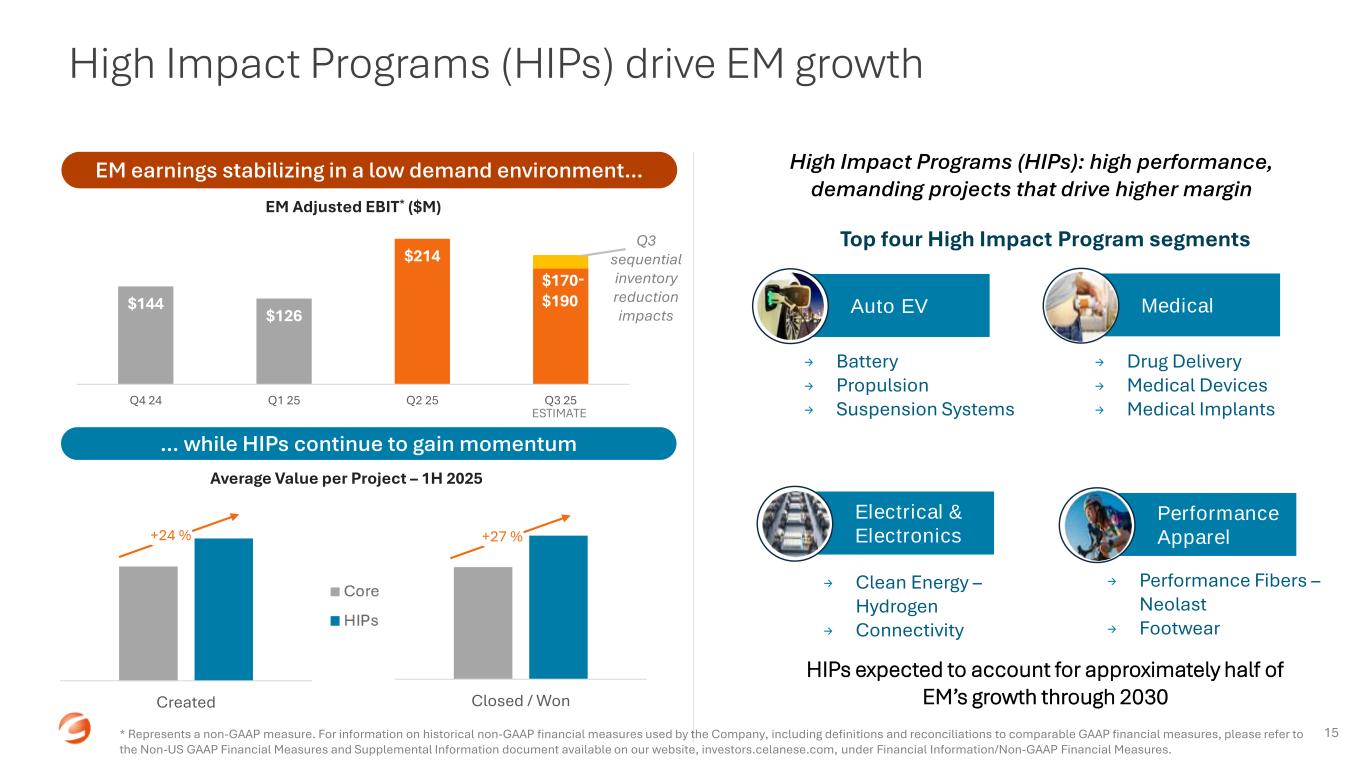
Engineered Materials delivered second quarter adjusted EBIT of $214 million and operating EBITDA of $326 million at margins of 15 and 23 percent, respectively. This represents a sequential improvement in adjusted EBIT of 70 percent, and returns the business to an operating EBITDA margin similar to the average of the first three quarters of 2024. Net sales increased by 12 percent sequentially, reflecting increases of 9 percent in volume and 3 percent due to currency.
The solid quarterly outcome was largely driven by the deliberate actions taken earlier in the year to accelerate earnings improvement. The main driver was favorable product mix, which improved our expected results by approximately $15 to $20 million. The favorability was underpinned by 1) our ability to leverage our global reach to position production and inventory in-region and enable product availability to take advantage of available demand opportunities, and 2) our continued focus on the commercialization of High Impact Programs (HIPs), which emphasize specialty product offerings into growth markets. Additionally, price increase realization in specialty product lines and in the Western Hemisphere in general helped to offset continued pressures in standard grade businesses in Asia.
Volumes in the quarter developed as expected, with some sequential improvement from easing of European automotive destocking. EM global auto volumes were modestly higher sequentially and commensurate with the slight sequential increase in global auto builds. Other key end-markets, including consumer, medical, and industrial, remained at lower-than-normal levels. Our order books began to weaken in June, especially in Europe and China, and that trend has continued into the early part of the third quarter.
The organizational focus around HIPs contributed to EM's second quarter and remains key to its future growth trajectory. Projects like these highlight our ability be a full solutions provider and reduce complexity for our customers, as well as create momentum for growth by effectively positioning our
highest value products. These differentiated, higher margin projects are largely represented within four key growth end-markets: Automotive EV, Medical, Electronics, and Performance Apparel. Examples of end-product opportunities with multiple projects include EV propulsion, batteries, cooling, and advanced suspension systems, as well as drug delivery, performance footwear and fibers, and hydrogen clean energy.
Our focus on HIPs continues to pay off. In the first half of 2025, the average value of newly created HIPs projects was 24 percent greater than that of core projects, and the average value of commercialized HIPs was 27 percent greater than that of core projects. These projects leverage our differentiated product performance attributes into areas where customer needs and growth best align. The continual evolution of the EM pipeline model, with an emphasis on improving connectivity to these global growth sectors, is key to our earnings expansion, and we are continuing to redeploy resources more efficiently and effectively to those pockets of higher growth.
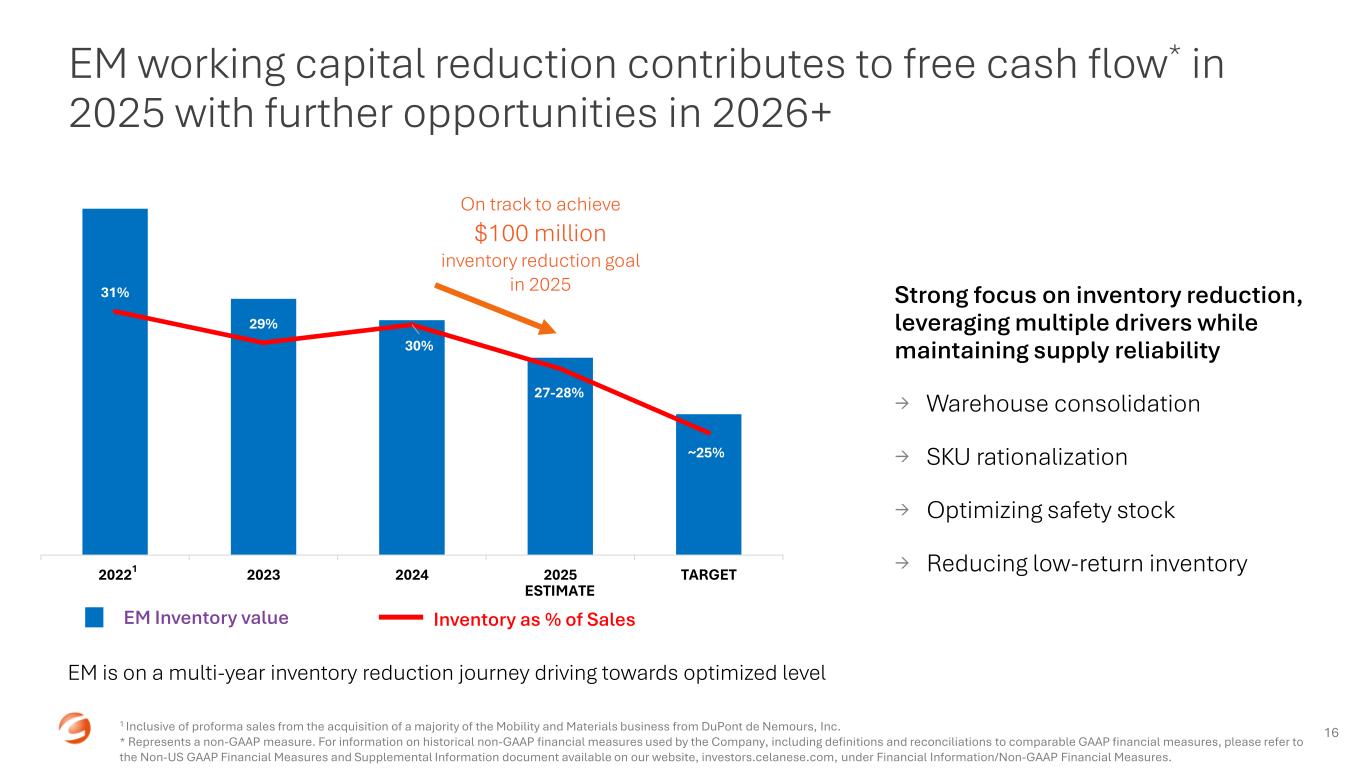
Equally important to improving earnings in EM is the emphasis on generating cash to accelerate deleveraging, mainly through inventory release. We have previously discussed our target to lower EM inventory by $100 million by the end of 2025, and our teams continue to make good progress towards this goal. We believe that EM has a significant opportunity to lower inventory levels even further. The business is on a multi-year journey towards a sustainably lower level of inventory while maintaining supply reliability, and we are continuing to review and implement improvement levers such as optimized safety stock, warehouse consolidation, SKU rationalization, and increasing the percentage of make-to-order SKUs. At the outset of 2024, EM inventory as a percentage of sales was 30 percent, and through these actions we are targeting a reduction to under 25 percent as a result of this initiative.
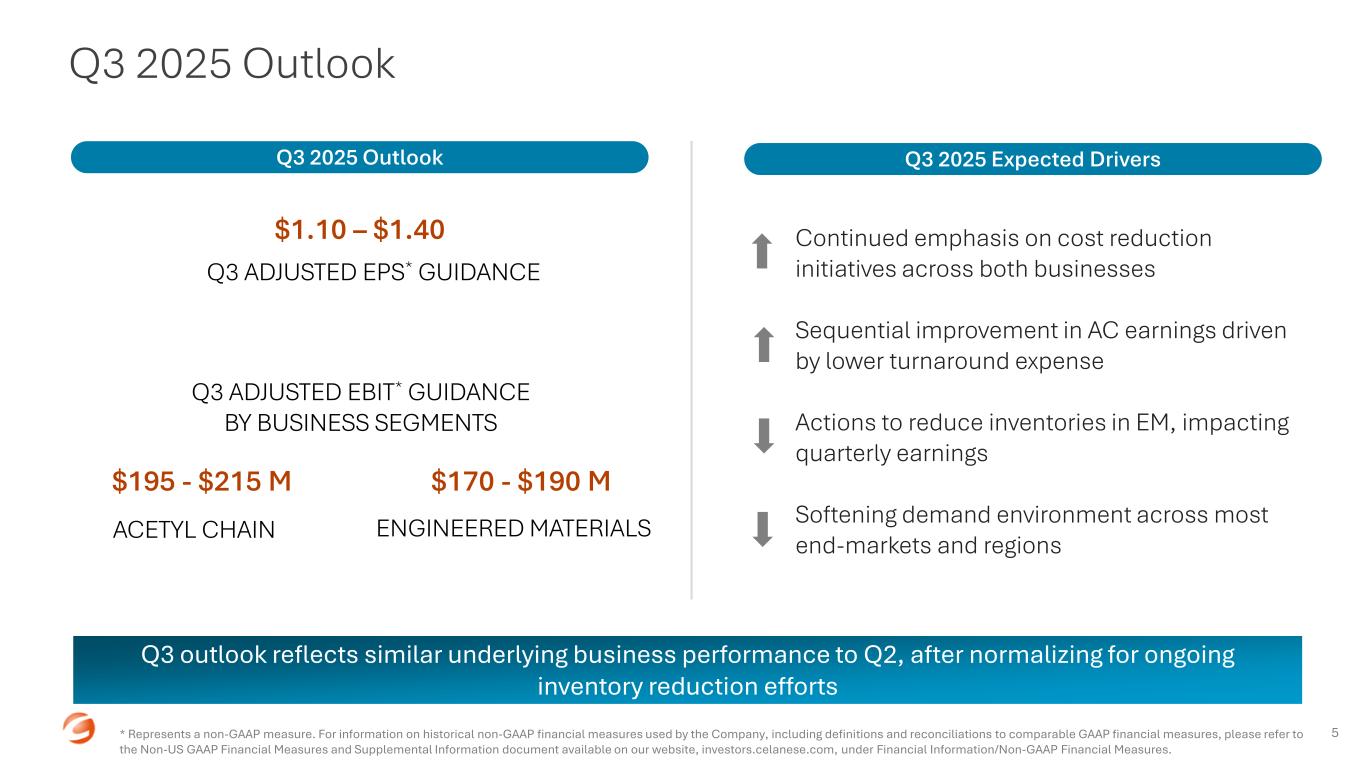
Looking to the third quarter, we are anticipating a softening demand environment, particularly in Europe, and order books are developing more slowly compared to the previous quarter. Due to this, we expect a $10 to $15 million impact from weaker demand and some associated timing of orders in the second quarter. Additionally, we anticipate an approximate $25 million sequential earnings headwind due to our ongoing inventory reduction efforts. Considering these factors, we expect EM adjusted EBIT for the third quarter to be $170 - $190 million and operating EBITDA to be $280 - $300 million.
Should demand improve through the quarter, we are confident in our ability to respond quickly and manage inventories. Regardless of the environment, we are relentlessly focused on cost reductions to drive earnings improvement. EM is working on an additional $30 to $50 million of savings from new initiatives for realization starting in 2026. Focus areas include SG&A reductions, distribution network improvements, and further manufacturing optimization programs.
Even beyond these actions, our teams are working every day to continue finding new opportunities. In this low-demand environment, we are focused on identifying and implementing additional self-help measures to drive earnings improvements and generate cash.
The Acetyl Chain (AC) delivered second quarter adjusted EBIT of $196 million and operating EBITDA of $260 million, at margins of 18 and 23 percent, respectively. The results reflect demand headwinds faced in acetate tow and the vinyls business. In acetate tow, sales were slower than anticipated and the first quarter customer inventory rebalancing did not abate as expected, impacting the quarter by approximately $15 million versus our expectations. In the vinyls business, AC drove actions in the western hemisphere that delivered pricing and volume improvements. However, the anticipated lift from these actions did not fully materialize as demand continues to be extremely challenged, impacting the quarter by approximately $10 million.
Net sales were essentially unchanged with sequential declines in volume of 1 percent and in price of 2 percent, offset by favorable currency. The global demand environment weakened compared to the first quarter, and the typical seasonal demand lift was particularly lackluster. The business took multiple actions to partially offset the challenged industry conditions including optimizing production at low-cost, U.S. based assets, reducing operating rates in higher cost sites, and reducing global distribution costs to align with available demand.
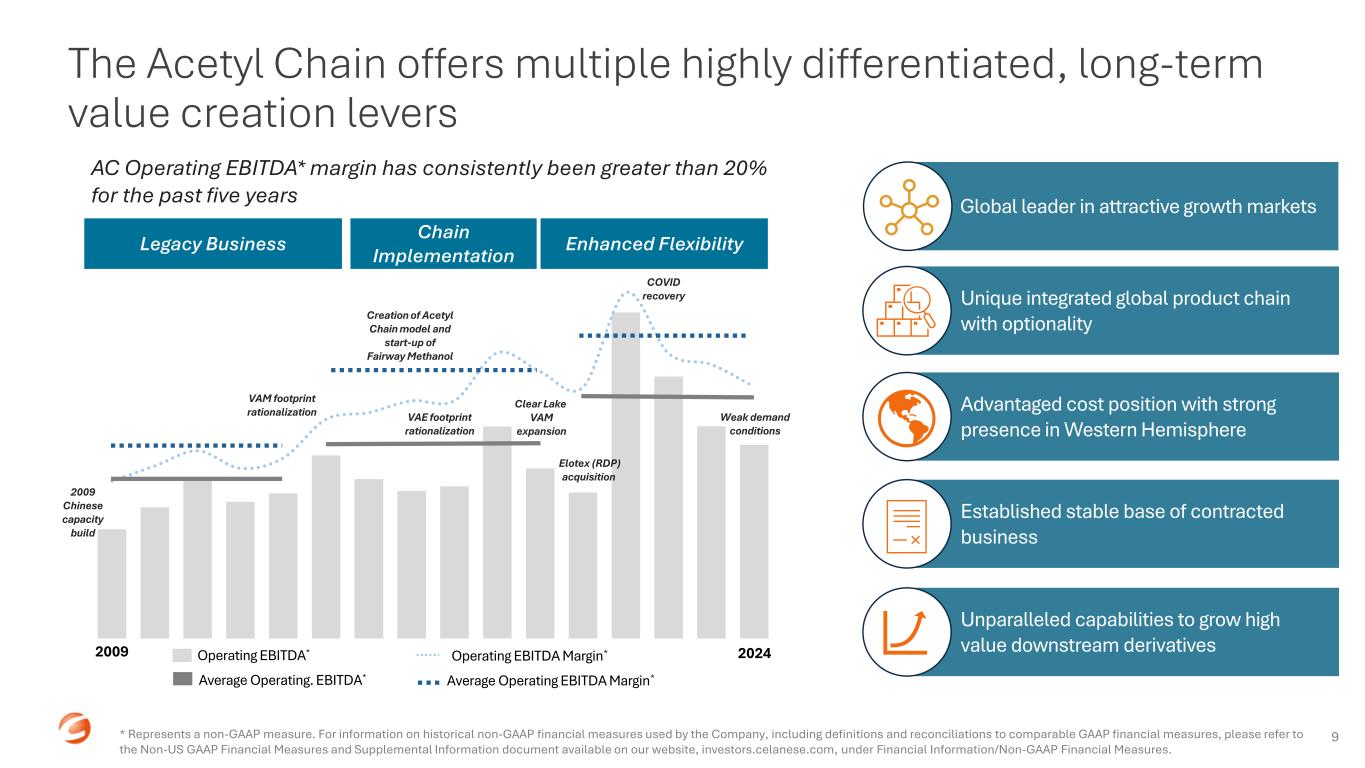
While these results have not met our expectations, we remain confident in the fundamental strengths of our Acetyl Chain operating model and our self-help improvement measures. In every quarter for the past five years, AC operating EBITDA margins were consistently greater than 20 percent, even considering the recent effects of the prolonged demand weakness globally and capacity additions in China.
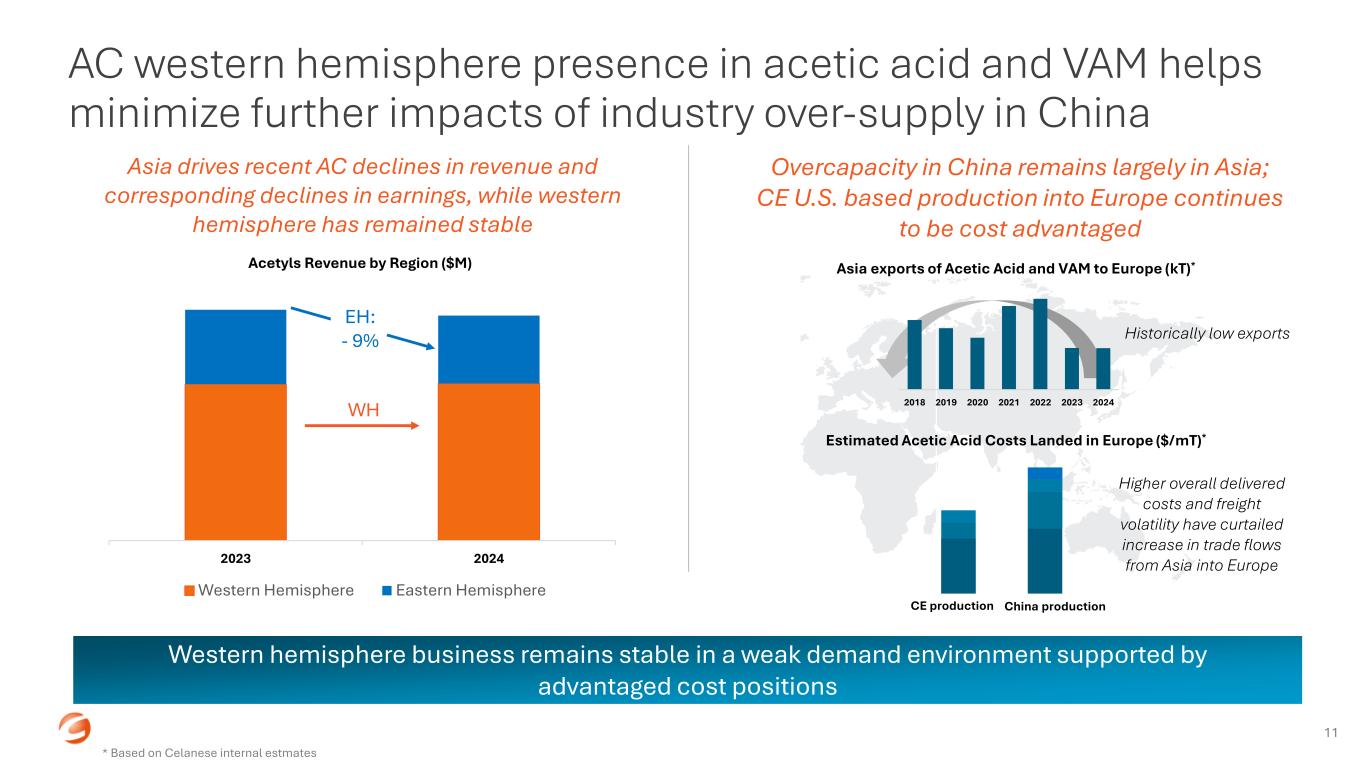
The recent supply additions in China continue to outpace growth in demand, although the effects in the eastern and western hemispheres for the Acetyl Chain are distinctly different. In the eastern hemisphere, the headwinds due to the subdued demand environment has been amplified by regional oversupply and has negatively impacted our margins in Asia. However, industry-wide exports of acetic acid and VAM from Asia into Europe remain at historical lows and exports to the U.S. are negligible. This dynamic is driven by significantly higher landed costs of China-based production compounded by logistical complexities, including greater freight cost volatility driven by sporadic geopolitical escalations. With advantaged cost positions at our Clear Lake plant in the U.S., AC is well positioned to supply and sustain our business in the western hemisphere.
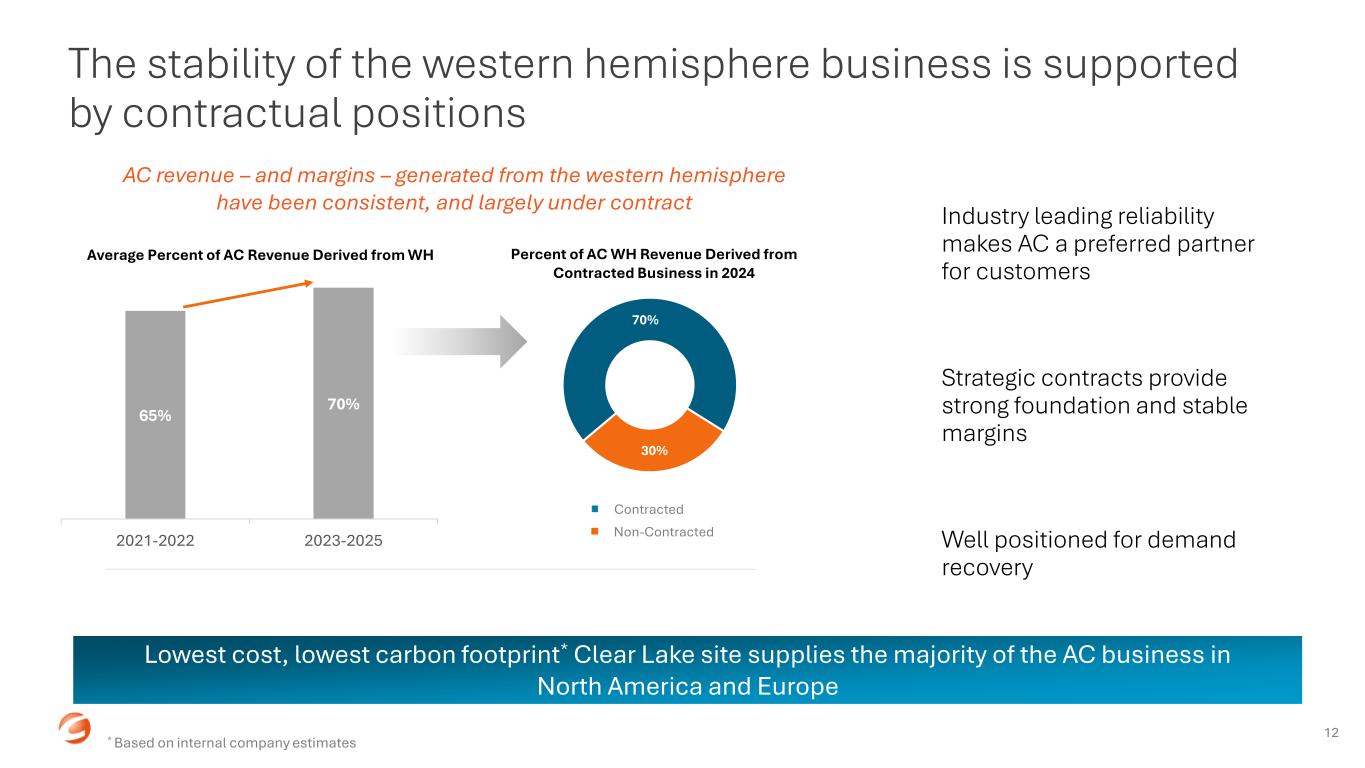
These dynamics are meaningful because the Acetyl Chain has a strong western hemisphere presence. Since 2023, approximately 70 percent of AC's annual revenue each year has come from North America and Europe. On a variable margin basis, the contribution from AC's western hemisphere business is an even greater proportion and has remained relatively stable in recent years despite prolonged demand weakness. Stability in the western hemisphere helps to minimize the impacts to our business from the industry over-supply in China. Additionally, approximately 70 percent of our western hemisphere business is under strategic contracts, providing further stability.
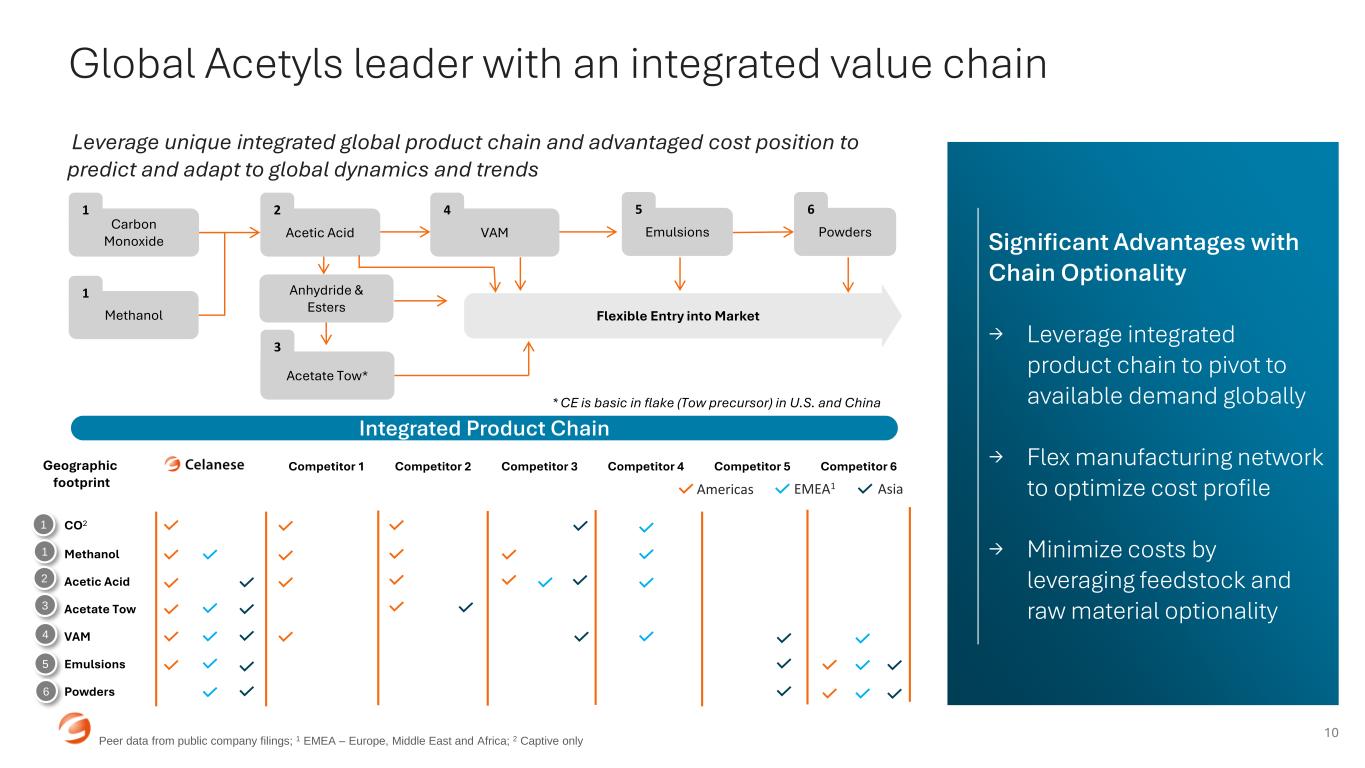
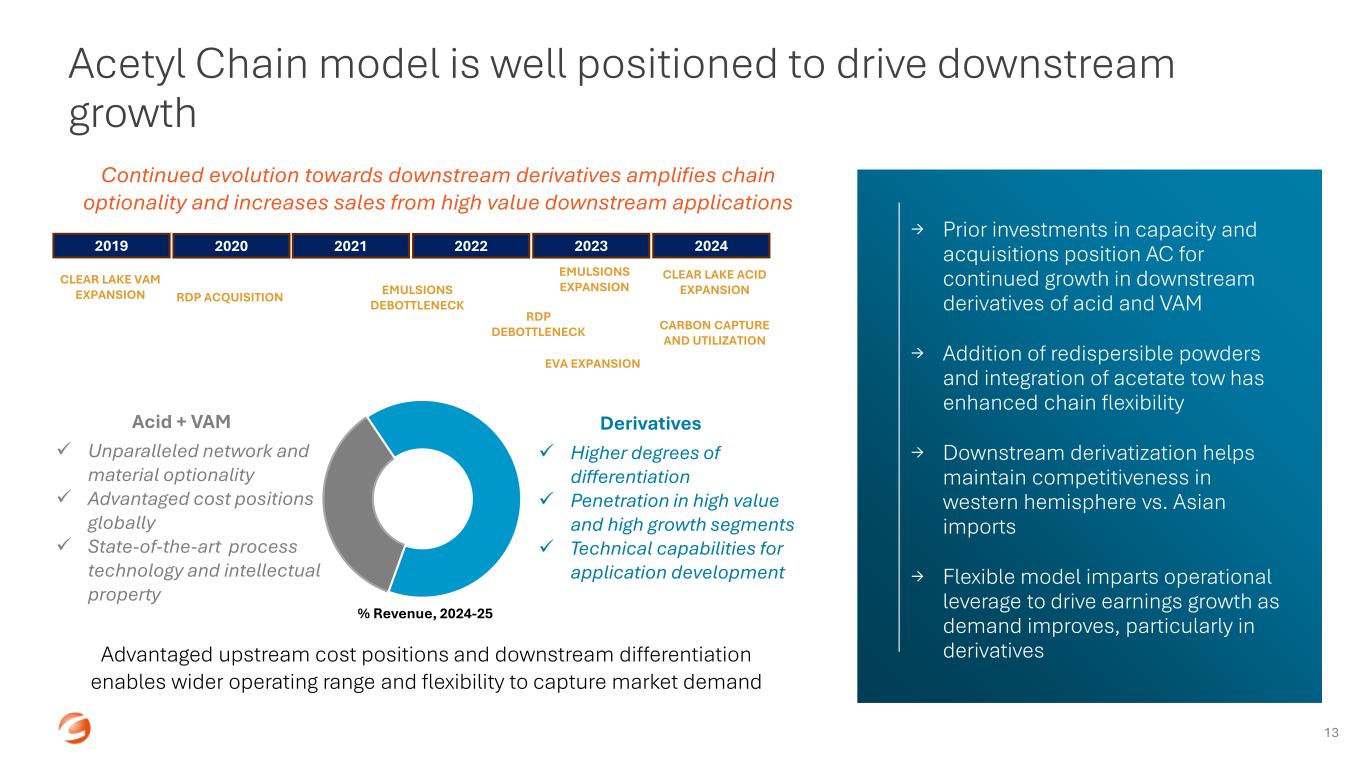
The Acetyl Chain model drives further differentiation through the optionality built over several years, positioning AC for sustained growth in downstream derivatives like emulsions and redispersible powders. This helps maintain competitiveness in both the eastern and western hemisphere by providing wider operating range to capture demand opportunistically, and the flexibility of the model provides operational leverage to drive earnings growth as demand improves. In 2024 and through the first half of 2025, downstream applications have driven approximately 65 percent of AC's revenue, amplifying the Acetyl Chain's optionality and increasing sales from higher value downstream applications.
In looking ahead to the third quarter, we expect lower sequential turnaround costs as well as initial realization of the cost productivity measures previously announced. We anticipate these tailwinds will be partially offset by overall persistent demand softness, including continued weakness in acetate tow, as well as weakness in the eastern hemisphere related to over-supply in China. Given these dynamics, we anticipate third quarter adjusted EBIT of $195 to $215 million, and operating EBITDA of $255 to $275 million.
The AC team intends to leverage the daily operating model to identify pockets of value creation and take action to drive earnings improvement wherever possible. These actions include:
•Continuing to drive downstream product growth, especially in Asia, to improve margins by leveraging chain optionality.
•Maximizing production at our lowest-cost gulf coast assets to drive profitability and reduce cost-to-serve.
•Deploying sustainable products, especially in the western hemisphere, to increase differentiation and grow share of downstream applications.
•Idling our Frankfurt VAM facility until the end of the year, and opportunistically operating our Singapore site in response to external demand signals.
Though the environment is challenging, the hallmark of our AC team is agility and optionality. The Acetyl Chain will continue to leverage the fundamental advantages of the business model, including the low-cost U.S. based asset footprint, and take actions to drive incremental value at every opportunity.
Chuck Kyrish, Celanese Corporation, Senior Vice President and Chief Financial Officer
In the second quarter, our teams made significant progress towards our cash generation and deleveraging plans. As Scott mentioned, we generated $311 million free cash flow during the quarter, driven by sequential improvements in earnings and our focus on cash conversion through reducing working capital. Working capital was an approximate $114 million source of cash in the quarter driven, in part, by our ongoing inventory reduction initiatives. Through our focus on reducing finished goods and raw materials, aligning production rates to demand signals, and optimizing safety stock coverage, we have made meaningful progress in our goal to reduce inventory sustainably. Specifically, inventory reduction was a source of cash of approximately $100 million, demonstrating our intense focus on cash generation for deleveraging, which remains our top priority. At this point, we don't expect a significant earnings impact from our inventory actions for full year 2025.
Our free cash flow in the first half of 2025 exceeded the same period in 2024 by approximately $105 million, or approximately 80 percent. The progress made in the first half meaningfully advances us towards our 2025 free cash flow goals despite the current macroeconomic challenges. We believe we are progressing well against our free cash flow generation target of $700 to $800 million for the full year, assuming no further significant erosion in demand dynamics in our key end markets.
We continue to execute against our deleveraging plan and have successfully completed discrete actions to deploy our free cash flow generation towards debt reduction while maintaining a strong liquidity position:
•In the second quarter, we fully repaid the $200 million balance on our delayed draw term loan, which was set to mature in first quarter of 2026. Additionally, since close of the second quarter, we paid off an incremental $150 million of our remaining five-year term loan due in 2027, reducing the outstanding balance to $330 million. These actions demonstrate prudent utilization of the prepayment flexibility built into our capital structure to support continued deleveraging in a cost effective manner. We will continue to deleverage our balance sheet with cash generation and strategically pay down maturities, balancing several factors such as cost and borrowing rates.
•We have completed a new credit agreement and a new $1.75 billion senior unsecured revolving credit facility, effectively extending our revolver maturity from the third quarter of 2027 to the third quarter of 2030 at the same borrowing cost. This transaction opportunistically extends our strong liquidity position by providing continued flexible access to the credit facility as a short-term bridge on an as-needed basis. At the end of the quarter, our $1.75 billion revolving credit facility was undrawn, and we had $1.2 billion in cash on the balance sheet.
Cash generation remains our top priority, and we continue to target addressing our maturities through 2027 by deploying free cash flow and proceeds from potential divestitures. We also have strong access to the debt capital markets and continue to be opportunistic and prudent in managing our maturity profile considering the seasonality of our annual free cash flow generation and timing of our other cash generation initiatives.
Related to earnings, the effective U.S. GAAP income tax rate was a benefit of 57 percent for the second quarter compared to an expense of 16 percent for the same quarter in 2024. The effective income tax rate for the current period is lower compared to the same period in 2024, primarily due to a net deferred tax benefit related to the relocation of certain intangible assets among wholly owned foreign affiliates as part of continued integration of global principal operations in the three months ended June 30, 2025, and a tax benefit related to the resolution of a review of prior year tax matters. The effective tax rate for adjusted earnings was 9 percent based on expected jurisdictional earnings mix for the full year and consideration of other non-recurring U.S. GAAP items.
Turning to Other activities, we reported a net expense of $66 million in adjusted EBIT and $54 million in operating EBITDA, in-line with our expectations. For the first half, the net expense is approximately 30 percent lower in 2025 vs. first half of 2024 on an adjusted EBIT basis largely reflecting ongoing cost improvement actions executed by our teams.
Shifting focus to divestitures, as Scott previously discussed, we have made good progress in the Micromax® sale process. Additionally, we continue to actively pursue multiple divestitures opportunities of various sizes to advance deleveraging, and our target remains approximately $1 billion in divestitures through 2027.
Since 2020, Celanese has averaged approximately $1 billion in free cash flow each year, and our teams are committed to ensuring that these capabilities remain resilient even in uncertain and challenging environments. Our focus will continue to be on deleveraging the balance sheet and increasing shareholder value.
Scott Richardson, Celanese Corporation, President and Chief Executive Officer
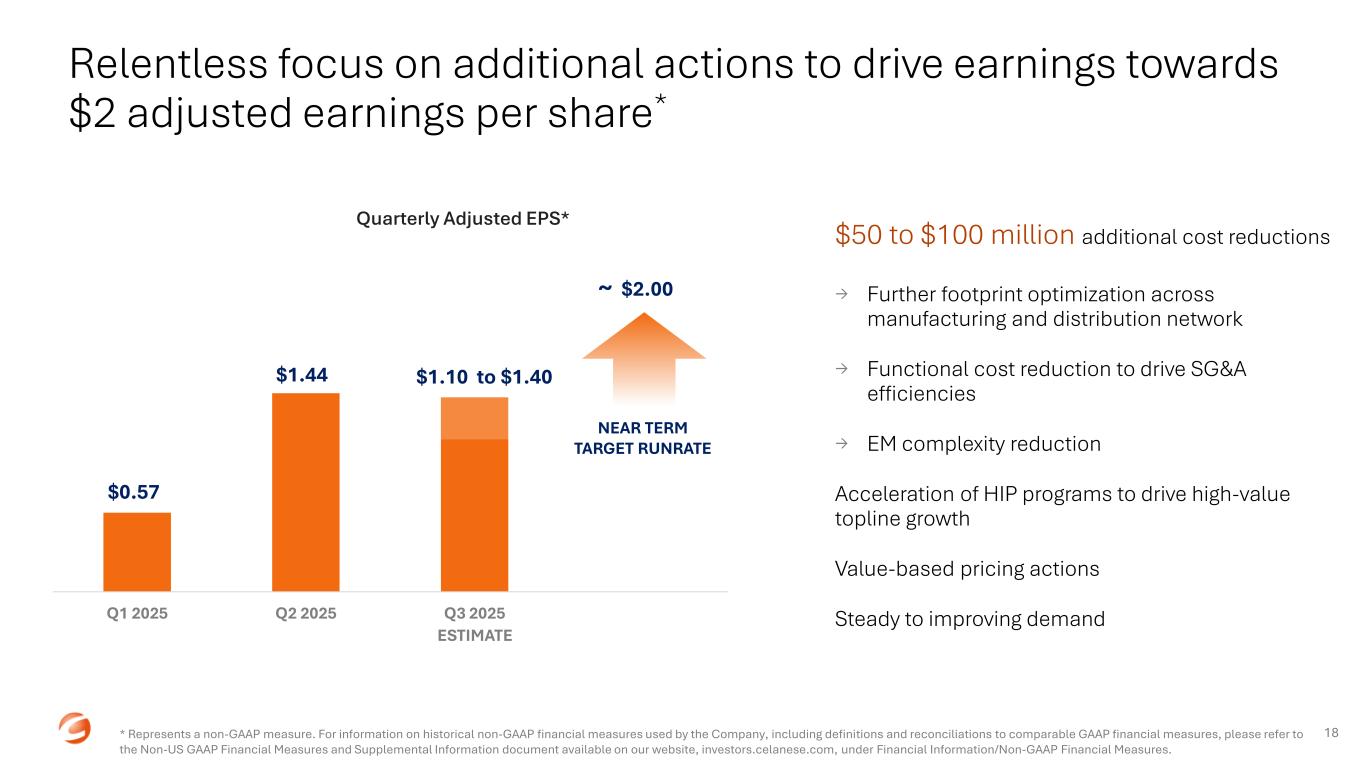
Since the start of the year, cash generation has been our top priority. Our solid results in the second quarter demonstrated our ability to generate cash while strengthening our business through the actions we’ve taken. Given our anticipation of slowing demand through the third quarter, we remain focused on these actions to continue to improve our foundation. The execution of our cost reduction efforts are largely offsetting the demand headwinds. As a result, we expect underlying business performance in the third quarter to be similar to the second quarter, after normalizing the sequential impacts of the anticipated inventory actions in EM. Given this, we anticipate third quarter adjusted earnings to be $1.10 to $1.40 per share.
While macroeconomic conditions in the second half of 2025 are challenging, the Celanese team is exhibiting resilience and is relentlessly focused on identifying and implementing additional actions to drive the run rate of adjusted earnings per share towards $2.00 on a quarterly basis. To that end, our teams are working on new initiatives for realization in 2026. In addition to the cost reduction opportunities that were discussed earlier, we plan to continue to drive productivity, implement discrete pricing actions where possible, execute additional footprint optimization opportunities, and drive growth through our project pipeline model with our focus on HIPs.
As we navigate an uncertain second half of 2025 and beyond, we will continue to execute against our near-term action plans, leverage the unique competitive advantages of our two business models to continue to improve our earnings, and generate cash to accelerate deleveraging. We are confident we are taking the right steps to stabilize our business, right size its cost structure, and position Celanese for long-term, sustainable value creation.
Forward-Looking Statements
These prepared comments may contain "forward-looking statements," which include information concerning the Company's plans, objectives, goals, strategies, future revenues, cash flow, financial performance, synergies, capital expenditures, deleveraging efforts, planned cost reductions, dividend policy, financing needs and other information that is not historical information. All forward-looking statements are based upon current expectations and beliefs and various assumptions. There can be no assurance that the Company will realize these expectations or that these beliefs will prove correct. There are a number of risks and uncertainties that could cause actual results to differ materially from the results expressed or implied in the forward-looking statements contained in these comments. These risks and uncertainties include, among other things: the ability to successfully achieve planned cost reductions; changes in general economic, business, political and regulatory conditions in the countries or regions in which we operate; the length and depth of product and industry business cycles, particularly in the automotive, electrical, textiles, electronics and construction industries; volatility or changes in the price and availability of raw materials and energy, particularly changes in the demand for, supply of, and market prices of ethylene, methanol, natural gas, carbon monoxide, wood pulp, hexamethylene diamine, Polyamide 66 ("PA66"), polybutylene terephthalate, ethanol, natural gas and fuel oil, and the prices for electricity and other energy sources; the ability to pass increases in raw materials prices, logistics costs and other costs on to customers or otherwise improve margins through price increases; the possibility that we will not be able to realize the anticipated benefits of the Mobility & Materials business (the "M&M Business") we acquired from DuPont de Nemours, Inc. (the "M&M Acquisition"), including synergies and growth opportunities, whether as a result of difficulties arising from the operation of the M&M Business or other unanticipated delays, costs, inefficiencies or liabilities; additional impairments of goodwill or intangible assets; increased commercial, legal or regulatory complexity of entering into, or expanding our exposure to, certain end markets and geographies; risks in the global economy and equity and credit markets and their potential impact on our ability to pay down debt in the future and/or refinance at suitable rates, in a timely manner, or at all; risks and costs associated with increased leverage from the M&M Acquisition, including increased interest expense and potential reduction of business and strategic flexibility; the ability to maintain plant utilization rates and to implement planned capacity additions, expansions and maintenance; the ability to reduce or maintain current levels of production costs and to improve productivity by implementing technological improvements to existing plants; increased price competition and the introduction of competing products by other companies; the ability to identify desirable potential acquisition or divestiture opportunities and to complete such transactions, including obtaining regulatory approvals, consistent with the Company's strategy; market acceptance of our products and technology; compliance and other costs and potential disruption or interruption of production or operations due to accidents, interruptions in sources of raw materials, transportation, logistics or supply chain disruptions, cybersecurity incidents, terrorism or political unrest, public health crises, or other unforeseen events or delays in construction or operation of facilities, including as a result of geopolitical conditions, the direct or indirect consequences of acts of war or conflict (such as the Russia-Ukraine conflict or conflicts in the Middle East) or terrorist incidents or as a result of weather, natural disasters, or other crises; the ability to obtain governmental approvals and to construct facilities on terms and schedules acceptable to the Company; changes in applicable tariffs, duties and trade agreements, tax rates or legislation throughout the world including, but not limited to, anti-dumping and countervailing duties, adjustments, changes in estimates or interpretations or the resolution of tax examinations or audits that may impact recorded or future tax impacts and potential regulatory and legislative tax developments in the United States and other jurisdictions; changes in the degree of intellectual property and other legal protection afforded to our products or technologies, or the theft of such intellectual property; potential liability for remedial actions and increased costs under existing or future environmental, health and safety regulations, including those relating to climate change or other sustainability matters; potential liability resulting from pending or future claims or litigation, including investigations or enforcement actions, or from changes in the laws, regulations or policies of governments or other governmental activities, in the countries in which we operate; our level of indebtedness, which could diminish our ability to raise additional capital to fund operations or limit our ability to react to changes in the economy or the chemicals industry, and the success of our deleveraging efforts, as well as any changes to our credit ratings; changes in currency exchange rates and interest rates; tax rates and changes thereto; and various other factors discussed from time to time in the Company's filings with the Securities and Exchange Commission.
Any forward-looking statement speaks only as of the date on which it is made, and the Company undertakes no obligation to update any forward-looking statements to reflect events or circumstances after the date on which it is made or to reflect the occurrence of anticipated or unanticipated events or circumstances.
Results Unaudited
The results in this document, together with the adjustments made to present the results on a comparable basis, have not been audited and are based on internal financial data furnished to management. Quarterly results should not be taken as an indication of the results of operations to be reported for any subsequent period or for the full fiscal year.
Certain prior period amounts have been revised to correct for certain prior period immaterial errors. See Note 1 to our Quarterly Report on Form 10-Q for the quarterly period ending June 30, 2025.
Non-GAAP Financial Measures
These prepared comments, and statements made in connection with these prepared comments, refer to non-GAAP financial measures. For more information on the non-GAAP financial measures used by the Company, including the most directly comparable GAAP financial measure for each non-GAAP financial measure used, including definitions and reconciliations of the differences between such non-GAAP financial measures and the comparable GAAP financial measures, please refer to the Non-US GAAP Financial Measures and Supplemental Information document available on our website, investors.celanese.com, under Financial Information/Financial Document Library.
Non-US GAAP Financial Measures and Supplemental Information
August 11, 2025
In this document, the terms the "Company," "we" and "our" refer to Celanese Corporation and its subsidiaries on a consolidated basis.
Purpose
The purpose of this document is to provide information of interest to investors, analysts and other parties including supplemental financial information and reconciliations and other information concerning our use of non-US GAAP financial measures. This document is updated quarterly.
Presentation
This document presents the Company's two business segments, Engineered Materials and the Acetyl Chain.
Use of Non-US GAAP Financial Measures
From time to time, management may publicly disclose certain numerical "non-GAAP financial measures" in the course of our earnings releases, financial presentations, earnings conference calls, investor and analyst meetings and otherwise. For these purposes, the Securities and Exchange Commission ("SEC") defines a "non-GAAP financial measure" as a numerical measure of historical or future financial performance, financial position or cash flows that excludes amounts, or is subject to adjustments that effectively exclude amounts, included in the most directly comparable measure calculated and presented in accordance with US GAAP, and vice versa for measures that include amounts, or are subject to adjustments that effectively include amounts, that are excluded from the most directly comparable US GAAP measure so calculated and presented. For these purposes, "GAAP" refers to generally accepted accounting principles in the United States.
Non-GAAP financial measures disclosed by management are provided as additional information to investors, analysts and other parties because the Company believes them to be important supplemental measures for assessing our financial and operating results and as a means to evaluate our financial condition and period-to-period comparisons. These non-GAAP financial measures should be viewed as supplemental to, and should not be considered in isolation or as alternatives to, net earnings (loss), operating profit (loss), operating margin, cash flow from operating activities (together with cash flow from investing and financing activities), earnings per share or any other US GAAP financial measure. These non-GAAP financial measures should be considered within the context of our complete audited and unaudited financial results for the given period, which are available on the Financial Information/Financial Document Library page of our website, investors.celanese.com. The definition and method of calculation of the non-GAAP financial measures used herein may be different from other companies' methods for calculating measures with the same or similar titles. Investors, analysts and other parties should understand how another company calculates such non-GAAP financial measures before comparing the other company's non-GAAP financial measures to any of our own. These non-GAAP financial measures may not be indicative of the historical operating results of the Company nor are they intended to be predictive or projections of future results.
Pursuant to the requirements of SEC Regulation G, whenever we refer to a non-GAAP financial measure, we will also present in this document, in the presentation itself or on a Form 8-K in connection with the presentation on the Financial Information/Financial Document Library page of our website, investors.celanese.com, to the extent practicable, the most directly comparable financial measure calculated and presented in accordance with GAAP, along with a reconciliation of the differences between the non-GAAP financial measure we reference and such comparable GAAP financial measure.
This document includes definitions and reconciliations of non-GAAP financial measures used from time to time by the Company.
Specific Measures Used
This document provides information about the following non-GAAP measures: adjusted EBIT, adjusted EBIT margin, operating EBITDA, operating EBITDA margin, operating profit (loss) attributable to Celanese Corporation, adjusted earnings per share, net debt, free cash flow and return on invested capital (adjusted). The most directly comparable financial measure presented in accordance with US GAAP in our consolidated financial statements for adjusted EBIT and operating EBITDA is net earnings (loss) attributable to Celanese Corporation; for adjusted EBIT margin and operating EBITDA margin is operating margin; for operating profit (loss) attributable to Celanese Corporation is operating profit (loss); for adjusted earnings per share is earnings (loss) from continuing operations attributable to Celanese Corporation per common share-diluted; for net debt
is total debt; for free cash flow is net cash provided by (used in) operations; and for return on invested capital (adjusted) is net earnings (loss) attributable to Celanese Corporation divided by the sum of the average of beginning and end of the year short- and long-term debt and Celanese Corporation shareholders' equity.
Definitions
•Adjusted EBIT is a performance measure used by the Company and is defined by the Company as net earnings (loss) attributable to Celanese Corporation, plus (earnings) loss from discontinued operations, less interest income, plus interest expense, plus refinancing expense and taxes, and further adjusted for Certain Items (refer to Table 8). We believe that adjusted EBIT provides transparent and useful information to management, investors, analysts and other parties in evaluating and assessing our primary operating results from period-to-period after removing the impact of unusual, non-operational or restructuring-related activities that affect comparability. Our management recognizes that adjusted EBIT has inherent limitations because of the excluded items. Adjusted EBIT is one of the measures management uses for planning and budgeting, monitoring and evaluating financial and operating results and as a performance metric in the Company's incentive compensation plan. We do not provide reconciliations for adjusted EBIT on a forward-looking basis (including those contained in this document) when we are unable to provide a meaningful or accurate calculation or estimation of reconciling items and the information is not available without unreasonable effort. This is due to the inherent difficulty of forecasting the timing and amount of Certain Items, such as mark-to-market pension gains and losses, that have not yet occurred, are out of our control and/or cannot be reasonably predicted. For the same reasons, we are unable to address the probable significance of the unavailable information. Adjusted EBIT margin is defined by the Company as adjusted EBIT divided by net sales. Adjusted EBIT margin has the same uses and limitations as adjusted EBIT. •Operating EBITDA is a performance measure used by the Company and is defined by the Company as net earnings (loss) attributable to Celanese Corporation, plus (earnings) loss from discontinued operations, less interest income, plus interest expense, plus refinancing expense, taxes and depreciation and amortization, and further adjusted for Certain Items, which Certain Items include accelerated depreciation and amortization expense. Operating EBITDA is equal to adjusted EBIT plus depreciation and amortization. We believe that operating EBITDA provides transparent and useful information to investors, analysts and other parties in evaluating our operating performance relative to our peer companies. We do not provide reconciliations for operating EBITDA on a forward-looking basis (including those contained in this document) when we are unable to provide a meaningful or accurate calculation or estimation of reconciling items and the information is not available without unreasonable effort. This is due to the inherent difficulty of forecasting the timing and amount of Certain Items, such as mark-to-market pension gains and losses, that have not yet occurred, are out of our control and/or cannot be reasonably predicted. For the same reasons, we are unable to address the probable significance of the unavailable information. Operating EBITDA margin is defined by the Company as operating EBITDA divided by net sales. Operating EBITDA margin has the same uses and limitations as operating EBITDA.
•Operating profit (loss) attributable to Celanese Corporation is defined by the Company as operating profit (loss), less earnings (loss) attributable to noncontrolling interests ("NCI"). We believe that operating profit (loss) attributable to Celanese Corporation provides transparent and useful information to management, investors, analysts and other parties in evaluating our core operational performance. Operating margin attributable to Celanese Corporation is defined by the Company as operating profit (loss) attributable to Celanese Corporation divided by net sales. Operating margin attributable to Celanese Corporation has the same uses and limitations as operating profit (loss) attributable to Celanese Corporation.
•Adjusted earnings per share is a performance measure used by the Company and is defined by the Company as earnings (loss) from continuing operations attributable to Celanese Corporation, adjusted for income tax (provision) benefit, Certain Items, and refinancing and related expenses, divided by the number of basic common shares and dilutive restricted stock units and stock options calculated using the treasury method. We believe that adjusted earnings per share provides transparent and useful information to management, investors, analysts and other parties in evaluating and assessing our primary operating results from period-to-period after removing the impact of the above stated items that affect comparability and as a performance metric in the Company's incentive compensation plan. We do not provide reconciliations for adjusted earnings per share on a forward-looking basis (including those contained in this document) when we are unable to provide a meaningful or accurate calculation or estimation of reconciling items and the information is not available without unreasonable effort. This is due to the inherent difficulty of forecasting the timing and amount of Certain Items, such as mark-to-market pension gains and losses, that have not yet occurred, are out of our control and/or cannot be reasonably predicted. For the same reasons, we are unable to address the probable significance of the unavailable information.
Note: The income tax expense (benefit) on Certain Items ("Non-GAAP adjustments") is determined using the applicable rates in the taxing jurisdictions in which the Non-GAAP adjustments occurred and includes both current and deferred income tax expense (benefit). The income tax rate used for adjusted earnings per share approximates the midpoint in a range of forecasted tax rates for the year. This range may include certain partial or full-year forecasted tax opportunities and related costs, where applicable, and specifically excludes changes in uncertain tax positions, discrete recognition of GAAP items on a quarterly basis, other pre-tax items adjusted out of our GAAP earnings for adjusted earnings per share purposes and changes in management's assessments regarding the ability to realize deferred tax assets for GAAP. In determining the adjusted earnings per share tax rate, we reflect the impact of foreign tax credits when utilized, or expected to be utilized, absent discrete events impacting the timing of foreign tax credit utilization. We analyze this rate quarterly and adjust it if there is a material change in the range of forecasted tax rates; an updated forecast would not necessarily result in a change to our tax rate used for adjusted earnings per share. The adjusted tax rate is an estimate and may differ from the actual tax rate used for GAAP reporting in any given reporting period. Table 3a summarizes the reconciliation of our estimated GAAP effective tax rate to the adjusted tax
rate. The estimated GAAP rate excludes discrete recognition of GAAP items due to our inability to forecast such items. As part of the year-end reconciliation, we will update the reconciliation of the GAAP effective tax rate to the adjusted tax rate for actual results.
•Free cash flow is a liquidity measure used by the Company and is defined by the Company as net cash provided by (used in) operations, less capital expenditures on property, plant and equipment, and adjusted for contributions from or distributions to our NCI joint ventures. We believe that free cash flow provides useful information to management, investors, analysts and other parties in evaluating the Company's liquidity and credit quality assessment because it provides an indication of the long-term cash generating ability of our business. Although we use free cash flow as a measure to assess the liquidity generated by our business, the use of free cash flow has important limitations, including that free cash flow does not reflect the cash requirements necessary to service our indebtedness, lease obligations, unconditional purchase obligations or pension and postretirement funding obligations. Free cash flow is not a measure of cash available for discretionary expenditures since the Company has certain debt service and finance lease payments that are not deducted from that measure. We do not provide reconciliations for free cash flow on a forward-looking basis when we are unable to provide a meaningful or accurate calculation or estimation of reconciling items and the information is not available without unreasonable effort. This is due to the inherent difficulty of forecasting the timing and amount of items such as working capital changes, fluctuations in foreign currency exchange rates, the impact and timing of potential acquisitions and divestitures, and other structural changes, that have not yet occurred, are out of our control and/or cannot be reasonably predicted. For the same reasons, we are unable to address the probable significance of the unavailable information.
•Net debt is defined by the Company as total debt less cash and cash equivalents. We believe that net debt provides useful information to management, investors, analysts and other parties in evaluating changes to the Company's capital structure and credit quality assessment.
•Return on invested capital (adjusted) is defined by the Company as adjusted EBIT, tax effected using the adjusted tax rate, divided by the sum of the average of beginning and end of the year short- and long-term debt and Celanese Corporation shareholders' equity. We believe that return on invested capital (adjusted) provides useful information to management, investors, analysts and other parties in order to assess our income generation from the point of view of our shareholders and creditors who provide us with capital in the form of equity and debt and whether capital invested in the Company yields competitive returns.
Supplemental Information
Supplemental Information we believe to be of interest to investors, analysts and other parties includes the following:
•Net sales for each of our business segments and the percentage increase or decrease in net sales attributable to price, volume, currency and other factors for each of our business segments.
•Cash dividends received from our equity investments.
•For those consolidated ventures in which the Company owns or is exposed to less than 100% of the economics, the outside shareholders' interests are shown as NCI. Amounts referred to as "attributable to Celanese Corporation" are net of any applicable NCI.
Results Unaudited
The results in this document, together with the adjustments made to present the results on a comparable basis, have not been audited and are based on internal financial data furnished to management. Quarterly results should not be taken as an indication of the results of operations to be reported for any subsequent period or for the full fiscal year.
Certain prior period amounts have been revised to correct for certain prior period immaterial errors. See Note 1 to our Quarterly Report on Form 10-Q for the quarterly period ending June 30, 2025.
Table 1
Adjusted EBIT and Operating EBITDA - Reconciliation of Non-GAAP Measures - Unaudited
| | | | | | | | | | | | | | | | | | | | | | | | | | | | | | | | | | | | | | | | | | | | | | | |
| | | | | | | Q2 '25 | | Q1 '25 | | 2024 | | Q4 '24 | | Q3 '24 | | Q2 '24 | | Q1 '24 |
| | | | | | | (In $ millions) |
| Net earnings (loss) attributable to Celanese Corporation | | | | | | | 199 | | | (21) | | | (1,531) | | | (1,923) | | | 116 | | | 155 | | | 121 | |
| (Earnings) loss from discontinued operations | | | | | | | 10 | | | 5 | | | 8 | | | 5 | | | 2 | | | 1 | | | — | |
| Interest income | | | | | | | (7) | | | (4) | | | (33) | | | (5) | | | (5) | | | (10) | | | (13) | |
| Interest expense | | | | | | | 177 | | | 170 | | | 676 | | | 164 | | | 169 | | | 174 | | | 169 | |
| Refinancing expense | | | | | | | — | | | 32 | | | — | | | — | | | — | | | — | | | — | |
| Income tax provision (benefit) | | | | | | | (77) | | | 9 | | | 507 | | | 384 | | | 61 | | | 29 | | | 33 | |
Certain Items attributable to Celanese Corporation (Table 8) | | | | | | | 42 | | | 43 | | | 2,009 | | | 1,696 | | | 114 | | | 102 | | | 97 | |
| Adjusted EBIT | | | | | | | 344 | | | 234 | | | 1,636 | | | 321 | | | 457 | | | 451 | | | 407 | |
Depreciation and amortization expense(1) | | | | | | | 188 | | | 180 | | | 728 | | | 184 | | | 187 | | | 181 | | | 176 | |
| Operating EBITDA | | | | | | | 532 | | | 414 | | | 2,364 | | | 505 | | | 644 | | | 632 | | | 583 | |
| | | | | | | | | | | | | | | | | | | | | | | | | | | | | | | | | | | | | | | | | | | | | | | |
| | | | | | | Q2 '25 | | Q1 '25 | | 2024 | | Q4 '24 | | Q3 '24 | | Q2 '24 | | Q1 '24 |
| | | | | | | (In $ millions) |
| Engineered Materials | | | | | | | 2 | | | — | | | 73 | | | 1 | | | 16 | | | 11 | | | 45 | |
| | | | | | | | | | | | | | | | | | | |
| Acetyl Chain | | | | | | | — | | | — | | | — | | | — | | | — | | | — | | | — | |
Other Activities(2) | | | | | | | — | | | — | | | — | | | — | | | — | | | — | | | — | |
| Accelerated depreciation and amortization expense | | | | | | | 2 | | | — | | | 73 | | | 1 | | | 16 | | | 11 | | | 45 | |
Depreciation and amortization expense(1) | | | | | | | 188 | | | 180 | | | 728 | | | 184 | | | 187 | | | 181 | | | 176 | |
| Total depreciation and amortization expense | | | | | | | 190 | | | 180 | | | 801 | | | 185 | | | 203 | | | 192 | | | 221 | |
______________________________
(1)Excludes accelerated depreciation and amortization expense as detailed in the table above, which amounts are included in Certain Items above.
(2)Other Activities includes corporate Selling, general and administrative ("SG&A") expenses, results of captive insurance companies and certain components of net periodic benefit cost (interest cost, expected return on plan assets and net actuarial gains and losses).
Table 2
Supplemental Segment Data and Reconciliation of Segment Adjusted EBIT and Operating EBITDA - Non-GAAP Measures - Unaudited
| | | | | | | | | | | | | | | | | | | | | | | | | | | | | | | | | | | | | | | | | | | | | | | | | | | | | | | | | | | | | | | | | | | | | | | | | | | | | | | | | | | | | | | | | | | | | | | |
| | | | | | | Q2 '25 | | Q1 '25 | | 2024 | | Q4 '24 | | Q3 '24 | | Q2 '24 | | Q1 '24 |
| | | | | | | | | | | | | (In $ millions, except percentages) |
| | | | | | | | | | | | | | | | | | | | | | | | | | | | | | | | | | | | | | | |
| | | | | | | | | | | | | | | | | | | | | | | | | | | | | | | | | | | | | | | |
| | | | | | | | | | | | | | | | | | | | | | | | | | | | | | | | | | | | | | | |
| | | | | | | | | | | | | | | | | | | | | | | | | | | | | | | | | | | | | | | |
| | | | | | | | | | | | | | | | | | | | | | | | | | | | | | | | | | | | | | | |
| | | | | | | | | | | | | | | | | | | | | | | | | | | | | | | | | | | | | | | |
| | | | | | | | | | | | | | | | | | | | | | | | | | | | | | | | | | | | | | | |
| | | | | | | | | | | | | | | | | | | | | | | | | | | | | | | | | | | | | | | |
| | | | | | | | | | | | | | | | | | | | | | | | | | | | | | | | | | | | | | | |
| | | | | | | | | | | | | | | | | | | | | | | | | | | | | | | | | | | | | | | |
| | | | | | | | | | | | | | | | | | | | | | | | | | | | | | | | | | | | | | | |
| | | | | | | | | | | | | | | | | | | | | | | | | | | | | | | | | | | | | | | |
| | | | | | | | | | | | | | | | | | | | | | | | | | | | | | | | | | | | | | | |
| | | | | | | | | | | | | | | | | | | | | | | | | | | | | | | | | | | | | | | |
| | | | | | | | | | | | | | | | | | | | | | | | | | | | | | | | | | | | | | | |
| | | | | | | | | | | | | | | | | | | | | | | | | | | | | | | | | | | | | | | |
| Operating Profit (Loss) / Operating Margin | | | | | | | | | | | | | | | | | | | | |
| Engineered Materials | | | | | | | | | | | | | 165 | | | 11.4 | % | | 96 | | | 7.5 | % | | (1,191) | | | (21.3) | % | | (1,520) | | | (119.8) | % | | 102 | | | 6.9 | % | | 138 | | | 9.4 | % | | 89 | | | 6.5 | % |
| | | | | | | | | | | | | | | | | | | | | | | | | | | | | | | | | | | | | | | |
| Acetyl Chain | | | | | | | | | | | | | 154 | | | 13.8 | % | | 162 | | | 14.5 | % | | 951 | | | 20.0 | % | | 216 | | | 19.5 | % | | 239 | | | 20.1 | % | | 242 | | | 20.1 | % | | 254 | | | 20.1 | % |
Other Activities(1) | | | | | | | | | | | | | (86) | | | | | (90) | | | | | (469) | | | | | (113) | | | | | (93) | | | | | (130) | | | | | (133) | | | |
| Total | | | | | | | | | | | | | 233 | | | 9.2 | % | | 168 | | | 7.0 | % | | (709) | | | (6.9) | % | | (1,417) | | | (60.1) | % | | 248 | | | 9.4 | % | | 250 | | | 9.4 | % | | 210 | | | 8.0 | % |
| Less: Net Earnings (Loss) Attributable to NCI for Engineered Materials | | | | | | | | | | | | | 1 | | | | | 2 | | | | | (1) | | | | | 2 | | | | | 2 | | | | | (4) | | | | | (1) | | | |
| Less: Net Earnings (Loss) Attributable to NCI for Acetyl Chain | | | | | | | | | | | | | 2 | | | | | 2 | | | | | 9 | | | | | 1 | | | | | 2 | | | | | 2 | | | | | 4 | | | |
| | | | | | | | | | | | | | | | | | | | | | | | | | | | | | | | | | | | | | | |
| Operating Profit (Loss) Attributable to Celanese Corporation | | | | | | | | | | | | | 230 | | | 9.1 | % | | 164 | | | 6.9 | % | | (717) | | | (7.0) | % | | (1,420) | | | (60.2) | % | | 244 | | | 9.2 | % | | 252 | | | 9.5 | % | | 207 | | | 7.9 | % |
| Operating Profit (Loss) / Operating Margin Attributable to Celanese Corporation | | | | | | | | | | | | | | | | | | | | |
| Engineered Materials | | | | | | | | | | | | | 164 | | | 11.4 | % | | 94 | | | 7.3 | % | | (1,190) | | | (21.3) | % | | (1,522) | | | (119.9) | % | | 100 | | | 6.8 | % | | 142 | | | 9.7 | % | | 90 | | | 6.5 | % |
| | | | | | | | | | | | | | | | | | | | | | | | | | | | | | | | | | | | | | | |
| | | | | | | | | | | | | | | | | | | | | | | | | | | | | | | | | | | | | | | |
| | | | | | | | | | | | | | | | | | | | | | | | | | | | | | | | | | | | | | | |
| | | | | | | | | | | | | | | | | | | | | | | | | | | | | | | | | | | | | | | |
| | | | | | | | | | | | | | | | | | | | | | | | | | | | | | | | | | | | | | | |
| Acetyl Chain | | | | | | | | | | | | | 152 | | | 13.6 | % | | 160 | | | 14.3 | % | | 942 | | | 19.8 | % | | 215 | | | 19.4 | % | | 237 | | | 19.9 | % | | 240 | | | 20.0 | % | | 250 | | | 19.8 | % |
Other Activities(1) | | | | | | | | | | | | | (86) | | | | | (90) | | | | | (469) | | | | | (113) | | | | | (93) | | | | | (130) | | | | | (133) | | | |
| Total | | | | | | | | | | | | | 230 | | | 9.1 | % | | 164 | | | 6.9 | % | | (717) | | | (7.0) | % | | (1,420) | | | (60.2) | % | | 244 | | | 9.2 | % | | 252 | | | 9.5 | % | | 207 | | | 7.9 | % |
| Equity Earnings and Dividend Income, Other Income (Expense) Attributable to Celanese Corporation | | | | | | | | | | | | | | | | | | | | |
| Engineered Materials | | | | | | | | | | | | | 25 | | | | | 17 | | | | | 178 | | | | | 33 | | | | | 46 | | | | | 49 | | | | | 50 | | | |
| | | | | | | | | | | | | | | | | | | | | | | | | | | | | | | | | | | | | | | |
| | | | | | | | | | | | | | | | | | | | | | | | | | | | | | | | | | | | | | | |
| | | | | | | | | | | | | | | | | | | | | | | | | | | | | | | | | | | | | | | |
| | | | | | | | | | | | | | | | | | | | | | | | | | | | | | | | | | | | | | | |
| Acetyl Chain | | | | | | | | | | | | | 43 | | | | | 3 | | | | | 138 | | | | | 35 | | | | | 34 | | | | | 33 | | | | | 36 | | | |
Other Activities(1) | | | | | | | | | | | | | 3 | | | | | 5 | | | | | 48 | | | | | 4 | | | | | 16 | | | | | 13 | | | | | 15 | | | |
| Total | | | | | | | | | | | | | 71 | | | | | 25 | | | | | 364 | | | | | 72 | | | | | 96 | | | | | 95 | | | | | 101 | | | |
Non-Operating Pension and Other Post-Retirement Employee Benefit (Expense) Income Attributable to Celanese
Corporation | | | | | | | | | | | | | | | | | | | | |
| Engineered Materials | | | | | | | | | | | | | — | | | | | — | | | | | 8 | | | | | 8 | | | | | — | | | | | — | | | | | — | | | |
| | | | | | | | | | | | | | | | | | | | | | | | | | | | | | | | | | | | | | | |
| | | | | | | | | | | | | | | | | | | | | | | | | | | | | | | | | | | | | | | |
| | | | | | | | | | | | | | | | | | | | | | | | | | | | | | | | | | | | | | | |
| | | | | | | | | | | | | | | | | | | | | | | | | | | | | | | | | | | | | | | |
| Acetyl Chain | | | | | | | | | | | | | — | | | | | — | | | | | — | | | | | — | | | | | — | | | | | — | | | | | — | | | |
Other Activities(1) | | | | | | | | | | | | | 1 | | | | | 2 | | | | | (28) | | | | | (35) | | | | | 3 | | | | | 2 | | | | | 2 | | | |
| Total | | | | | | | | | | | | | 1 | | | | | 2 | | | | | (20) | | | | | (27) | | | | | 3 | | | | | 2 | | | | | 2 | | | |
| | | | | | | | | | | | | | | | | | | | | | | | | | | | | | | | | | | | | | | |
| | | | | | | | | | | | | | | | | | | | | | | | | | | | | | | | | | | | | | | |
| | | | | | | | | | | | | | | | | | | | | | | | | | | | | | | | | | | | | | | |
| | | | | | | | | | | | | | | | | | | | | | | | | | | | | | | | | | | | | | | |
| | | | | | | | | | | | | | | | | | | | | | | | | | | | | | | | | | | | | | | |
| | | | | | | | | | | | | | | | | | | | | | | | | | | | | | | | | | | | | | | |
Certain Items Attributable to Celanese Corporation (Table 8) | | | | | | | | | | | | | | | | | | | | | | | | | | | | | | | | | | | | | | | |
| Engineered Materials | | | | | | | | | | | | | 25 | | | | | 15 | | | | | 1,851 | | | | | 1,625 | | | | | 91 | | | | | 74 | | | | | 61 | | | |
| | | | | | | | | | | | | | | | | | | | | | | | | | | | | | | | | | | | | | | |
| | | | | | | | | | | | | | | | | | | | | | | | | | | | | | | | | | | | | | | |
| | | | | | | | | | | | | | | | | | | | | | | | | | | | | | | | | | | | | | | |
| | | | | | | | | | | | | | | | | | | | | | | | | | | | | | | | | | | | | | | |
| Acetyl Chain | | | | | | | | | | | | | 1 | | | | | 5 | | | | | 22 | | | | | 3 | | | | | 5 | | | | | 4 | | | | | 10 | | | |
Other Activities(1) | | | | | | | | | | | | | 16 | | | | | 23 | | | | | 136 | | | | | 68 | | | | | 18 | | | | | 24 | | | | | 26 | | | |
| Total | | | | | | | | | | | | | 42 | | | | | 43 | | | | | 2,009 | | | | | 1,696 | | | | | 114 | | | | | 102 | | | | | 97 | | | |
Adjusted EBIT / Adjusted EBIT Margin | | | | | | | | | | | | | | | | | | | | |
| Engineered Materials | | | | | | | | | | | | | 214 | | | 14.8 | % | | 126 | | | 9.8 | % | | 847 | | | 15.1 | % | | 144 | | | 11.3 | % | | 237 | | | 16.0 | % | | 265 | | | 18.1 | % | | 201 | | | 14.6 | % |
| | | | | | | | | | | | | | | | | | | | | | | | | | | | | | | | | | | | | | | |
| | | | | | | | | | | | | | | | | | | | | | | | | | | | | | | | | | | | | | | |
| | | | | | | | | | | | | | | | | | | | | | | | | | | | | | | | | | | | | | | |
| | | | | | | | | | | | | | | | | | | | | | | | | | | | | | | | | | | | | | | |
| | | | | | | | | | | | | | | | | | | | | | | | | | | | | | | | | | | | | | | |
| Acetyl Chain | | | | | | | | | | | | | 196 | | | 17.6 | % | | 168 | | | 15.1 | % | | 1,102 | | | 23.1 | % | | 253 | | | 22.8 | % | | 276 | | | 23.2 | % | | 277 | | | 23.0 | % | | 296 | | | 23.5 | % |
Other Activities(1) | | | | | | | | | | | | | (66) | | | | | (60) | | | | | (313) | | | | | (76) | | | | | (56) | | | | | (91) | | | | | (90) | | | |
| Total | | | | | | | | | | | | | 344 | | | 13.6 | % | | 234 | | | 9.8 | % | | 1,636 | | | 15.9 | % | | 321 | | | 13.6 | % | | 457 | | | 17.3 | % | | 451 | | | 17.0 | % | | 407 | | | 15.6 | % |
___________________________
(1)Other Activities includes corporate SG&A expenses, results of captive insurance companies and certain components of net periodic benefit cost (interest cost, expected return on plan assets and net actuarial gains and losses).
Table 2
Supplemental Segment Data and Reconciliation of Segment Adjusted EBIT and Operating EBITDA - Non-GAAP Measures - Unaudited (cont.)
| | | | | | | | | | | | | | | | | | | | | | | | | | | | | | | | | | | | | | | | | | | | | | | | | | | | | | | | | | | | | | | | | | | | | | | | | | | | | | | | | | | | | | | | | | | | | | | |
| | | | | | | Q2 '25 | | Q1 '25 | | 2024 | | Q4 '24 | | Q3 '24 | | Q2 '24 | | Q1 '24 |
| | | | | | | | | | | | | (In $ millions, except percentages) |
| | | | | | | | | | | | | | | | | | | | | | | | | | | | | | | | | | | | | | | |
| | | | | | | | | | | | | | | | | | | | | | | | | | | | | | | | | | | | | | | |
| | | | | | | | | | | | | | | | | | | | | | | | | | | | | | | | | | | | | | | |
| | | | | | | | | | | | | | | | | | | | | | | | | | | | | | | | | | | | | | | |
| | | | | | | | | | | | | | | | | | | | | | | | | | | | | | | | | | | | | | | |
| | | | | | | | | | | | | | | | | | | | | | | | | | | | | | | | | | | | | | | |
| | | | | | | | | | | | | | | | | | | | | | | | | | | | | | | | | | | | | | | |
| | | | | | | | | | | | | | | | | | | | | | | | | | | | | | | | | | | | | | | |
| | | | | | | | | | | | | | | | | | | | | | | | | | | | | | | | | | | | | | | |
| | | | | | | | | | | | | | | | | | | | | | | | | | | | | | | | | | | | | | | |
| | | | | | | | | | | | | | | | | | | | | | | | | | | | | | | | | | | | | | | |
| | | | | | | | | | | | | | | | | | | | | | | | | | | | | | | | | | | | | | | |
| | | | | | | | | | | | | | | | | | | | | | | | | | | | | | | | | | | | | | | |
| | | | | | | | | | | | | | | | | | | | | | | | | | | | | | | | | | | | | | | |
| | | | | | | | | | | | | | | | | | | | | | | | | | | | | | | | | | | | | | | |
| | | | | | | | | | | | | | | | | | | | | | | | | | | | | | | | | | | | | | | |
| | | | | | | | | | | | | | | | | | | | | | | | | | | | | | | | | | | | | | | |
| | | | | | | | | | | | | | | | | | | | | | | | | | | | | | | | | | | | | | | |
| | | | | | | | | | | | | | | | | | | | | | | | | | | | | | | | | | | | | | | |
| | | | | | | | | | | | | | | | | | | | | | | | | | | | | | | | | | | | | | | |
Depreciation and Amortization Expense(1) | | | | | | | | | | | | | | | | | | | | |
| Engineered Materials | | | | | | | | | | | | | 112 | | | | | 109 | | | | | 437 | | | | | 114 | | | | | 111 | | | | | 110 | | | | | 102 | | | |
| | | | | | | | | | | | | | | | | | | | | | | | | | | | | | | | | | | | | | | |
| | | | | | | | | | | | | | | | | | | | | | | | | | | | | | | | | | | | | | | |
| | | | | | | | | | | | | | | | | | | | | | | | | | | | | | | | | | | | | | | |
| | | | | | | | | | | | | | | | | | | | | | | | | | | | | | | | | | | | | | | |
| Acetyl Chain | | | | | | | | | | | | | 64 | | | | | 61 | | | | | 244 | | | | | 63 | | | | | 63 | | | | | 61 | | | | | 57 | | | |
Other Activities(2) | | | | | | | | | | | | | 12 | | | | | 10 | | | | | 47 | | | | | 7 | | | | | 13 | | | | | 10 | | | | | 17 | | | |
| Total | | | | | | | | | | | | | 188 | | | | | 180 | | | | | 728 | | | | | 184 | | | | | 187 | | | | | 181 | | | | | 176 | | | |
Operating EBITDA / Operating EBITDA Margin | | | | | | | | | | | | | | | | | | | | |
| Engineered Materials | | | | | | | | | | | | | 326 | | | 22.6 | % | | 235 | | | 18.3 | % | | 1,284 | | | 22.9 | % | | 258 | | | 20.3 | % | | 348 | | | 23.5 | % | | 375 | | | 25.6 | % | | 303 | | | 22.0 | % |
| | | | | | | | | | | | | | | | | | | | | | | | | | | | | | | | | | | | | | | |
| | | | | | | | | | | | | | | | | | | | | | | | | | | | | | | | | | | | | | | |
| | | | | | | | | | | | | | | | | | | | | | | | | | | | | | | | | | | | | | | |
| | | | | | | | | | | | | | | | | | | | | | | | | | | | | | | | | | | | | | | |
| | | | | | | | | | | | | | | | | | | | | | | | | | | | | | | | | | | | | | | |
| Acetyl Chain | | | | | | | | | | | | | 260 | | | 23.3 | % | | 229 | | | 20.5 | % | | 1,346 | | | 28.3 | % | | 316 | | | 28.5 | % | | 339 | | | 28.5 | % | | 338 | | | 28.1 | % | | 353 | | | 28.0 | % |
Other Activities(2) | | | | | | | | | | | | | (54) | | | | | (50) | | | | | (266) | | | | | (69) | | | | | (43) | | | | | (81) | | | | | (73) | | | |
| Total | | | | | | | | | | | | | 532 | | | 21.0 | % | | 414 | | | 17.3 | % | | 2,364 | | | 23.0 | % | | 505 | | | 21.4 | % | | 644 | | | 24.3 | % | | 632 | | | 23.8 | % | | 583 | | | 22.3 | % |
___________________________
(1)Excludes accelerated depreciation and amortization expense, which amounts are included in Certain Items above. See Table 1 for details. (2)Other Activities includes corporate SG&A expenses, results of captive insurance companies and certain components of net periodic benefit cost (interest cost, expected return on plan assets and net actuarial gains and losses).
Table 3
Adjusted Earnings (Loss) per Share - Reconciliation of a Non-GAAP Measure - Unaudited
| | | | | | | | | | | | | | | | | | | | | | | | | | | | | | | | | | | | | | | | | | | | | | | | | | | | | | | | | | | | | | | | | | | | | | | | | | | | | | | | | | | | | | | | | | | | | | | |
| | | | | | | Q2 '25 | | Q1 '25 | | 2024 | | Q4 '24 | | Q3 '24 | | Q2 '24 | | Q1 '24 |
| | | | | | | | | | | | | | | per share | | | | per share | | | | per share | | | | per share | | | | per share | | | | per share | | | | per share |
| | | | | | | | | | | | | (In $ millions, except per share data) |
| Earnings (loss) from continuing operations attributable to Celanese Corporation | | | | | | | | | | | | | 209 | | | 1.90 | | | (16) | | | (0.15) | | | (1,523) | | | (13.94) | | | (1,918) | | | (17.54) | | | 118 | | | 1.08 | | | 156 | | | 1.42 | | | 121 | | | 1.10 | |
| Income tax provision (benefit) | | | | | | | | | | | | | (77) | | | | | 9 | | | | | 507 | | | | | 384 | | | | | 61 | | | | | 29 | | | | | 33 | | | |
| Earnings (loss) from continuing operations before tax | | | | | | | | | | | | | 132 | | | | | (7) | | | | | (1,016) | | | | | (1,534) | | | | | 179 | | | | | 185 | | | | | 154 | | | |
Certain Items attributable to Celanese Corporation (Table 8) | | | | | | | | | | | | | 42 | | | | | 43 | | | | | 2,009 | | | | | 1,696 | | | | | 114 | | | | | 102 | | | | | 97 | | | |
| Refinancing and related expenses | | | | | | | | | | — | | | | 32 | | | | — | | | | | — | | | | | — | | | | | — | | | | | — | | | |
| Adjusted earnings (loss) from continuing operations before tax | | | | | | | | | | | | | 174 | | | | | 68 | | | | | 993 | | | | | 162 | | | | | 293 | | | | | 287 | | | | | 251 | | | |
Income tax (provision) benefit on adjusted earnings(1) | | | | | | | | | | | | | (16) | | | | | (6) | | | | | (89) | | | | | (14) | | | | | (26) | | | | | (26) | | | | | (23) | | | |
Adjusted earnings (loss) from continuing operations(2) | | | | | | | | | | | | | 158 | | | 1.44 | | | 62 | | | 0.57 | | | 904 | | | 8.27 | | | 148 | | | 1.35 | | | 267 | | | 2.44 | | | 261 | | | 2.38 | | | 228 | | | 2.08 | |
| | | | | | | | | | | | | Diluted shares (in millions)(3) |
| Weighted average shares outstanding | | | | | | | | | | | | | 109.5 | | | | | 109.4 | | | | | 109.3 | | | | | 109.4 | | | | | 109.3 | | | | | 109.3 | | | | | 109.1 | | | |
| Incremental shares attributable to equity awards | | | | | | | | | | | | | 0.2 | | | | | — | | | | | — | | | | | — | | | | | 0.2 | | | | | 0.2 | | | | | 0.4 | | | |
| Total diluted shares | | | | | | | | | | | | | 109.7 | | | | | 109.4 | | | | | 109.3 | | | | | 109.4 | | | | | 109.5 | | | | | 109.5 | | | | | 109.5 | | | |
______________________________(1)Calculated using adjusted effective tax rates (Table 3a) as follows: | | | | | | | | | | | | | | | | | | | | | | | | | | | | | | | | | | | | | | | | | | | | | | | | | | | | | | | | | | | | | | | | | | | | | | | | | | | | | | | | | | | | | | | | | | | | | | | |
| | | | | | | Q2 '25 | | Q1 '25 | | 2024 | | Q4 '24 | | Q3 '24 | | Q2 '24 | | Q1 '24 |
| | | | | | | | | | | | | |
| Adjusted effective tax rate | | | | | | | | | | | | | 9 | | | | | 9 | | | | | 9 | | | | | 9 | | | | | 9 | | | | | 9 | | | | | 9 | | | |
(2)Excludes the immediate recognition of actuarial gains and losses and the impact of actual vs. expected plan asset returns.
| | | | | | | | | | | | | | | | |
| | | | Actual Plan Asset Returns | | Expected Plan Asset Returns |
| | | | (In percentages) |
| | | | | | |
| 2024 | | | | 2.5 | | | 5.3 | |
(3)Potentially dilutive shares are included in the adjusted earnings per share calculation when adjusted earnings are positive.
Table 3a
Adjusted Tax Rate - Reconciliation of a Non-GAAP Measure - Unaudited
| | | | | | | | | | | | |
| Estimated | | Actual | |
| 2025 | | 2024 | |
| (In percentages) | |
| US GAAP annual effective tax rate | 2 | | | (50) | | |
Discrete quarterly recognition of GAAP items(1) | 7 | | | 1 | | |
Tax impact of other charges and adjustments(2) | (2) | | | 98 | | |
| | | | |
| | | | |
Changes in valuation allowances, excluding impact of other charges and adjustments(3) | (6) | | | (40) | | |
Other, includes effect of discrete current year transactions(4) | 8 | | | — | | |
| Adjusted tax rate | 9 | | | 9 | | |
______________________________
Note: As part of the year-end reconciliation, we will update the reconciliation of the GAAP effective tax rate for actual results.
(1)Such as changes in tax laws (including US tax reform), deferred taxes on outside basis differences, changes in uncertain tax positions and prior year audit adjustments.
(2)Reflects the tax impact on pre-tax adjustments presented in Certain Items (Table 8), which are excluded from pre-tax income for adjusted earnings per share purposes. (3)Reflects changes in valuation allowances related to changes in judgment regarding the realizability of deferred tax assets or current year operations, excluding other charges and adjustments.
(4)Includes tax impacts related to full-year actual tax opportunities and related costs, as well as current year realization of U.S. GAAP benefits deferred in prior years.
Table 4
Net Sales by Segment - Unaudited
| | | | | | | | | | | | | | | | | | | | | | | | | | | | | | | | | | | | | | | | | | | | | | | |
| | | | | | | Q2 '25 | | Q1 '25 | | 2024 | | Q4 '24 | | Q3 '24 | | Q2 '24 | | Q1 '24 |
| | | | | | | (In $ millions) |
| Engineered Materials | | | | | | | 1,442 | | | 1,287 | | | 5,595 | | | 1,269 | | | 1,481 | | | 1,467 | | | 1,378 | |
| | | | | | | | | | | | | | | | | | | |
| Acetyl Chain | | | | | | | 1,115 | | | 1,116 | | | 4,763 | | | 1,110 | | | 1,190 | | | 1,202 | | | 1,261 | |
| | | | | | | | | | | | | | | | | | | |
| | | | | | | | | | | | | | | | | | | |
| | | | | | | | | | | | | | | | | | | |
| | | | | | | | | | | | | | | | | | | |
| | | | | | | | | | | | | | | | | | | |
Intersegment eliminations(1) | | | | | | | (25) | | | (14) | | | (90) | | | (21) | | | (23) | | | (18) | | | (28) | |
| Net sales | | | | | | | 2,532 | | | 2,389 | | | 10,268 | | | 2,358 | | | 2,648 | | | 2,651 | | | 2,611 | |
___________________________
(1)Includes intersegment sales primarily related to the Acetyl Chain.
Table 4a
Factors Affecting Segment Net Sales Sequentially - Unaudited
Three Months Ended June 30, 2025 Compared to Three Months Ended March 31, 2025
| | | | | | | | | | | | | | | | | | | | | | | | | | | | | | | | | | | | | | |
| Volume | | Price | | Currency | | | | Total | | | | | | | | | | | |
| | (In percentages) | | | | | | | | | | | |
| Engineered Materials | 9 | | | — | | | 3 | | | | | 12 | | | | | | | | | | | | |
| | | | | | | | | | | | | | | | | | | | |
| Acetyl Chain | (1) | | | (2) | | | 3 | | | | | — | | | | | | | | | | | | |
| | | | | | | | | | | | | | | | | | | | |
| Total Company | 4 | | | (1) | | | 3 | | | | | 6 | | | | | | | | | | | | |
Three Months Ended March 31, 2025 Compared to Three Months Ended December 31, 2024
| | | | | | | | | | | | | | | | | | | | | | | | | | | | |
| Volume | | Price | | Currency | | | | Total | |
| | (In percentages) | |
| Engineered Materials | — | | | 2 | | | (1) | | | | | 1 | | |
| | | | | | | | | | |
| Acetyl Chain | 3 | | | (1) | | | (1) | | | | | 1 | |
|
| | | | | | | | | | |
| Total Company | 2 | | | — | | | (1) | | | | | 1 | | |
Three Months Ended December 31, 2024 Compared to Three Months Ended September 30, 2024
| | | | | | | | | | | | | | | | | | | | | | | | | | | | |
| Volume | | Price | | Currency | | | | Total | |
| (In percentages) | |
| Engineered Materials | (10) | | | (3) | | | (1) | | | | | (14) | |
|
| | | | | | | | | | |
| Acetyl Chain | (4) | | | (2) | | | (1) | | | | | (7) | |
|
| | | | | | | | | | |
| Total Company | (7) | | | (3) | | | (1) | | | | | (11) | | |
Three Months Ended September 30, 2024 Compared to Three Months Ended June 30, 2024
| | | | | | | | | | | | | | | | | | | | | | | | | | | | |
| Volume | | Price | | Currency | | | | Total | |
| (In percentages) | |
| Engineered Materials | — | | | — | | | 1 | | | | | 1 | | |
| | | | | | | | | | |
| Acetyl Chain | — | | | (2) | | | 1 | | | | | (1) | |
|
| | | | | | | | | | |
| Total Company | — | | | (1) | | | 1 | | | | | — | | |
Three Months Ended June 30, 2024 Compared to Three Months Ended March 31, 2024
| | | | | | | | | | | | | | | | | | | | | | | | | | | | |
| Volume | | Price | | Currency | | | | Total | |
| (In percentages) | |
| Engineered Materials | 7 | | | — | | | (1) | | | | | 6 | | |
| | | | | | | | | | |
| Acetyl Chain | (1) | | | (4) | | | — | | | | | (5) | |
|
| | | | | | | | | | |
| Total Company | 4 | | | (2) | | | — | | | | | 2 | | |
Three Months Ended March 31, 2024 Compared to Three Months Ended December 31, 2023
| | | | | | | | | | | | | | | | | | | | | | | | | | | | |
| Volume | | Price | | Currency | | | | Total | |
| (In percentages) | |
| Engineered Materials | (1) | | | — | | | — | | | | | (1) | | |
| | | | | | | | | | |
| Acetyl Chain | 5 | | | 1 | | | 1 | | | | | 7 | |
|
| | | | | | | | | | |
| Total Company | 1 | | | 1 | | | — | | | | | 2 | | |
Table 4b
Factors Affecting Segment Net Sales Year Over Year - Unaudited
Three Months Ended June 30, 2025 Compared to Three Months Ended June 30, 2024
| | | | | | | | | | | | | | | | | | | | | | | | | | | | |
| Volume | | Price | | Currency | | | | Total | |
| | (In percentages) | |
| Engineered Materials | (3) | | | (1) | | | 2 | | | | | (2) | | |
| | | | | | | | | | |
| Acetyl Chain | (2) | | | (7) | | | 2 | | | | | (7) | | |
| | | | | | | | | | |
| Total Company | (2) | | | (4) | | | 2 | | | | | (4) | | |
Three Months Ended March 31, 2025 Compared to Three Months Ended March 31, 2024
| | | | | | | | | | | | | | | | | | | | | | | | | | | | |
| Volume | | Price | | Currency | | | | Total | |
| | (In percentages) | |
| Engineered Materials | (4) | | | (2) | | | (1) | | | | | (7) | | |
| | | | | | | | | | |
| Acetyl Chain | (6) | | | (4) | | | (1) | | | | | (11) | | |
| | | | | | | | | | |
| Total Company | (5) | | | (3) | | | (1) | | | | | (9) | | |
Three Months Ended December 31, 2024 Compared to Three Months Ended December 31, 2023
| | | | | | | | | | | | | | | | | | | | | | | | | | | | |
| Volume | | Price | | Currency | | | | Total | |
| | (In percentages) | |
| Engineered Materials | (6) | | | (3) | | | — | | | | | (9) | | |
| | | | | | | | | | |
| Acetyl Chain | (2) | | | (4) | | | — | | | | | (6) | | |
| | | | | | | | | | |
| Total Company | (4) | | | (4) | | | — | | | | | (8) | | |
Three Months Ended September 30, 2024 Compared to Three Months Ended September 30, 2023
| | | | | | | | | | | | | | | | | | | | | | | | | | | | |
| Volume | | Price | | Currency | | | | Total | |
| (In percentages) | |
| Engineered Materials | (1) | | | (2) | | | — | | | | | (3) | | |
| | | | | | | | | | |
| Acetyl Chain | 1 | | | (3) | | | — | | | | | (2) | | |
| | | | | | | | | | |
| Total Company | — | | | (3) | | | — | | | | | (3) | | |
Three Months Ended June 30, 2024 Compared to Three Months Ended June 30, 2023
| | | | | | | | | | | | | | | | | | | | | | | | | | | | |
| Volume | | Price | | Currency | | | | Total | |
| (In percentages) | |
| Engineered Materials | (2) | | | (4) | | | (1) | | | | | (7) | | |
| | | | | | | | | | |
| Acetyl Chain | 4 | | | (6) | | | (1) | | | | | (3) | | |
| | | | | | | | | | |
| Total Company | 1 | | | (5) | | | (1) | | | | | (5) | | |
Three Months Ended March 31, 2024 Compared to Three Months Ended March 31, 2023
| | | | | | | | | | | | | | | | | | | | | | | | | | | | |
| Volume | | Price | | Currency | | | | Total | |
| (In percentages) | |
| Engineered Materials | (12) | | | (2) | | | (1) | | | | | (15) | | |
| | | | | | | | | | |
| Acetyl Chain | 11 | | | (10) | | | — | | | | | 1 | | |
| | | | | | | | | | |
| Total Company | (2) | | | (5) | | | (1) | | | | | (8) | | |
Table 4c
Factors Affecting Segment Net Sales Year Over Year - Unaudited
Year Ended December 31, 2024 Compared to Year Ended December 31, 2023
| | | | | | | | | | | | | | | | | | | | | | | | | | | | |
| Volume | | Price | | Currency | | | | Total | |
| | (In percentages) | |
| Engineered Materials | (5) | | | (3) | | | (1) | | | | | (9) | | |
| | | | | | | | | | |
| Acetyl Chain | 4 | | | (6) | | | — | | | | | (2) | | |
| | | | | | | | | | |
| Total Company | (1) | | | (4) | | | (1) | | | | | (6) | | |
Table 5
Free Cash Flow - Reconciliation of a Non-GAAP Measure - Unaudited
| | | | | | | | | | | | | | | | | | | | | | | | | | | | | | | | | | | | | | | | | | | | | | | |
| | | | | | | Q2 '25 | | Q1 '25 | | 2024 | | Q4 '24 | | Q3 '24 | | Q2 '24 | | Q1 '24 |
| | | | | | | (In $ millions, except percentages) |
| Net cash provided by (used in) investing activities | | | | | | | (88) | | | (98) | | | (470) | | | (128) | | | (100) | | | (91) | | | (151) | |
| Net cash provided by (used in) financing activities | | | | | | | (116) | | | 45 | | | (1,313) | | | (189) | | | (376) | | | (489) | | | (259) | |
| | | | | | | | | | | | | | | | | | | |
| Net cash provided by (used in) operating activities | | | | | | | 410 | | | 37 | | | 966 | | | 494 | | | 79 | | | 292 | | | 101 | |
| Capital expenditures on property, plant and equipment | | | | | | | (93) | | | (102) | | | (435) | | | (105) | | | (88) | | | (105) | | | (137) | |
| Contributions from/(Distributions) to NCI | | | | | | | (6) | | | (8) | | | (33) | | | (8) | | | (7) | | | (14) | | | (4) | |
Free cash flow(1) | | | | | | | 311 | | | (73) | | | 498 | | | 381 | | | (16) | | | 173 | | | (40) | |
| | | | | | | | | | | | | | | | | | | |
| Net sales | | | | | | | 2,532 | | | 2,389 | | | 10,268 | | | 2,358 | | | 2,648 | | | 2,651 | | | 2,611 | |
| | | | | | | | | | | | | | | | | | | |
| Free cash flow as % of Net sales | | | | | | | 12.3 | % | | (3.1) | % | | 4.9 | % | | 16.2 | % | | (0.6) | % | | 6.5 | % | | (1.5) | % |
| | | | | | | | | | | | | | | | | | | |
| | | | | | | | | | | | | | | | | | | |
| | | | | | | | | | | | | | | | | | | |
| | | | | | | | | | | | | | | | | | | |
______________________________
(1)Free cash flow is a liquidity measure used by the Company and is defined by the Company as net cash provided by (used in) operating activities, less capital expenditures on property, plant and equipment, and adjusted for contributions from or distributions to our NCI joint ventures.
Table 6
Cash Dividends Received - Unaudited
| | | | | | | | | | | | | | | | | | | | | | | | | | | | | | | | | | | | | | | | | | | | | | | |
| | | | | | | Q2 '25 | | Q1 '25 | | 2024 | | Q4 '24 | | Q3 '24 | | Q2 '24 | | Q1 '24 |
| | | | | | | (In $ millions) |
| Dividends from equity method investments | | | | | | | 21 | | | 31 | | | 160 | | | 38 | | | 26 | | | 69 | | | 27 | |
| Dividends from equity investments without readily determinable fair values | | | | | | | 41 | | | 1 | | | 128 | | | 33 | | | 30 | | | 31 | | | 34 | |
| Total | | | | | | | 62 | | | 32 | | | 288 | | | 71 | | | 56 | | | 100 | | | 61 | |
Table 7
Net Debt - Reconciliation of a Non-GAAP Measure - Unaudited
| | | | | | | | | | | | | | | | | | | | | | | | | | | | | | | | | | | | | | | | | | | | | | | |
| | | | | | | Q2 '25 | | Q1 '25 | | 2024 | | Q4 '24 | | Q3 '24 | | Q2 '24 | | Q1 '24 |
| | | | | | | (In $ millions) |
| Short-term borrowings and current installments of long-term debt - third party and affiliates | | | | | | | 252 | | | 406 | | | 1,501 | | | 1,501 | | | 1,607 | | | 1,977 | | | 2,439 | |
| Long-term debt, net of unamortized deferred financing costs | | | | | | | 12,689 | | | 12,378 | | | 11,078 | | | 11,078 | | | 11,324 | | | 11,058 | | | 11,018 | |
| Total debt | | | | | | | 12,941 | | | 12,784 | | | 12,579 | | | 12,579 | | | 12,931 | | | 13,035 | | | 13,457 | |
| Cash and cash equivalents | | | | | | | (1,173) | | | (951) | | | (962) | | | (962) | | | (813) | | | (1,185) | | | (1,483) | |
| Net debt | | | | | | | 11,768 | | | 11,833 | | | 11,617 | | | 11,617 | | | 12,118 | | | 11,850 | | | 11,974 | |
| | | | | | | | | | | | | | | | | | | |
| | | | | | | | | | | | | | | | | | | |
| | | | | | | | | | | | | | | | | | | |
| | | | | | | | | | | | | | | | | | | |
Table 8
Certain Items - Unaudited
The following Certain Items attributable to Celanese Corporation are included in Net earnings (loss) and are adjustments to non-GAAP measures:
| | | | | | | | | | | | | | | | | | | | | | | | | | | | | | | | | | | | | | | | | | | | | | | | | | | | | |
| | | | | | | Q2 '25 | | Q1 '25 | | 2024 | | Q4 '24 | | Q3 '24 | | Q2 '24 | | Q1 '24 | | Income Statement Classification |
| | | | | | | (In $ millions) | | |
| Exit and shutdown costs | | | | | | | 27 | | | 32 | | | 236 | | | 47 | | | 52 | | | 69 | | | 68 | | | Cost of sales / SG&A / Other (charges) gains, net / Gain (loss) on disposition of businesses and assets, net / Non-operating pension and other postretirement employee benefit (expense) income |
| Asset impairments | | | | | | | — | | | — | | | 1,638 | | | 1,601 | | (1) | 34 | | (2) | 3 | | | — | | | Cost of sales / Other (charges) gains, net |
| Impact from plant incidents and natural disasters | | | | | | | — | | | 3 | | | 13 | | | 3 | | | 3 | | | — | | | 7 | | | Cost of sales |
| Mergers, acquisitions and dispositions | | | | | | | 12 | | | 5 | | | 80 | | | 12 | | | 17 | | | 26 | | | 25 | | | Cost of sales / SG&A |
| Actuarial (gain) loss on pension and postretirement plans | | | | | | | — | | | — | | | 27 | | | 27 | | | — | | | — | | | — | | | Cost of sales / SG&A / Non-operating pension and other postretirement employee benefit (expense) income |
| Legal settlements and commercial disputes | | | | | | | 2 | | | 3 | | | 8 | | | 6 | | | 7 | | | 3 | | | (8) | | | Cost of sales / SG&A / Other (charges) gains, net |
| | | | | | | | | | | | | | | | | | | | | |
| (Gain) loss on disposition of businesses and assets | | | | | | | — | | | — | | | 2 | | | — | | | 1 | | | 1 | | | — | | | Gain (loss) on disposition of businesses and assets, net |
| Other | | | | | | | 1 | | | — | | | 5 | | | — | | | — | | | — | | | 5 | | | Cost of sales / SG&A |
| Certain Items attributable to Celanese Corporation | | | | | | | 42 | | | 43 | | | 2,009 | | | 1,696 | | | 114 | | | 102 | | | 97 | | | |
___________________________
(1)Related to impairment of goodwill and certain trade names, primarily Zytel®, arising from our interim goodwill and indefinite-lived intangible assets impairment tests.
(2)Related to impairment of certain tradenames, primarily Zytel®, in connection with our annual goodwill and indefinite-lived intangible asset impairment tests.
Table 9
Return on Invested Capital (Adjusted) - Presentation of a Non-GAAP Measure - Unaudited
| | | | | | | | | | | | | | | | | | | | | | | |
| | | | | | | | | | | 2024 |
| | | | | | | | | | | (In $ millions, except percentages) |
| Net earnings (loss) attributable to Celanese Corporation | | | | | | | | | | | (1,531) | |
| | | | | | | | | | | |
| | | | | | | | | | | 1,636 | |
| | | | | | | | | | | 9 | % |
| Adjusted EBIT tax effected | | | | | | | | | | | 1,489 | |
| | | | | | | | | | | |
| | | | | | | 2024 | | 2023 | | Average |
| | | | | | | (In $ millions, except percentages) |
| Short-term borrowings and current installments of long-term debt - third parties and affiliates | | | | | | | 1,501 | | | 1,383 | | | 1,442 | |
| Long-term debt, net of unamortized deferred financing costs | | | | | | | 11,078 | | | 12,301 | | | 11,690 | |
| Celanese Corporation shareholders' equity | | | | | | | 5,146 | | | 7,071 | | | 6,109 | |
| Invested capital | | | | | | | | | | | 19,241 | |
| | | | | | | | | | | |
| Return on invested capital (adjusted) | | | | | | | | | | | 7.7 | % |
| | | | | | | | | | | |
| Net earnings (loss) attributable to Celanese Corporation as a percentage of invested capital | | | | | | | | | | | (8.0) | % |