0000913341falseC & F FINANCIAL CORPORATION00009133412025-07-242025-07-24

UNITED STATES

SECURITIES AND EXCHANGE COMMISSION

Washington, D.C. 20549

FORM 8-K

CURRENT REPORT

Pursuant to Section 13 or 15(d) of the Securities Exchange Act of 1934

Date of Report (Date of earliest event reported) July 24, 2025

C&F FINANCIAL CORPORATION

(Exact name of registrant as specified in its charter)

Virginia

000-23423

54-1680165

(State or other jurisdiction of
incorporation)

(Commission
File Number)

(IRS Employer
Identification No.)

3600 La Grange Parkway, Toano, Virginia

23168

(Address of principal executive offices)

(Zip Code)

Registrant’s telephone number, including area code (804) 843-2360

(Former name or former address, if changed since last report)

Check the appropriate box below if the Form 8-K filing is intended to simultaneously satisfy the filing obligation of the registrant under any of the following provisions:

    Written communications pursuant to Rule 425 under the Securities Act (17 CFR 230.425)

    Soliciting material pursuant to Rule 14a-12 under the Exchange Act (17 CFR 240.14a-12)

    Pre-commencement communications pursuant to Rule 14d-2(b) under the Exchange Act (17 CFR 240.14d-2(b))

    Pre-commencement communications pursuant to Rule 13e-4(c) under the Exchange Act (17 CFR 240.13e-4(c))

Securities registered pursuant to Section 12(b) of the Act:

Title of each class

Trading Symbol(s)

Name of each exchange on which registered

Common Stock, $1.00 par value per share

CFFI

The NASDAQ Stock Market LLC

Indicate by check mark whether the registrant is an emerging growth company as defined in Rule 405 of the Securities Act of 1933 (§230.405 of this chapter) or Rule 12b-2 of the Securities Exchange of 1934 (§240.12b-2 of this chapter).

Emer

Emerging growth company

If an emerging growth company, indicate by check mark if the registrant has elected not to use the extended transition period for complying with any new or revised financial accounting standards provided pursuant to Section 13(a) of the Exchange Act.

Item 2.02    Results of Operations and Financial Condition

On July 24, 2025, C&F Financial Corporation (the Corporation) issued a news release announcing its financial results for the three and six months ended June 30, 2025. A copy of the Corporation’s news release is attached as Exhibit 99.1 to this Current Report on Form 8-K and is incorporated by reference into this Item 2.02.

Item 7.01Regulation FD Disclosure

On July 24, 2025, the Corporation published an investor presentation on its website. A copy of the presentation is attached to this Current Report on Form 8-K as Exhibit 99.2 and incorporated by reference into this Item 7.01. The Corporation and its management may use this or similar presentations in meetings with investors during the third quarter of 2025. A copy of this investor presentation is also available in the Financial Information – Investor Presentations section of the Corporation’s investor relations website at investor.cffc.com.

In accordance with General Instruction B.2 of Form 8-K, the information furnished in this Item 7.01, including Exhibit 99.2, shall not be deemed “filed” for purposes of Section 18 of the Securities Exchange Act of 1934, as amended, (the Exchange Act) or otherwise subject to the liability of that section, and shall not be deemed to be incorporated by reference into any filing under the Securities Act of 1933, as amended, or the Exchange Act unless expressly incorporated by specific reference made within such filing.

Item 9.01Financial Statements and Exhibits

(d)Exhibits

99.1C&F Financial Corporation news release dated July 24, 2025
99.2Investor Presentation dates July 24, 2025

104 Cover Page Interactive Data File (formatted as inline XBRL and contained

in Exhibit 101)

2

SIGNATURES

Pursuant to the requirements of the Securities Exchange Act of 1934, the registrant has duly caused this report to be signed on its behalf by the undersigned hereunto duly authorized.


C&F FINANCIAL CORPORATION

(Registrant)

Date:

 July 24, 2025

By:

/s/ Jason E. Long

Jason E. Long

Chief Financial Officer and Secretary

3

EXHIBIT 99.1

Thursday, July 24, 2025

Contact:

Jason Long, CFO and Secretary

(804) 843-2360

C&F Financial Corporation

Announces Net Income for Second Quarter and First Six Months

Toano, Va., July 24, 2025—C&F Financial Corporation (the Corporation) (NASDAQ: CFFI), the holding company for C&F Bank, today reported consolidated net income of $7.8 million for the second quarter of 2025, an increase of 54.3 percent compared to $5.0 million for the second quarter of 2024. The Corporation reported consolidated net income of $13.2 million for the first six months of 2025, an increase of 55.4 percent compared to $8.5 million for the first six months of 2024. The following table presents selected financial performance highlights for the periods indicated:

For The Quarter Ended

For the Six Months Ended

Consolidated Financial Highlights (unaudited)


6/30/2025


6/30/2024

6/30/2025


6/30/2024

Consolidated net income (000's)

$

7,767

$

5,034

$

13,162

$

8,469

Earnings per share - basic and diluted

$

2.37

$

1.50

$

4.03

$

2.50

Annualized return on average assets

1.18

%

0.82

%

1.01

%

0.69

%

Annualized return on average equity

13.06

%

9.31

%

11.23

%

7.82

%

Annualized return on average tangible common equity1

14.70

%

10.72

%

12.72

%

9.01

%

________________________

1 For more information about these non-GAAP financial measures, which are not calculated in accordance with generally accepted accounting principles (GAAP), please see “Use of Certain Non-GAAP Financial Measures” and “Reconciliation of Certain Non-GAAP Financial Measures,” below.

“We are very pleased with our strong second-quarter earnings,” said Tom Cherry, President and Chief Executive Officer of C&F Financial Corporation. “Our community banking segment delivered impressive loan and deposit growth, while our mortgage banking segment saw increased loan originations. Despite continued competition for auto loans, we are encouraged by the progress of our operational efficiency initiatives and ongoing technology investments at the consumer finance segment.

Looking ahead, we’re optimistic about the second half of the year. In addition to the continued organic loan and deposit growth we expect at the community banking segment, we are excited about our recent expansion into Southwest Virginia. This strategic move extends our presence into key markets—including Roanoke, Lynchburg, Danville, Martinsville and Blacksburg—and reinforces our position as a leading community bank serving the Commonwealth of Virginia.”

Key highlights for the second quarter and first six months of 2025 are as follows.

Community banking segment loans grew $76.7 million, or 10.6 percent annualized, and $143.4 million, or 10.3 percent, compared to December 31, 2024 and June 30, 2024, respectively;
Consumer finance segment loans decreased $5.4 million, or 2.3 percent annualized, and $17.0 million, or 3.5 percent, compared to December 31, 2024 and June 30, 2024, respectively;
Deposits increased $85.5 million, or 7.9 percent annualized, and $150.3 million, or 7.1 percent, compared to December 31, 2024 and June 30, 2024, respectively;
Consolidated annualized net interest margin was 4.27 percent for the second quarter of 2025 compared to 4.12 percent for the second quarter of 2024 and 4.16 percent in the first quarter of 2025;

1


The community banking segment recorded a net reversal of provision for credit losses of $300,000 and a provision for credit losses of $450,000 for the second quarters of 2025 and 2024, respectively, and recorded a net reversal of provision for credit losses of $200,000 and a provision for credit losses of $950,000 for the first six months of 2025 and 2024, respectively;
The consumer finance segment recorded provision for credit losses of $2.4 million and $2.1 million for the second quarters of 2025 and 2024, respectively, and recorded provision for credit losses of $5.3 million and $5.1 million for the first six months of 2025 and 2024, respectively;
The consumer finance segment experienced net charge-offs at an annualized rate of 2.42 percent of average total loans for the first six months of 2025, compared to 2.21 percent for the first six months of 2024 and an annualized  rate of 2.19 percent for the second quarter of 2025 compared to 2.64 percent for the first quarter of 2025;
Mortgage banking segment loan originations increased $67.5 million, or 46.2 percent, to $213.5 million for the second quarter of 2025 compared to the second quarter of 2024 and increased $99.8 million, or 87.7 percent compared to the first quarter of 2025; and
The Corporation issued new subordinated notes with aggregate principal of $40.0 million on June 6, 2025. Concurrently, the Corporation repurchased previously issued subordinated notes with aggregate principal of $20.0 million.

Community Banking Segment.  The community banking segment reported net income of $7.1 million and $12.6 million for the second quarter and first six months of 2025, respectively, compared to $4.6 million and $8.6 million for the same periods of 2024, due primarily to:

higher interest income resulting from higher average balances of loans and the effects of higher average interest rates on asset yields; and
lower provision for credit losses due primarily to the resolution of a nonperforming commercial real estate loan that had carried a specific reserve, partially offset by provision related to loan growth;

partially offset by:

higher interest expense due primarily to higher average balances of interest-bearing deposits, partially offset by lower average rates on deposits; and
higher marketing and advertising expenses related to the Corporation’s strategic marketing initiative, which began in the second half of 2024.

Average loans increased $139.6 million, or 10.3 percent, for the second quarter of 2025 and increased $152.5 million, or 11.5 percent, for the first six months of 2025, compared to the same periods in 2024, due primarily to growth in the construction, construction real estate and land acquisition and development segments of the loan portfolio. Average deposits increased $156.9 million, or 7.6 percent, for the second quarter of 2025 and increased $144.4 million, or 7.0 percent, for the first six months of 2025, compared to the same periods in 2024, due primarily to higher balances of time deposits, noninterest-bearing demand deposits and saving and money market deposit accounts.

Average interest-earning asset yields were higher for the second quarter and first six months of 2025, compared to the same periods of 2024, due primarily to a shift in the mix of the loan portfolio towards higher-yielding loans, renewals of fixed rate loans originated during periods of lower interest rates and purchases of securities available for sale in the overall higher interest rate environment. Average costs of interest-bearing deposits were lower for the second quarter of 2025, compared to the second quarter of 2024 due primarily to decreases in interest rates paid on time deposits.  Average costs of interest-bearing deposits were higher for the first six months of 2025, compared to the first six months of 2024, due primarily to the continued effects of a shift in the mix of deposits to higher cost time deposits, partially offset by decreases in interest rates paid on time deposits.

The community banking segment’s nonaccrual loans were $1.1 million at June 30, 2025 compared to $333,000 at December 31, 2024. The increase in nonaccrual loans compared to December 31, 2024 is due primarily to the downgrade of one residential mortgage relationship in the first quarter of 2025. The community banking segment recorded net reversals of provision for credit losses of $300,000 and $200,000 for the second quarter and first six months of 2025, compared to provision for credit losses of $450,000 and $950,000 for the same periods of 2024. At June 30, 2025, the allowance for credit losses decreased to $17.2 million, compared to $17.4 million at December 31, 2024. The allowance for credit losses as a percentage of total loans decreased to 1.12 percent at June 30, 2025 from 1.20 percent at December 31, 2024. These

2


decreases are due primarily to the resolution of a nonperforming commercial real estate loan that had carried a specific reserve and growth in loans with shorter expected lives, which resulted in lower estimated losses over the life of the loan, partially offset by growth in the loan portfolio and changes in the forecast of key credit loss model assumptions. Management believes that the level of the allowance for credit losses is adequate to reflect the net amount expected to be collected.

Mortgage Banking Segment.  The mortgage banking segment reported net income of $985,000 and $1.4 million for the second quarter and first six months of 2025, respectively, compared to $376,000 and $670,000 for the same periods of 2024, due primarily to:

higher gains on sales of loans and higher mortgage banking fee income due to higher volume of mortgage loan originations; and
higher mortgage lender services fee income;

partially offset by:

higher variable expenses tied to mortgage loan origination volume such as commissions and bonuses, reported in salaries and employee benefits; and
lower reversal of provision for indemnifications.

Despite the sustained elevated level of mortgage interest rates, higher home prices and low levels of inventory, mortgage banking segment loan originations increased 46.2 percent and 36.2 percent for the second quarter and first six months of 2025, respectively, compared to the same periods of 2024. Mortgage loan originations for the mortgage banking segment were $213.5 million for the second quarter of 2025, comprised of $197.2 million home purchases and $16.3 million refinancings, compared to $146.0 million, comprised of $134.3 million home purchases and $11.7 million refinancings, for the same period in 2024. Mortgage loan originations for the mortgage banking segment were $327.3 million for the first six months of 2025, comprised of $298.9 million home purchases and $28.4 million refinancings, compared to $240.4 million, comprised of $221.1 million home purchases and $19.3 million refinancings, for the same period in 2024. Mortgage loan originations in the second quarter of 2025 increased $99.8 million compared to the first quarter of 2025 due in part to normal industry seasonal fluctuations. Mortgage loan segment originations include originations of loans sold to the community banking segment, at prices similar to those paid by third-party investors. These transactions are eliminated to reach consolidated totals.

During the second quarter and first six months of 2025, the mortgage banking segment recorded a reversal of provision for indemnification losses of $35,000 and $60,000, respectively, compared to a reversal of provision for indemnification losses of $135,000 and $275,000 in the same periods of 2024. The allowance for indemnifications was $1.29 million and $1.35 million at June 30, 2025 and December 31, 2024, respectively. The release of indemnification reserves in 2025 and 2024 was due primarily to lower volume of mortgage loan originations in recent years, improvement in the mortgage banking segment’s assessment of borrower payment performance and other factors affecting expected losses on mortgage loans sold in the secondary market, such as time since origination. The releases in 2025 decreased compared to the same periods in 2024 due primarily to the increased mortgage loan originations in 2025 compared to 2024. Management believes that the indemnification reserve is sufficient to absorb losses related to loans that have been sold in the secondary market.

Consumer Finance Segment.  The consumer finance segment reported net income of $539,000 and $765,000 for the second quarter and first six months of 2025, compared to $894,000 and $831,000 for the same periods in 2024, due primarily to:

higher provision for credit losses due primarily to higher net charge-offs; and
lower interest income resulting from lower average balances of loans, partially offset by higher loan yields;

partially offset by:

lower interest expense allocation on borrowings from the community banking segment as a result of lower average balances of borrowings; and
lower salaries and employee benefits expense due to an effort to reduce overhead costs.


Average loans decreased $14.1 million, or 2.9 percent, for the second quarter of 2025 and decreased $11.2 million, or 2.4 percent, for the first six months of 2025, respectively, compared to the same periods in 2024. The consumer finance

3


segment experienced net charge-offs at an annualized rate of 2.42 percent of average total loans for the first six months of 2025, compared to 2.21 percent for the first six months of 2024, due primarily to an increase in delinquent loans, repossessions and the average amount charged-off when a loan was uncollectable. At June 30, 2025, total delinquent loans as a percentage of total loans was 3.81 percent, compared to 3.90 percent at December 31, 2024, and 3.51 percent at June 30, 2024.

The consumer finance segment, at times, offers payment deferrals as a portfolio management technique to achieve higher ultimate cash collections on select loan accounts. A significant reliance on deferrals as a means of managing collections may result in a lengthening of the loss confirmation period, which would increase expectations of credit losses inherent in the portfolio. Average amounts of payment deferrals of automobile loans on a monthly basis, which are not included in delinquent loans, were 1.73 percent and 1.74 percent of average automobile loans outstanding during the second quarter and first six months of 2025, respectively, compared to 1.58 percent and 1.60 percent during the same periods during 2024. The allowance for credit losses was $22.4 million at June 30, 2025 and $22.7 million at December 31, 2024. The allowance for credit losses as a percentage of total loans was 4.85 percent at June 30, 2025 compared to 4.86 percent at December 31, 2024. Management believes that the level of the allowance for credit losses is adequate to reflect the net amount expected to be collected. If loan performance deteriorates resulting in further elevated delinquencies or net charge-offs, the provision for credit losses may increase in future periods.

Liquidity. The objective of the Corporation’s liquidity management is to ensure the continuous availability of funds to satisfy the credit needs of our customers and the demands of our depositors, creditors and investors. Uninsured deposits represent an estimate of amounts above the Federal Deposit Insurance Corporation (FDIC) insurance coverage limit of $250,000. As of June 30, 2025, the Corporation’s uninsured deposits were approximately $677.7 million, or 30.0 percent of total deposits. Excluding intercompany cash holdings and municipal deposits, which are secured with pledged securities, amounts uninsured were approximately $536.1 million, or 23.8 percent of total deposits as of June 30, 2025. The Corporation’s liquid assets, which include cash and due from banks, interest-bearing deposits at other banks and nonpledged securities available for sale, were $373.7 million and borrowing availability was $576.4 million as of June 30, 2025, which in total exceed uninsured deposits, excluding intercompany cash holdings and secured municipal deposits, by $414.0 million as of June 30, 2025.

In addition to deposits, the Corporation utilizes short-term and long-term borrowings as sources of funds. Short-term borrowings from the Federal Reserve Bank and the Federal Home Loan Bank of Atlanta (FHLB) may be used to fund the Corporation’s day-to-day operations. Short-term borrowings also include securities sold under agreements to repurchase.  Total borrowings increased to $146.1 million at June 30, 2025 from $122.6 million at December 31, 2024 due primarily to an increase in the Corporation’s subordinated debt, increased borrowings from the FHLB and fluctuations in balances of repurchase agreements with commercial deposit customers.

Additional sources of liquidity available to the Corporation include cash flows from operations, loan payments and payoffs, deposit growth, maturities, calls and sales of securities, the issuance of brokered certificates of deposit and the capacity to borrow additional funds.

Capital and Dividends.  During the second quarter of 2025, the Corporation declared a quarterly cash dividend of 46 cents per share. This dividend, which was paid to shareholders on July 1, 2025, represents a payout ratio of 19.4 percent of earnings per share for the second quarter of 2025. The Board of Directors of the Corporation continually reviews the amount of cash dividends per share and the resulting dividend payout ratio in light of changes in economic conditions, current and future capital levels and requirements, and expected future earnings.

Total consolidated equity increased $13.9 million at June 30, 2025, compared to December 31, 2024, due primarily to net income and lower unrealized losses in the market value of securities available for sale, which are recognized as a component of other comprehensive income, partially offset by dividends paid on the Corporation’s common stock. The Corporation’s securities available for sale are fixed income debt securities and their unrealized loss position is a result of increased market interest rates since they were purchased. The Corporation expects to recover its investments in debt securities through scheduled payments of principal and interest. Unrealized losses are not expected to affect the earnings or regulatory capital of the Corporation or C&F Bank. The accumulated other comprehensive loss related to the Corporation’s securities available for sale, net of deferred income taxes, decreased to $19.9 million at June 30, 2025

4


compared to $23.7 million at December 31, 2024 due primarily to fluctuations in debt security market interest rates and a decrease in the balance of securities available for sale in an unrealized loss position as a result of maturities, calls and paydowns.

As of June 30, 2025, the most recent notification from the FDIC categorized C&F Bank as well capitalized under the regulatory framework for prompt corrective action. To be categorized as well capitalized under regulations applicable at June 30, 2025, C&F Bank was required to maintain minimum total risk-based, Tier 1 risk-based, CET1 risk-based and Tier 1 leverage ratios. In addition to the regulatory risk-based capital requirements, C&F Bank must maintain a capital conservation buffer of additional capital of 2.5 percent of risk-weighted assets as required by the Basel III capital rules.  The Corporation and C&F Bank exceeded these ratios at June 30, 2025. For additional information, see “Capital Ratios” below.  The above mentioned ratios are not impacted by unrealized losses on securities available for sale. In the event that all of these unrealized losses become realized into earnings, the Corporation and C&F Bank would both continue to exceed minimum capital requirements, including the capital conservation buffer, and be considered well capitalized.

The Corporation has a share repurchase program that was authorized by the Board of Directors to repurchase up to $5.0 million of the Corporation’s common stock, effective January 1, 2025 through December 31, 2025 (the 2025 Repurchase Program). During the second quarter of 2025, the Corporation did not make any repurchases of its common stock under the 2025 Repurchase Program.

About C&F Financial Corporation.  The Corporation’s common stock is listed for trading on The Nasdaq Stock Market under the symbol CFFI.  The common stock closed at a price of $69.18 per share on July 23, 2025.  At June 30, 2025, the book value per share of the Corporation was $74.21 and the tangible book value per share was $66.12.  For more information about the Corporation’s tangible book value per share, which is not calculated in accordance with GAAP, please see “Use of Certain Non-GAAP Financial Measures” and “Reconciliation of Certain Non-GAAP Financial Measures,” below.

C&F Bank operates 31 banking offices and five commercial loan offices located throughout Virginia and offers full wealth management services through its subsidiary C&F Wealth Management, Inc. C&F Mortgage Corporation and its subsidiary C&F Select LLC provide mortgage loan origination services through offices located in Virginia and the surrounding states. C&F Finance Company provides automobile, marine and recreational vehicle loans through indirect lending programs offered primarily in the Mid-Atlantic, Midwest and Southern United States from its headquarters in Henrico, Virginia.

Additional information regarding the Corporation’s products and services, as well as access to its filings with the Securities and Exchange Commission (SEC), are available on the Corporation’s website at http://www.cffc.com.

Use of Certain Non-GAAP Financial Measures. The accounting and reporting policies of the Corporation conform to GAAP in the United States and prevailing practices in the banking industry. However, certain non-GAAP measures are used by management to supplement the evaluation of the Corporation’s performance. These may include adjusted net income, adjusted earnings per share, adjusted return on average equity, adjusted return on average assets, return on average tangible common equity (ROTCE), adjusted ROTCE, tangible book value per share, price to tangible book value ratio, and the following fully-taxable equivalent (FTE) measures: interest income on loans-FTE, interest income on securities-FTE, total interest income-FTE and net interest income-FTE. Interest on tax-exempt loans and securities is presented on a taxable-equivalent basis (which converts the income on loans and investments for which no income taxes are paid to the equivalent yield as if income taxes were paid) using the federal corporate income tax rate of 21 percent that was applicable for all periods presented.

Management believes that the use of these non-GAAP measures provides meaningful information about operating performance by enhancing comparability with other financial periods, other financial institutions, and between different sources of interest income. The non-GAAP measures used by management enhance comparability by excluding the effects of balances of intangible assets, including goodwill, that vary significantly between institutions, and tax benefits that are not consistent across different opportunities for investment. These non-GAAP financial measures should not be considered an alternative to, or more important than, GAAP-basis financial statements, and other bank holding companies may define or calculate these or similar measures differently. A reconciliation of the non-GAAP financial measures used by the

5


Corporation to evaluate and measure the Corporation’s performance to the most directly comparable GAAP financial measures is presented below.

Forward-Looking Statements.  This press release contains “forward-looking statements” within the meaning of Section 27A of the Securities Act of 1933, as amended, and Section 21E of the Securities Exchange Act of 1934, as amended. These forward-looking statements are based on the beliefs of the Corporation’s management, as well as assumptions made by, and information currently available to, the Corporation’s management, and reflect management’s current views with respect to certain events that could have an impact on the Corporation’s future financial performance.  These statements, including without limitation statements made in Mr. Cherry’s quote and statements regarding future interest rates and conditions in the Corporation’s industries and markets, relate to expectations concerning matters that are not historical fact, may express “belief,” “intention,” “expectation,” “potential” and similar expressions, and may use the words “believe,” “expect,” “anticipate,” “estimate,” “plan,” “may,” “might,” “will,” “intend,” “target,” “should,” “could,” or similar expressions. These statements are inherently uncertain, and there can be no assurance that the underlying assumptions will prove to be accurate. Actual results could differ materially from those anticipated or implied by such statements. Forward-looking statements in this release may include, without limitation, statements regarding expected future operations and financial performance, expected trends in yields on loans, expected future recovery of investments in debt securities, future dividend payments, deposit trends, charge-offs and delinquencies, changes in cost of funds and net interest margin and items affecting net interest margin, strategic business initiatives and the anticipated effects thereof, changes in interest rates and the effects thereof on net interest income, mortgage loan originations, expectations regarding C&F Bank’s regulatory risk-based capital requirement levels, technology initiatives, our diversified business strategy, asset quality, credit quality, adequacy of allowances for credit losses and the level of future charge-offs, market interest rates and housing inventory and resulting effects in mortgage loan origination volume, sources of liquidity, adequacy of the reserve for indemnification losses related to loans sold in the secondary market, the effect of future market and industry trends, the effects of future interest rate fluctuations, cybersecurity risks, and inflation. Factors that could have a material adverse effect on the operations and future prospects of the Corporation include, but are not limited to, changes in:

interest rates, such as volatility in short-term interest rates or yields on U.S. Treasury bonds, fluctuations in interest rates following actions by the Federal Reserve and increases or volatility in mortgage interest rates
general business conditions, as well as conditions within the financial markets
general economic conditions, including unemployment levels, inflation rates, supply chain disruptions and slowdowns in economic growth
general market conditions, including disruptions due to pandemics or significant health hazards, severe weather conditions, natural disasters, terrorist activities, financial crises, political crises, changes in trade policy and the implementation of tariffs, war and other military conflicts or other major events, or the prospect of these events
average loan and securities yields and average costs of interest-bearing deposits and borrowings
financial services industry conditions, including bank failures or concerns involving liquidity
labor market conditions, including attracting, hiring, training, motivating and retaining qualified employees
the legislative and regulatory climate, regulatory initiatives with respect to financial institutions, products and services, the Consumer Financial Protection Bureau (the CFPB) and the regulatory and enforcement activities of the CFPB
monetary and fiscal policies of the U.S. Government, including policies of the FDIC, U.S. Department of the Treasury and the Board of Governors of the Federal Reserve System, and the effect of these policies on interest rates and business in our markets
demand for financial services in the Corporation’s market areas
the value of securities held in the Corporation’s investment portfolios
the quality or composition of the loan portfolios and the value of the collateral securing those loans
the inventory level, demand and fluctuations in the pricing of used automobiles, including sales prices of repossessed vehicles
the level of automobile loan delinquencies or defaults and our ability to repossess automobiles securing delinquent automobile finance installment contracts
the level of net charge-offs on loans and the adequacy of our allowance for credit losses
the level of indemnification losses related to mortgage loans sold
demand for loan products
deposit flows

6


the strength of the Corporation’s counterparties
the availability of lines of credit from the FHLB and other counterparties
the soundness of other financial institutions and any indirect exposure related to the closing of other financial institutions and their impact on the broader market through other customers, suppliers and partners, or that the conditions which resulted in the liquidity concerns experienced by closed financial institutions may also adversely impact, directly or indirectly, other financial institutions and market participants with which the Corporation has commercial or deposit relationships
competition from both banks and non-banks, including competition in the automobile finance and marine and recreational vehicle finance markets
services provided by, or the level of the Corporation’s reliance upon third parties for key services
the commercial and residential real estate markets, including changes in property values
the demand for residential mortgages and conditions in the secondary residential mortgage loan markets
the Corporation’s technology initiatives and other strategic initiatives
the Corporation’s branch expansion, relocation and consolidation plans
cyber threats, attacks or events
C&F Bank’s product offerings
accounting principles, policies and guidelines, and elections made by the Corporation thereunder.

These risks and uncertainties should be considered in evaluating the forward-looking statements contained herein, and readers are cautioned not to place undue reliance on any forward-looking statements, which speak only as of the date of this release.  For additional information on risk factors that could affect the forward-looking statements contained herein, see the Corporation’s Annual Report on Form 10-K for the year ended December 31, 2024 and other reports filed with the SEC. The Corporation undertakes no obligation to update any forward-looking statement, whether as a result of new information, future events or otherwise.

7


C&F Financial Corporation

Selected Financial Information

(dollars in thousands, except for per share data)

(unaudited)

Financial Condition


6/30/2025


12/31/2024


6/30/2024


Interest-bearing deposits in other banks

$

62,289

$

49,423

$

28,433

Investment securities - available for sale, at fair value

434,506

418,625

404,758

Loans held for sale, at fair value

44,757

20,112

33,716

Loans, net:

Community Banking segment

1,513,082

1,436,226

1,369,912

Consumer Finance segment

439,005

444,085

454,921

Total assets

2,686,392

2,563,374

2,492,100

Deposits

2,256,314

2,170,860

2,106,062

Repurchase agreements

20,642

28,994

25,047

Other borrowings

125,493

93,615

93,753

Total equity

240,916

226,970

219,099

For The

For The

Quarter Ended

Six Months Ended

Results of Operations


6/30/2025


6/30/2024


6/30/2025


6/30/2024


Interest income

$

37,407

$

34,312

$

73,395

$

67,020

Interest expense

10,899

10,484

21,877

20,034

Provision for credit losses:

Community Banking segment

(300)

450

(200)

950

Consumer Finance segment

2,400

2,100

5,300

5,100

Noninterest income:

Gains on sales of loans

2,458

1,701

4,305

2,989

Other

7,390

5,623

13,116

11,827

Noninterest expenses:

Salaries and employee benefits

14,846

13,452

28,329

27,704

Other

9,784

8,921

19,360

17,819

Income tax expense

1,859

1,195

2,988

1,760

Net income

7,767

5,034

13,162

8,469

Fully-taxable equivalent (FTE) amounts1

Interest income on loans-FTE

33,768

31,460

66,196

61,096

Interest income on securities-FTE

3,530

2,977

6,876

6,075

Total interest income-FTE

37,711

34,600

73,987

67,593

Net interest income-FTE

26,812

24,116

52,110

47,559

________________________

1For more information about these non-GAAP financial measures, please see “Use of Certain Non-GAAP Financial Measures” and “Reconciliation of Certain Non-GAAP Financial Measures.”

8


For the Quarter Ended


6/30/2025


6/30/2024


Average


Income/


Yield/

Average


Income/


Yield/

Yield Analysis

Balance


Expense


Rate

Balance


Expense


Rate

Assets

Loans:

Community banking segment

$

1,499,272

$

20,893

5.59

%  

$

1,359,703

$

18,543

5.48

%  

Mortgage banking segment

45,948

731

6.38

34,240

533

6.26

Consumer finance segment

464,193


12,144


10.49


478,296


12,384


10.41

Total loans


2,009,413

33,768

6.74

1,872,239

31,460

6.76

Securities:

Taxable

342,023

2,325

2.72

337,050

1,857

2.20

Tax-exempt


120,281


1,205


4.01


119,626


1,120


3.75

Total securities


462,304


3,530


3.05


456,676


2,977


2.61

Interest-bearing deposits in other banks


48,237


413


3.43


23,239


163


2.82

Total earning assets


2,519,954


37,711


6.00


2,352,154


34,600


5.91

Allowance for credit losses


(41,284)


(40,837)

Total non-earning assets


157,307


153,002

Total assets

$

2,635,977

$

2,464,319

Liabilities and Equity

Interest-bearing deposits:

Interest-bearing demand deposits

$

312,905

476


0.61

$

321,070

476


0.60

Savings and money market deposit accounts


522,453


1,530


1.17


474,613


1,074


0.91

Certificates of deposit


830,425


7,547


3.65


751,973


7,700


4.12

Total interest-bearing deposits


1,665,783


9,553


2.30


1,547,656


9,250


2.40

Borrowings:

Repurchase agreements

23,920

85

1.43

25,113

97

1.55

Other borrowings

99,162


1,261


5.09


100,633


1,137


4.52

Total borrowings


123,082

1,346

4.38

125,746

1,234

3.93

Total interest-bearing liabilities


1,788,865


10,899


2.44


1,673,402


10,484


2.52

Noninterest-bearing demand deposits


568,372


529,608

Other liabilities


40,917


45,023

Total liabilities


2,398,154


2,248,033

Equity


237,823


216,286

Total liabilities and equity

$

2,635,977

$

2,464,319

Net interest income

$

26,812

$

24,116

Interest rate spread


3.56

%  


3.39

%  

Interest expense to average earning assets


1.73

%  


1.79

%  

Net interest margin


4.27

%  


4.12

%  

9


For the Six Months Ended


6/30/2025


6/30/2024


Average


Income/


Yield/

Average


Income/


Yield/

Yield Analysis

Balance


Expense


Rate

Balance


Expense


Rate

Assets

Loans:

Community banking segment

$

1,483,501

$

40,858

5.55

%  

$

1,330,981

$

35,874

5.42

%  

Mortgage banking segment

33,527

1,071

6.44

25,970

814

6.30

Consumer finance segment


464,856


24,267


10.53


476,072


24,408


10.31

Total loans

1,981,884

66,196

6.74

1,833,023

61,096

6.70

Securities:

Taxable

340,744

4,518

2.65

351,146

3,837

2.19

Tax-exempt


119,661


2,358


3.94


120,274


2,238


3.72

Total securities


460,405


6,876


2.99


471,420


6,075


2.58

Interest-bearing deposits in other banks


52,012


915


3.55


25,828


422


3.29

Total earning assets


2,494,301


73,987


5.98


2,330,271


67,593


5.83

Allowance for credit losses


(40,947)


(40,565)

Total non-earning assets


155,937


154,902

Total assets

$

2,609,291

$

2,444,608

Liabilities and Equity

Interest-bearing deposits:

Interest-bearing demand deposits

$

322,569

1,076


0.67

$

328,320

1,029


0.63

Savings and money market deposit accounts


505,926


2,735


1.09


479,629


2,135


0.90

Certificates of deposit


826,211


15,511


3.79


728,570


14,616


4.03

Total interest-bearing deposits


1,654,706


19,322


2.35


1,536,519


17,780


2.33

Borrowings:

Repurchase agreements

26,044

198

1.53

26,555

208

1.57

Other borrowings


96,394


2,357


4.89


89,539


2,046


4.57

Total borrowings

122,438

2,555

4.18

116,094

2,254

3.88

Total interest-bearing liabilities


1,777,144


21,877


2.48


1,652,613


20,034


2.44

Noninterest-bearing demand deposits


556,923


530,747

Other liabilities


40,896


44,573

Total liabilities


2,374,963


2,227,933

Equity


234,328


216,675

Total liabilities and equity

$

2,609,291

$

2,444,608

Net interest income

$

52,110

$

47,559

Interest rate spread


3.50

%  


3.39

%  

Interest expense to average earning assets


1.77

%  


1.73

%  

Net interest margin


4.21

%  


4.10

%  

6/30/2025

Funding Sources


Capacity


Outstanding


Available

Unsecured federal funds agreements

$

75,000

$

$

75,000

Borrowings from FHLB


267,278


52,000


215,278

Borrowings from Federal Reserve Bank


286,137


286,137

Total

$

628,415

$

52,000

$

576,415

10


Asset Quality


6/30/2025

12/31/2024


Community Banking

Total loans

$

1,530,275

$

1,453,605

Nonaccrual loans

$

1,075

$

333

Allowance for credit losses (ACL)

$

17,193

$

17,379

Nonaccrual loans to total loans

0.07

%  

0.02

%  

ACL to total loans

1.12

%  

1.20

%  

ACL to nonaccrual loans

1,599.35

%  

5,218.92

%  

Annualized year-to-date net charge-offs to average loans

0.01

%  

0.01

%  

Consumer Finance

Total loans

$

461,390

$

466,793

Nonaccrual loans

$

697

$

614

Repossessed assets

$

925

$

779

ACL

$

22,385

$

22,708

Nonaccrual loans to total loans

0.15

%  

0.13

%  

ACL to total loans

4.85

%  

4.86

%  

ACL to nonaccrual loans

3,211.62

%  

3,698.37

%  

Annualized year-to-date net charge-offs to average loans

2.42

%  

2.62

%  

For The

For The

Quarter Ended

Six Months Ended

Other Performance Data


6/30/2025


6/30/2024


6/30/2025


6/30/2024

Net Income (Loss):

Community Banking

$

7,116

$

4,571

$

12,561

$

8,583

Mortgage Banking

985

376

1,416

670

Consumer Finance

539

894

765

831

Other1

(873)

(807)

(1,580)

(1,615)

Total

$

7,767

$

5,034

$

13,162

$

8,469

Net income attributable to C&F Financial Corporation

$

7,691

$

5,007

$

13,059

$

8,408

Earnings per share - basic and diluted

$

2.37

$

1.50

$

4.03

$

2.50

Weighted average shares outstanding - basic and diluted

3,238,765

3,343,192

3,236,849

3,357,063

Annualized return on average assets

1.18

%

0.82

%

1.01

%  

0.69

%

Annualized return on average equity

13.06

%

9.31

%

11.23

%  

7.82

%

Annualized return on average tangible common equity2

14.70

%

10.72

%

12.72

%  

9.01

%

Dividends declared per share

$

0.46

$

0.44

$

0.92

$

0.88

Mortgage loan originations - Mortgage Banking

$

213,523

$

146,010

$

327,273

$

240,356

Mortgage loans sold - Mortgage Banking

196,878

135,227

303,309

221,306

________________________

1Includes results of the holding company that are not allocated to the business segments and elimination of inter-segment activity.
2For more information about these non-GAAP financial measures, please see “Use of Certain Non-GAAP Financial Measures” and “Reconciliation of Certain Non-GAAP Financial Measures.”

11


Market Ratios


6/30/2025


12/31/2024

Market value per share

$

61.73

$

71.25

Book value per share

$

74.21

$

70.00

Price to book value ratio

0.83

1.02

Tangible book value per share1

$

66.12

$

61.86

Price to tangible book value ratio1

0.93

1.15

Price to earnings ratio (ttm)

8.17

11.86

________________________

1

For more information about these non-GAAP financial measures, please see “Use of Certain Non-GAAP Financial Measures” and “Reconciliation of Certain Non-GAAP Financial Measures.”

Minimum Capital

Capital Ratios


6/30/2025

12/31/2024

Requirements3

C&F Financial Corporation1

Total risk-based capital ratio

15.0

%

14.1

%


8.0

%

Tier 1 risk-based capital ratio

12.0

%

11.9

%


6.0

%

Common equity tier 1 capital ratio

10.8

%

10.7

%


4.5

%

Tier 1 leverage ratio

10.0

%

9.8

%


4.0

%

C&F Bank2

Total risk-based capital ratio

14.8

%

13.5

%

8.0

%

Tier 1 risk-based capital ratio

13.6

%

12.3

%

6.0

%

Common equity tier 1 capital ratio


13.6

%

12.3

%


4.5

%

Tier 1 leverage ratio


11.3

%

10.1

%


4.0

%

________________________

1

The Corporation, a small bank holding company under applicable regulations and guidance, is not subject to the minimum regulatory capital regulations for bank holding companies. The regulatory requirements that apply to bank holding companies that are subject to regulatory capital requirements are presented above, along with the Corporation’s capital ratios as determined under those regulations.

2

All ratios at June 30, 2025 are estimates and subject to change pending regulatory filings. All ratios at December 31, 2024 are presented as filed.

3

The ratios presented for minimum capital requirements are those to be considered adequately capitalized.

For The Quarter Ended

For The Six Months Ended

6/30/2025

6/30/2024

6/30/2025

6/30/2024

Reconciliation of Certain Non-GAAP Financial Measures


Return on Average Tangible Common Equity

Average total equity, as reported

$

237,823

$

216,286

$

234,328

$

216,675

Average goodwill

(25,191)

(25,191)

(25,191)

(25,191)

Average other intangible assets

(1,045)

(1,301)

(1,081)

(1,333)

Average noncontrolling interest

(652)

(602)

(696)

(656)

Average tangible common equity

$

210,935

$

189,192

$

207,360

$

189,495

Net income

$

7,767

$

5,034

$

13,162

$

8,469

Amortization of intangibles

63

65

125

130

Net income attributable to noncontrolling interest

(76)

(27)

(103)

(61)

Net tangible income attributable to C&F Financial Corporation

$

7,754

$

5,072

$

13,184

$

8,538

Annualized return on average equity, as reported

13.06

%

9.31

%

11.23

%

7.82

%

Annualized return on average tangible common equity

14.70

%

10.72

%

12.72

%

9.01

%

12


For The Quarter Ended

For The Six Months Ended

6/30/2025

6/30/2024

6/30/2025

6/30/2024

Fully Taxable Equivalent Net Interest Income1

Interest income on loans

$

33,716

$

31,407

$

66,098

$

60,993

FTE adjustment

52

53

98

103

FTE interest income on loans

$

33,768

$

31,460

$

66,196

$

61,096

Interest income on securities

$

3,278

$

2,742

$

6,382

$

5,605

FTE adjustment

252

235

494

470

FTE interest income on securities

$

3,530

$

2,977

$

6,876

$

6,075

Total interest income

$

37,407

$

34,312

$

73,395

$

67,020

FTE adjustment

304

288

592

573

FTE interest income

$

37,711

$

34,600

$

73,987

$

67,593

Net interest income

$

26,508

$

23,828

$

51,518

$

46,986

FTE adjustment

304

288

592

573

FTE net interest income

$

26,812

$

24,116

$

52,110

$

47,559

____________________

1Assuming a tax rate of 21%.

6/30/2025

12/31/2024

Tangible Book Value Per Share

Equity attributable to C&F Financial Corporation

$

240,313

$

226,360

Goodwill

(25,191)

(25,191)

Other intangible assets

(1,022)

(1,147)

Tangible equity attributable to C&F Financial Corporation

$

214,100

$

200,022

Shares outstanding

3,238,085

3,233,672

Book value per share

$

74.21

$

70.00

Tangible book value per share

$

66.12

$

61.86

13


Exhibit 99.2

GRAPHIC

C&F Financial Corporation NASDAQ: CFFI Second Quarter 2025 Investor Presentation

GRAPHIC

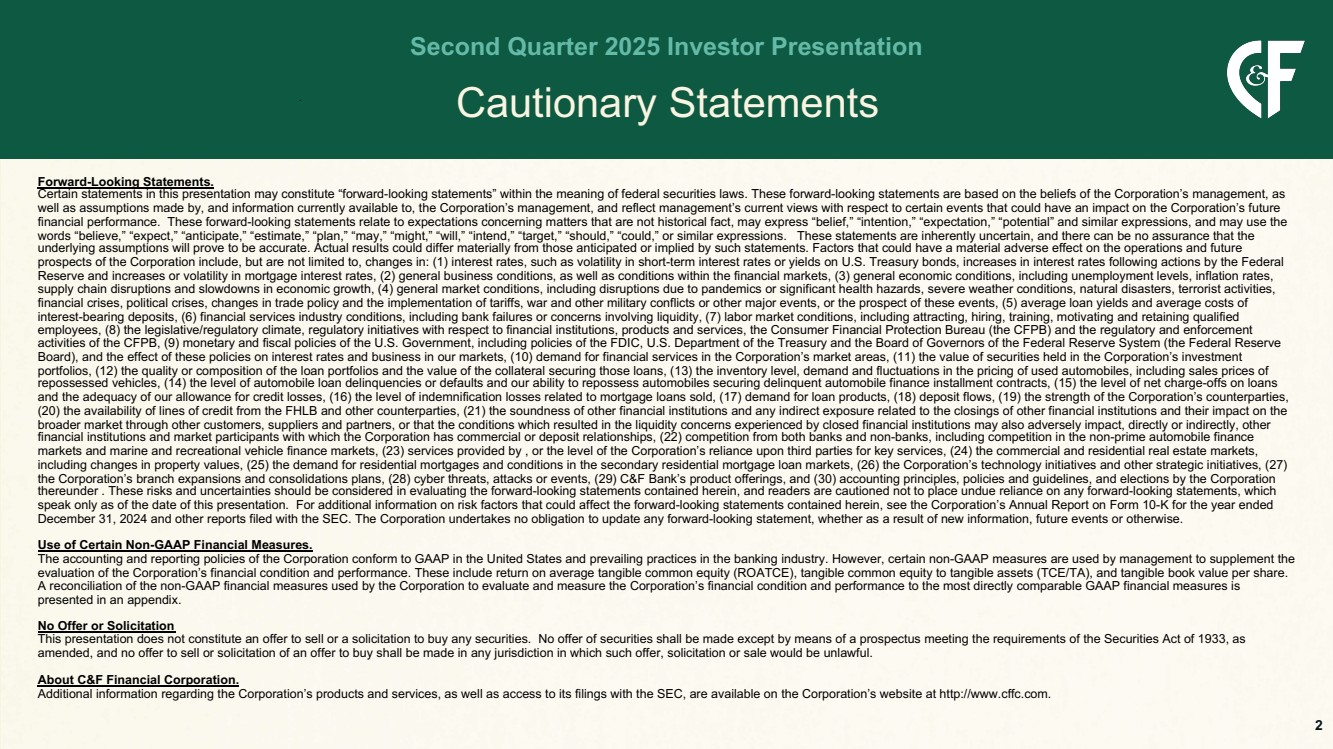
Cautionary Statements Second Quarter 2025 Investor Presentation Forward-Looking Statements. Certain statements in this presentation may constitute “forward-looking statements” within the meaning of federal securities laws. These forward-looking statements are based on the beliefs of the Corporation’s management, as well as assumptions made by, and information currently available to, the Corporation’s management, and reflect management’s current views with respect to certain events that could have an impact on the Corporation’s future financial performance. These forward-looking statements relate to expectations concerning matters that are not historical fact, may express “belief,” “intention,” “expectation,” “potential” and similar expressions, and may use the words “believe,” “expect,” “anticipate,” “estimate,” “plan,” “may,” “might,” “will,” “intend,” “target,” “should,” “could,” or similar expressions. These statements are inherently uncertain, and there can be no assurance that the underlying assumptions will prove to be accurate. Actual results could differ materially from those anticipated or implied by such statements. Factors that could have a material adverse effect on the operations and future prospects of the Corporation include, but are not limited to, changes in: (1) interest rates, such as volatility in short-term interest rates or yields on U.S. Treasury bonds, increases in interest rates following actions by the Federal Reserve and increases or volatility in mortgage interest rates, (2) general business conditions, as well as conditions within the financial markets, (3) general economic conditions, including unemployment levels, inflation rates, supply chain disruptions and slowdowns in economic growth, (4) general market conditions, including disruptions due to pandemics or significant health hazards, severe weather conditions, natural disasters, terrorist activities, financial crises, political crises, changes in trade policy and the implementation of tariffs, war and other military conflicts or other major events, or the prospect of these events, (5) average loan yields and average costs of interest-bearing deposits, (6) financial services industry conditions, including bank failures or concerns involving liquidity, (7) labor market conditions, including attracting, hiring, training, motivating and retaining qualified employees, (8) the legislative/regulatory climate, regulatory initiatives with respect to financial institutions, products and services, the Consumer Financial Protection Bureau (the CFPB) and the regulatory and enforcement activities of the CFPB, (9) monetary and fiscal policies of the U.S. Government, including policies of the FDIC, U.S. Department of the Treasury and the Board of Governors of the Federal Reserve System (the Federal Reserve Board), and the effect of these policies on interest rates and business in our markets, (10) demand for financial services in the Corporation’s market areas, (11) the value of securities held in the Corporation’s investment portfolios, (12) the quality or composition of the loan portfolios and the value of the collateral securing those loans, (13) the inventory level, demand and fluctuations in the pricing of used automobiles, including sales prices of repossessed vehicles, (14) the level of automobile loan delinquencies or defaults and our ability to repossess automobiles securing delinquent automobile finance installment contracts, (15) the level of net charge-offs on loans and the adequacy of our allowance for credit losses, (16) the level of indemnification losses related to mortgage loans sold, (17) demand for loan products, (18) deposit flows, (19) the strength of the Corporation’s counterparties, (20) the availability of lines of credit from the FHLB and other counterparties, (21) the soundness of other financial institutions and any indirect exposure related to the closings of other financial institutions and their impact on the broader market through other customers, suppliers and partners, or that the conditions which resulted in the liquidity concerns experienced by closed financial institutions may also adversely impact, directly or indirectly, other financial institutions and market participants with which the Corporation has commercial or deposit relationships, (22) competition from both banks and non-banks, including competition in the non-prime automobile finance markets and marine and recreational vehicle finance markets, (23) services provided by , or the level of the Corporation’s reliance upon third parties for key services, (24) the commercial and residential real estate markets, including changes in property values, (25) the demand for residential mortgages and conditions in the secondary residential mortgage loan markets, (26) the Corporation’s technology initiatives and other strategic initiatives, (27) the Corporation’s branch expansions and consolidations plans, (28) cyber threats, attacks or events, (29) C&F Bank’s product offerings, and (30) accounting principles, policies and guidelines, and elections by the Corporation thereunder . These risks and uncertainties should be considered in evaluating the forward-looking statements contained herein, and readers are cautioned not to place undue reliance on any forward-looking statements, which speak only as of the date of this presentation. For additional information on risk factors that could affect the forward-looking statements contained herein, see the Corporation’s Annual Report on Form 10-K for the year ended December 31, 2024 and other reports filed with the SEC. The Corporation undertakes no obligation to update any forward-looking statement, whether as a result of new information, future events or otherwise. Use of Certain Non-GAAP Financial Measures. The accounting and reporting policies of the Corporation conform to GAAP in the United States and prevailing practices in the banking industry. However, certain non-GAAP measures are used by management to supplement the evaluation of the Corporation’s financial condition and performance. These include return on average tangible common equity (ROATCE), tangible common equity to tangible assets (TCE/TA), and tangible book value per share. A reconciliation of the non-GAAP financial measures used by the Corporation to evaluate and measure the Corporation’s financial condition and performance to the most directly comparable GAAP financial measures is presented in an appendix. No Offer or Solicitation This presentation does not constitute an offer to sell or a solicitation to buy any securities. No offer of securities shall be made except by means of a prospectus meeting the requirements of the Securities Act of 1933, as amended, and no offer to sell or solicitation of an offer to buy shall be made in any jurisdiction in which such offer, solicitation or sale would be unlawful. About C&F Financial Corporation. Additional information regarding the Corporation’s products and services, as well as access to its filings with the SEC, are available on the Corporation’s website at http://www.cffc.com. 2

GRAPHIC

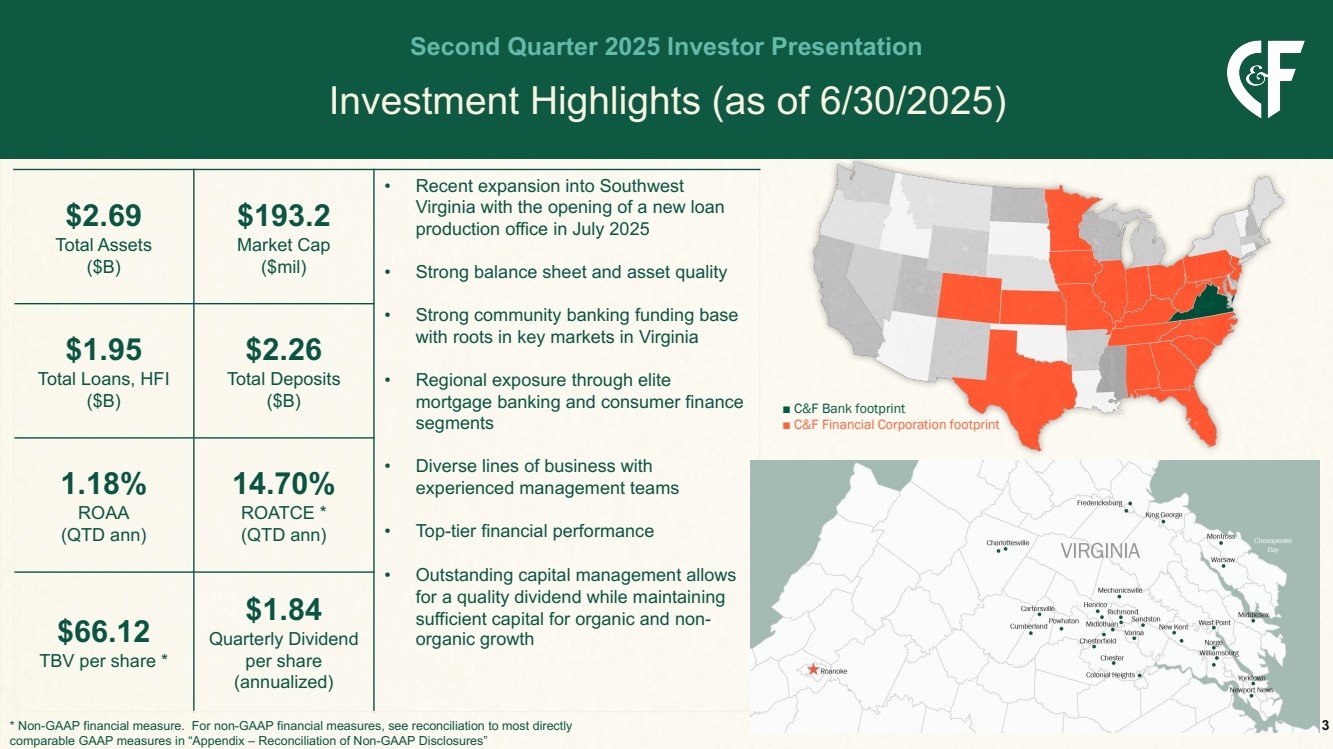
Investment Highlights (as of 6/30/2025) Second Quarter 2025 Investor Presentation $2.69 Total Assets ($B) $193.2 Market Cap ($mil) • Recent expansion into Southwest Virginia with the opening of a new loan production office in July 2025 • Strong balance sheet and asset quality • Strong community banking funding base with roots in key markets in Virginia • Regional exposure through elite mortgage banking and consumer finance segments • Diverse lines of business with experienced management teams • Top-tier financial performance • Outstanding capital management allows for a quality dividend while maintaining sufficient capital for organic and non-organic growth $1.95 Total Loans, HFI ($B) $2.26 Total Deposits ($B) 1.18% ROAA (QTD ann) 14.70% ROATCE * (QTD ann) $66.12 TBV per share * $1.84 Quarterly Dividend per share (annualized) ■ C&F Bank footprint ■ C&F Financial Corporation footprint * Non-GAAP financial measure. For non-GAAP financial measures, see reconciliation to most directly comparable GAAP measures in “Appendix – Reconciliation of Non-GAAP Disclosures” 3

GRAPHIC

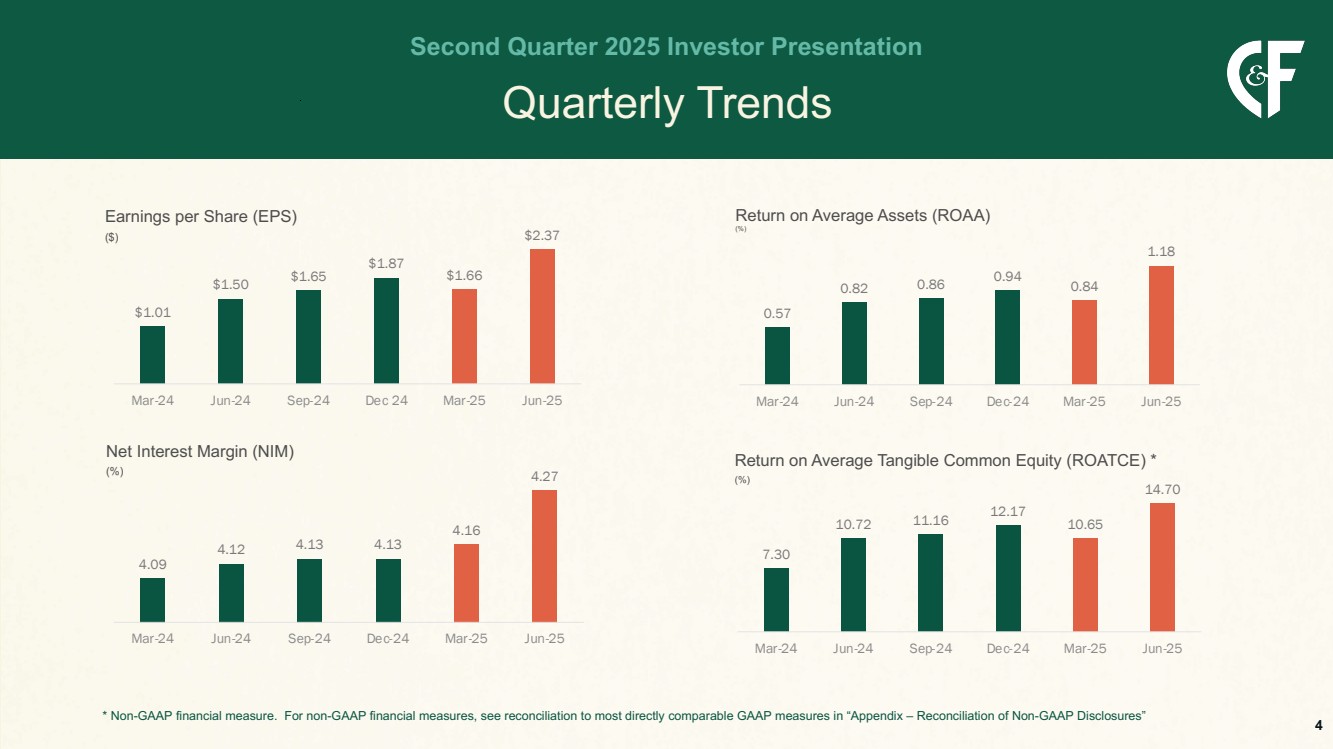
Quarterly Trends Second Quarter 2025 Investor Presentation * Non-GAAP financial measure. For non-GAAP financial measures, see reconciliation to most directly comparable GAAP measures in “Appendix – Reconciliation of Non-GAAP Disclosures” Earnings per Share (EPS) ($) $1.01 $1.50 $1.65 $1.87 $1.66 $2.37 Mar-24 Jun-24 Sep-24 Dec 24 Mar-25 Jun-25 Return on Average Assets (ROAA) (%) 0.57 0.82 0.86 0.94 0.84 1.18 Mar-24 Jun-24 Sep-24 Dec-24 Mar-25 Jun-25 Net Interest Margin (NIM) (%) 4.09 4.12 4.13 4.13 4.16 4.27 Mar-24 Jun-24 Sep-24 Dec-24 Mar-25 Jun-25 Return on Average Tangible Common Equity (ROATCE) * (%) 7.30 10.72 11.16 12.17 10.65 14.70 Mar-24 Jun-24 Sep-24 Dec-24 Mar-25 Jun-25 4

GRAPHIC

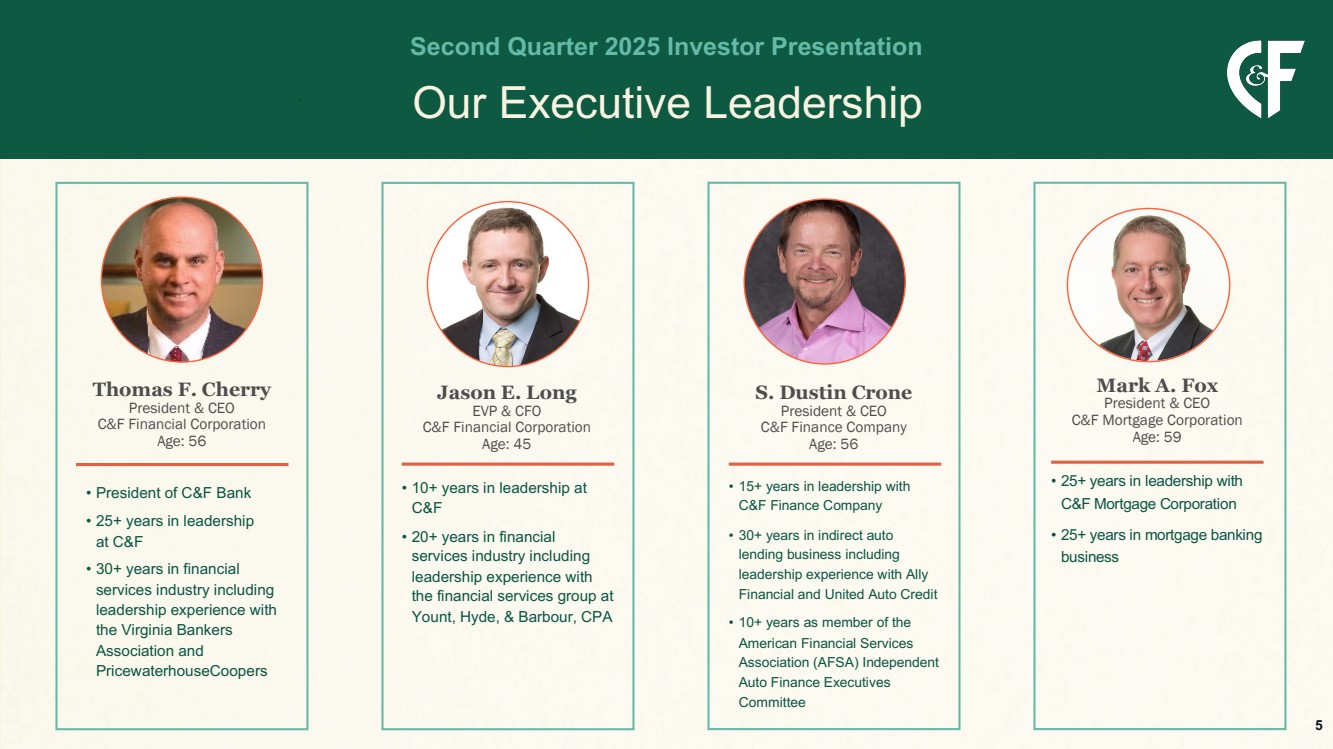
Our Executive Leadership Second Quarter 2025 Investor Presentation • President of C&F Bank • 25+ years in leadership at C&F • 30+ years in financial services industry including leadership experience with the Virginia Bankers Association and PricewaterhouseCoopers Thomas F. Cherry President & CEO C&F Financial Corporation Age: 56 • 10+ years in leadership at C&F • 20+ years in financial services industry including leadership experience with the financial services group at Yount, Hyde, & Barbour, CPA Jason E. Long EVP & CFO C&F Financial Corporation Age: 45 • 15+ years in leadership with C&F Finance Company • 30+ years in indirect auto lending business including leadership experience with Ally Financial and United Auto Credit • 10+ years as member of the American Financial Services Association (AFSA) Independent Auto Finance Executives Committee S. Dustin Crone President & CEO C&F Finance Company Age: 56 • 25+ years in leadership with C&F Mortgage Corporation • 25+ years in mortgage banking business Mark A. Fox President & CEO C&F Mortgage Corporation Age: 59 5

GRAPHIC

Awards Second Quarter 2025 Investor Presentation 6

GRAPHIC

Our Vision and Promise Second Quarter 2025 Investor Presentation 7

GRAPHIC

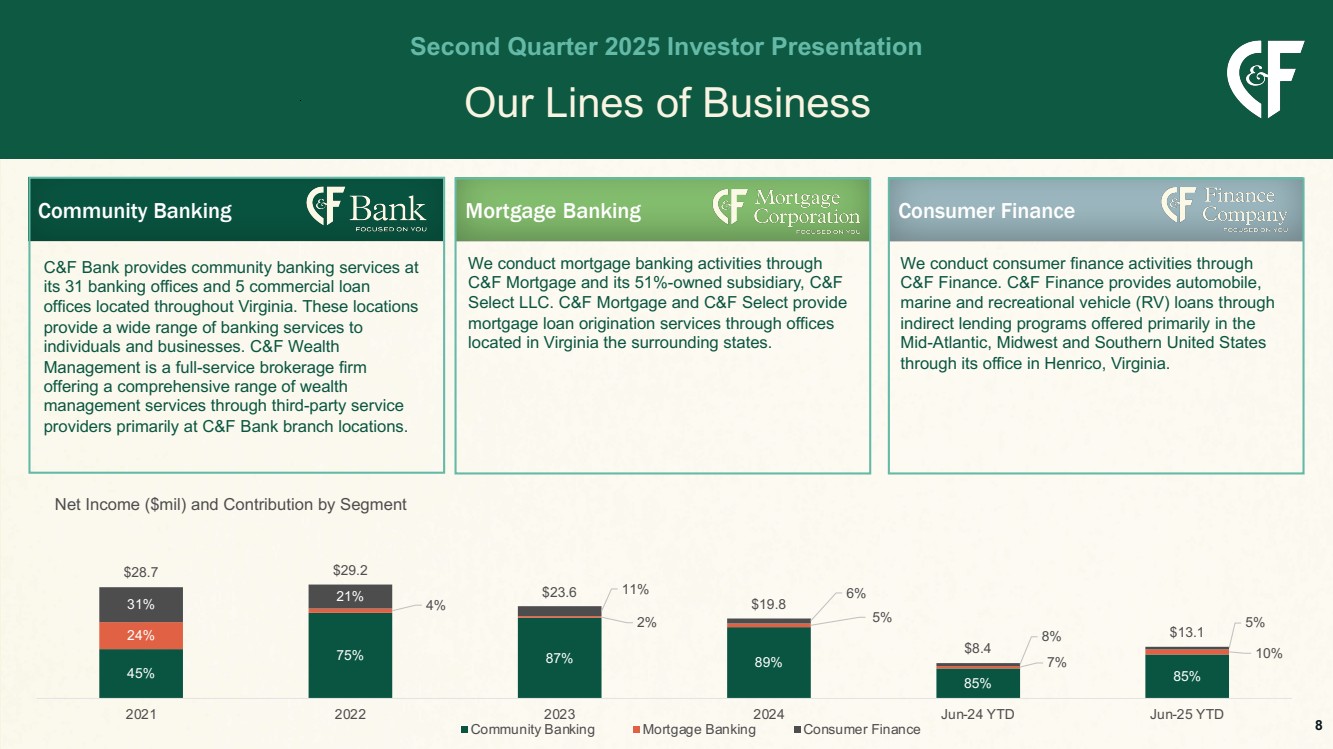
Our Lines of Business Second Quarter 2025 Investor Presentation 45% 75% 87% 89% 85% 85% 24% 4% 2% 5% 7% 10% 31% 21% 11% 6% 8% 5% $28.7 $29.2 $23.6 $19.8 $8.4 $13.1 2021 2022 2023 2024 Jun-24 YTD Jun-25 YTD Net Income ($mil) and Contribution by Segment Community Banking Mortgage Banking Consumer Finance Community Banking Mortgage Banking Consumer Finance We conduct mortgage banking activities through C&F Mortgage and its 51%-owned subsidiary, C&F Select LLC. C&F Mortgage and C&F Select provide mortgage loan origination services through offices located in Virginia the surrounding states. We conduct consumer finance activities through C&F Finance. C&F Finance provides automobile, marine and recreational vehicle (RV) loans through indirect lending programs offered primarily in the Mid-Atlantic, Midwest and Southern United States through its office in Henrico, Virginia. C&F Bank provides community banking services at its 31 banking offices and 5 commercial loan offices located throughout Virginia. These locations provide a wide range of banking services to individuals and businesses. C&F Wealth Management is a full-service brokerage firm offering a comprehensive range of wealth management services through third-party service providers primarily at C&F Bank branch locations. 8

GRAPHIC

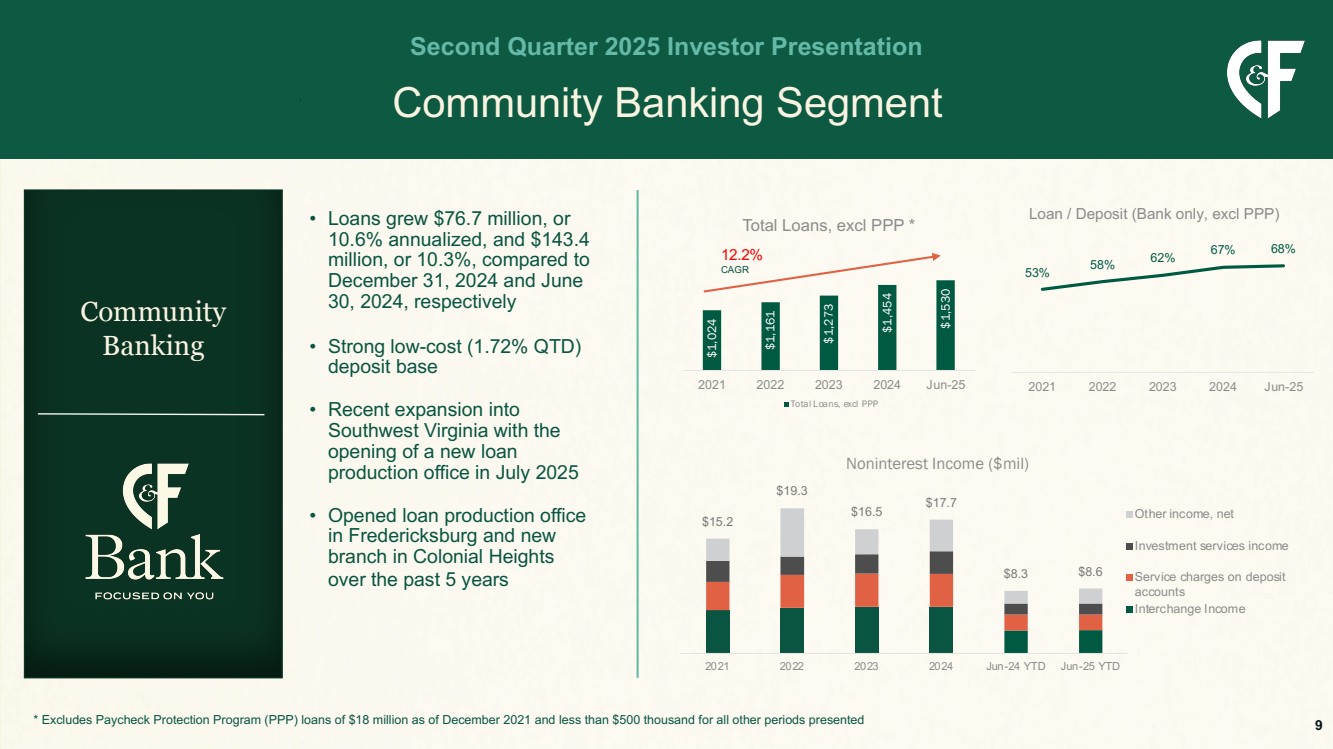
$1,024 $1,161 $1,273 $1,454 $1,530 2021 2022 2023 2024 Jun-25 Total Loans, excl PPP * Total Loans, excl PPP Community Banking Segment Second Quarter 2025 Investor Presentation • Loans grew $76.7 million, or 10.6% annualized, and $143.4 million, or 10.3%, compared to December 31, 2024 and June 30, 2024, respectively • Strong low-cost (1.72% QTD) deposit base • Recent expansion into Southwest Virginia with the opening of a new loan production office in July 2025 • Opened loan production office in Fredericksburg and new branch in Colonial Heights over the past 5 years 12.2% CAGR Community Banking * Excludes Paycheck Protection Program (PPP) loans of $18 million as of December 2021 and less than $500 thousand for all other periods presented 53% 58% 62% 67% 68% 2021 2022 2023 2024 Jun-25 Loan / Deposit (Bank only, excl PPP) $15.2 $19.3 $16.5 $17.7 $8.3 $8.6 2021 2022 2023 2024 Jun-24 YTD Jun-25 YTD Noninterest Income ($mil) Other income, net Investment services income Service charges on deposit accounts Interchange Income 9

GRAPHIC

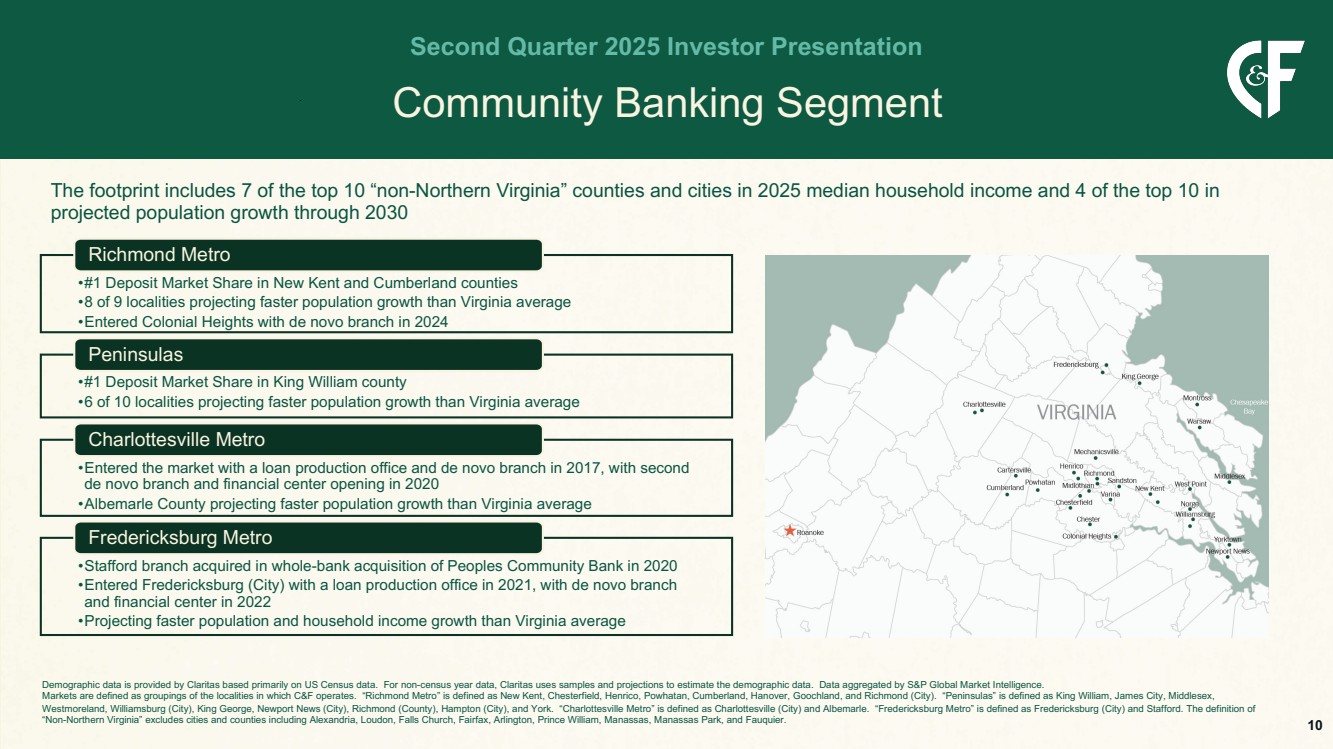
Community Banking Segment Second Quarter 2025 Investor Presentation The footprint includes 7 of the top 10 “non-Northern Virginia” counties and cities in 2025 median household income and 4 of the top 10 in projected population growth through 2030 Demographic data is provided by Claritas based primarily on US Census data. For non-census year data, Claritas uses samples and projections to estimate the demographic data. Data aggregated by S&P Global Market Intelligence. Markets are defined as groupings of the localities in which C&F operates. “Richmond Metro” is defined as New Kent, Chesterfield, Henrico, Powhatan, Cumberland, Hanover, Goochland, and Richmond (City). “Peninsulas” is defined as King William, James City, Middlesex, Westmoreland, Williamsburg (City), King George, Newport News (City), Richmond (County), Hampton (City), and York. “Charlottesville Metro” is defined as Charlottesville (City) and Albemarle. “Fredericksburg Metro” is defined as Fredericksburg (City) and Stafford. The definition of “Non-Northern Virginia” excludes cities and counties including Alexandria, Loudon, Falls Church, Fairfax, Arlington, Prince William, Manassas, Manassas Park, and Fauquier. •#1 Deposit Market Share in New Kent and Cumberland counties •8 of 9 localities projecting faster population growth than Virginia average •Entered Colonial Heights with de novo branch in 2024 Richmond Metro •#1 Deposit Market Share in King William county •6 of 10 localities projecting faster population growth than Virginia average Peninsulas •Entered the market with a loan production office and de novo branch in 2017, with second de novo branch and financial center opening in 2020 •Albemarle County projecting faster population growth than Virginia average Charlottesville Metro •Stafford branch acquired in whole-bank acquisition of Peoples Community Bank in 2020 •Entered Fredericksburg (City) with a loan production office in 2021, with de novo branch and financial center in 2022 •Projecting faster population and household income growth than Virginia average Fredericksburg Metro 10

GRAPHIC

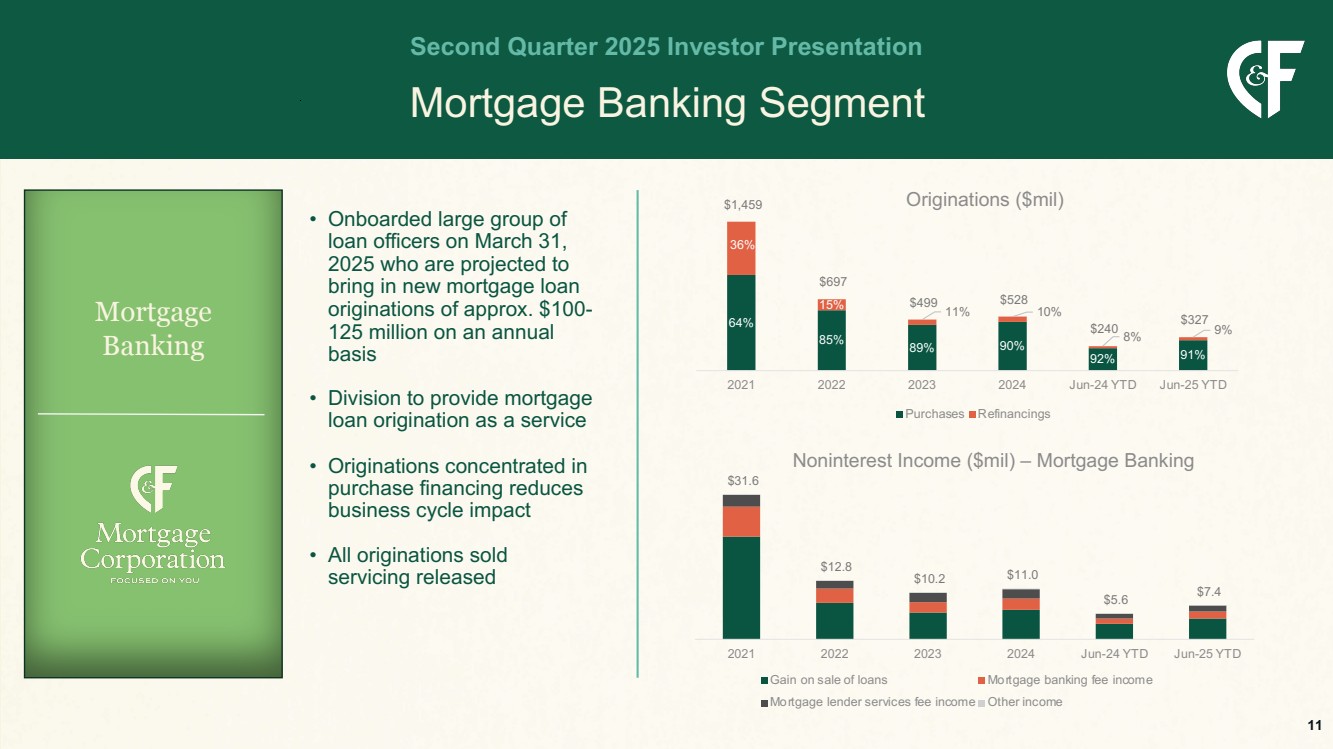
Mortgage Banking Segment Second Quarter 2025 Investor Presentation • Onboarded large group of loan officers on March 31, 2025 who are projected to bring in new mortgage loan originations of approx. $100- 125 million on an annual basis • Division to provide mortgage loan origination as a service • Originations concentrated in purchase financing reduces business cycle impact • All originations sold servicing released Mortgage Banking $31.6 $12.8 $10.2 $11.0 $5.6 $7.4 2021 2022 2023 2024 Jun-24 YTD Jun-25 YTD Noninterest Income ($mil) – Mortgage Banking Gain on sale of loans Mortgage banking fee income Mortgage lender services fee income Other income 64% 85% 89% 90% 92% 91% 36% 15% 11% 10% 8% 9% $1,459 $697 $499 $528 $240 $327 2021 2022 2023 2024 Jun-24 YTD Jun-25 YTD Originations ($mil) Purchases Refinancings 11

GRAPHIC

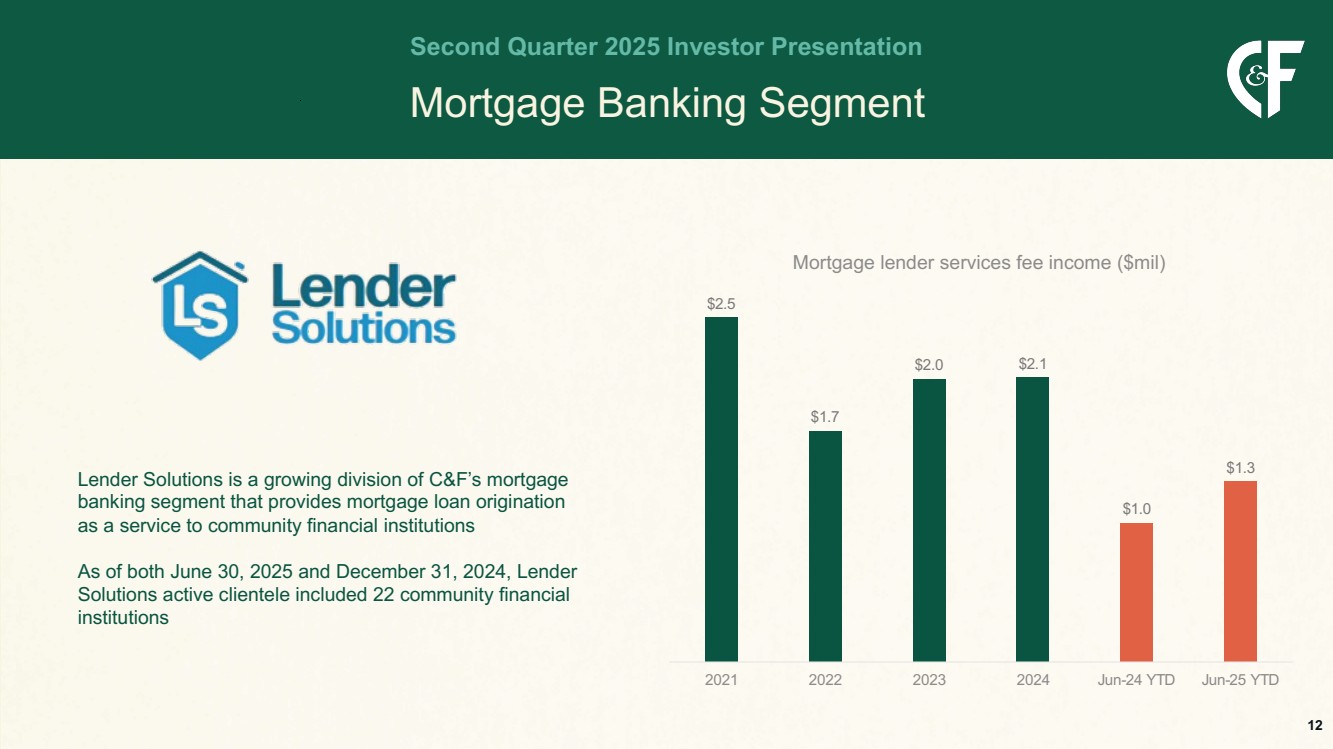
Mortgage Banking Segment Second Quarter 2025 Investor Presentation Lender Solutions is a growing division of C&F’s mortgage banking segment that provides mortgage loan origination as a service to community financial institutions As of both June 30, 2025 and December 31, 2024, Lender Solutions active clientele included 22 community financial institutions $2.5 $1.7 $2.0 $2.1 $1.0 $1.3 2021 2022 2023 2024 Jun-24 YTD Jun-25 YTD Mortgage lender services fee income ($mil) 12

GRAPHIC

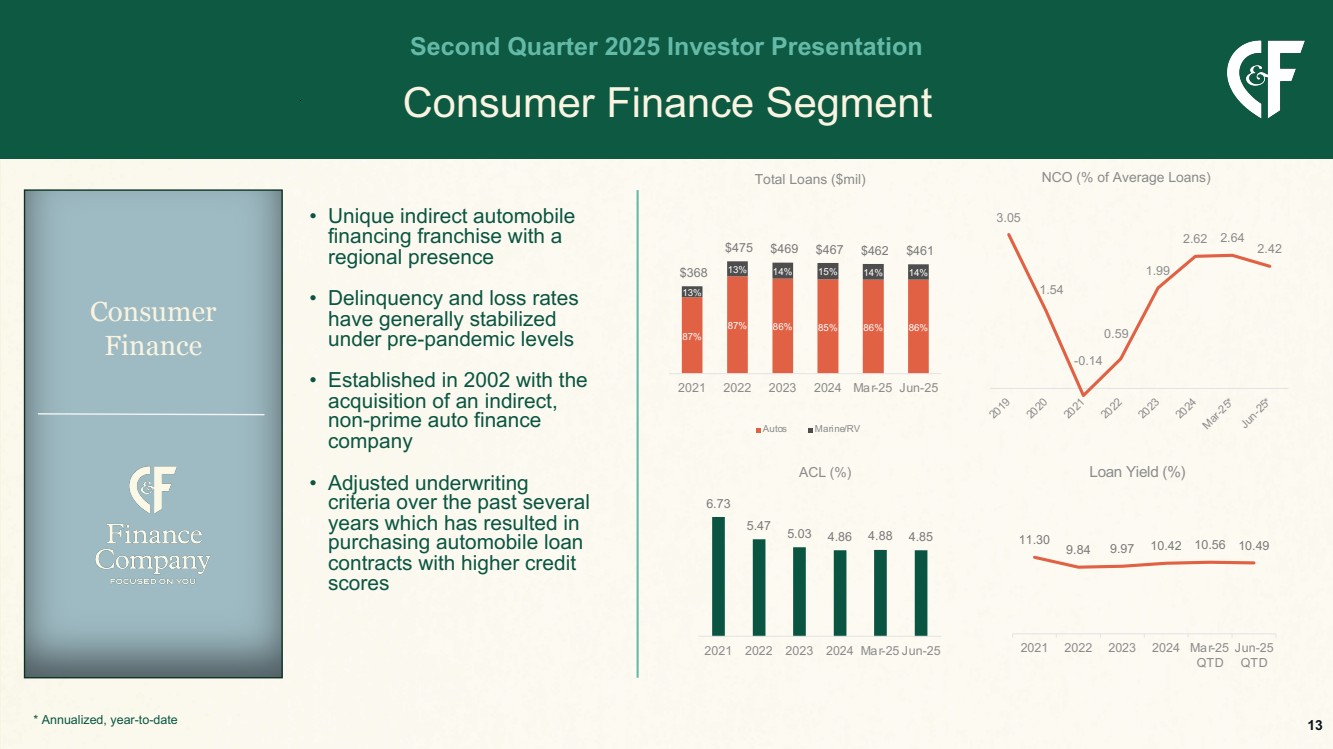
Consumer Finance Segment Second Quarter 2025 Investor Presentation • Unique indirect automobile financing franchise with a regional presence • Delinquency and loss rates have generally stabilized under pre-pandemic levels • Established in 2002 with the acquisition of an indirect, non-prime auto finance company • Adjusted underwriting criteria over the past several years which has resulted in purchasing automobile loan contracts with higher credit scores Consumer Finance 3.05 1.54 -0.14 0.59 1.99 2.62 2.64 2.42 2019 2020 2021 2022 2023 2024 Mar-25* Jun-25* NCO (% of Average Loans) 6.73 5.47 5.03 4.86 4.88 4.85 2021 2022 2023 2024 Mar-25 Jun-25 ACL (%) 11.30 9.84 9.97 10.42 10.56 10.49 2021 2022 2023 2024 Mar-25 QTD Jun-25 QTD Loan Yield (%) 87% 87% 86% 85% 86% 86% 13% $368 13% 14% 15% 14% 14% $475 $469 $467 $462 $461 2021 2022 2023 2024 Mar-25 Jun-25 Total Loans ($mil) Autos Marine/RV 13 * Annualized, year-to-date

GRAPHIC

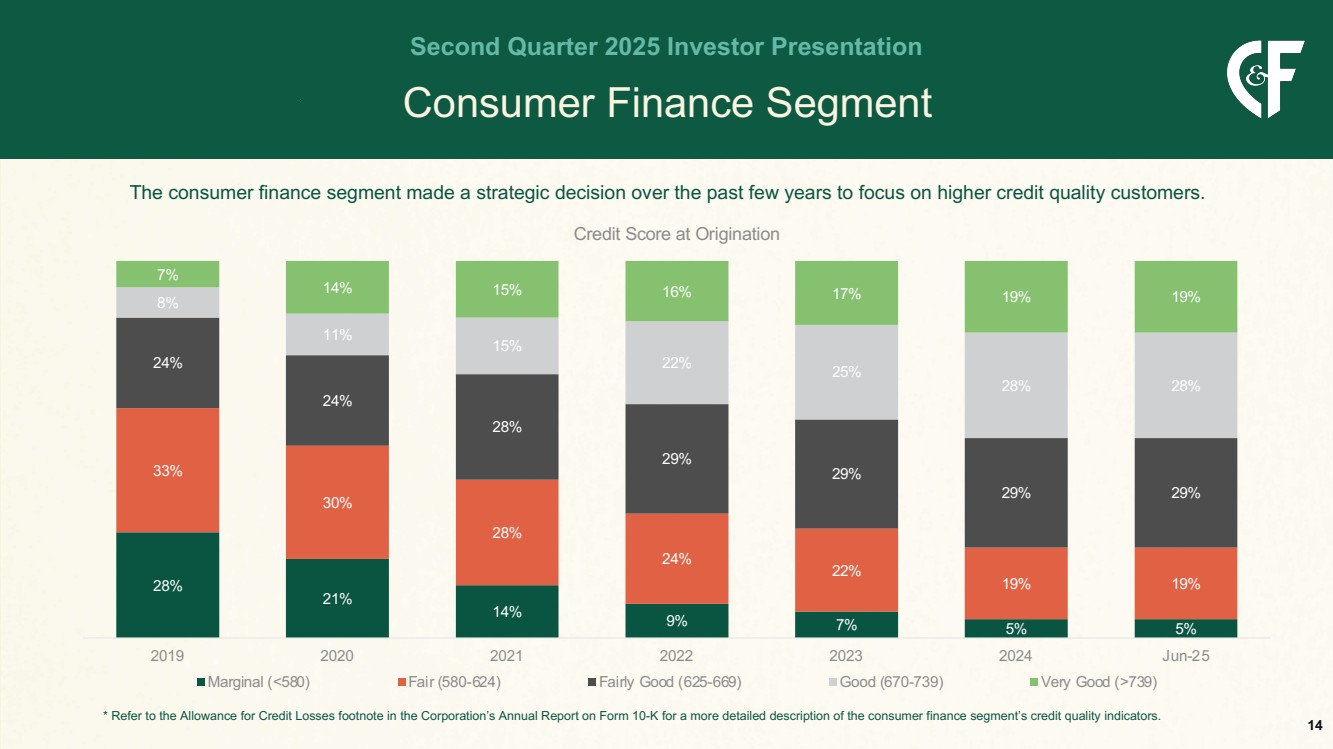
Consumer Finance Segment Second Quarter 2025 Investor Presentation The consumer finance segment made a strategic decision over the past few years to focus on higher credit quality customers. * Refer to the Allowance for Credit Losses footnote in the Corporation’s Annual Report on Form 10-K for a more detailed description of the consumer finance segment’s credit quality indicators. 28% 21% 14% 9% 7% 5% 5% 33% 30% 28% 24% 22% 19% 19% 24% 24% 28% 29% 29% 29% 29% 8% 11% 15% 22% 25% 28% 28% 7% 14% 15% 16% 17% 19% 19% 2019 2020 2021 2022 2023 2024 Jun-25 Credit Score at Origination Marginal (<580) Fair (580-624) Fairly Good (625-669) Good (670-739) Very Good (>739) 14

GRAPHIC

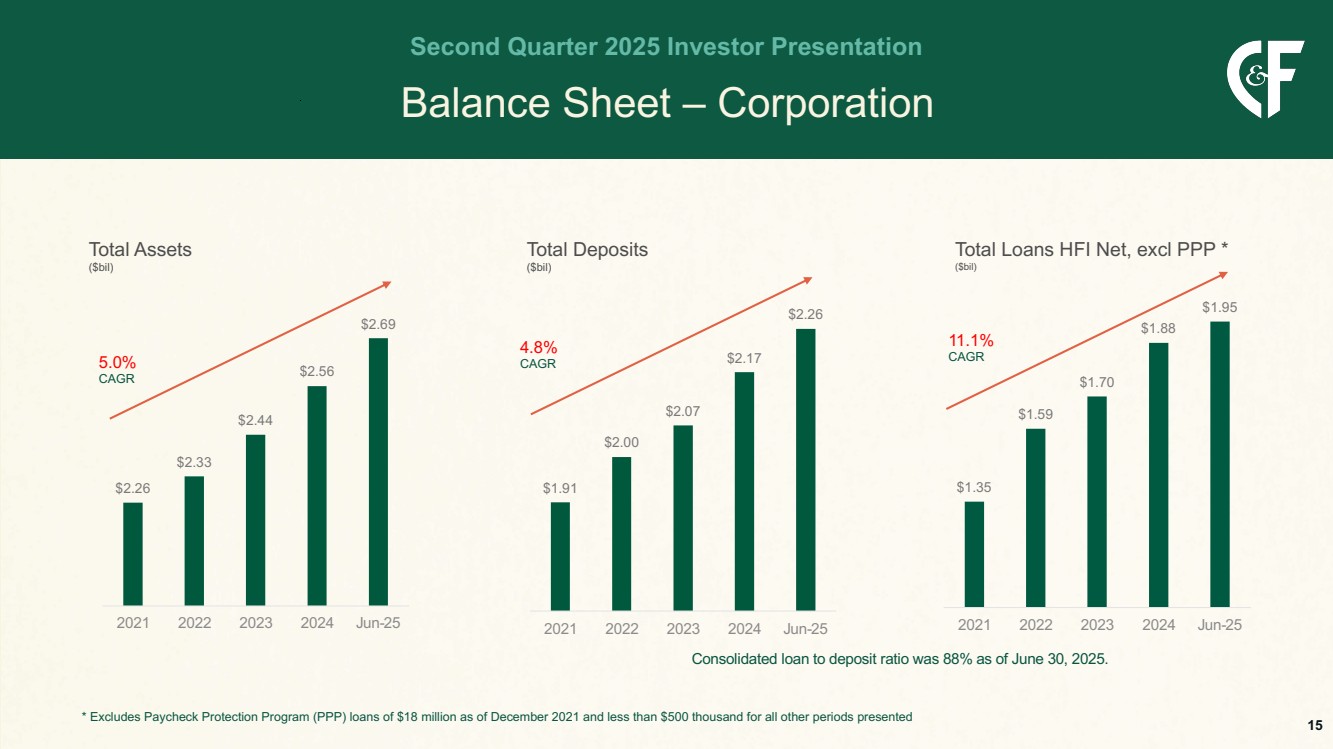
$1.35 $1.59 $1.70 $1.88 $1.95 2021 2022 2023 2024 Jun-25 $2.26 $2.33 $2.44 $2.56 $2.69 2021 2022 2023 2024 Jun-25 $1.91 $2.00 $2.07 $2.17 $2.26 2021 2022 2023 2024 Jun-25 Balance Sheet – Corporation Second Quarter 2025 Investor Presentation Total Deposits ($bil) Total Assets ($bil) 5.0% CAGR 4.8% CAGR 11.1% CAGR Total Loans HFI Net, excl PPP * ($bil) * Excludes Paycheck Protection Program (PPP) loans of $18 million as of December 2021 and less than $500 thousand for all other periods presented Consolidated loan to deposit ratio was 88% as of June 30, 2025. 15

GRAPHIC

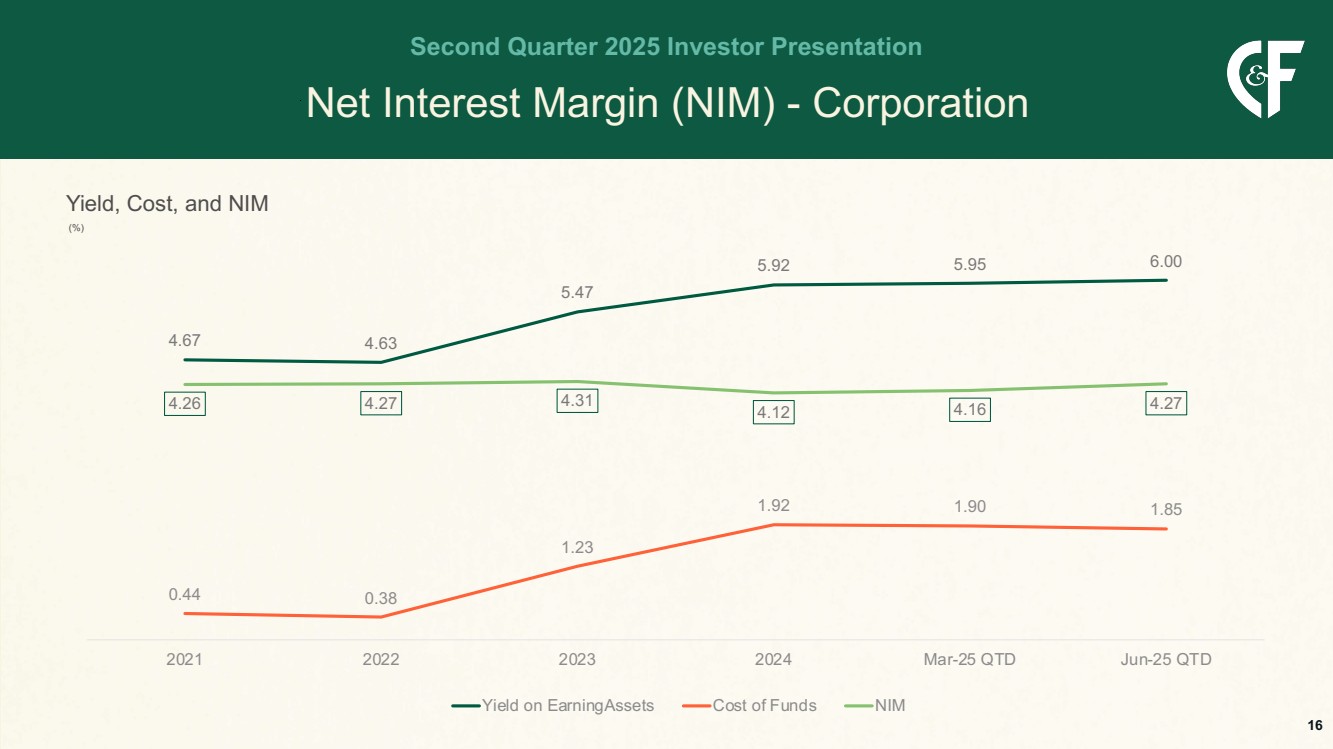
Net Interest Margin (NIM) - Corporation Second Quarter 2025 Investor Presentation 4.67 4.63 5.47 5.92 5.95 6.00 0.44 0.38 1.23 1.92 1.90 1.85 4.26 4.27 4.31 4.12 4.16 4.27 2021 2022 2023 2024 Mar-25 QTD Jun-25 QTD Yield on EarningAssets Cost of Funds NIM Yield, Cost, and NIM (%) 16

GRAPHIC

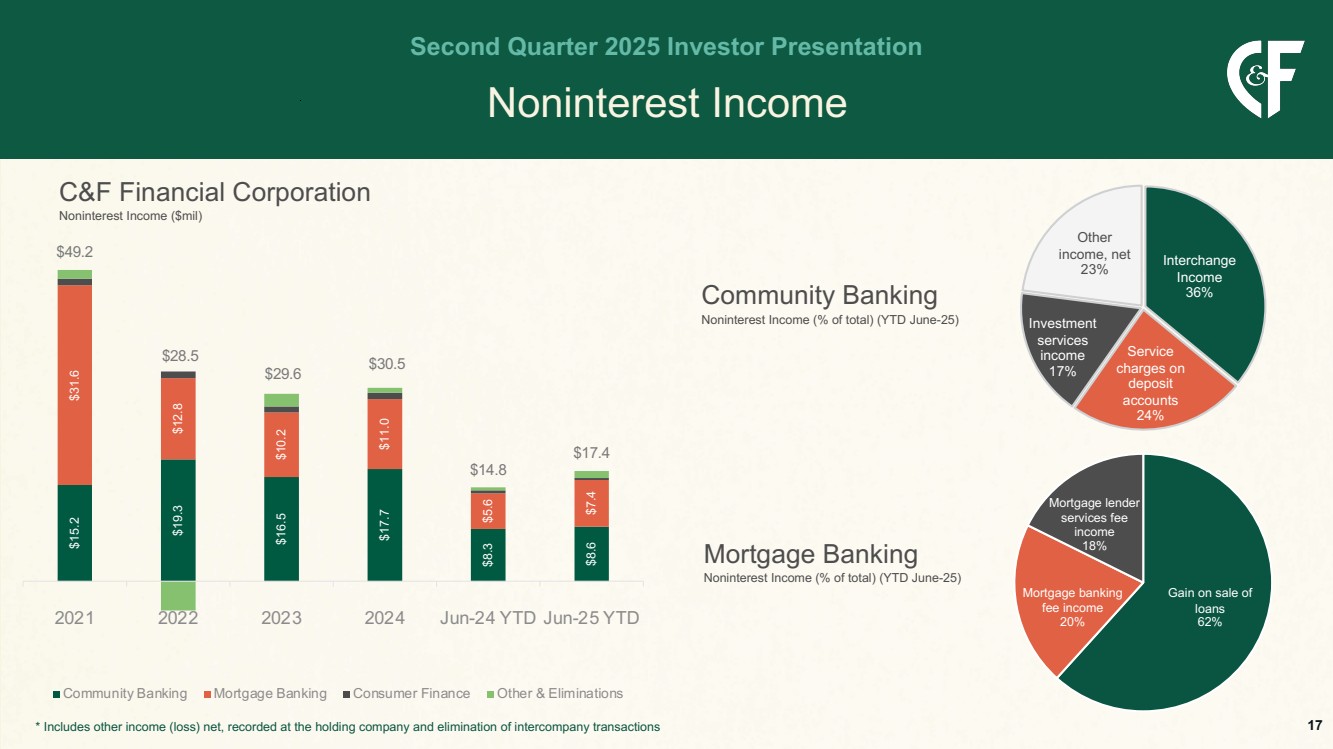
Noninterest Income Second Quarter 2025 Investor Presentation $15.2 $19.3 $16.5 $17.7 $8.3 $8.6 $31.6 $12.8 $10.2 $11.0 $5.6 $7.4 $49.2 $28.5 $29.6 $30.5 $14.8 $17.4 2021 2022 2023 2024 Jun-24 YTD Jun-25 YTD Community Banking Mortgage Banking Consumer Finance Other & Eliminations C&F Financial Corporation Noninterest Income ($mil) Community Banking Noninterest Income (% of total) (YTD June-25) Mortgage Banking Noninterest Income (% of total) (YTD June-25) Interchange Income 36% Service charges on deposit accounts 24% Investment services income 17% Other income, net 23% Gain on sale of loans 62% Mortgage banking fee income 20% Mortgage lender services fee income 18% * Includes other income (loss) net, recorded at the holding company and elimination of intercompany transactions 17

GRAPHIC

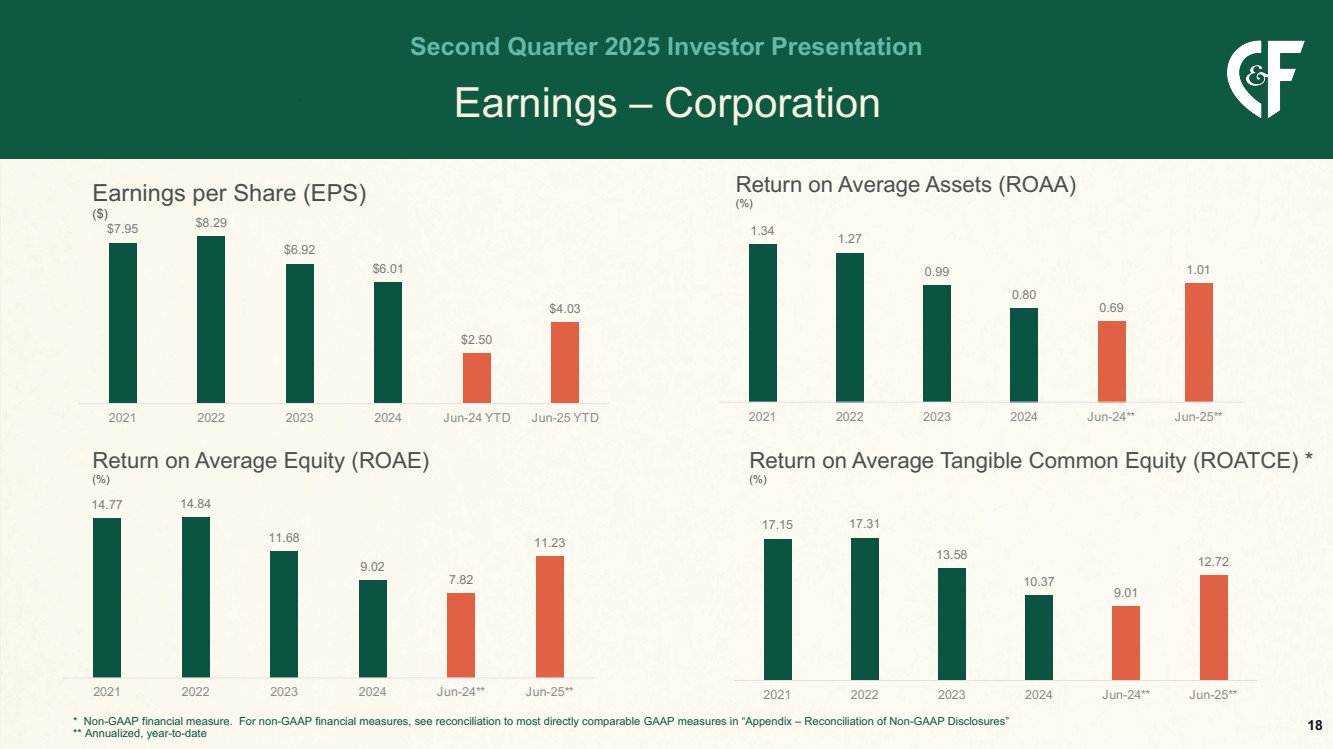
Earnings – Corporation Second Quarter 2025 Investor Presentation Return on Average Equity (ROAE) (%) Earnings per Share (EPS) ($) Return on Average Assets (ROAA) (%) Return on Average Tangible Common Equity (ROATCE) * (%) * Non-GAAP financial measure. For non-GAAP financial measures, see reconciliation to most directly comparable GAAP measures in “Appendix – Reconciliation of Non-GAAP Disclosures” ** Annualized, year-to-date $7.95 $8.29 $6.92 $6.01 $2.50 $4.03 2021 2022 2023 2024 Jun-24 YTD Jun-25 YTD 1.34 1.27 0.99 0.80 0.69 1.01 2021 2022 2023 2024 Jun-24** Jun-25** 14.77 14.84 11.68 9.02 7.82 11.23 2021 2022 2023 2024 Jun-24** Jun-25** 17.15 17.31 13.58 10.37 9.01 12.72 2021 2022 2023 2024 Jun-24** Jun-25** 18

GRAPHIC

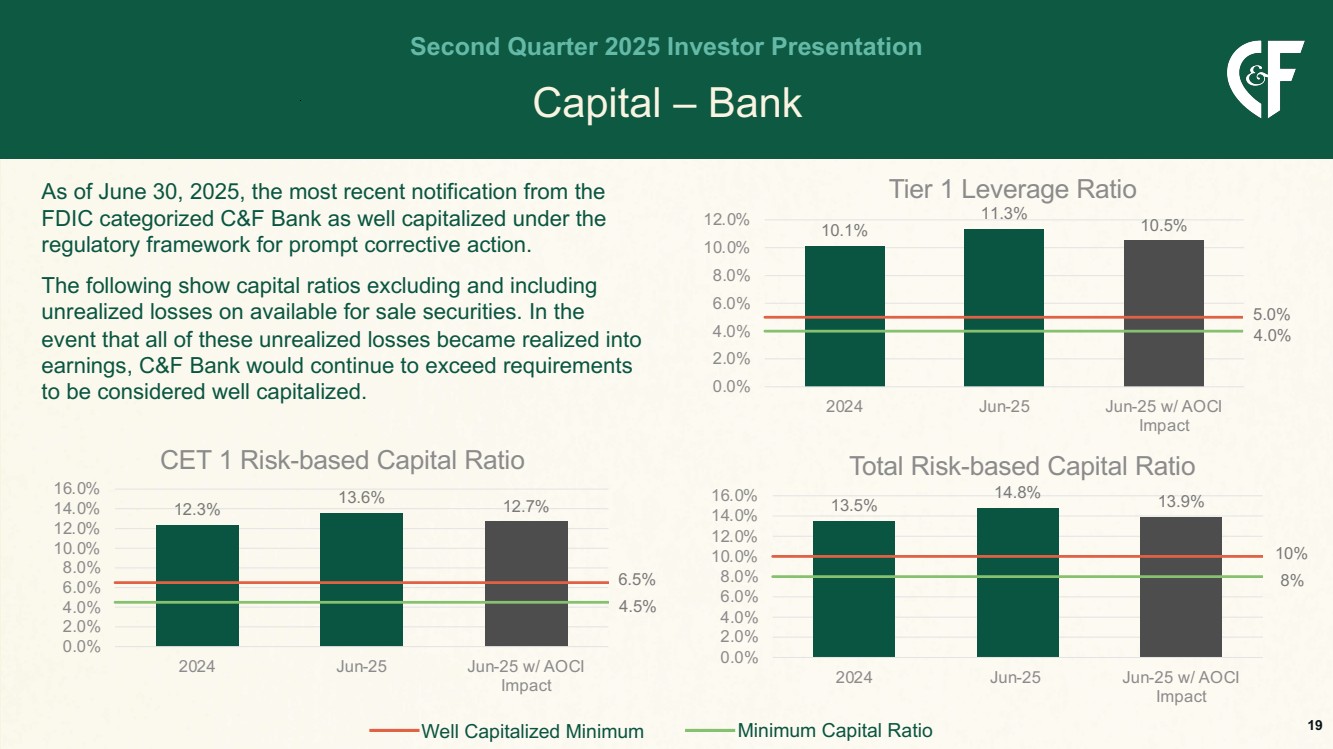
Capital – Bank Second Quarter 2025 Investor Presentation As of June 30, 2025, the most recent notification from the FDIC categorized C&F Bank as well capitalized under the regulatory framework for prompt corrective action. The following show capital ratios excluding and including unrealized losses on available for sale securities. In the event that all of these unrealized losses became realized into earnings, C&F Bank would continue to exceed requirements to be considered well capitalized. 12.3% 13.6% 12.7% 6.5% 4.5% 0.0% 2.0% 4.0% 6.0% 8.0% 10.0% 12.0% 14.0% 16.0% 2024 Jun-25 Jun-25 w/ AOCI Impact CET 1 Risk-based Capital Ratio 10.1% 11.3% 10.5% 5.0% 4.0% 0.0% 2.0% 4.0% 6.0% 8.0% 10.0% 12.0% 2024 Jun-25 Jun-25 w/ AOCI Impact Tier 1 Leverage Ratio 13.5% 14.8% 13.9% 10% 8% 0.0% 2.0% 4.0% 6.0% 8.0% 10.0% 12.0% 14.0% 16.0% 2024 Jun-25 Jun-25 w/ AOCI Impact Total Risk-based Capital Ratio Well Capitalized Minimum Minimum Capital Ratio 19

GRAPHIC

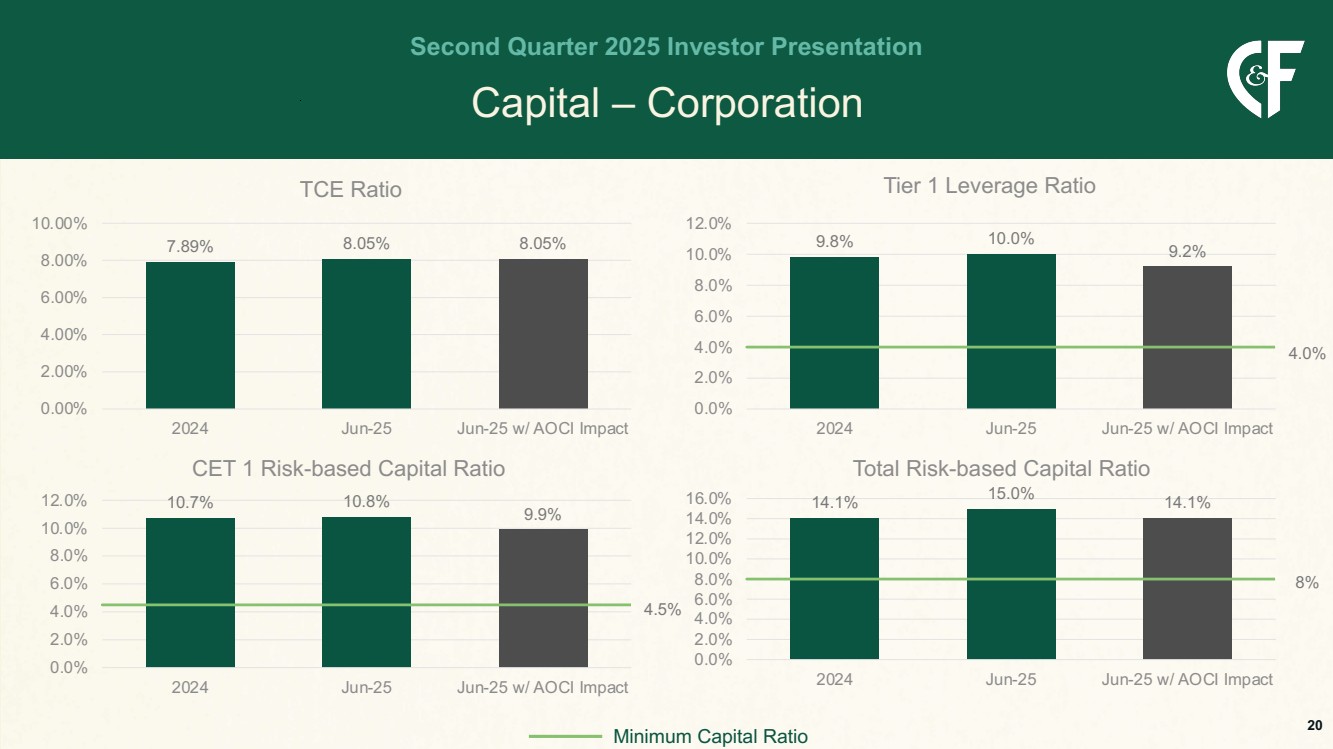
Capital – Corporation Second Quarter 2025 Investor Presentation 9.8% 10.0% 9.2% 4.0% 0.0% 2.0% 4.0% 6.0% 8.0% 10.0% 12.0% 2024 Jun-25 Jun-25 w/ AOCI Impact Tier 1 Leverage Ratio 7.89% 8.05% 8.05% 0.00% 2.00% 4.00% 6.00% 8.00% 10.00% 2024 Jun-25 Jun-25 w/ AOCI Impact TCE Ratio 10.7% 10.8% 9.9% 4.5% 0.0% 2.0% 4.0% 6.0% 8.0% 10.0% 12.0% 2024 Jun-25 Jun-25 w/ AOCI Impact CET 1 Risk-based Capital Ratio 14.1% 15.0% 14.1% 8% 0.0% 2.0% 4.0% 6.0% 8.0% 10.0% 12.0% 14.0% 16.0% 2024 Jun-25 Jun-25 w/ AOCI Impact Total Risk-based Capital Ratio Minimum Capital Ratio 20

GRAPHIC

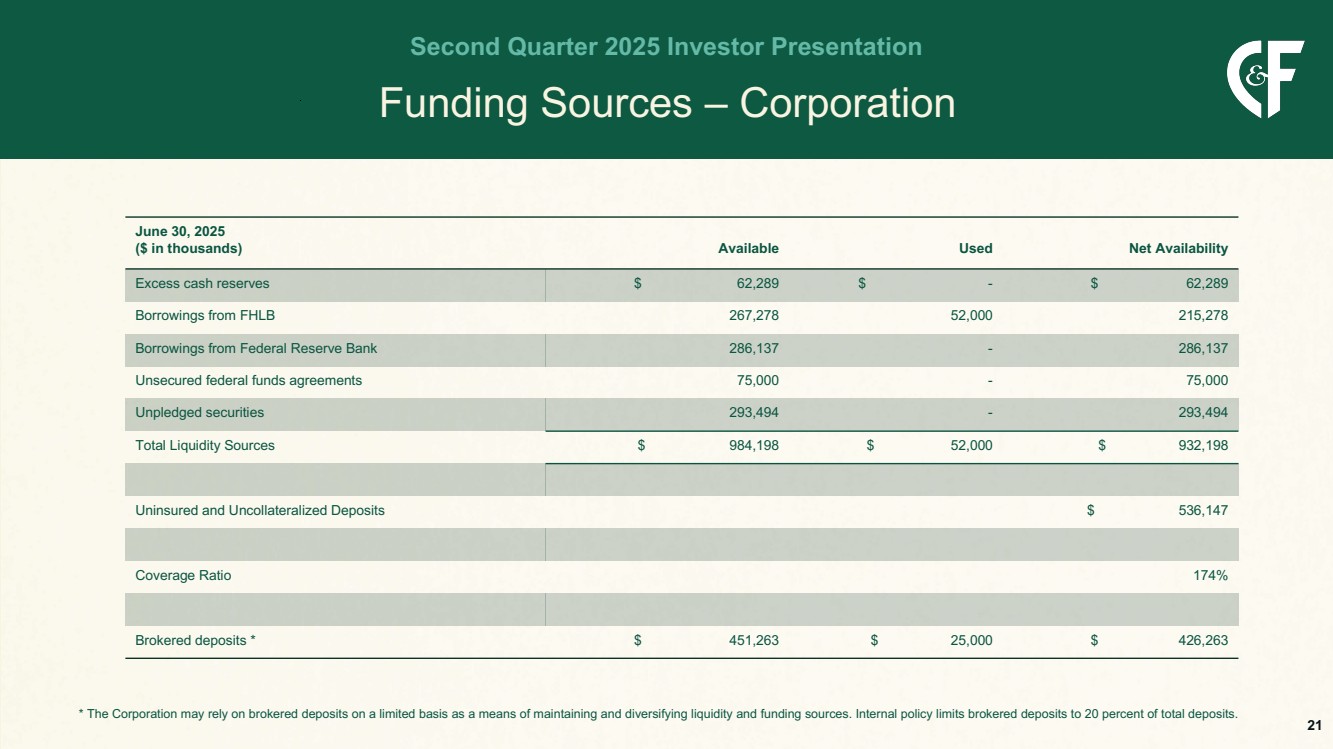
Funding Sources – Corporation Second Quarter 2025 Investor Presentation * The Corporation may rely on brokered deposits on a limited basis as a means of maintaining and diversifying liquidity and funding sources. Internal policy limits brokered deposits to 20 percent of total deposits. June 30, 2025 ($ in thousands) Available Used Net Availability Excess cash reserves $ 62,289 $ - $ 62,289 Borrowings from FHLB 267,278 52,000 215,278 Borrowings from Federal Reserve Bank 286,137 - 286,137 Unsecured federal funds agreements 75,000 - 75,000 Unpledged securities 293,494 - 293,494 Total Liquidity Sources $ 984,198 $ 52,000 $ 932,198 Uninsured and Uncollateralized Deposits $ 536,147 Coverage Ratio 174% Brokered deposits * $ 451,263 $ 25,000 $ 426,263 21

GRAPHIC

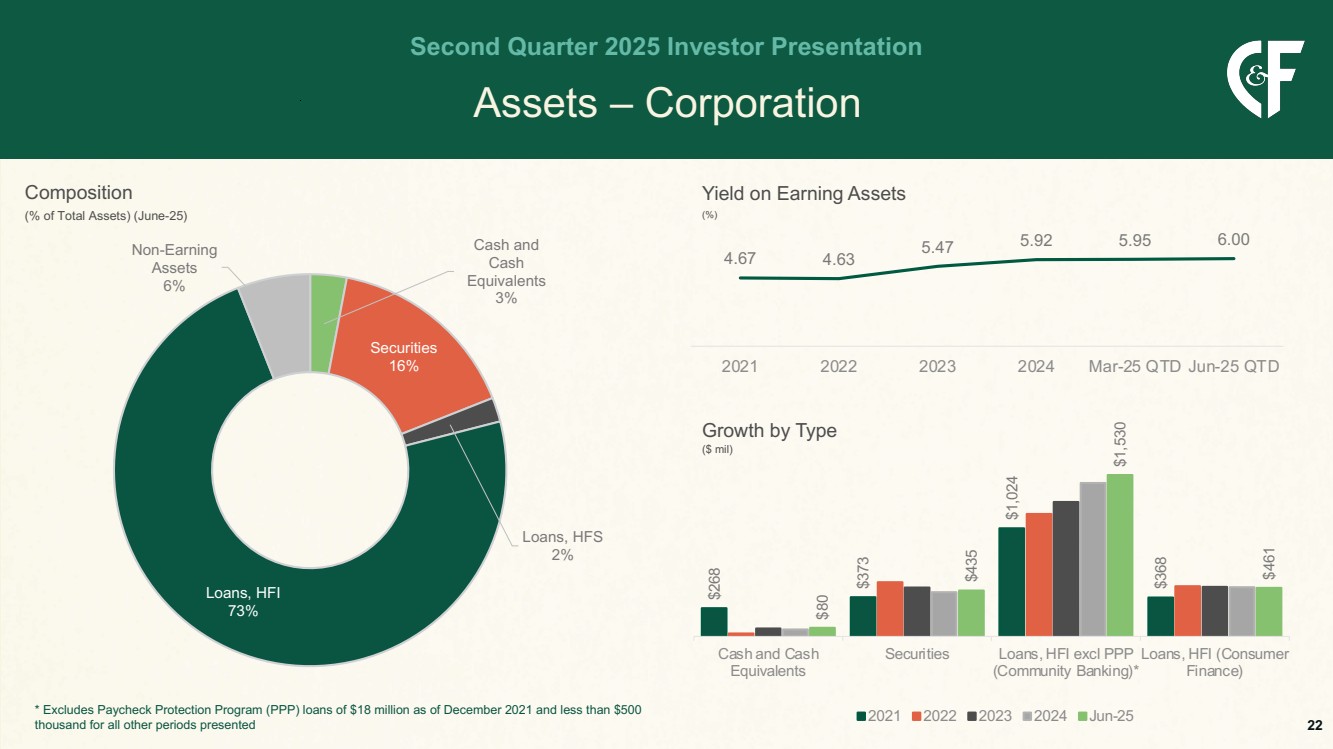
Assets – Corporation Second Quarter 2025 Investor Presentation Cash and Cash Equivalents 3% Securities 16% Loans, HFS 2% Loans, HFI 73% Non-Earning Assets 6% 4.67 4.63 5.47 5.92 5.95 6.00 2021 2022 2023 2024 Mar-25 QTD Jun-25 QTD Yield on Earning Assets (%) $268 $373 $1,024 $368 $80 $435 $1,530 $461 Cash and Cash Equivalents Securities Loans, HFI excl PPP (Community Banking)* Loans, HFI (Consumer Finance) 2021 2022 2023 2024 Jun-25 Growth by Type ($ mil) Composition (% of Total Assets) (June-25) 22 * Excludes Paycheck Protection Program (PPP) loans of $18 million as of December 2021 and less than $500 thousand for all other periods presented

GRAPHIC

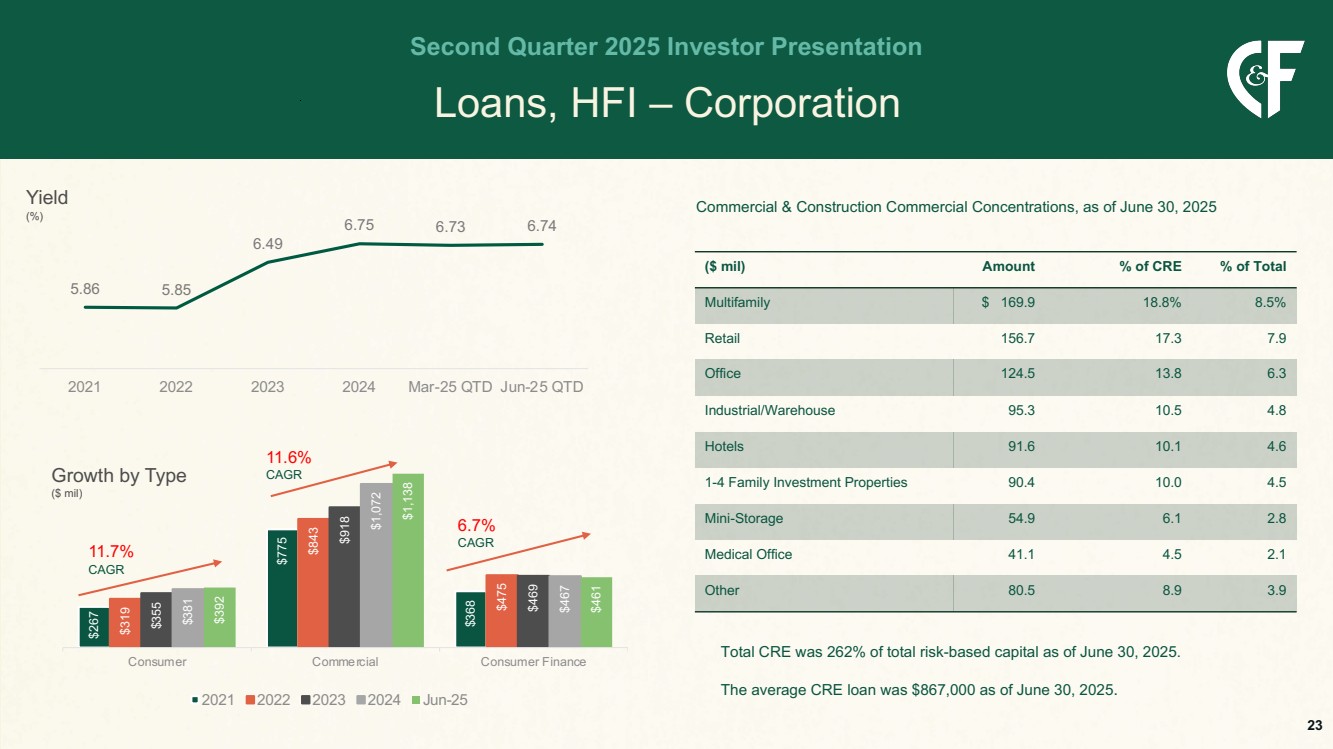
$267 $775 $368 $319 $843 $475 $355 $918 $469 $381 $1,072 $467 $392 $1,138 $461 Consumer Commercial Consumer Finance 2021 2022 2023 2024 Jun-25 Loans, HFI – Corporation Second Quarter 2025 Investor Presentation Yield (%) 5.86 5.85 6.49 6.75 6.73 6.74 2021 2022 2023 2024 Mar-25 QTD Jun-25 QTD Growth by Type ($ mil) 11.6% CAGR 6.7% CAGR 11.7% CAGR Commercial & Construction Commercial Concentrations, as of June 30, 2025 Total CRE was 262% of total risk-based capital as of June 30, 2025. The average CRE loan was $867,000 as of June 30, 2025. ($ mil) Amount % of CRE % of Total Multifamily $ 169.9 18.8% 8.5% Retail 156.7 17.3 7.9 Office 124.5 13.8 6.3 Industrial/Warehouse 95.3 10.5 4.8 Hotels 91.6 10.1 4.6 1-4 Family Investment Properties 90.4 10.0 4.5 Mini-Storage 54.9 6.1 2.8 Medical Office 41.1 4.5 2.1 Other 80.5 8.9 3.9 23

GRAPHIC

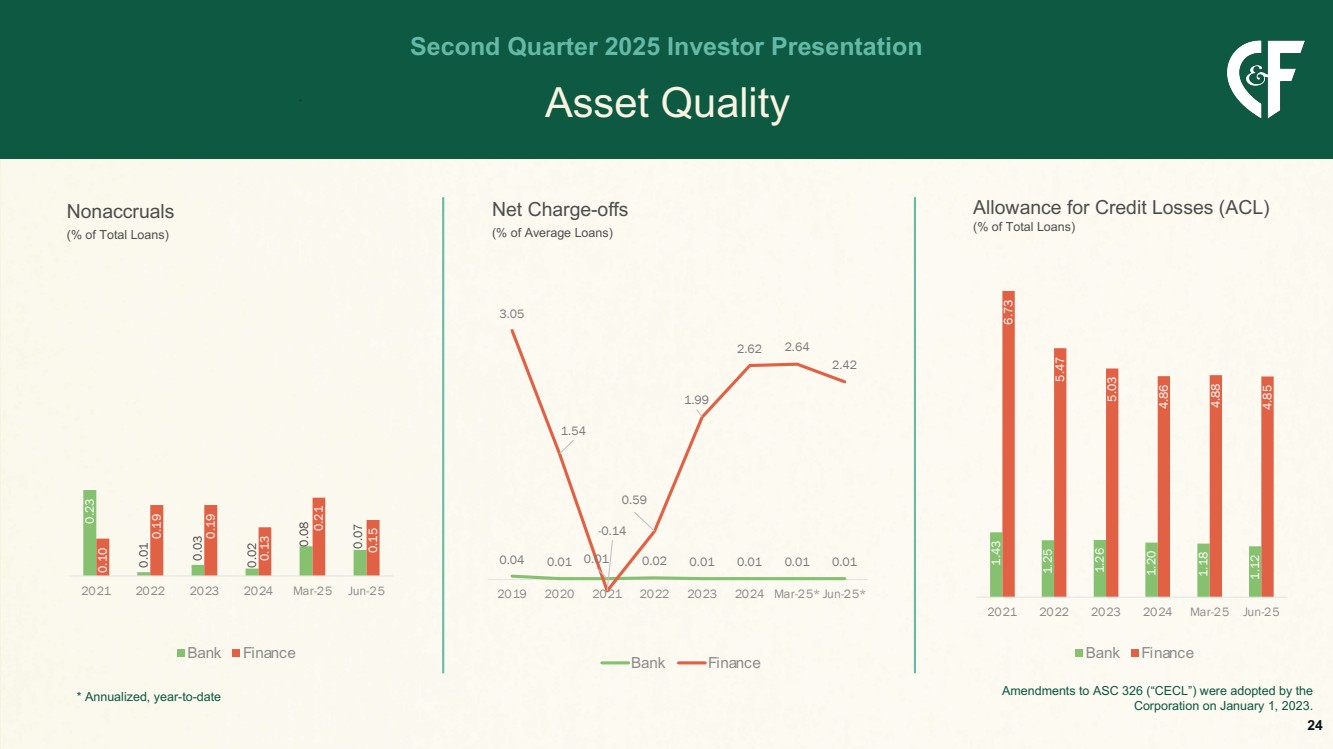
Asset Quality Second Quarter 2025 Investor Presentation 0.23 0.01 0.03 0.02 0.08 0.07 0.10 0.19 0.19 0.13 0.21 0.15 2021 2022 2023 2024 Mar-25 Jun-25 Bank Finance 0.04 0.01 0.01 0.02 0.01 0.01 0.01 0.01 3.05 1.54 -0.14 0.59 1.99 2.62 2.64 2.42 2019 2020 2021 2022 2023 2024 Mar-25* Jun-25* Bank Finance 1.43 1.25 1.26 1.20 1.18 1.12 6.73 5.47 5.03 4.86 4.88 4.85 2021 2022 2023 2024 Mar-25 Jun-25 Bank Finance Nonaccruals (% of Total Loans) Net Charge-offs (% of Average Loans) Allowance for Credit Losses (ACL) (% of Total Loans) Amendments to ASC 326 (“CECL”) were adopted by the Corporation on January 1, 2023. * Annualized, year-to-date 24

GRAPHIC

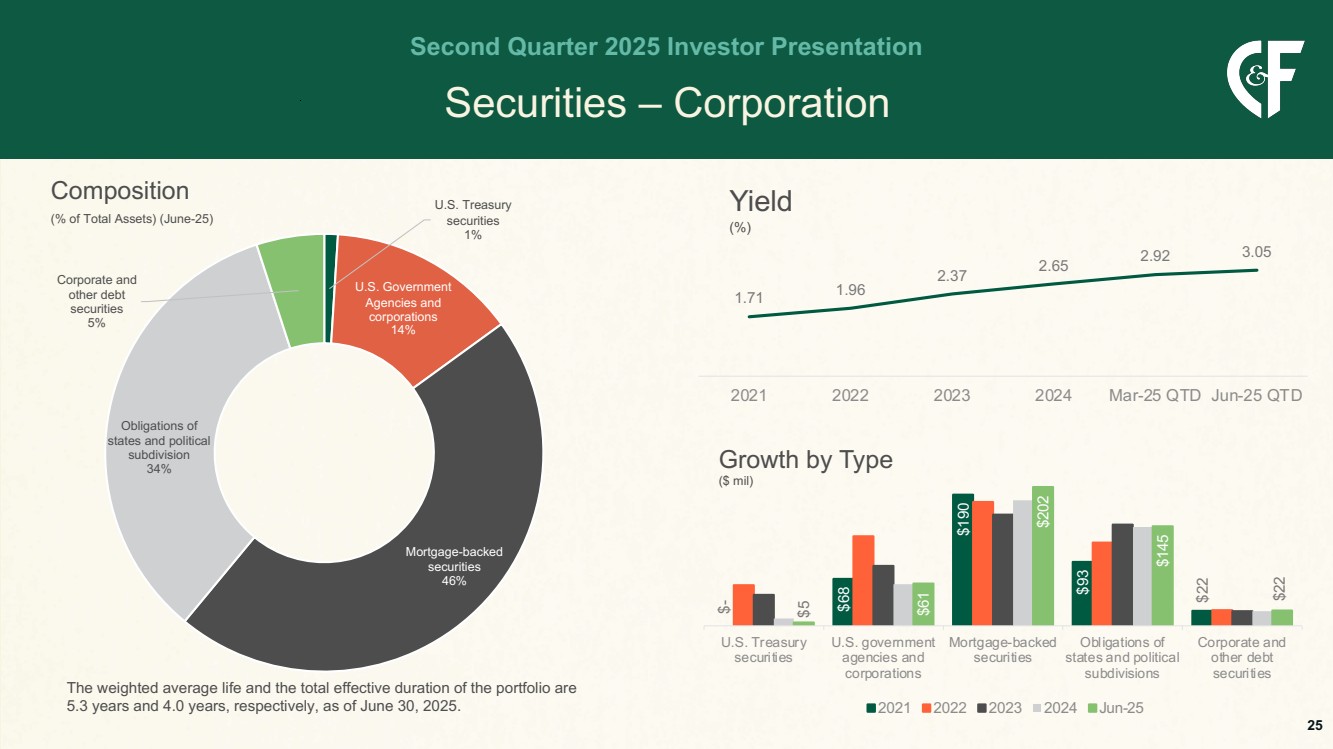
Securities – Corporation Second Quarter 2025 Investor Presentation U.S. Treasury securities 1% U.S. Government Agencies and corporations 14% Mortgage-backed securities 46% Obligations of states and political subdivision 34% Corporate and other debt securities 5% The weighted average life and the total effective duration of the portfolio are 5.3 years and 4.0 years, respectively, as of June 30, 2025. Composition (% of Total Assets) (June-25) Yield (%) 1.71 1.96 2.37 2.65 2.92 3.05 2021 2022 2023 2024 Mar-25 QTD Jun-25 QTD $- $68 $190 $93 $22 $5 $61 $202 $145 $22 U.S. Treasury securities U.S. government agencies and corporations Mortgage-backed securities Obligations of states and political subdivisions Corporate and other debt securities 2021 2022 2023 2024 Jun-25 Growth by Type ($ mil) 25

GRAPHIC

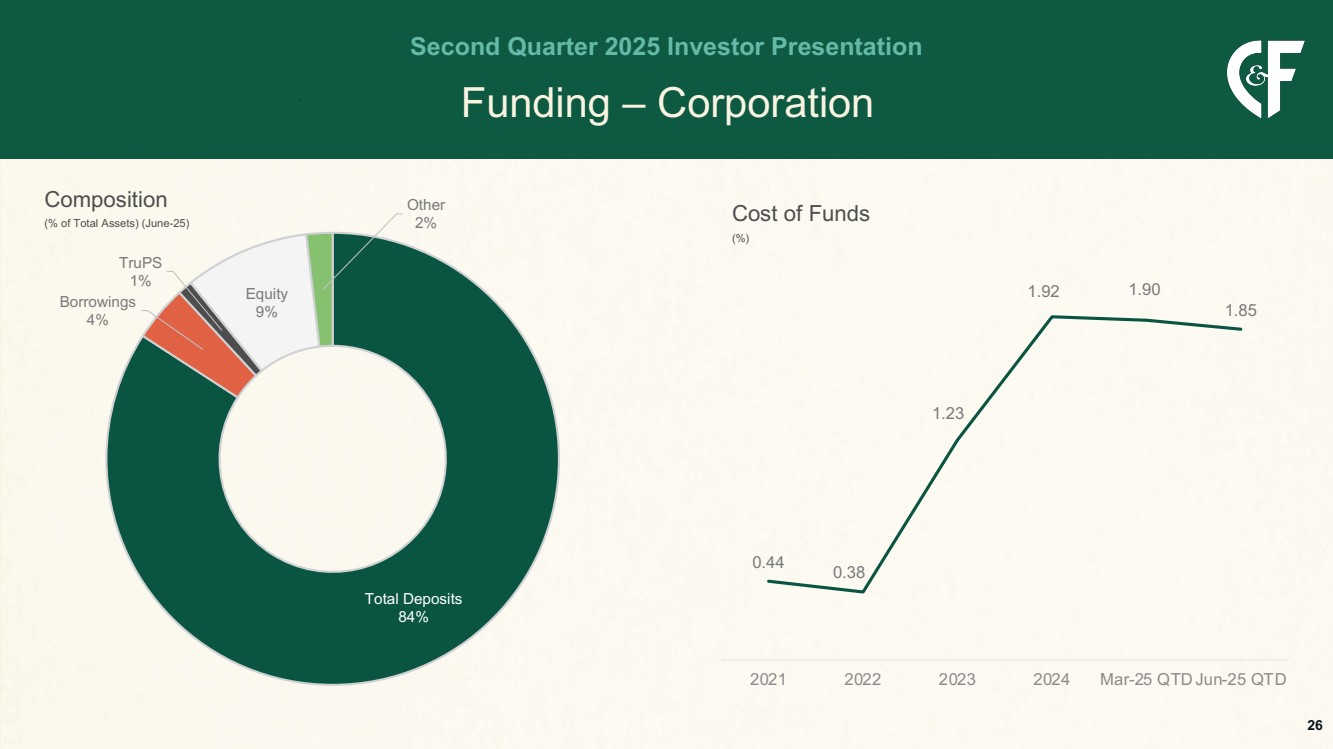
Funding – Corporation Second Quarter 2025 Investor Presentation Total Deposits 84% Borrowings 4% TruPS 1% Equity 9% Other 2% Composition (% of Total Assets) (June-25) 0.44 0.38 1.23 1.92 1.90 1.85 2021 2022 2023 2024 Mar-25 QTD Jun-25 QTD Cost of Funds (%) 26

GRAPHIC

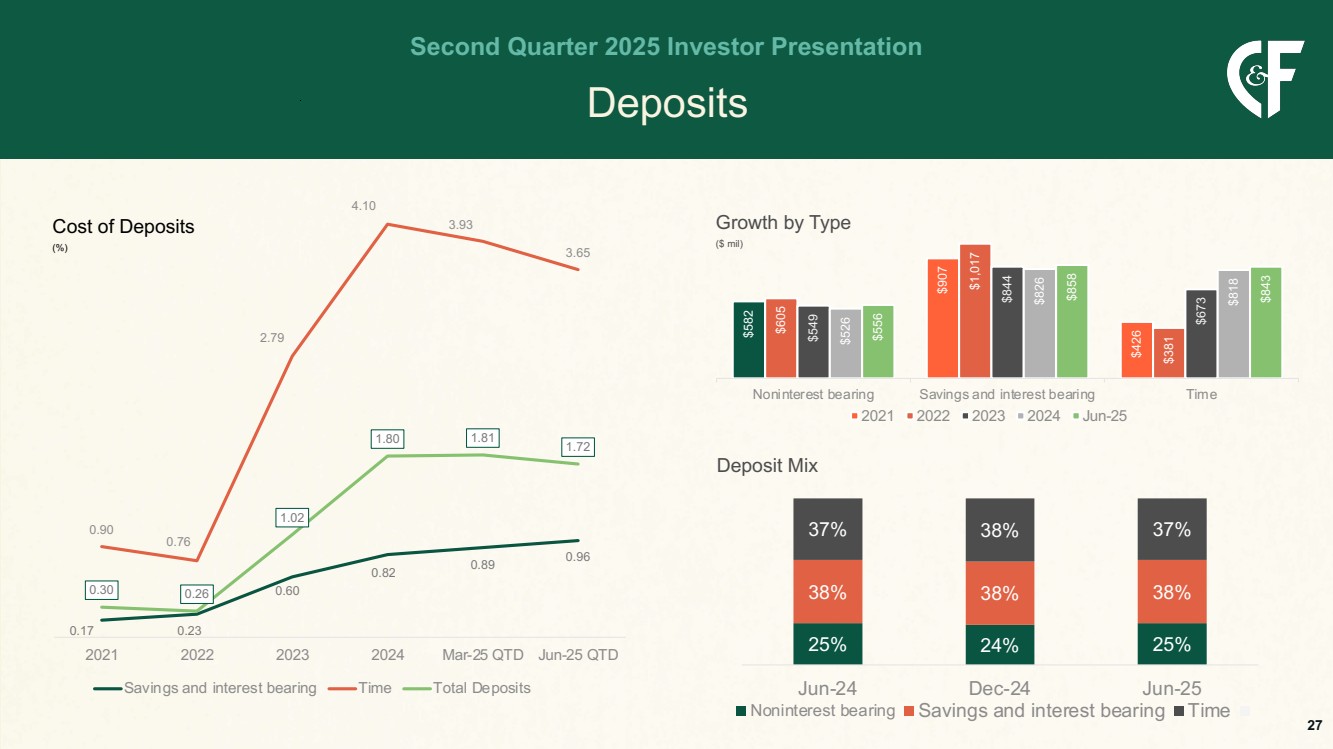
Deposits Second Quarter 2025 Investor Presentation 0.17 0.23 0.60 0.82 0.89 0.96 0.90 0.76 2.79 4.10 3.93 3.65 0.30 0.26 1.02 1.80 1.81 1.72 2021 2022 2023 2024 Mar-25 QTD Jun-25 QTD Savings and interest bearing Time Total Deposits $582 $907 $426 $605 $1,017 $381 $549 $844 $673 $526 $826 $818 $556 $858 $843 Noninterest bearing Savings and interest bearing Time 2021 2022 2023 2024 Jun-25 Growth by Type ($ mil) 25% 24% 25% 38% 38% 38% 37% 38% 37% Jun-24 Dec-24 Jun-25 Noninterest bearing Savings and interest bearing Time Deposit Mix 27 Cost of Deposits (%)

GRAPHIC

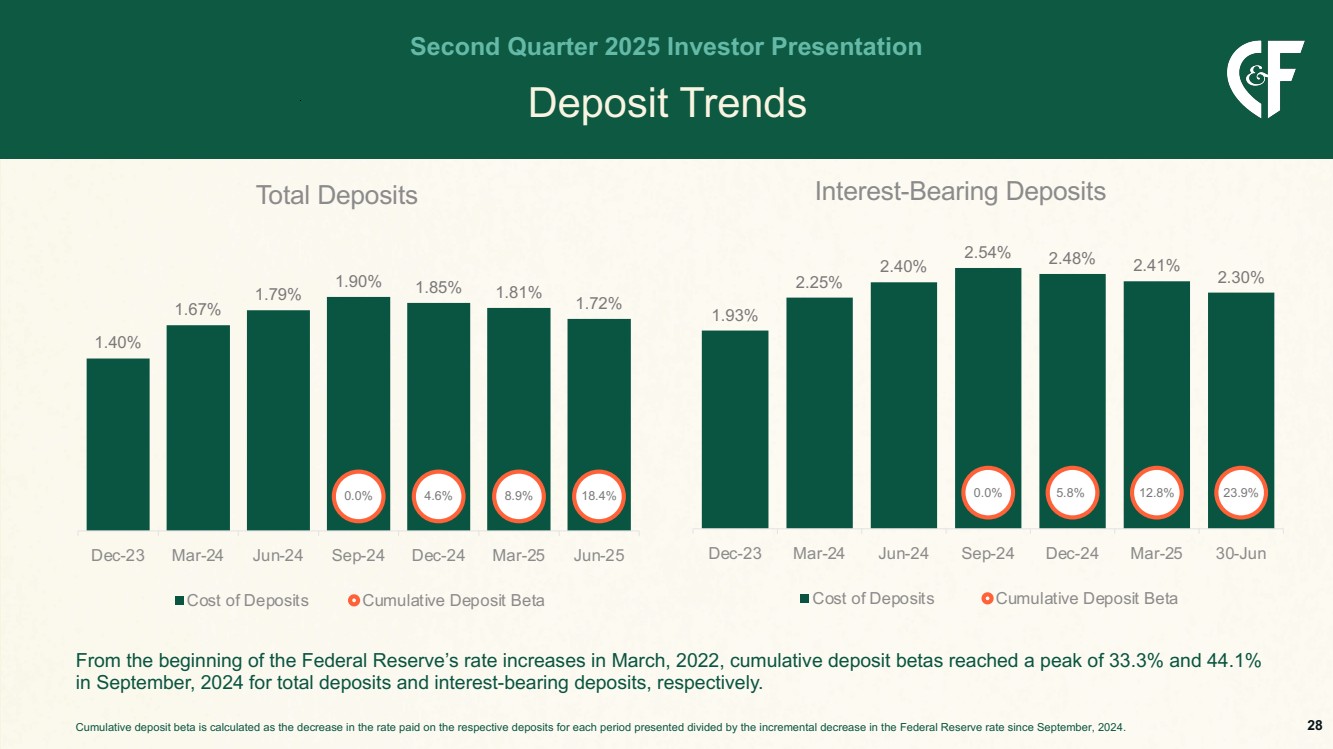
Deposit Trends Second Quarter 2025 Investor Presentation 1.40% 1.67% 1.79% 1.90% 1.85% 1.81% 1.72% 0.0% 4.6% 8.9% 18.4% Dec-23 Mar-24 Jun-24 Sep-24 Dec-24 Mar-25 Jun-25 Total Deposits Cost of Deposits Cumulative Deposit Beta 1.93% 2.25% 2.40% 2.54% 2.48% 2.41% 2.30% 0.0% 5.8% 12.8% 23.9% Dec-23 Mar-24 Jun-24 Sep-24 Dec-24 Mar-25 30-Jun Interest-Bearing Deposits Cost of Deposits Cumulative Deposit Beta From the beginning of the Federal Reserve’s rate increases in March, 2022, cumulative deposit betas reached a peak of 33.3% and 44.1% in September, 2024 for total deposits and interest-bearing deposits, respectively. Cumulative deposit beta is calculated as the decrease in the rate paid on the respective deposits for each period presented divided by the incremental decrease in the Federal Reserve rate since September, 2024. 28

GRAPHIC

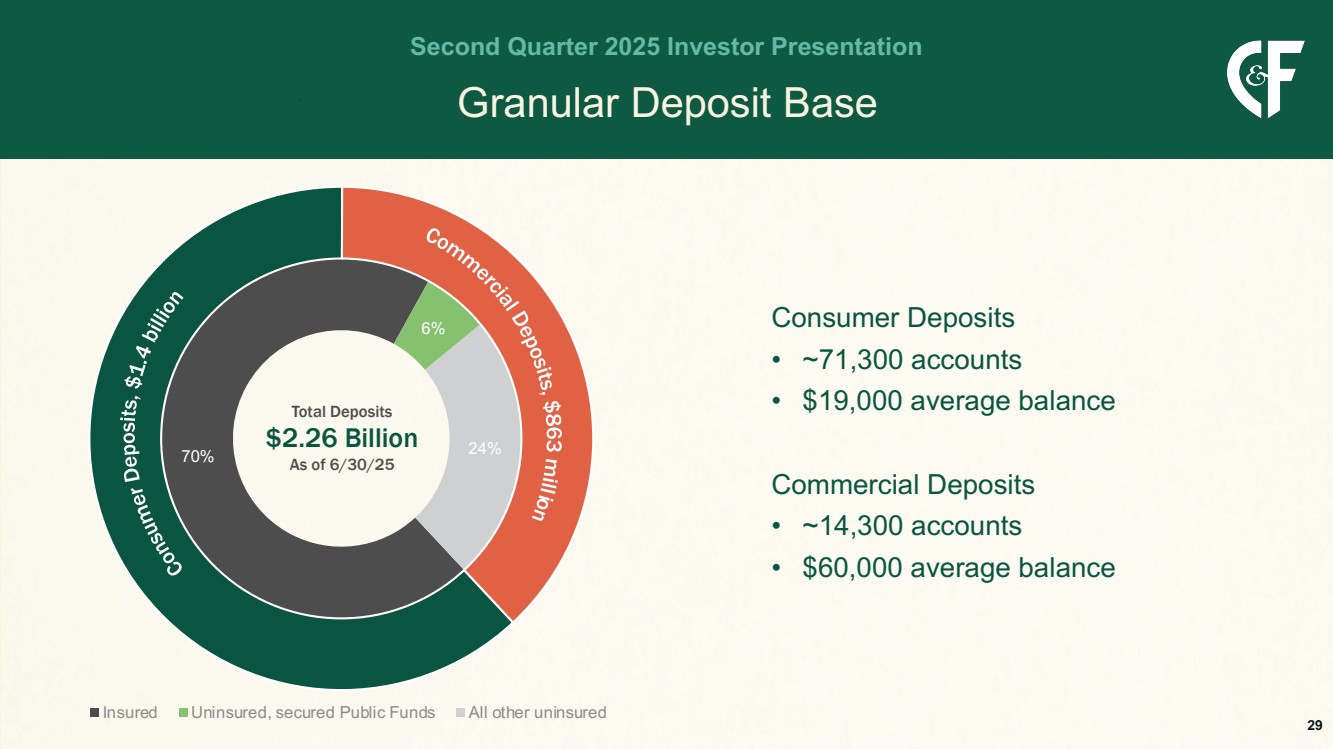
Granular Deposit Base Second Quarter 2025 Investor Presentation 70% 6% 24% Insured Uninsured, secured Public Funds All other uninsured Consumer Deposits • ~71,300 accounts • $19,000 average balance Commercial Deposits • ~14,300 accounts • $60,000 average balance 29 Total Deposits $2.26 Billion As of 6/30/25

GRAPHIC

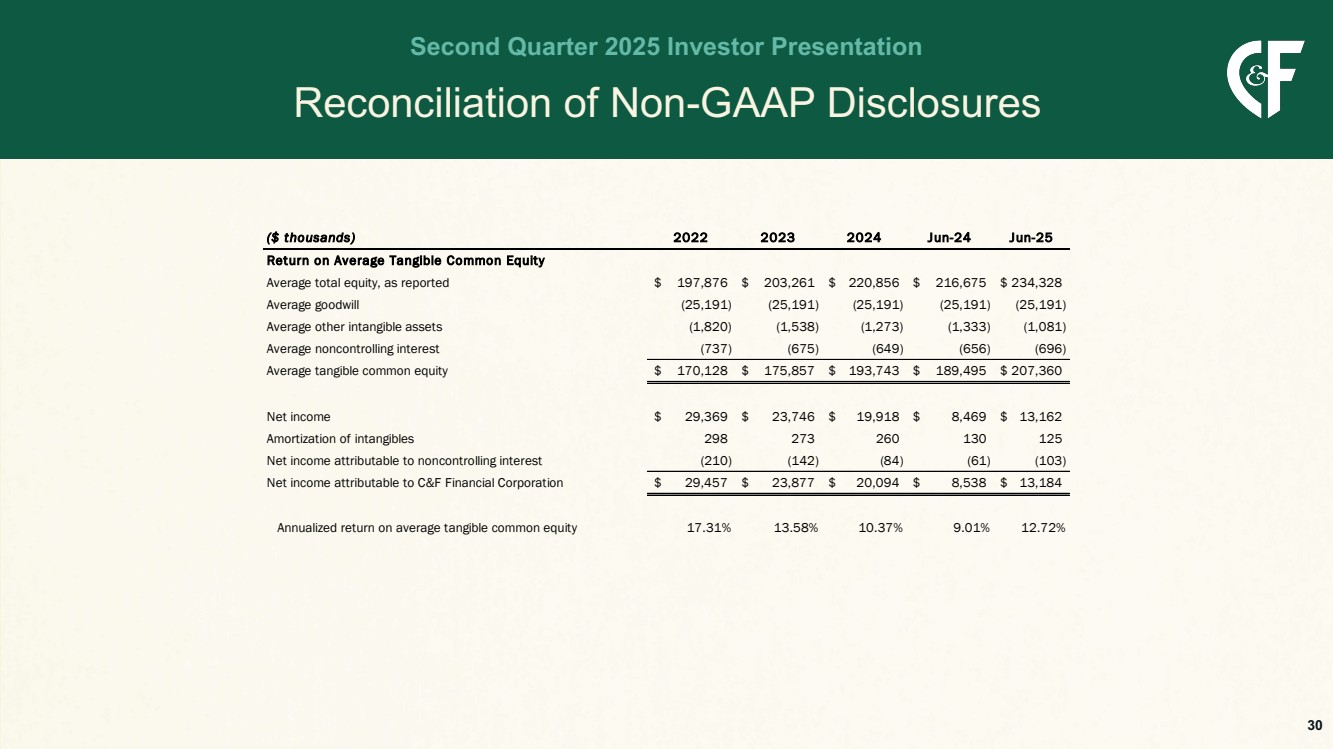
Reconciliation of Non-GAAP Disclosures Second Quarter 2025 Investor Presentation 30 ($ thousands) 2022 2023 2024 Jun-24 Jun-25 Return on Average Tangible Common Equity Average total equity, as reported $ 197,876 $ 203,261 $ 220,856 $ 216,675 $ 234,328 Average goodwill (25,191) (25,191) (25,191) (25,191) (25,191) Average other intangible assets (1,820) (1,538) (1,273) (1,333) (1,081) Average noncontrolling interest (737) (675) (649) (656) (696) Average tangible common equity $ 170,128 $ 175,857 $ 193,743 $ 189,495 $ 207,360 Net income $ 29,369 $ 23,746 $ 19,918 $ 8,469 $ 13,162 Amortization of intangibles 298 273 260 130 125 Net income attributable to noncontrolling interest (210) (142) (84) (61) (103) Net income attributable to C&F Financial Corporation $ 29,457 $ 23,877 $ 20,094 $ 8,538 $ 13,184 Annualized return on average tangible common equity 17.31% 13.58% 10.37% 9.01% 12.72%

GRAPHIC

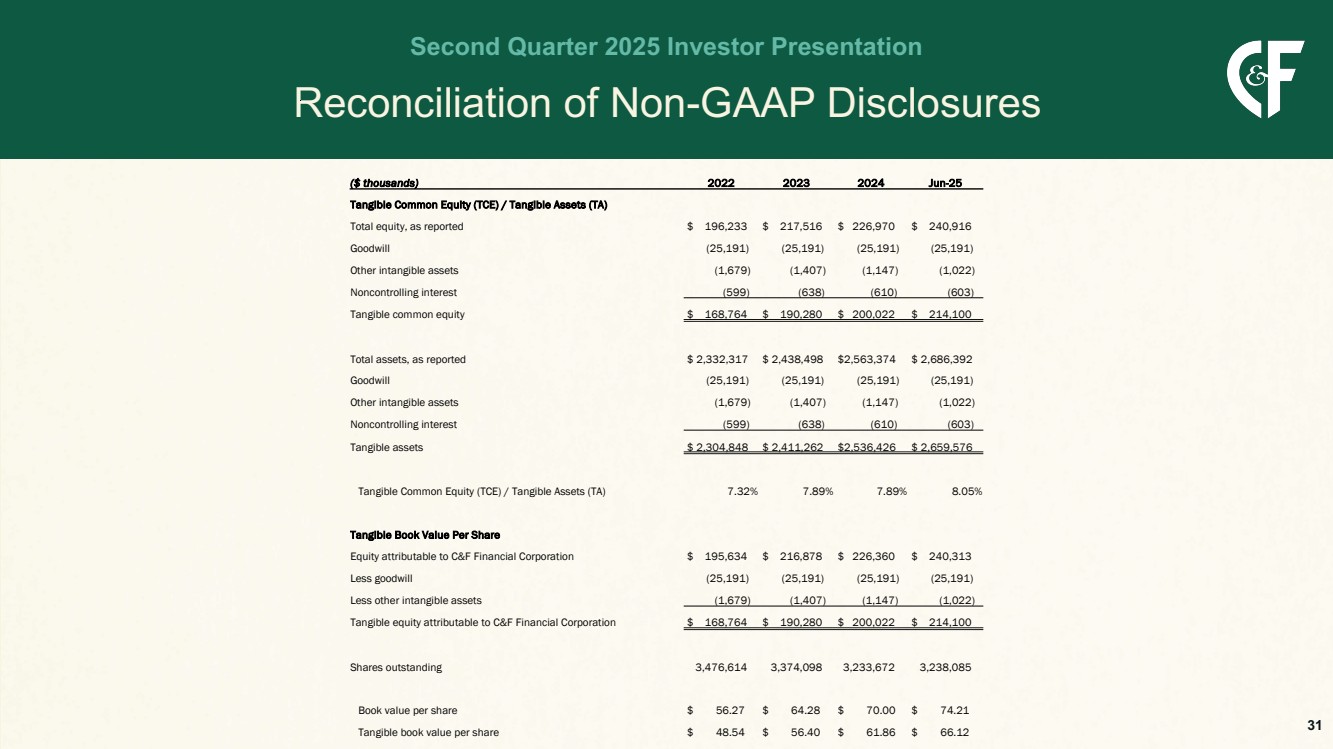
Reconciliation of Non-GAAP Disclosures Second Quarter 2025 Investor Presentation 31 ($ thousands) 2022 2023 2024 Jun-25 Tangible Common Equity (TCE) / Tangible Assets (TA) Total equity, as reported $ 196,233 $ 217,516 $ 226,970 $ 240,916 Goodwill (25,191) (25,191) (25,191) (25,191) Other intangible assets (1,679) (1,407) (1,147) (1,022) Noncontrolling interest (599) (638) (610) (603) Tangible common equity $ 168,764 $ 190,280 $ 200,022 $ 214,100 Total assets, as reported $ 2,332,317 $ 2,438,498 $2,563,374 $ 2,686,392 Goodwill (25,191) (25,191) (25,191) (25,191) Other intangible assets (1,679) (1,407) (1,147) (1,022) Noncontrolling interest (599) (638) (610) (603) Tangible assets $ 2,304,848 $ 2,411,262 $2,536,426 $ 2,659,576 Tangible Common Equity (TCE) / Tangible Assets (TA) 7.32% 7.89% 7.89% 8.05% Tangible Book Value Per Share Equity attributable to C&F Financial Corporation $ 195,634 $ 216,878 $ 226,360 $ 240,313 Less goodwill (25,191) (25,191) (25,191) (25,191) Less other intangible assets (1,679) (1,407) (1,147) (1,022) Tangible equity attributable to C&F Financial Corporation $ 168,764 $ 190,280 $ 200,022 $ 214,100 Shares outstanding 3,476,614 3,374,098 3,233,672 3,238,085 Book value per share $ 56.27 $ 64.28 $ 70.00 $ 74.21 Tangible book value per share $ 48.54 $ 56.40 $ 61.86 $ 66.12