| | | | | |
| C.H. Robinson 14701 Charlson Rd. Eden Prairie, MN 55347 www.chrobinson.com
|
| FOR IMMEDIATE RELEASE | FOR INQUIRIES, CONTACT: Chuck Ives, Senior Director of Investor Relations |
C.H. Robinson Reports 2025 Third Quarter Results
Eden Prairie, MN, October 29, 2025 - C.H. Robinson Worldwide, Inc. (“C.H. Robinson”) (Nasdaq: CHRW) today reported financial results for the quarter ended September 30, 2025.
Third Quarter Highlights:
•Sustained outperformance delivered by disciplined execution of the company's strategic initiatives, generating demonstrable market share gains, gross margin expansion, and higher operating margins
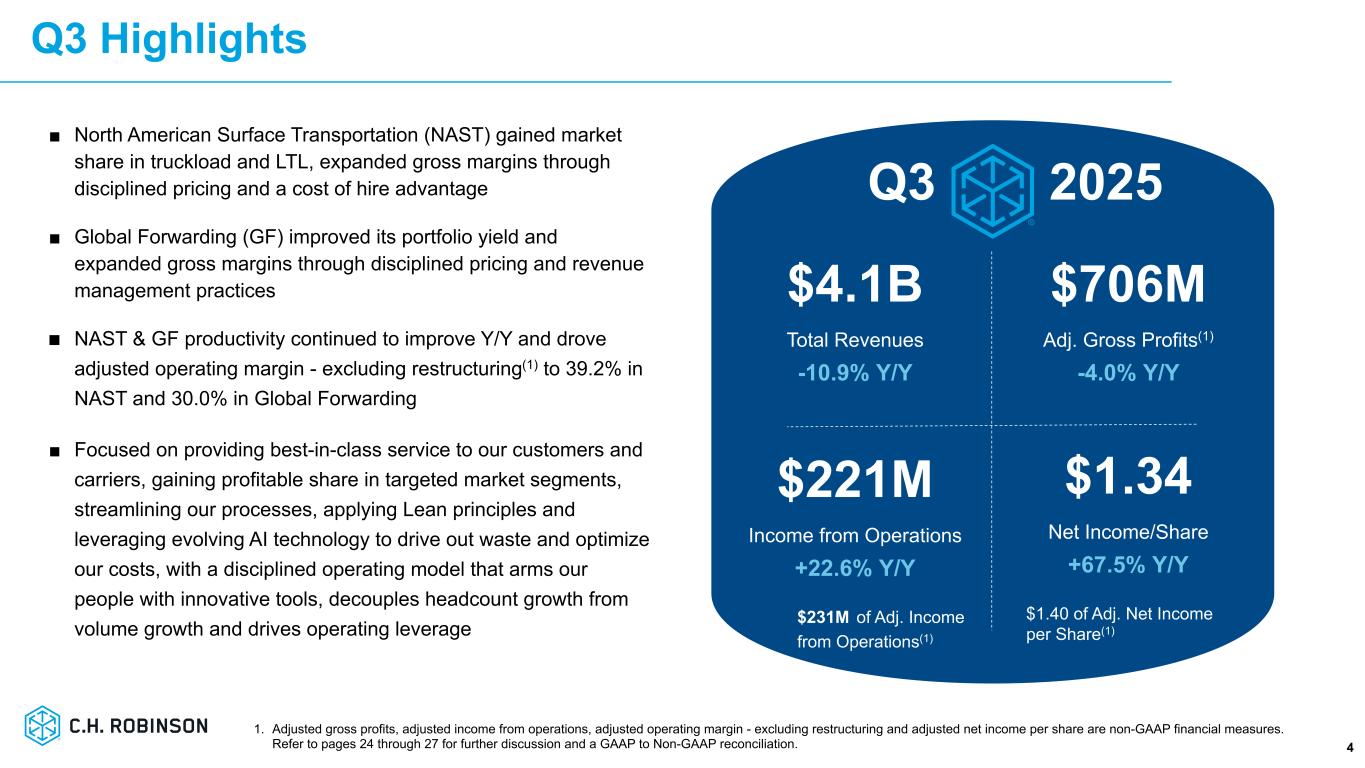
•Income from operations increased 22.6% to $220.8 million
•Adjusted operating margin(1) increased 680 basis points to 31.3%
•Diluted earnings per share (EPS) increased 67.5% to $1.34
•Adjusted diluted EPS(1) increased 9.4% to $1.40
•Cash generated by operations increased by $167.4 million to $275.4 million
(1) Adjusted operating margin and adjusted diluted EPS are non-GAAP financial measures. The same factors described in this release that impacted these non-GAAP measures also impacted the comparable GAAP measures. Refer to pages 11 through 13 for further discussion and GAAP to Non-GAAP Reconciliations.
"The third quarter of 2025 was marked by a continued soft freight environment, with the Cass Freight Shipment Index declining year-over-year for the 12th consecutive quarter. The Cass index reading was the lowest third quarter reading since the financial crisis of 2009. And despite a fairly steady exit of trucking capacity over the past three years, truckload spot rates continue to bounce along the bottom due to low demand," said President and Chief Executive Officer, Dave Bozeman. "International freight has been impacted by global trade policies, which caused previous front-loading, a dislocation of shipments and a softer than normal peak season. Combined with excess vessel capacity, this caused ocean rates to decline substantially versus a year ago, consistent with the expectations that we laid out at our Investor Day in December. Ocean rates also declined substantially within the third quarter, causing our adjusted gross profit per ocean shipment to decline 27% from June to September. These factors led to unfavorable
conditions for global transportation companies in the third quarter. We are not immune to the market, and the volume and rate dynamics in Global Forwarding are certainly headwinds we are facing."
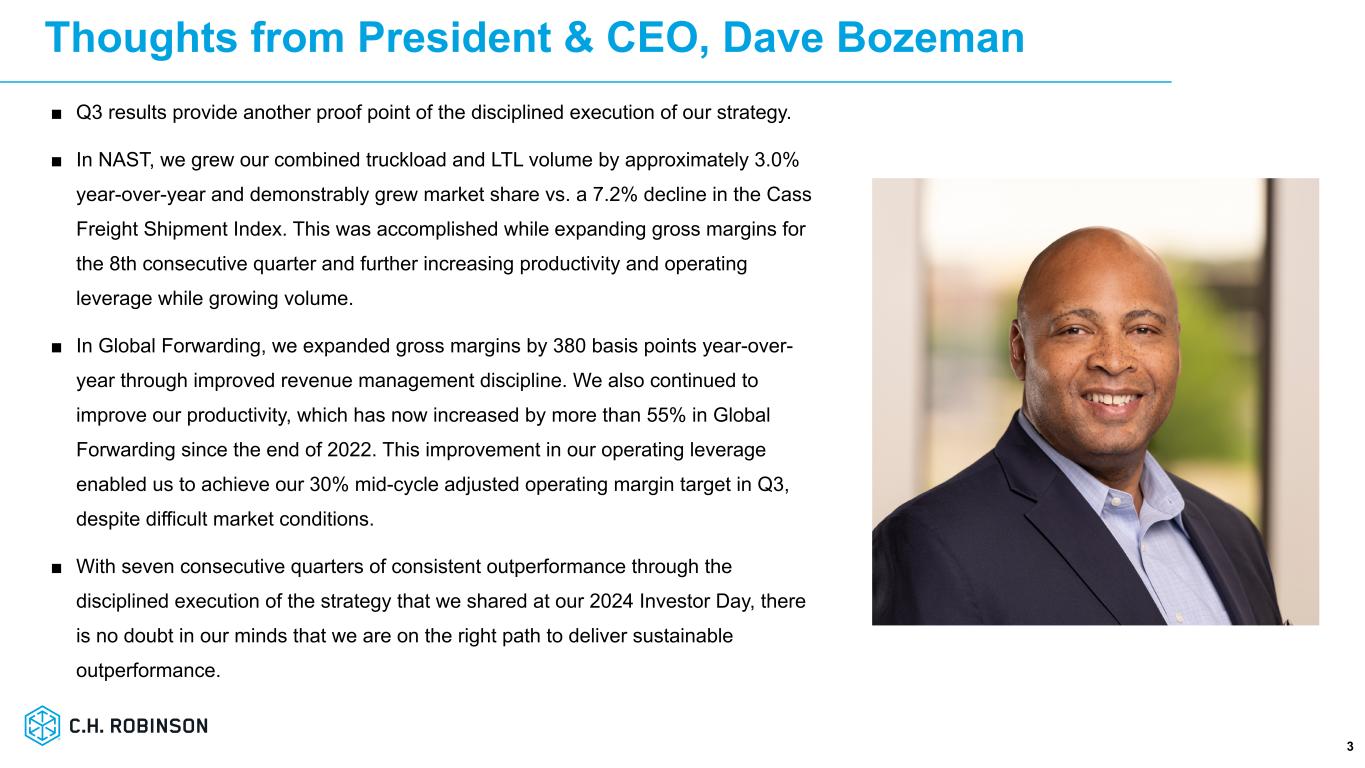
"But this is a new C.H. Robinson, and we don’t use the macro environment as an excuse. We are a fundamentally different company than we were two years ago, illustrated by the company’s consistent outperformance versus the market," Bozeman added. "Our third quarter results provide another proof point of the disciplined execution of our strategy. In NAST, we grew our combined truckload and LTL volume by approximately 3.0% year-over-year and demonstrably grew market share versus a 7.2% decline in the Cass Freight Shipment Index. This was accomplished while expanding gross margins for the 8th consecutive quarter and further increasing productivity and operating leverage while growing volume. This resulted in a 39% adjusted operating margin in NAST and further progress toward our 40% mid-cycle adjusted operating margin target for NAST."
"In Global Forwarding, we expanded gross margins by 380 basis points year-over-year through improved revenue management discipline. We also continued to improve our productivity, which has now increased by more than 55% in Global Forwarding since the end of 2022. This improvement in our operating leverage enabled us to achieve our 30% mid-cycle adjusted operating margin target in the third quarter, despite the difficult market conditions."
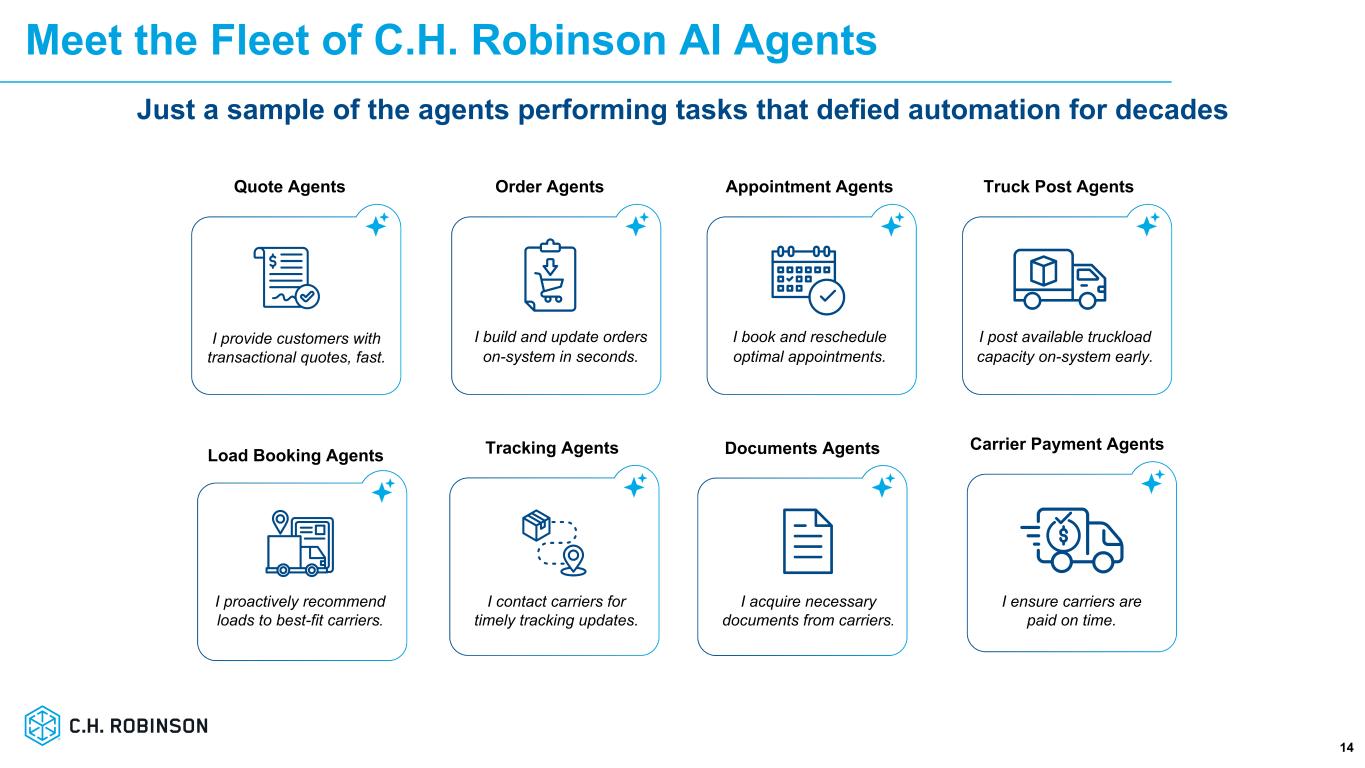
"With seven consecutive quarters of consistent outperformance through the disciplined execution of the strategy that we shared at our 2024 Investor Day, there is no doubt in our minds that we are on the right path to deliver sustainable outperformance. Our model, with an industry-leading cost to serve, is highly scalable and we expect it will improve further as we harness the evolving power of AI to drive automation across the quote-to-cash lifecycle of a load. We’re still in the early innings of our Lean AI journey - call it third inning in NAST and first inning in Global Forwarding. Lean AI is our unique, disciplined approach to AI innovation that transforms supply chains. By combining the principles of Lean methodology in our Robinson operating model with the power of AI, Lean AI is designed to maximize value and minimize waste for better outcomes. It is uniquely enabled by our leading AI technology, our expert logisticians and our Lean operating model that drives continuous improvement," said Bozeman.
Summary of Third Quarter of 2025 Results Compared to the Third Quarter of 2024
•Total revenues decreased 10.9% to $4.1 billion, primarily driven by lower pricing and volume in our ocean services, the divestiture of our Europe Surface Transportation business, and lower pricing in our truckload services. This was partially offset by higher volume in our truckload services.
•Gross profits decreased 4.4% to $691.7 million. Adjusted gross profits(1) decreased 4.0% to $706.1 million, primarily driven by lower adjusted gross profit per transaction and volume in our ocean services and the divestiture of our Europe Surface Transportation business. This was partially offset by higher adjusted gross profit per transaction in our less than truckload ("LTL") and customs services and higher volume in our truckload services.
•Operating expenses decreased 12.6% to $485.2 million. Personnel expenses decreased 3.4% to $349.3 million, primarily due to the divestiture of our Europe Surface Transportation business and cost optimization efforts and productivity improvements. This was partially offset by higher restructuring charges related to workforce reductions. Average employee headcount declined 10.8%. Other selling, general and administrative (“SG&A”) expenses decreased 29.8% to $135.9 million, primarily due to a $57.0 million loss in the prior year related to the divestiture of our Europe Surface Transportation business.
•Income from operations totaled $220.8 million, up 22.6% due to the decrease in operating expenses, partially offset by the decrease in adjusted gross profit. Adjusted operating margin(1) of 31.3% increased 680 basis points.
•Interest and other income/expense, net totaled $15.6 million of expense, consisting primarily of $15.8 million of interest expense, which decreased $6.3 million versus last year due to a lower average debt balance and lower variable interest rates.
•The effective tax rate in the quarter was 20.6%, compared to 32.4% in the third quarter of 2024. The decrease in the third quarter of 2025 was driven by the impact of non-recurring discrete items and the divestiture of our European Surface Transportation business in the prior year and stock-based compensation, partially offset by a reduced benefit from U.S. tax credits in the current year.
•Net income totaled $163.0 million, up 67.6% from a year ago. Diluted EPS of $1.34 increased 67.5%. Adjusted diluted EPS(1) of $1.40 increased 9.4%.
(1) Adjusted gross profits, adjusted operating margin and adjusted diluted EPS are non-GAAP financial measures. The same factors described in this release that impacted these non-GAAP measures also impacted the comparable GAAP measures. Refer to pages 11 through 13 for further discussion and GAAP to Non-GAAP Reconciliations.
Summary of 2025 Year-to-Date Results Compared to 2024
•Total revenues decreased 9.0% to $12.3 billion, primarily driven by the divestiture of our Europe Surface Transportation business, in addition to lower pricing and volume in our ocean services and lower fuel surcharges in our truckload services.
•Gross profits decreased 0.9% to $2.0 billion. Adjusted gross profits(1) decreased 0.4% to $2.1 billion, primarily driven by lower adjusted gross profit per transaction in our ocean services and the divestiture of our Europe Surface Transportation business, which were partially offset by higher adjusted gross profit per transaction in our truckload and LTL services.
•Operating expenses decreased 8.5% to $1.5 billion. Personnel expenses decreased 6.2% to $1.0 billion, primarily due to cost optimization efforts and productivity improvements and the divestiture of our Europe Surface Transportation business. Average employee headcount declined 10.9%. Other SG&A expenses decreased 13.7% to $425.6 million primarily due to a $57.0 million loss in the prior year related to the divestiture of our Europe Surface Transportation business.
•Income from operations totaled $613.6 million, up 26.4% from last year due to the decrease in operating expenses. Adjusted operating margin(1) of 29.6% increased 630 basis points.
•Interest and other income/expense, net totaled $57.7 million of expense, primarily consisting of $49.4 million of interest expense, which decreased $17.6 million versus last year, due to a lower average debt balance and lower variable interest rates. The year-to-date results also include an $8.3 million net loss from foreign currency revaluation and realized foreign currency gains and losses.
•The effective tax rate for the nine months ended September 30, 2025 was 18.9% compared to 23.0% in the year-ago period. The decrease was driven by the impact of non-recurring discrete items and the divestiture of our European Surface Transportation business in the prior year and stock-based compensation, partially offset by a reduced benefit from U.S. tax credits in the current year.
•Net income totaled $450.8 million, up 42.5% from a year ago. Diluted EPS of $3.71 increased 41.1%. Adjusted diluted EPS(1) of $3.86 increased 17.0%.
(1) Adjusted gross profits, adjusted operating margin and adjusted diluted EPS are non-GAAP financial measures. The same factors described in this release that impacted these non-GAAP measures also impacted the comparable GAAP measures. Refer to pages 11 through 13 for further discussion and GAAP to Non-GAAP Reconciliations.
North American Surface Transportation (“NAST”) Results
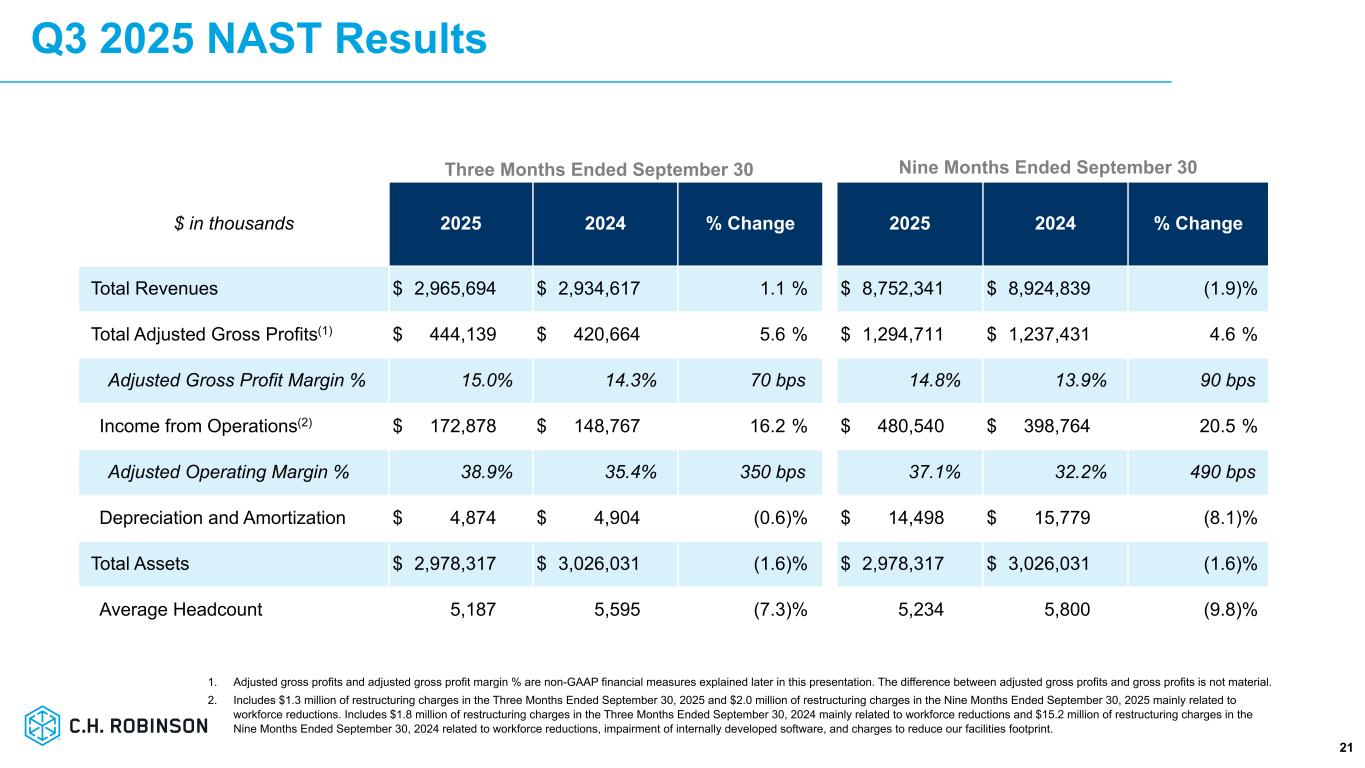
Summarized financial results of our NAST segment are as follows (dollars in thousands):
| | | | | | | | | | | | | | | | | | | | | | | | | | | | | | | | | | | |
| Three Months Ended September 30, | | Nine Months Ended September 30, |
| 2025 | | 2024 | | % change | | 2025 | | 2024 | | % change |
| Total revenues | $ | 2,965,694 | | | $ | 2,934,617 | | | 1.1 | % | | $ | 8,752,341 | | | $ | 8,924,839 | | | (1.9) | % |
Adjusted gross profits(1) | 444,139 | | | 420,664 | | | 5.6 | % | | 1,294,711 | | | 1,237,431 | | | 4.6 | % |
| Income from operations | 172,878 | | | 148,767 | | | 16.2 | % | | 480,540 | | | 398,764 | | | 20.5 | % |
| | | | | | | | | | | |
____________________________________________
(1) Adjusted gross profits is a non-GAAP financial measure explained later in this release. The difference between adjusted gross profits and gross profits is not material.
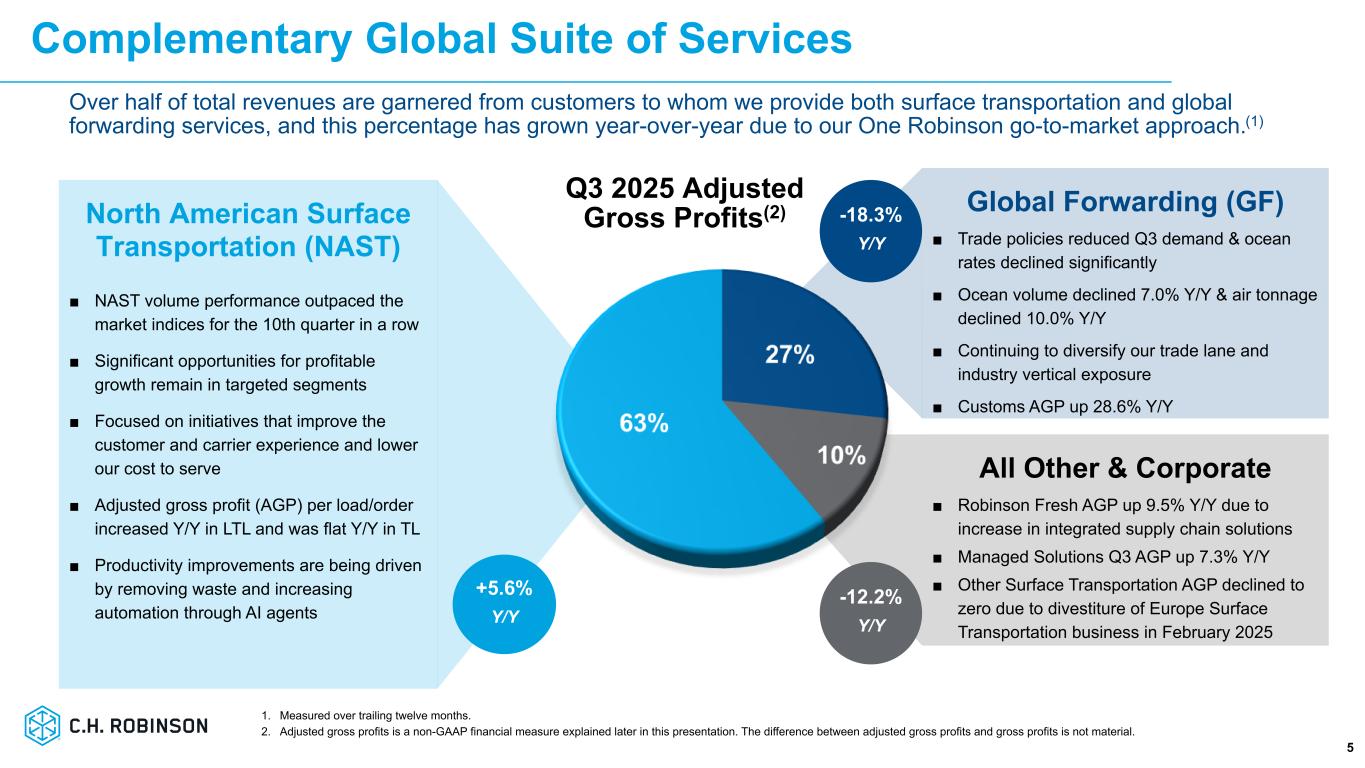
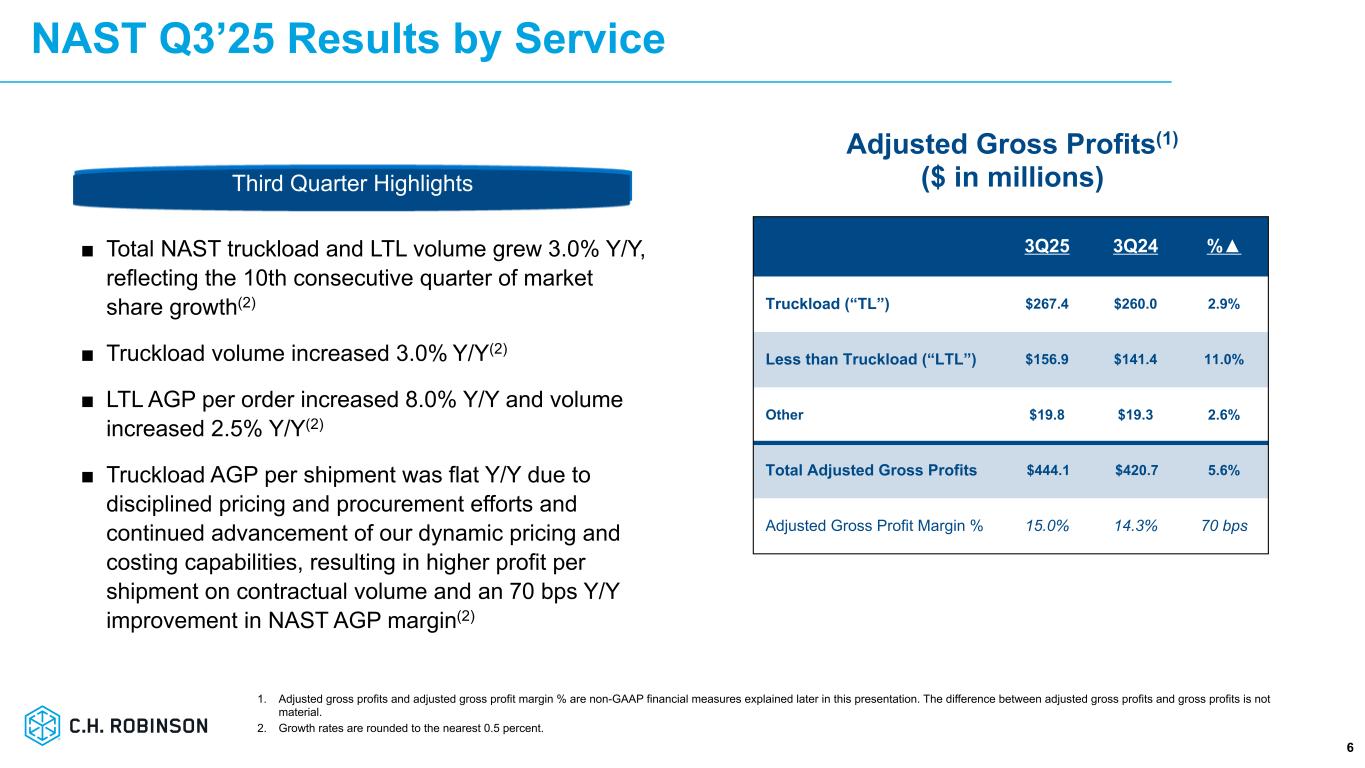
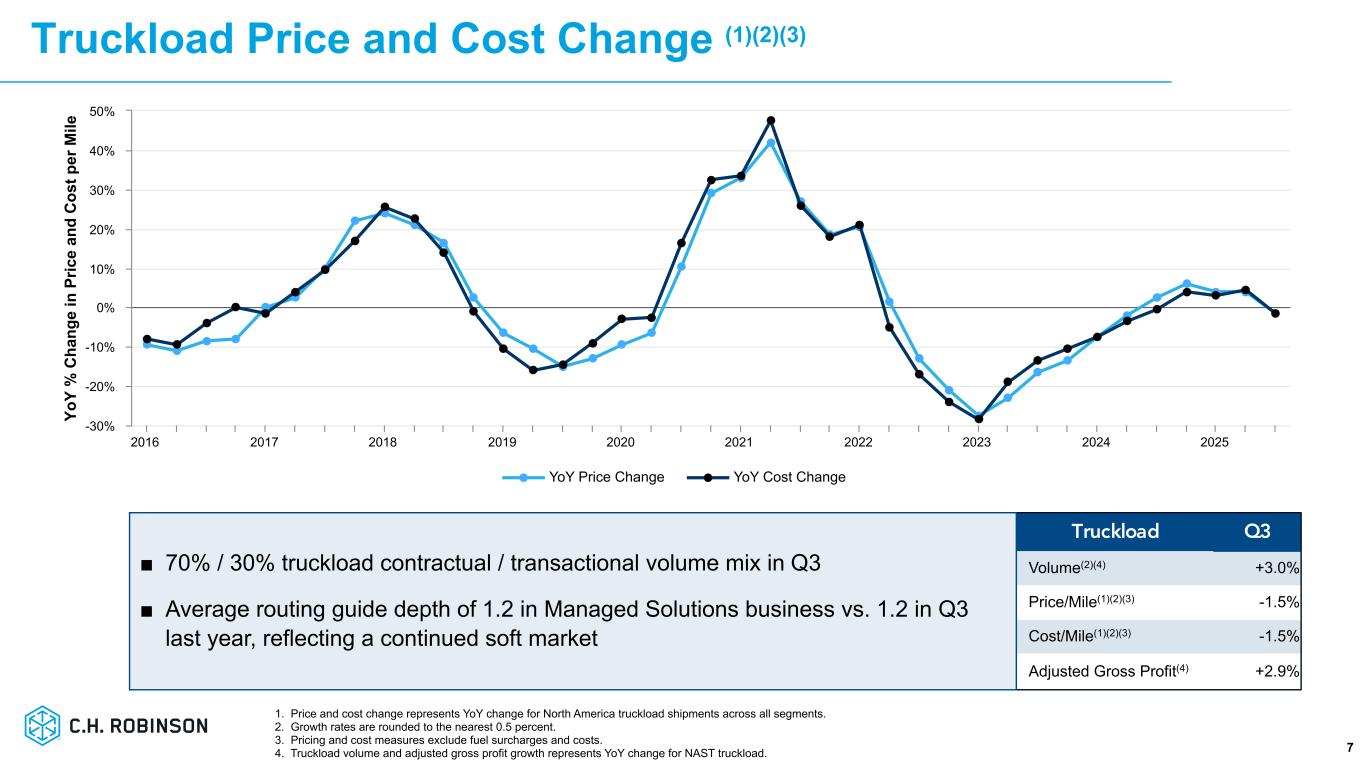
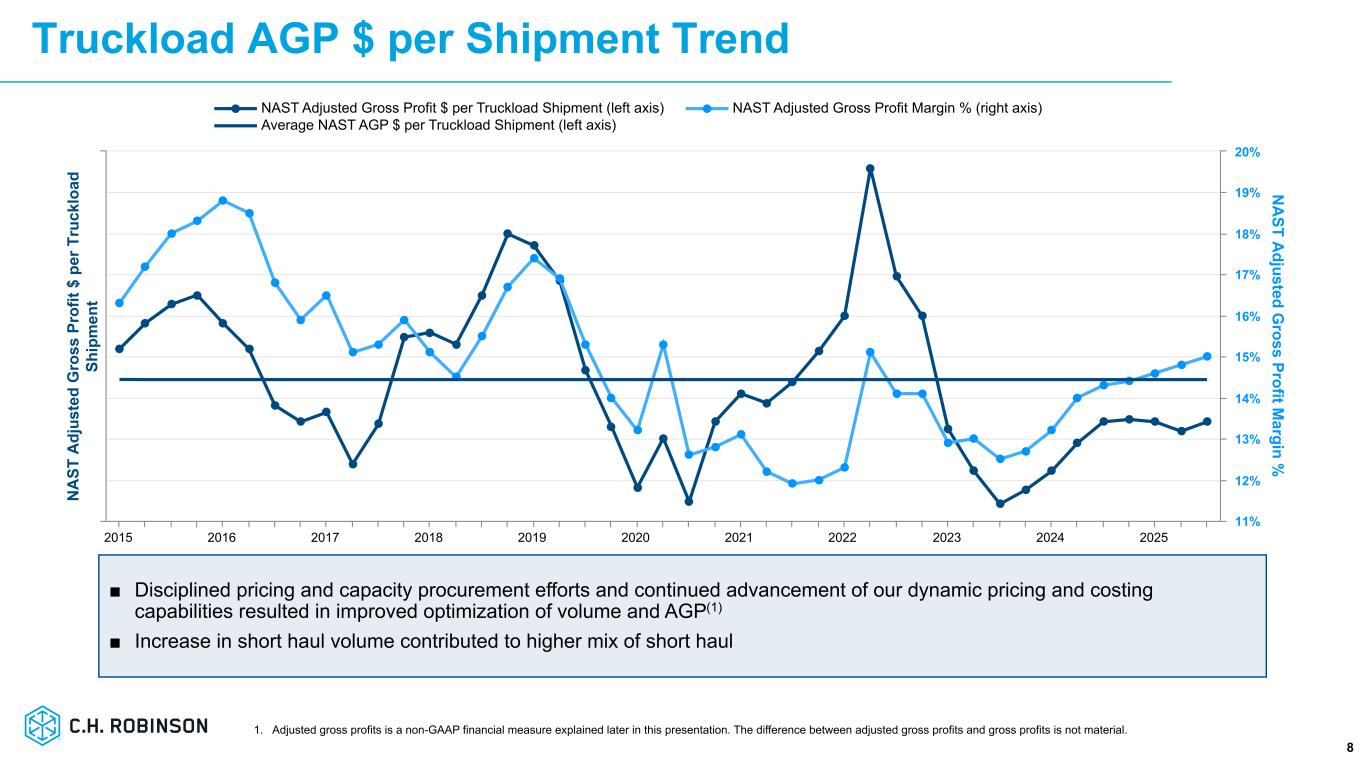
Third quarter total revenues for the NAST segment totaled $3.0 billion, an increase of 1.1% over the prior year, primarily driven by higher volumes in both our truckload and LTL services, partially offset by lower pricing in truckload services. NAST adjusted gross profits increased 5.6% in the quarter to $444.1 million. Adjusted gross profits in truckload increased 2.9% due to a 3.0% increase in volume. Our average truckload linehaul rate per mile charged to our customers, which excludes fuel surcharges, decreased approximately 1.5% in the quarter compared to the prior year, while truckload linehaul cost per mile, excluding fuel surcharges, decreased 1.5%, resulting in a flat truckload adjusted gross profit per mile. LTL adjusted gross profits increased 11.0% versus the year-ago period, driven by a 8.0% increase in adjusted gross profit per order and a 2.5% increase in LTL volume. Total NAST truckload and LTL volume increased 3.0% for the quarter and outpaced the market indices. Operating expenses decreased 0.2%, primarily due to cost optimization efforts and productivity improvements, partially offset by higher incentive compensation. Third quarter average employee headcount was down 7.3% year-over-year. Income from operations increased 16.2% to $172.9 million, and adjusted operating margin expanded 350 basis points to 38.9%.
Global Forwarding Results
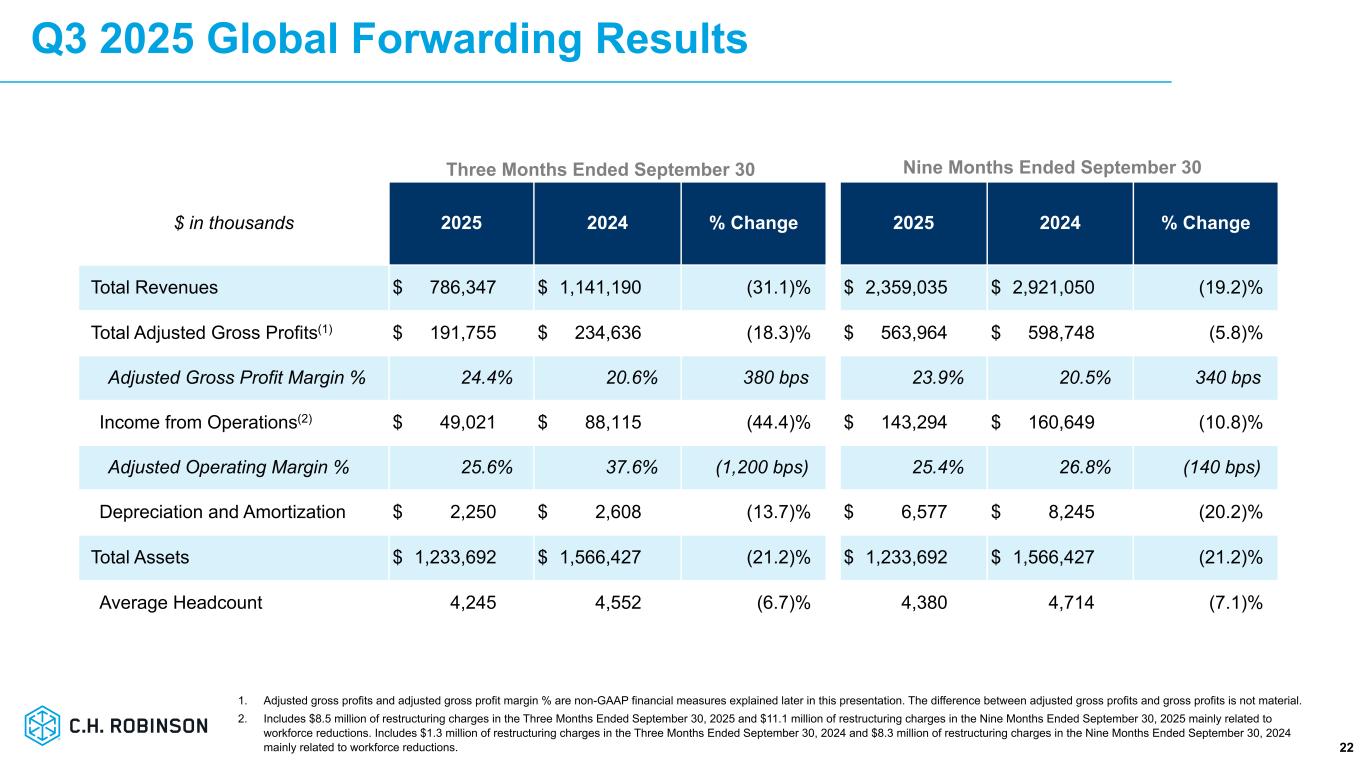
Summarized financial results of our Global Forwarding segment are as follows (dollars in thousands):
| | | | | | | | | | | | | | | | | | | | | | | | | | | | | | | | | | | |
| Three Months Ended September 30, | | Nine Months Ended September 30, |
| 2025 | | 2024 | | % change | | 2025 | | 2024 | | % change |
| Total revenues | $ | 786,347 | | | $ | 1,141,190 | | | (31.1) | % | | $ | 2,359,035 | | | $ | 2,921,050 | | | (19.2) | % |
Adjusted gross profits(1) | 191,755 | | | 234,636 | | | (18.3) | % | | 563,964 | | | 598,748 | | | (5.8) | % |
| Income from operations | 49,021 | | | 88,115 | | | (44.4) | % | | 143,294 | | | 160,649 | | | (10.8) | % |
| | | | | | | | | | | |
____________________________________________
(1) Adjusted gross profits is a non-GAAP financial measure explained later in this release. The difference between adjusted gross profits and gross profits is not material.
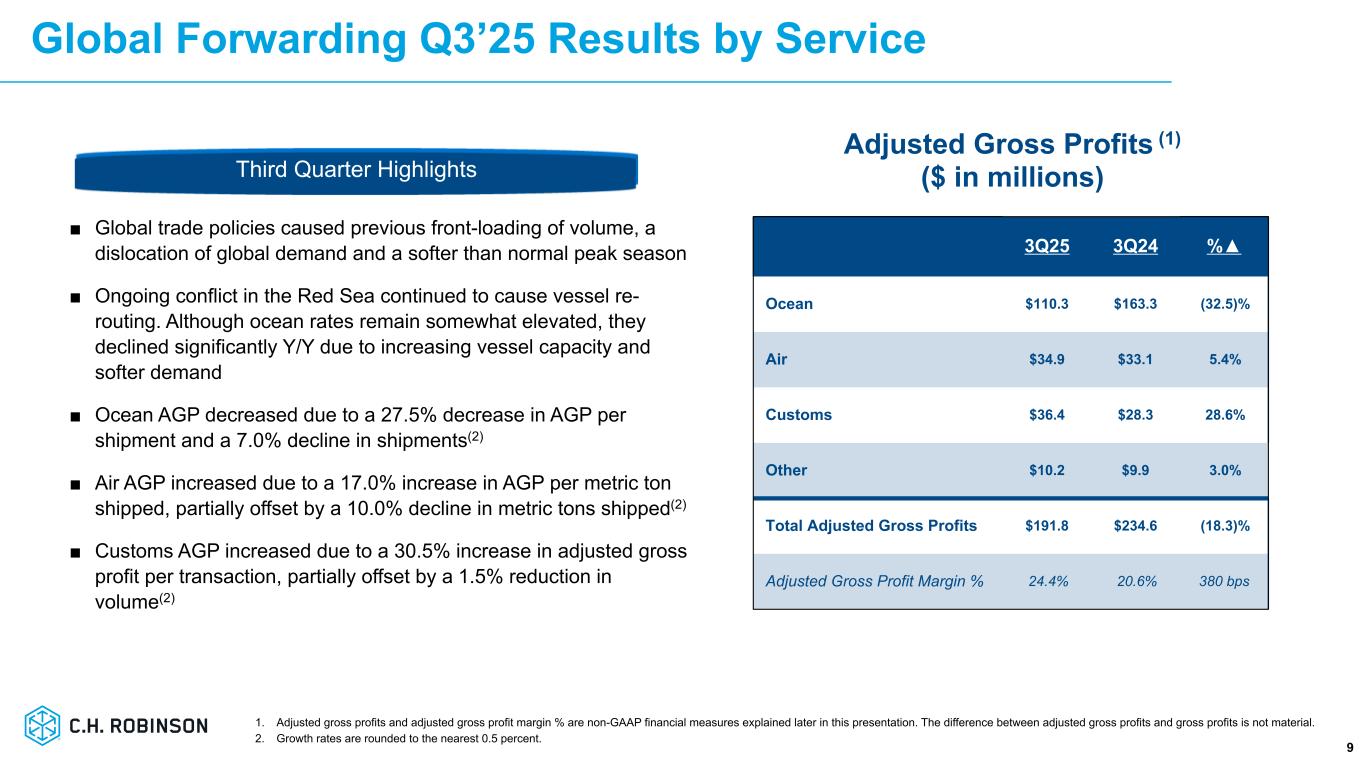
Third quarter total revenues for the Global Forwarding segment decreased 31.1% to $786.3 million, primarily driven by lower pricing and volume in our ocean services. Adjusted gross profits decreased 18.3% in the quarter to $191.8 million. Ocean adjusted gross profits decreased 32.5%, driven by a 27.5% decrease in adjusted gross profit per shipment and a 7.0% decline in shipments. Air adjusted gross profits increased 5.4%, driven by a 17.0% increase in adjusted gross profit per metric ton shipped, partially offset by a 10.0% decline in metric tons shipped. Customs adjusted gross profits increased 28.6%, driven by a 30.5% increase in adjusted gross profit per transaction, partially offset by a 1.5% reduction in transaction volume. Operating expenses decreased 2.6%, primarily due to cost optimization efforts and productivity improvements and lower incentive compensation and claims expense, partially offset by current year restructuring charges related to workforce reductions. Third quarter average employee headcount decreased 6.7% year-over-year. Income from operations decreased 44.4% to $49.0 million, and adjusted operating margin declined 1,200 basis points to 25.6% in the quarter.
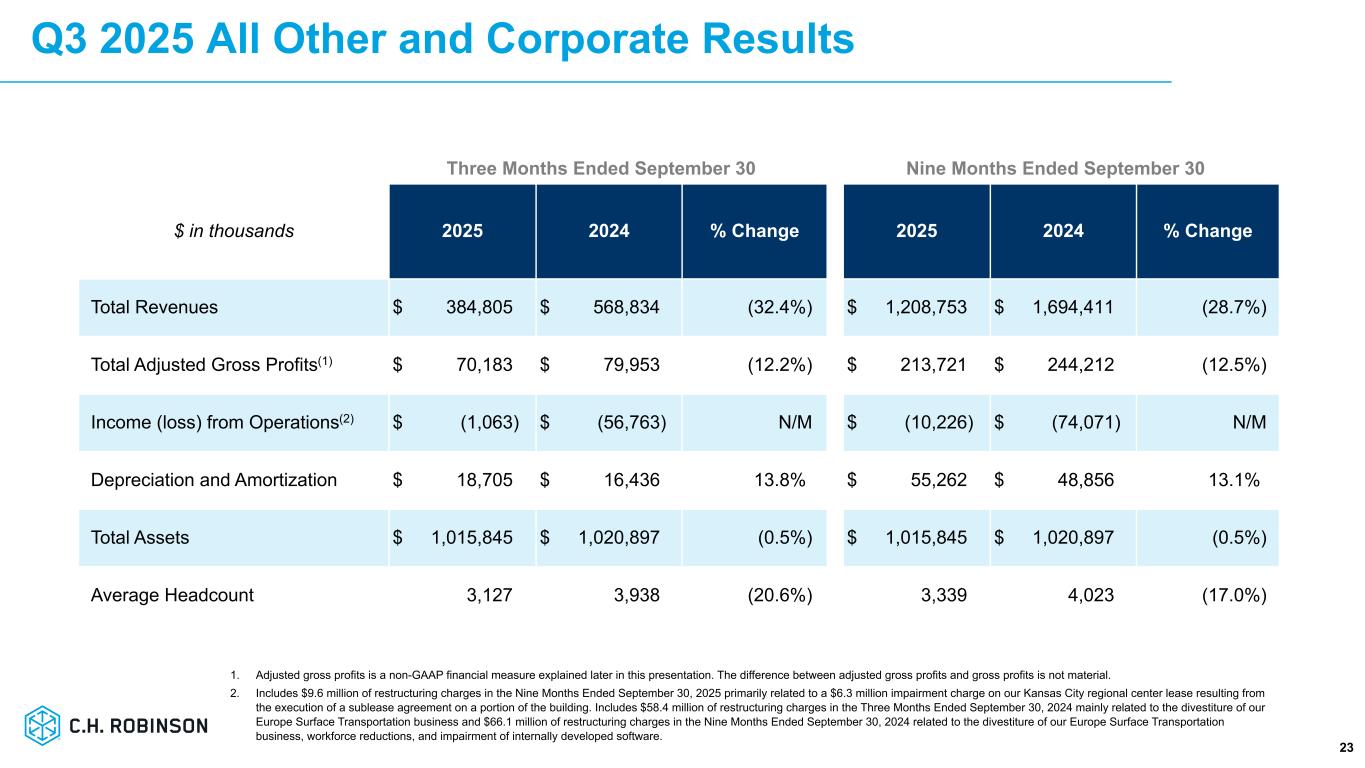
All Other and Corporate Results
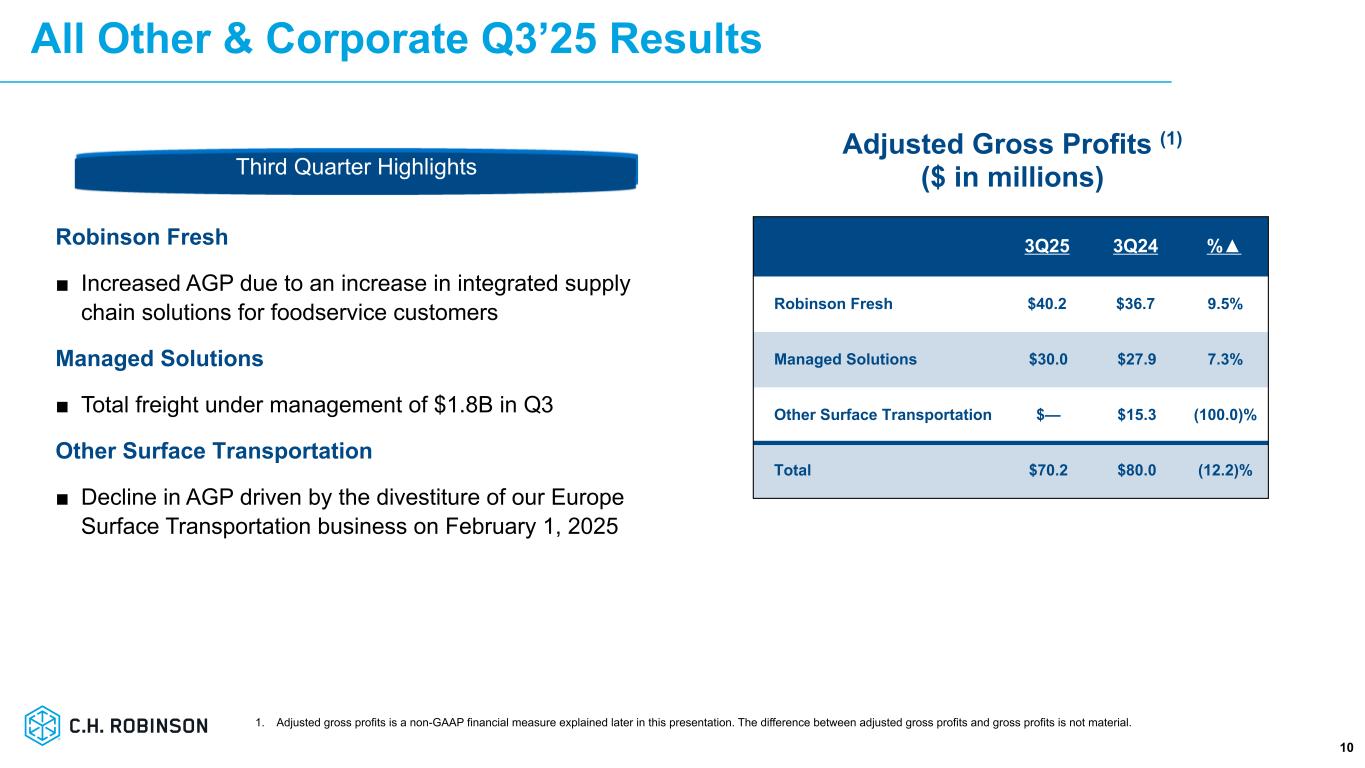
Total revenues and adjusted gross profits for Robinson Fresh, Managed Solutions and Other Surface Transportation are summarized as follows (dollars in thousands):
| | | | | | | | | | | | | | | | | | | | | | | | | | | | | | | | | | | |
| Three Months Ended September 30, | | Nine Months Ended September 30, |
| 2025 | | 2024 | | % change | | 2025 | | 2024 | | % change |
| Total revenues | $ | 384,805 | | | $ | 568,834 | | | (32.4) | % | | $ | 1,208,753 | | | $ | 1,694,411 | | | (28.7) | % |
Adjusted gross profits(1): | | | | | | | | | | | |
| Robinson Fresh | $ | 40,195 | | | $ | 36,708 | | | 9.5 | % | | $ | 122,243 | | | $ | 110,327 | | | 10.8 | % |
| Managed Solutions | 29,988 | | | 27,949 | | | 7.3 | % | | 86,841 | | | 85,637 | | | 1.4 | % |
Other Surface Transportation(2) | — | | | 15,296 | | | (100.0) | % | | 4,637 | | | 48,248 | | | (90.4) | % |
| | | | | | | | | | | |
____________________________________________
(1) Adjusted gross profits is a non-GAAP financial measure explained later in this release. The difference between adjusted gross profits and gross profits is not material.
(2) Includes our Europe Surface Transportation business, which was divested as of February 1, 2025.
Third quarter Robinson Fresh adjusted gross profits increased 9.5% to $40.2 million due to an increase in integrated supply chain solutions for foodservice customers. Managed Solutions adjusted gross profits increased 7.3% due to an increase in freight under management.
Other Income Statement Items
Interest and other income/expense, net totaled $15.6 million of expense, consisting primarily of $15.8 million of interest expense, which decreased $6.3 million versus the third quarter of 2024 due to a lower average debt balance and lower variable interest rates.
The third quarter effective tax rate was 20.6%, down from 32.4% in the third quarter of 2024. The lower rate in the third quarter of 2025 was driven by the impact of non-recurring discrete items and the divestiture of our European Surface Transportation business in the prior year and stock-based compensation, partially offset by a reduced benefit from U.S. tax credits in the current year. For 2025, we expect our full-year effective tax rate to be 18% to 20%.
Diluted weighted average shares outstanding in the quarter were up 0.1% year-over-year.
Cash Flow Generation and Capital Distribution
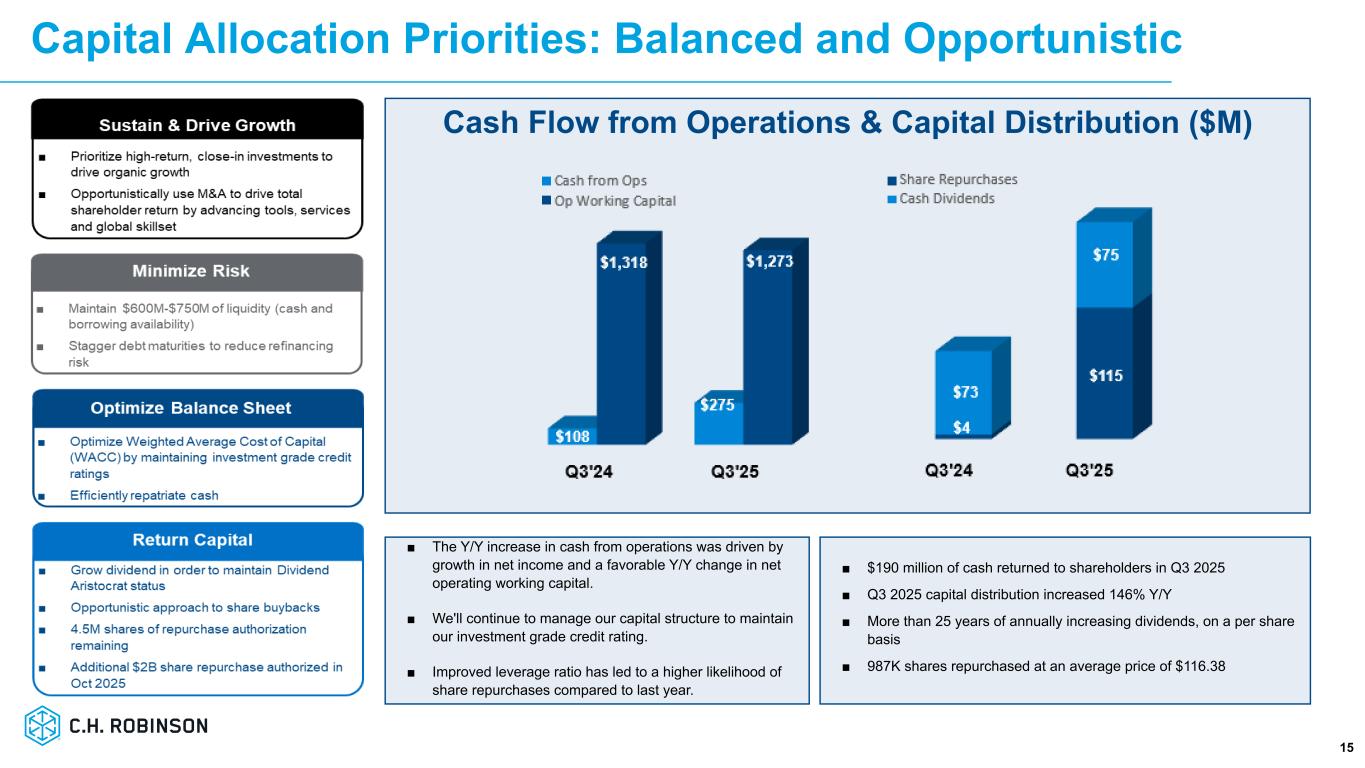
Cash generated from operations totaled $275.4 million in the third quarter, compared to $108.1 million in the third quarter of 2024. The $167.4 million increase in cash flow from operations was primarily related to a $65.8 million increase in net income and a $144.5 million decrease in cash used by changes in net operating working capital, due to a $21.0 million sequential increase in net operating working capital in the third quarter of 2025 compared to a $165.5 million sequential increase in the third quarter of 2024.
In the third quarter of 2025, cash returned to shareholders totaled $189.6 million, with $74.7 million in cash dividends and $114.9 million in repurchases of common stock.
Capital expenditures totaled $18.6 million in the quarter. Capital expenditures for 2025 are expected to be $65 million to $75 million.
About C.H. Robinson
C.H. Robinson is the global leader in Lean AI supply chains. For more than a century, companies everywhere have looked to us to reimagine how goods move. Now, as we redefine what’s next for the industry, that same drive fuels our commitment to Building Tomorrow’s Supply Chains, Today™. Trusted by 83,000 customers and 450,000 contract carriers, we manage 37 million shipments annually, representing $23 billion in freight. We deliver tailored solutions across the world via truckload, less-than-truckload, ocean, air, and more. With our unique combination of human insight and Lean AI working as one, supply chains move faster, smarter, and more sustainably. As a responsible global citizen, we proudly contribute millions to the causes that matter most to our employees. For more information, visit us at chrobinson.com (Nasdaq: CHRW).
Except for the historical information contained herein, the matters set forth in this release are forward-looking statements that represent our expectations, beliefs, intentions or strategies concerning future events. These forward-looking statements are subject to certain risks and uncertainties that could cause actual results to differ materially from our historical experience or our present expectations, including, but not limited to, factors such as changes in economic conditions, including uncertain consumer demand; changes in market demand and pressures on the pricing for our services; fuel price increases or decreases, or fuel shortages; competition and growth rates within the global logistics industry that could adversely impact our profitability and achieving our long-term growth targets; freight levels and increasing costs and availability of truck capacity or alternative means of transporting freight; risks associated with seasonal changes or significant disruptions in the transportation industry; risks associated with identifying and completing suitable acquisitions; our dependence on and changes in relationships with existing contracted truck, rail, ocean, and air carriers; risks associated with the loss of significant customers; risks associated with reliance on technology to operate our business; cyber-security related risks; our ability to staff and retain employees; risks associated with operations outside of the U.S.; our ability to successfully integrate the operations of acquired companies with our historic operations or efficiently managing divestitures; climate change related risks; risks associated with our indebtedness; risks associated with interest rates; risks associated with litigation, including contingent auto liability and insurance coverage; risks associated with the potential impact of changes in government regulations including environmental-related regulations; risks associated with the changes to income tax regulations; risks associated with the produce industry, including food safety and contamination issues; the impact of changes in political and governmental conditions; changes to our capital structure; changes due to catastrophic events; risks associated with the usage of artificial intelligence technologies; risks associated with cybersecurity events; and other risks and uncertainties detailed in our Annual and Quarterly Reports.
Any forward-looking statement speaks only as of the date on which such statement is made, and we undertake no obligation to update such statement to reflect events or circumstances arising after such date. All remarks made during our financial results conference call will be current at the time of the call, and we undertake no obligation to update the replay.
Conference Call Information:
C.H. Robinson Worldwide Third Quarter 2025 Earnings Conference Call
Wednesday, October 29, 2025; 5:30 p.m. Eastern Time
Presentation slides and a simultaneous live audio webcast of the conference call may be accessed through the Investor Relations link on C.H. Robinson’s website at chrobinson.com.
To participate in the conference call by telephone, please call ten minutes early by dialing: 877-269-7756
Adjusted Gross Profit by Service Line
(in thousands)
This table of summary results presents our service line adjusted gross profits on an enterprise basis. The service line adjusted gross profits in the table differ from the service line adjusted gross profits discussed within the segments as our segments may have revenues from multiple service lines.
| | | | | | | | | | | | | | | | | | | | | | | | | | | | | | | | | | | |
| Three Months Ended September 30, | | Nine Months Ended September 30, |
| 2025 | | 2024 | | % change | | 2025 | | 2024 | | % change |
Adjusted gross profits(1): | | | | | | | | | | | |
| Transportation | | | | | | | | | | | |
| Truckload | $ | 273,885 | | | $ | 279,564 | | | (2.0) | % | | $ | 804,086 | | | $ | 811,164 | | | (0.9) | % |
| LTL | 158,251 | | | 143,228 | | | 10.5 | % | | 458,848 | | | 430,187 | | | 6.7 | % |
| Ocean | 110,422 | | | 163,314 | | | (32.4) | % | | 333,659 | | | 392,831 | | | (15.1) | % |
| Air | 35,515 | | | 33,607 | | | 5.7 | % | | 102,786 | | | 95,045 | | | 8.1 | % |
| Customs | 36,358 | | | 28,266 | | | 28.6 | % | | 98,376 | | | 81,013 | | | 21.4 | % |
| Other logistics services | 56,421 | | | 54,338 | | | 3.8 | % | | 167,661 | | | 171,216 | | | (2.1) | % |
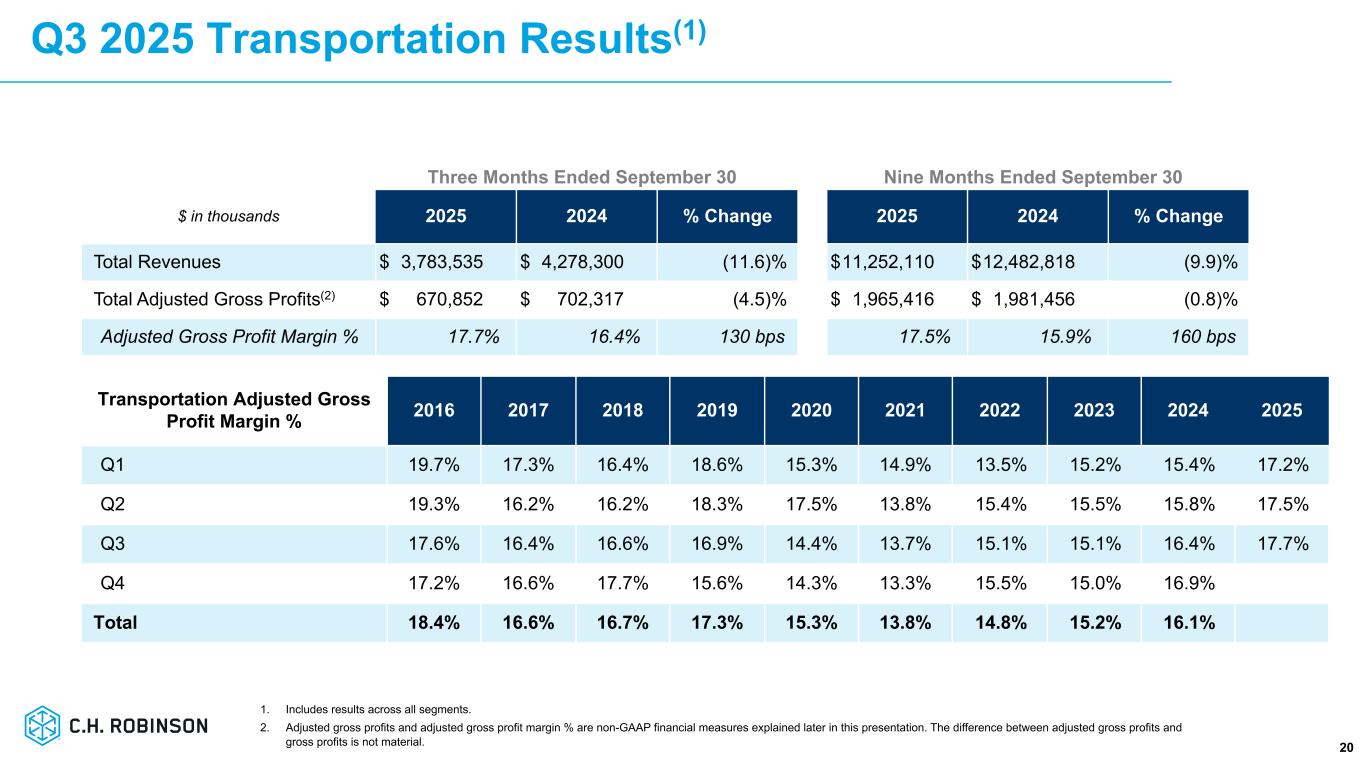
| Total transportation | 670,852 | | | 702,317 | | | (4.5) | % | | 1,965,416 | | | 1,981,456 | | | (0.8) | % |
| Sourcing | 35,225 | | | 32,936 | | | 6.9 | % | | 106,980 | | | 98,935 | | | 8.1 | % |
| Total adjusted gross profits | $ | 706,077 | | | $ | 735,253 | | | (4.0) | % | | $ | 2,072,396 | | | $ | 2,080,391 | | | (0.4) | % |
____________________________________________
(1) Adjusted gross profits is a non-GAAP financial measure explained later in this release. The difference between adjusted gross profits and gross profits is not material.
GAAP to Non-GAAP Reconciliation
(unaudited, in thousands)
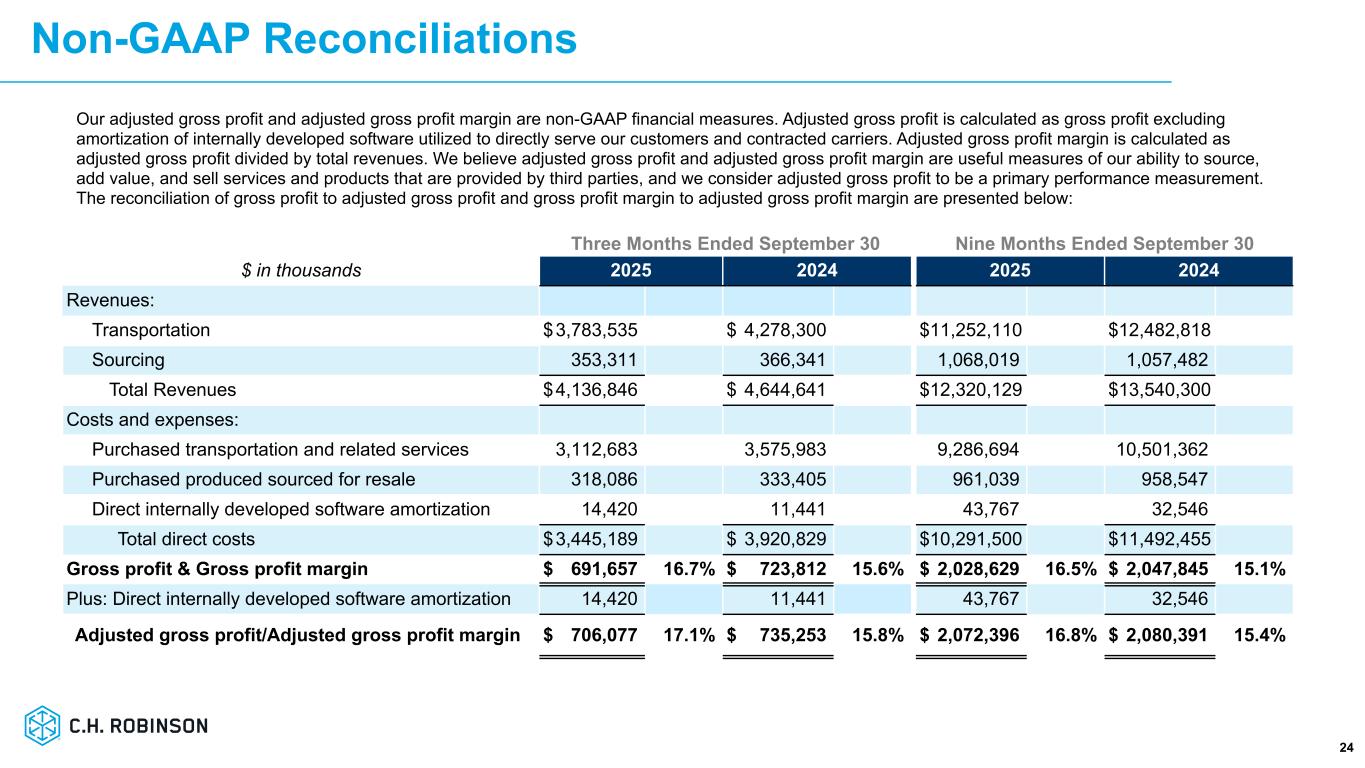
Our adjusted gross profit is a non-GAAP financial measure. Adjusted gross profit is calculated as gross profit excluding amortization of internally developed software utilized to directly serve our customers and contracted carriers. We believe adjusted gross profit is a useful measure of our ability to source, add value, and sell services and products that are provided by third parties, and we consider adjusted gross profit to be a primary performance measurement. Accordingly, the discussion of our results of operations often focuses on the changes in our adjusted gross profit. The reconciliation of gross profit to adjusted gross profit is presented below (in thousands): | | | | | | | | | | | | | | | | | | | | | | | | | | | | | | | | | | | |
| | Three Months Ended September 30, | | Nine Months Ended September 30, |
| 2025 | | 2024 | | % change | | 2025 | | 2024 | | % change |
| Revenues: | | | | | | | | | | | |
| Transportation | $ | 3,783,535 | | | $ | 4,278,300 | | | (11.6) | % | | $ | 11,252,110 | | | $ | 12,482,818 | | | (9.9) | % |
| Sourcing | 353,311 | | | 366,341 | | | (3.6) | % | | 1,068,019 | | | 1,057,482 | | | 1.0 | % |
| Total revenues | 4,136,846 | | | 4,644,641 | | | (10.9) | % | | 12,320,129 | | | 13,540,300 | | | (9.0) | % |
| Costs and expenses: | | | | | | | | | | | |
| Purchased transportation and related services | 3,112,683 | | | 3,575,983 | | | (13.0) | % | | 9,286,694 | | | 10,501,362 | | | (11.6) | % |
| Purchased products sourced for resale | 318,086 | | | 333,405 | | | (4.6) | % | | 961,039 | | | 958,547 | | | 0.3 | % |
| Direct internally developed software amortization | 14,420 | | | 11,441 | | | 26.0 | % | | 43,767 | | | 32,546 | | | 34.5 | % |
| Total direct expenses | 3,445,189 | | | 3,920,829 | | | (12.1) | % | | 10,291,500 | | | 11,492,455 | | | (10.4) | % |
| Gross profit | $ | 691,657 | | | $ | 723,812 | | | (4.4) | % | | $ | 2,028,629 | | | $ | 2,047,845 | | | (0.9) | % |
| Plus: Direct internally developed software amortization | 14,420 | | | 11,441 | | | 26.0 | % | | 43,767 | | | 32,546 | | | 34.5 | % |
| Adjusted gross profit | $ | 706,077 | | | $ | 735,253 | | | (4.0) | % | | $ | 2,072,396 | | | $ | 2,080,391 | | | (0.4) | % |
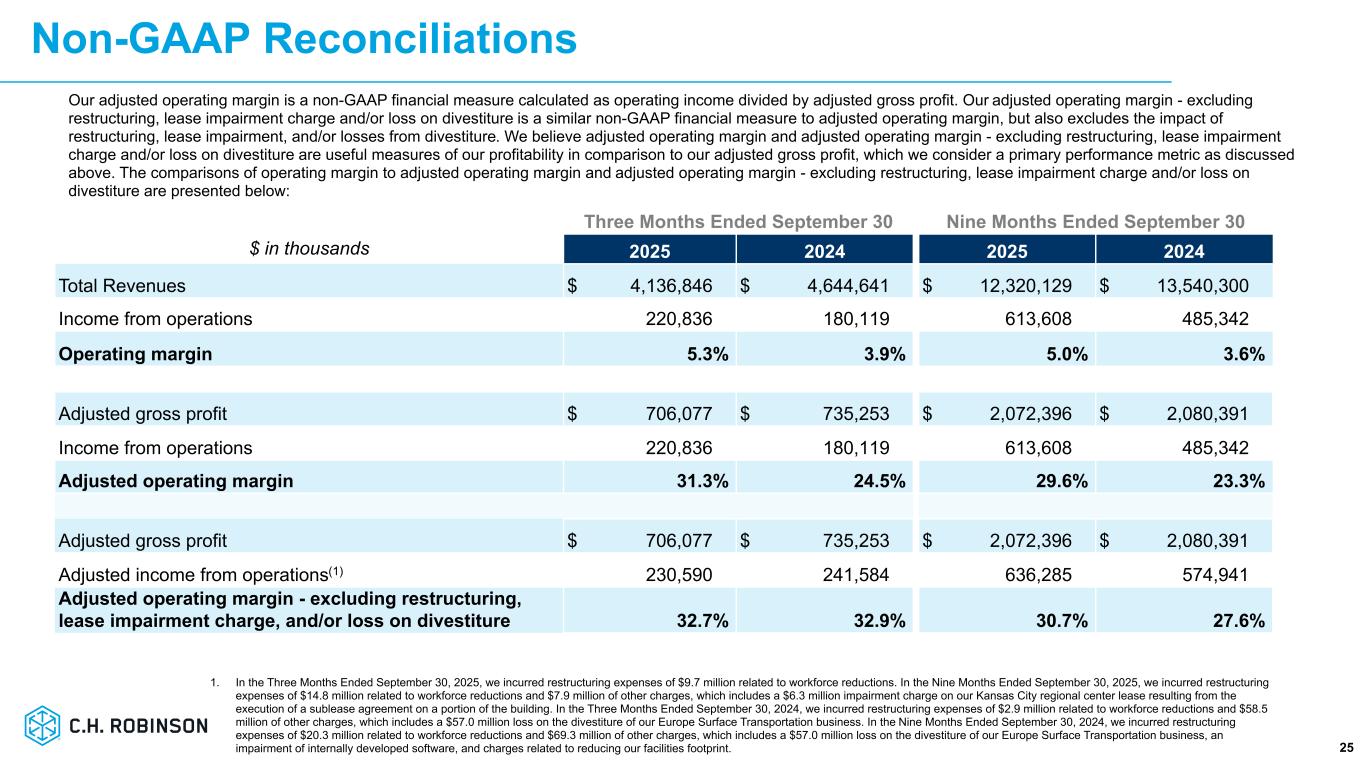
Our adjusted operating margin is a non-GAAP financial measure calculated as operating income divided by adjusted gross profit. Our adjusted operating margin - excluding restructuring, lease impairment charge and/or loss on divestiture is a similar non-GAAP financial measure as adjusted operating margin, but also excludes the impact of restructuring, lease impairment, and/or losses from divestiture. We believe adjusted operating margin and adjusted operating margin - excluding restructuring, lease impairment charge and/or loss on divestiture are useful measures of our profitability in comparison to our adjusted gross profit, which we consider a primary performance metric as discussed above. The comparisons of operating margin to adjusted operating margin and adjusted operating margin - excluding restructuring, lease impairment charge and/or loss on divestiture are presented below: | | | | | | | | | | | | | | | | | | | | | | | | | | | | | | | | | | | |
| Three Months Ended September 30, | | Nine Months Ended September 30, |
| 2025 | | 2024 | | % change | | 2025 | | 2024 | | % change |
| | | | | | | | | | | |
| Total revenues | $ | 4,136,846 | | | $ | 4,644,641 | | | (10.9) | % | | $ | 12,320,129 | | | $ | 13,540,300 | | | (9.0) | % |
| Income from operations | 220,836 | | | 180,119 | | | 22.6 | % | | 613,608 | | | 485,342 | | | 26.4 | % |
| Operating margin | 5.3 | % | | 3.9 | % | | 140 bps | | 5.0 | % | | 3.6 | % | | 140 bps |
| | | | | | | | | | | |
| Adjusted gross profit | $ | 706,077 | | | $ | 735,253 | | | (4.0) | % | | $ | 2,072,396 | | | $ | 2,080,391 | | | (0.4) | % |
| Income from operations | 220,836 | | | 180,119 | | | 22.6 | % | | 613,608 | | | 485,342 | | | 26.4 | % |
| Adjusted operating margin | 31.3 | % | | 24.5 | % | | 680 | bps | | 29.6 | % | | 23.3 | % | | 630 | bps |
| | | | | | | | | | | |
| Adjusted gross profit | $ | 706,077 | | | $ | 735,253 | | | (4.0) | % | | $ | 2,072,396 | | | $ | 2,080,391 | | | (0.4) | % |
| Adjusted income from operations | 230,590 | | | 241,584 | | | (4.6) | % | | 636,285 | | | 574,941 | | | 10.7 | % |
Adjusted operating margin - excluding restructuring, lease impairment charge, and/or loss on divestiture | 32.7 | % | | 32.9 | % | | (20) | bps | | 30.7 | % | | 27.6 | % | | 310 | bps |
GAAP to Non-GAAP Reconciliation
(unaudited, in thousands)
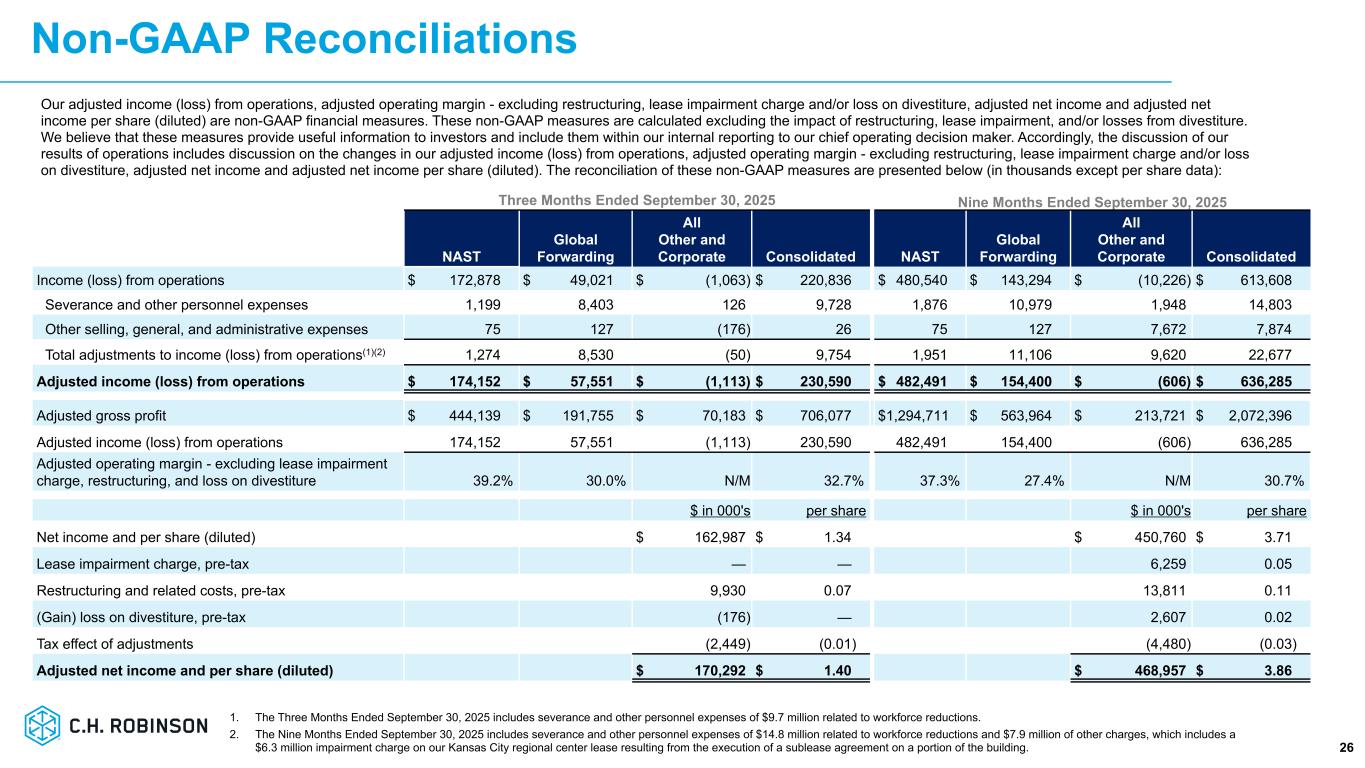
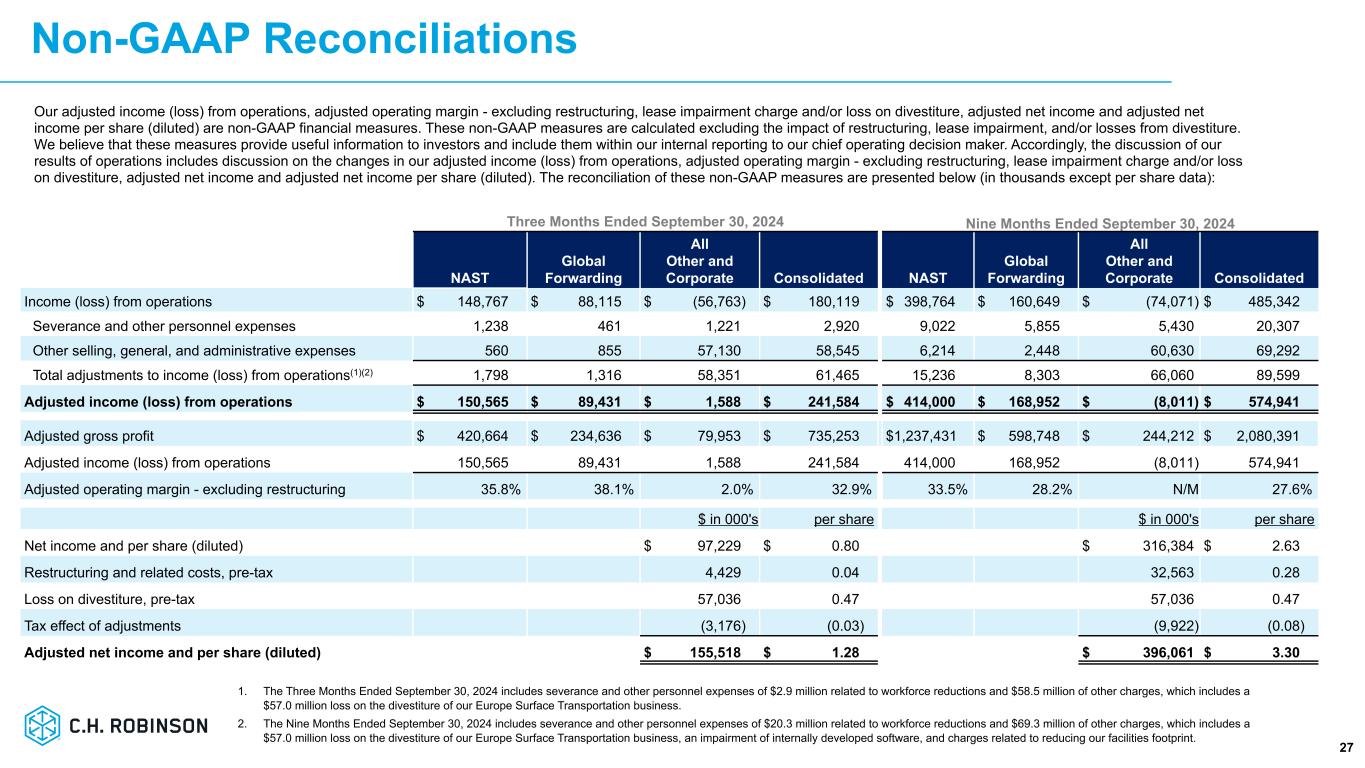
Our adjusted income (loss) from operations, adjusted operating margin - excluding restructuring, lease impairment charge and/or loss on divestiture, adjusted net income and adjusted net income per share (diluted) are non-GAAP financial measures. These non-GAAP measures are calculated excluding the impact of restructuring, lease impairment, and/or losses from divestiture. We believe that these measures provide useful information to investors and include them within our internal reporting to our chief operating decision maker. Accordingly, the discussion of our results of operations includes discussion on the changes in our adjusted income (loss) from operations, adjusted operating margin - excluding restructuring, lease impairment charge and/or loss on divestiture, adjusted net income and adjusted net income per share (diluted). The reconciliation of these non-GAAP measures are presented below (in thousands except per share data):
| | | | | | | | | | | | | | | | | | | | | | | |
| Non-GAAP Reconciliation: | NAST | | Global Forwarding | | All
Other and Corporate | | Consolidated |
| Three Months Ended September 30, 2025 | | | | | | | |
| Income (loss) from operations | $ | 172,878 | | | $ | 49,021 | | | $ | (1,063) | | | $ | 220,836 | |
| Severance and other personnel expenses | 1,199 | | | 8,403 | | | 126 | | | 9,728 | |
| Other selling, general, and administrative expenses | 75 | | | 127 | | | (176) | | | 26 | |
Total adjustments to income (loss) from operations(1) | 1,274 | | | 8,530 | | | (50) | | | 9,754 | |
| Adjusted income (loss) from operations | $ | 174,152 | | | $ | 57,551 | | | $ | (1,113) | | | $ | 230,590 | |
| | | | | | | |
| Adjusted gross profit | $ | 444,139 | | | $ | 191,755 | | | $ | 70,183 | | | $ | 706,077 | |
| Adjusted income (loss) from operations | 174,152 | | | 57,551 | | | (1,113) | | | 230,590 | |
| Adjusted operating margin - excluding restructuring and loss on divestiture | 39.2 | % | | 30.0 | % | | N/M | | 32.7 | % |
| | | | | | | |
| NAST | | Global Forwarding | | All
Other and Corporate | | Consolidated |
| Nine Months Ended September 30, 2025 | | | | | | | |
| Income (loss) from operations | $ | 480,540 | | | $ | 143,294 | | | $ | (10,226) | | | $ | 613,608 | |
| Severance and other personnel expenses | 1,876 | | | 10,979 | | | 1,948 | | | 14,803 | |
| Other selling, general, and administrative expenses | 75 | | | 127 | | | 7,672 | | | 7,874 | |
Total adjustments to income (loss) from operations(2) | 1,951 | | | 11,106 | | | 9,620 | | | 22,677 | |
| Adjusted income (loss) from operations | $ | 482,491 | | | $ | 154,400 | | | $ | (606) | | | $ | 636,285 | |
| | | | | | | |
| Adjusted gross profit | $ | 1,294,711 | | | $ | 563,964 | | | $ | 213,721 | | | $ | 2,072,396 | |
| Adjusted income (loss) from operations | 482,491 | | | 154,400 | | | (606) | | | 636,285 | |
| Adjusted operating margin - excluding lease impairment charge, restructuring, and loss on divestiture | 37.3 | % | | 27.4 | % | | N/M | | 30.7 | % |
| | | | | | | |
| | | |
| | | | | | | |
| | | | | | | |
| | | | | | | |
| | | | | | | |
| | | | | | | |
| | | | | | | |
| | | | | | | |
| | | | | | | | | | | | | | | | | | | | | | | |
| Three Months Ended September 30, 2025 | | Nine Months Ended September 30, 2025 |
| $ in 000's | | per share | | $ in 000's | | per share |
| Net income and per share (diluted) | $ | 162,987 | | | $ | 1.34 | | | $ | 450,760 | | | $ | 3.71 | |
| Lease impairment charge, pre-tax | — | | | — | | | 6,259 | | | 0.05 | |
| | | | | | | |
| Restructuring and related costs, pre-tax | 9,930 | | | 0.07 | | | 13,811 | | | 0.11 | |
| (Gain) loss on divestiture, pre-tax | (176) | | | — | | | 2,607 | | | 0.02 | |
| Tax effect of adjustments | (2,449) | | | (0.01) | | | (4,480) | | | (0.03) | |
| Adjusted net income and per share (diluted) | $ | 170,292 | | | $ | 1.40 | | | $ | 468,957 | | | $ | 3.86 | |
____________________________________________
(1) The three months ended September 30, 2025 includes severance and other personnel expenses of $9.7 million related to workforce reductions.
(2) The nine months ended September 30, 2025 includes severance and other personnel expenses of $14.8 million primarily related to workforce reductions and $7.9 million of other charges, which include a $6.3 million impairment charge on our Kansas City regional center lease resulting from the execution of a sublease agreement on a portion of the building.
| | | | | | | | | | | | | | | | | | | | | | | |
| Non-GAAP Reconciliation: | NAST | | Global Forwarding | | All
Other and Corporate | | Consolidated |
| Three Months Ended September 30, 2024 | | | | | | | |
| Income (loss) from operations | $ | 148,767 | | | $ | 88,115 | | | $ | (56,763) | | | $ | 180,119 | |
| Severance and other personnel expenses | 1,238 | | | 461 | | | 1,221 | | | 2,920 | |
| Other selling, general, and administrative expenses | 560 | | | 855 | | | 57,130 | | | 58,545 | |
Total adjustments to income (loss) from operations(1) | 1,798 | | | 1,316 | | | 58,351 | | | 61,465 | |
| Adjusted income from operations | $ | 150,565 | | | $ | 89,431 | | | $ | 1,588 | | | $ | 241,584 | |
| | | | | | | |
| Adjusted gross profit | $ | 420,664 | | | $ | 234,636 | | | $ | 79,953 | | | $ | 735,253 | |
| Adjusted income from operations | 150,565 | | | 89,431 | | | 1,588 | | | 241,584 | |
Adjusted operating margin - excluding restructuring and loss on
divestiture | 35.8 | % | | 38.1 | % | | 2.0 | % | | 32.9 | % |
| | | | | | | |
| NAST | | Global Forwarding | | All
Other and Corporate | | Consolidated |
| Nine Months Ended September 30, 2024 | | | | | | | |
| Income (loss) from operations | $ | 398,764 | | | $ | 160,649 | | | $ | (74,071) | | | $ | 485,342 | |
| Severance and other personnel expenses | 9,022 | | | 5,855 | | | 5,430 | | | 20,307 | |
| Other selling, general, and administrative expenses | 6,214 | | | 2,448 | | | 60,630 | | | 69,292 | |
Total adjustments to income (loss) from operations(2) | 15,236 | | | 8,303 | | | 66,060 | | | 89,599 | |
| Adjusted income (loss) from operations | $ | 414,000 | | | $ | 168,952 | | | $ | (8,011) | | | $ | 574,941 | |
| | | | | | | |
| Adjusted gross profit | $ | 1,237,431 | | | $ | 598,748 | | | $ | 244,212 | | | $ | 2,080,391 | |
| Adjusted income (loss) from operations | 414,000 | | | 168,952 | | | (8,011) | | | 574,941 | |
Adjusted operating margin - excluding restructuring and loss on
divestiture | 33.5 | % | | 28.2 | % | | N/M | | 27.6 | % |
| | | | | | | |
| | | |
| | | | | | | |
| | | | | | | |
| | | | | | | |
| | | | | | | |
| | | | | | | |
| | | | | | | |
| | | | | | | |
| | | | | | | | | | | | | | | | | | | | | | | |
| Three Months Ended September 30, 2024 | | Nine Months Ended September 30, 2024 |
| $ in 000's | | per share | | $ in 000's | | per share |
| Net income and per share (diluted) | $ | 97,229 | | | $ | 0.80 | | | $ | 316,384 | | | $ | 2.63 | |
| Restructuring and related costs, pre-tax | 4,429 | | | 0.04 | | | 32,563 | | | 0.28 | |
| | | | | | | |
| Loss on divestiture, pre-tax | 57,036 | | | 0.47 | | | 57,036 | | | 0.47 | |
| | | | | | | |
| Tax effect of adjustments | (3,176) | | | (0.03) | | | (9,922) | | | (0.08) | |
| Adjusted net income and per share (diluted) | $ | 155,518 | | | $ | 1.28 | | | $ | 396,061 | | | $ | 3.30 | |
____________________________________________
(1) The three months ended September 30, 2024 includes severance and other personnel expenses of $2.9 million related to workforce reductions and $58.5 million of other charges, which includes a $57.0 million loss on the divestiture of our Europe Surface Transportation business.
(2) The nine months ended September 30, 2024 includes severance and other personnel expenses of $20.3 million related to workforce reductions and $69.3 million of other charges, which includes a $57.0 million loss on the divestiture of our Europe Surface Transportation business, an impairment of internally developed software, and charges related to reducing our facilities footprint including early termination or abandonment of office buildings under operating leases.
Condensed Consolidated Statements of Income
(unaudited, in thousands, except per share data)
| | | | | | | | | | | | | | | | | | | | | | | | | | | | | | | | | | | |
| Three Months Ended September 30, | | Nine Months Ended September 30, |
| |
| 2025 | | 2024 | | % change | | 2025 | | 2024 | | % change |
| | | | | | | | | | | |
| Revenues: | | | | | | | | | | | |
| Transportation | $ | 3,783,535 | | | $ | 4,278,300 | | | (11.6) | % | | $ | 11,252,110 | | | $ | 12,482,818 | | | (9.9) | % |
| Sourcing | 353,311 | | | 366,341 | | | (3.6) | % | | 1,068,019 | | | 1,057,482 | | | 1.0 | % |
| Total revenues | 4,136,846 | | | 4,644,641 | | | (10.9) | % | | 12,320,129 | | | 13,540,300 | | | (9.0) | % |
| Costs and expenses: | | | | | | | | | | | |
| Purchased transportation and related services | 3,112,683 | | | 3,575,983 | | | (13.0) | % | | 9,286,694 | | | 10,501,362 | | | (11.6) | % |
| Purchased products sourced for resale | 318,086 | | | 333,405 | | | (4.6) | % | | 961,039 | | | 958,547 | | | 0.3 | % |
| Personnel expenses | 349,302 | | | 361,559 | | | (3.4) | % | | 1,033,177 | | | 1,101,868 | | | (6.2) | % |
| Other selling, general, and administrative expenses | 135,939 | | | 193,575 | | | (29.8) | % | | 425,611 | | | 493,181 | | | (13.7) | % |
| Total costs and expenses | 3,916,010 | | | 4,464,522 | | | (12.3) | % | | 11,706,521 | | | 13,054,958 | | | (10.3) | % |
| Income from operations | 220,836 | | | 180,119 | | | 22.6 | % | | 613,608 | | | 485,342 | | | 26.4 | % |
| Interest and other income/expense, net | (15,602) | | | (36,282) | | | (57.0) | % | | (57,679) | | | (74,587) | | | (22.7) | % |
| Income before provision for income taxes | 205,234 | | | 143,837 | | | 42.7 | % | | 555,929 | | | 410,755 | | | 35.3 | % |
| Provision for income taxes | 42,247 | | | 46,608 | | | (9.4) | % | | 105,169 | | | 94,371 | | | 11.4 | % |
| Net income | $ | 162,987 | | | $ | 97,229 | | | 67.6 | % | | $ | 450,760 | | | $ | 316,384 | | | 42.5 | % |
| | | | | | | | | | | |
| Net income per share (basic) | $ | 1.36 | | | $ | 0.81 | | | 67.9 | % | | $ | 3.75 | | | $ | 2.65 | | | 41.5 | % |
| Net income per share (diluted) | $ | 1.34 | | | $ | 0.80 | | | 67.5 | % | | $ | 3.71 | | | $ | 2.63 | | | 41.1 | % |
| | | | | | | | | | | |
| Weighted average shares outstanding (basic) | 119,887 | | | 119,860 | | | — | % | | 120,363 | | | 119,542 | | | 0.7 | % |
| Weighted average shares outstanding (diluted) | 121,349 | | | 121,179 | | | 0.1 | % | | 121,413 | | | 120,155 | | | 1.0 | % |
Business Segment Information
(unaudited, in thousands, except average employee headcount)
| | | | | | | | | | | | | | | | | | | | | | | | | | | | | |
| | NAST | | Global Forwarding | | | All Other and Corporate | | | | Consolidated |
| Three Months Ended September 30, 2025 | | | | | | | | | | | |
| Total revenues | | $ | 2,965,694 | | | $ | 786,347 | | | | $ | 384,805 | | | | | $ | 4,136,846 | |
Adjusted gross profits(1) | | 444,139 | | | 191,755 | | | | 70,183 | | | | | 706,077 | |
| Income (loss) from operations | | 172,878 | | | 49,021 | | | | (1,063) | | | | | 220,836 | |
| Depreciation and amortization | | 4,874 | | | 2,250 | | | | 18,705 | | | | | 25,829 | |
Total assets(2) | | 2,978,317 | | | 1,233,692 | | | | 1,015,845 | | | | | 5,227,854 | |
| Average employee headcount | | 5,187 | | | 4,245 | | | | 3,127 | | | | | 12,559 | |
| | | | | | | | | | | |
| | NAST | | Global Forwarding | | | All Other and Corporate | | | | Consolidated |
| Three Months Ended September 30, 2024 | | | | | | | | | | | |
| Total revenues | | $ | 2,934,617 | | | $ | 1,141,190 | | | | $ | 568,834 | | | | | $ | 4,644,641 | |
Adjusted gross profits(1) | | 420,664 | | | 234,636 | | | | 79,953 | | | | | 735,253 | |
| Income (loss) from operations | | 148,767 | | | 88,115 | | | | (56,763) | | | | | 180,119 | |
| Depreciation and amortization | | 4,904 | | | 2,608 | | | | 16,436 | | | | | 23,948 | |
Total assets(2) | | 3,026,031 | | | 1,566,427 | | | | 1,020,897 | | | | | 5,613,355 | |
| Average employee headcount | | 5,595 | | | 4,552 | | | | 3,938 | | | | | 14,085 | |
| | | | | | | | | | | | | | | | | | | | | | | | | | | | |
| | NAST | | Global Forwarding | | All Other and Corporate | | | | Consolidated |
| Nine Months Ended September 30, 2025 | | | | | | | | | | |
| Total revenues | | $ | 8,752,341 | | | $ | 2,359,035 | | | $ | 1,208,753 | | | | | $ | 12,320,129 | |
Adjusted gross profits(1) | | 1,294,711 | | | 563,964 | | | 213,721 | | | | | 2,072,396 | |
| Income (loss) from operations | | 480,540 | | | 143,294 | | | (10,226) | | | | | 613,608 | |
| Depreciation and amortization | | 14,498 | | | 6,577 | | | 55,262 | | | | | 76,337 | |
Total assets(2) | | 2,978,317 | | | 1,233,692 | | | 1,015,845 | | | | | 5,227,854 | |
| Average employee headcount | | 5,234 | | | 4,380 | | | 3,339 | | | | | 12,953 | |
| | | | | | | | | | |
| | NAST | | Global Forwarding | | All Other and Corporate | | | | Consolidated |
| Nine Months Ended September 30, 2024 | | | | | | | | | | |
| Total revenues | | $ | 8,924,839 | | | $ | 2,921,050 | | | $ | 1,694,411 | | | | | $ | 13,540,300 | |
Adjusted gross profits(1) | | 1,237,431 | | | 598,748 | | | 244,212 | | | | | 2,080,391 | |
| Income (loss) from operations | | 398,764 | | | 160,649 | | | (74,071) | | | | | 485,342 | |
| Depreciation and amortization | | 15,779 | | | 8,245 | | | 48,856 | | | | | 72,880 | |
Total assets(2) | | 3,026,031 | | | 1,566,427 | | | 1,020,897 | | | | | 5,613,355 | |
| Average employee headcount | | 5,800 | | | 4,714 | | | 4,023 | | | | | 14,537 | |
____________________________________________
(1) Adjusted gross profits is a non-GAAP financial measure explained above. The difference between adjusted gross profits and gross profits is not material.
(2) All cash and cash equivalents are included in All Other and Corporate.
Condensed Consolidated Balance Sheets
(unaudited, in thousands)
| | | | | | | | | | | |
| September 30, 2025 | | December 31, 2024 |
| Assets | | | |
| Current assets: | | | |
| Cash and cash equivalents | $ | 136,837 | | | $ | 145,762 | |
| Receivables, net of allowance for credit loss | 2,542,704 | | | 2,383,709 | |
| Contract assets, net of allowance for credit loss | 177,623 | | | 200,332 | |
| Prepaid expenses and other | 129,326 | | | 102,166 | |
| Assets held for sale | — | | | 137,634 | |
| Total current assets | 2,986,490 | | | 2,969,603 | |
| | | | |
| Property and equipment, net of accumulated depreciation and amortization | 120,733 | | | 127,189 | |
| Right-of-use lease assets | 291,051 | | | 334,738 | |
| Intangible and other assets, net of accumulated amortization | 1,829,580 | | | 1,866,396 | |
| Total assets | $ | 5,227,854 | | | $ | 5,297,926 | |
| | | |
| Liabilities and stockholders’ investment | | | |
| Current liabilities: | | | |
| Accounts payable and outstanding checks | $ | 1,307,766 | | | $ | 1,212,132 | |
| Accrued expenses: | | | |
| Compensation | 172,356 | | | 180,801 | |
| Transportation expense | 139,180 | | | 153,274 | |
| Income taxes | 24,108 | | | 9,326 | |
| Other accrued liabilities | 168,458 | | | 173,318 | |
| Current lease liabilities | 72,200 | | | 72,842 | |
| Current portion of debt | — | | | 455,792 | |
| Liabilities held for sale | — | | | 67,413 | |
| Total current liabilities | 1,884,068 | | | 2,324,898 | |
| | | |
| Long-term debt | 1,183,150 | | | 921,857 | |
| Noncurrent lease liabilities | 247,068 | | | 290,641 | |
| Noncurrent income taxes payable | 42,776 | | | 23,472 | |
| Deferred tax liabilities | 9,717 | | | 12,565 | |
| Other long-term liabilities | 4,034 | | | 2,442 | |
| Total liabilities | 3,370,813 | | | 3,575,875 | |
| | | |
| Total stockholders’ investment | 1,857,041 | | | 1,722,051 | |
| Total liabilities and stockholders’ investment | $ | 5,227,854 | | | $ | 5,297,926 | |
Condensed Consolidated Statements of Cash Flow
(unaudited, in thousands, except operational data)
| | | | | | | | | | | |
| Nine Months Ended September 30, |
| Operating activities: | 2025 | | 2024 |
| | | |
| Net income | $ | 450,760 | | | $ | 316,384 | |
| Adjustments to reconcile net income to net cash provided by (used for) operating activities: | | | |
| Depreciation and amortization | 76,337 | | | 72,880 | |
| Provision for credit losses | 6,571 | | | 3,755 | |
| Stock-based compensation | 62,774 | | | 64,249 | |
| Deferred income taxes | 30,564 | | | (7,033) | |
| Excess tax benefit on stock-based compensation | (15,621) | | | (5,509) | |
| Change in loss on disposal group | (569) | | | 48,232 | |
| Other operating activities | 7,172 | | | 11,845 | |
| Changes in operating elements: | | | |
| Receivables | (89,325) | | | (398,059) | |
| Contract assets | 23,035 | | | (88,171) | |
| Prepaid expenses and other | (26,521) | | | 24,588 | |
| Right of use asset | 42,475 | | | 5,884 | |
| Accounts payable and outstanding checks | 79,171 | | | 77,397 | |
| Accrued compensation | (9,903) | | | 33,921 | |
| Accrued transportation expenses | (14,094) | | | 68,588 | |
| Accrued income taxes | 49,418 | | | 10,634 | |
| Other accrued liabilities | (16,168) | | | 4,809 | |
| Lease liability | (49,701) | | | (5,917) | |
| Other assets and liabilities | 2,730 | | | 2,677 | |
| Net cash provided by operating activities | 609,105 | | | 241,154 | |
| | | |
| Investing activities: | | | |
| Purchases of property and equipment | (16,615) | | | (19,977) | |
| Purchases and development of software | (38,246) | | | (39,122) | |
| Proceeds from divestiture | 27,737 | | | — | |
| | | |
| Net cash used for investing activities | (27,124) | | | (59,099) | |
| | | |
| Financing activities: | | | |
| Proceeds from stock issued for employee benefit plans | 112,076 | | | 79,914 | |
| Stock tendered for payment of withholding taxes | (57,982) | | | (23,902) | |
| Repurchase of common stock | (240,257) | | | — | |
| Cash dividends | (227,053) | | | (220,256) | |
| Proceeds from long-term borrowings | 344,000 | | | — | |
| Payments on long-term borrowings | (512,000) | | | (10,000) | |
| Proceeds from short-term borrowings | 1,548,800 | | | 2,461,500 | |
| Payments on short-term borrowings | (1,575,800) | | | (2,471,500) | |
| Net cash used for financing activities | (608,216) | | | (184,244) | |
| Effect of exchange rates on cash and cash equivalents | 6,534 | | | (653) | |
| | | |
| Net change in cash and cash equivalents, including cash and cash equivalents classified within assets held for sale | (19,701) | | | (2,842) | |
| Plus: net decrease (increase) in cash and cash equivalents within assets held for sale | 10,776 | | | (10,978) | |
| Cash and cash equivalents, beginning of period | 145,762 | | | 145,524 | |
| Cash and cash equivalents, end of period | $ | 136,837 | | | $ | 131,704 | |
| | | |
| As of September 30, |
| Operational Data: | 2025 | | 2024 |
| Employees | 12,314 | | | 13,956 | |
Source: C.H. Robinson
CHRW-IR
| | | | | |
| C.H. Robinson 14701 Charlson Rd. Eden Prairie, MN 55347 www.chrobinson.com
|
| FOR IMMEDIATE RELEASE | FOR INQUIRIES, CONTACT: Chuck Ives, Senior Director of Investor Relations |
C.H. Robinson Raises 2026 Operating Income Target
Board of Directors Authorizes Additional $2 Billion Share Buyback
EDEN PRAIRIE, MINNESOTA, October 29, 2025 — C.H. Robinson Worldwide, Inc. (“C.H. Robinson”) (Nasdaq: CHRW) announced today that it is raising the 2026 operating income target that was originally shared at its 2024 Investor Day.
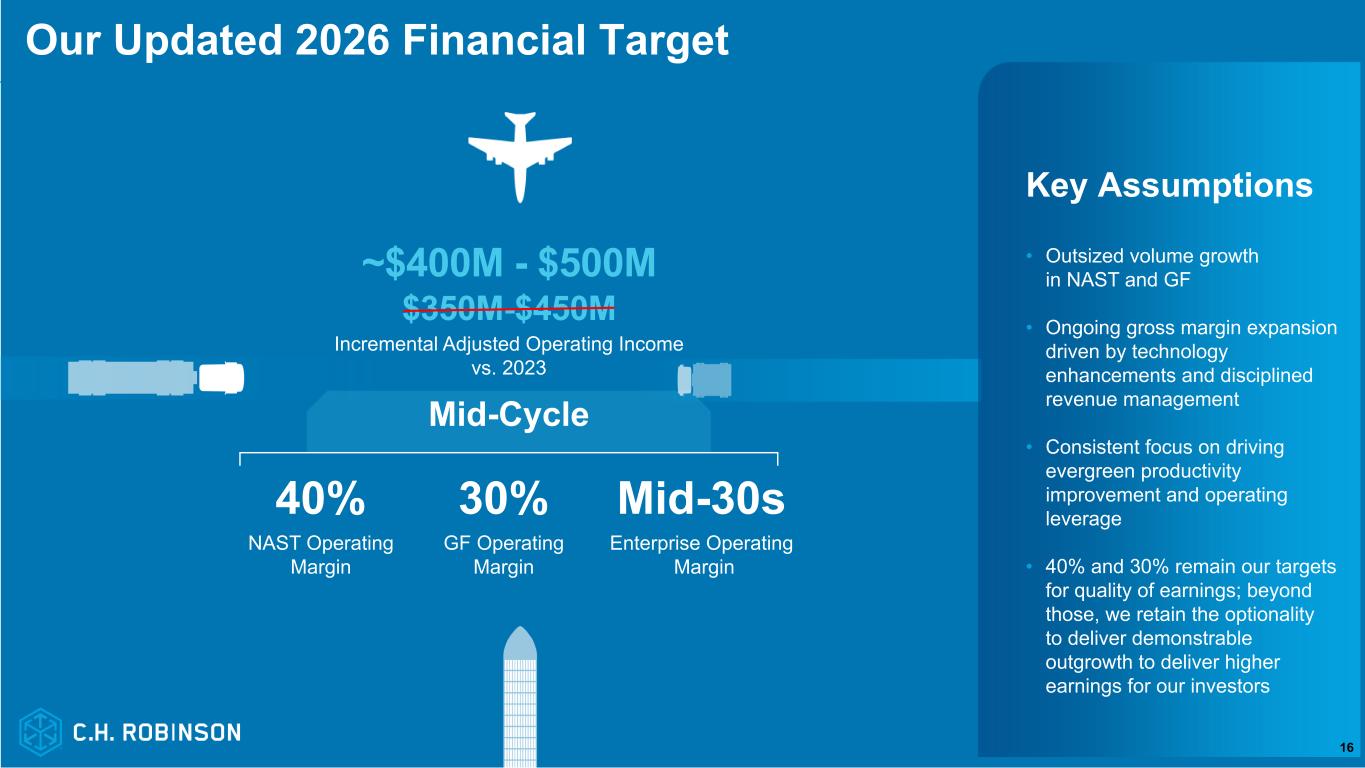
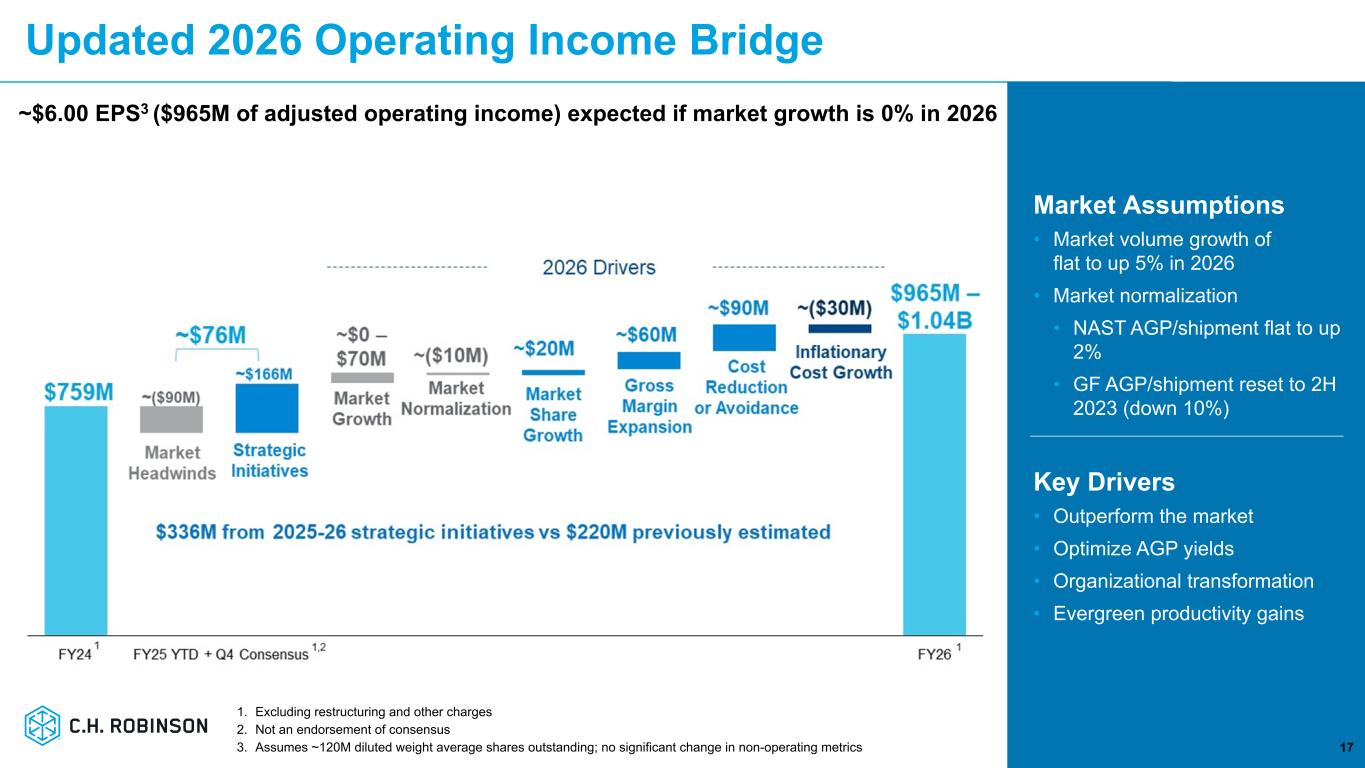
“During our Investor Day last December, we announced that we expected to increase our 2026 operating income by $350 to $450 million versus our 2023 adjusted operating income(1) of $553 million,” said Chief Financial Officer, Damon Lee. “Based on the confidence in our strategy, our disciplined execution, and our significant runway for further improvement, we are increasing that target today by roughly $50 million despite market dynamics that have created greater headwinds than we originally anticipated. This results in a new 2026 operating income target range of $965 million to $1.04 billion. The bottom end of this range, which assumes zero market volume growth, equates to approximately $6 of earnings per share(2).”
Underpinning the higher operating income target is an expectation that C.H. Robinson can deliver additional benefit from its strategic initiatives aimed at growing market share, expanding gross margins and increasing operating leverage. “At our Investor Day in December 2024, we estimated that our strategic initiatives would deliver $220 million of adjusted operating income growth in 2026 vs 2024,” added Lee. “Today, we’re raising that expectation to $336 million, reflecting stronger benefits from our Lean AI strategy, resulting in additional productivity improvement and operating leverage, as well as additional benefit in 2026 from continued gross margin expansion and market share growth.”
“Embedded in our operating leverage target is an expectation that the disciplined execution of our Lean operating model will deliver a baseline of single-digit productivity improvements every year,” said President and Chief Executive Officer, Dave Bozeman. “Then, as we incorporate certain innovations into our operations, such as agentic AI, we expect there to be additional waves of productivity. For 2026, this translates to an expectation that we will again deliver double-digit productivity increases in both NAST and Global Forwarding, and we expect these benefits to be overindexed to the second half of 2026.”
Lee also addressed the company’s mid-cycle operating margin targets of 40% for NAST and 30% for Global Forwarding. “Although we are at or nearing our mid-cycle operating margin targets at the bottom of the market cycle, we have not increased those targets. We believe our margin targets represent a high quality of earnings, and we want to retain optionality in how to best deliver shareholder value. In other words, we may choose to invest operating margins above those targets to deliver demonstrable outgrowth if we believe that will deliver higher earnings and a better return for Robinson and our shareholders,” said Lee.
To further enhance shareholder value, C.H. Robinson’s Board of Directors has authorized a $2 billion share repurchase program. “We currently intend to execute this program over approximately three years,” Lee added. This new authorization is in addition to the existing share repurchase authorization, which has approximately 4.5 million shares remaining. Repurchases may be made from time to time in the open market at prevailing prices or in privately negotiated transactions, including block purchases, accelerated share repurchase programs, and 10b5-1 plan, subject to market conditions and other factors.
“As we have said several times over the past year, we are still in the early innings of the transformation that is occurring at C.H. Robinson, with significant runway remaining on the execution of our Lean AI strategy,” concluded Bozeman. “We are proud of the progress we have made and even more excited about what’s ahead and about our ability to deliver sustainable profitable growth and long-term value for our customers and carriers, our people and our shareholders.”
(1) Adjusted operating income is a non-GAAP measure that excludes restructuring and other charges. Additional information about adjusted operating income, including a reconciliation to operating income, is available in our Form 8-Ks filed on October 29, 2025 and January 31, 2024.
(2) Assumes approximately 120 million diluted weighted average shares outstanding.
About C.H. Robinson
C.H. Robinson is the global leader in Lean AI supply chains. For more than a century, companies everywhere have looked to us to reimagine how goods move. Now, as we redefine what’s next for the industry, that same drive fuels our commitment to Building Tomorrow’s Supply Chains, Today™. Trusted by 83,000 customers and 450,000 contract carriers, we manage 37 million shipments annually, representing $23 billion in freight. We deliver tailored solutions across the world via truckload, less-than-truckload, ocean, air, and more. With our unique combination of human insight and Lean AI working as one, supply chains move faster, smarter, and more sustainably. As a responsible global citizen, we proudly contribute millions to the causes that matter most to our employees. For more information, visit us at chrobinson.com (Nasdaq: CHRW).
Except for the historical information contained herein, the matters set forth in this release are forward-looking statements that represent our expectations, beliefs, intentions or strategies concerning future events, including our expectations for 2026 operating income and our share repurchase expectations. These forward-looking statements are subject to certain risks and uncertainties that could cause actual results to differ materially from our historical experience or our present expectations, including, but not limited to, factors such as changes in economic conditions, including uncertain consumer demand; changes in market demand and pressures on the pricing for our services; fuel price increases or decreases, or fuel shortages; competition and growth rates within the global logistics industry that could adversely impact our profitability and achieving our long-term growth targets; freight levels and increasing costs and availability of truck capacity or alternative means of transporting freight; risks associated with seasonal changes or significant disruptions in the transportation industry; risks associated with identifying and completing suitable acquisitions; our dependence on and changes in relationships with existing contracted truck, rail, ocean, and air carriers; risks associated with the loss of significant customers; risks associated with reliance on technology to operate our business; cyber-security related risks; our ability to staff and retain employees; risks associated with operations outside of the U.S.; our ability to successfully integrate the operations of acquired companies with our historic operations or efficiently managing divestitures; climate change related risks; risks associated with our indebtedness; risks associated with interest rates; risks associated with litigation, including contingent auto liability
and insurance coverage; risks associated with the potential impact of changes in government regulations including environmental-related regulations; risks associated with the changes to income tax regulations; risks associated with the produce industry, including food safety and contamination issues; the impact of changes in political and governmental conditions; changes to our capital structure; changes due to catastrophic events; risks associated with the usage of artificial intelligence technologies; risks associated with cybersecurity events; and other risks and uncertainties detailed in our Annual and Quarterly Reports.
Any forward-looking statement speaks only as of the date on which such statement is made, and we undertake no obligation to update such statement to reflect events or circumstances arising after such date. All remarks made during our financial results conference call will be current at the time of the call, and we undertake no obligation to update the replay.
Source: C.H. Robinson
CHRW-IR