| | | | | |
| C.H. Robinson 14701 Charlson Rd. Eden Prairie, MN 55347 www.chrobinson.com
|
| FOR INQUIRIES, CONTACT: Robert Houghton, VP of Corporate Finance |
FOR IMMEDIATE RELEASE
C.H. Robinson Reports 2020 First Quarter Results
MINNEAPOLIS, MN, April 28, 2020 - C.H. Robinson Worldwide, Inc. (“C.H. Robinson”) (Nasdaq: CHRW) today reported financial results for the quarter ended March 31, 2020.
First Quarter Key Metrics:
•Total revenues increased 1.4 percent to $3.8 billion
•Net revenues decreased 16.3 percent to $568.0 million
•Income from operations decreased 51.3 percent to $109.4 million
•Operating margin decreased 1,380 basis points to 19.3 percent
•Diluted earnings per share (EPS) decreased 50.9 percent to $0.57
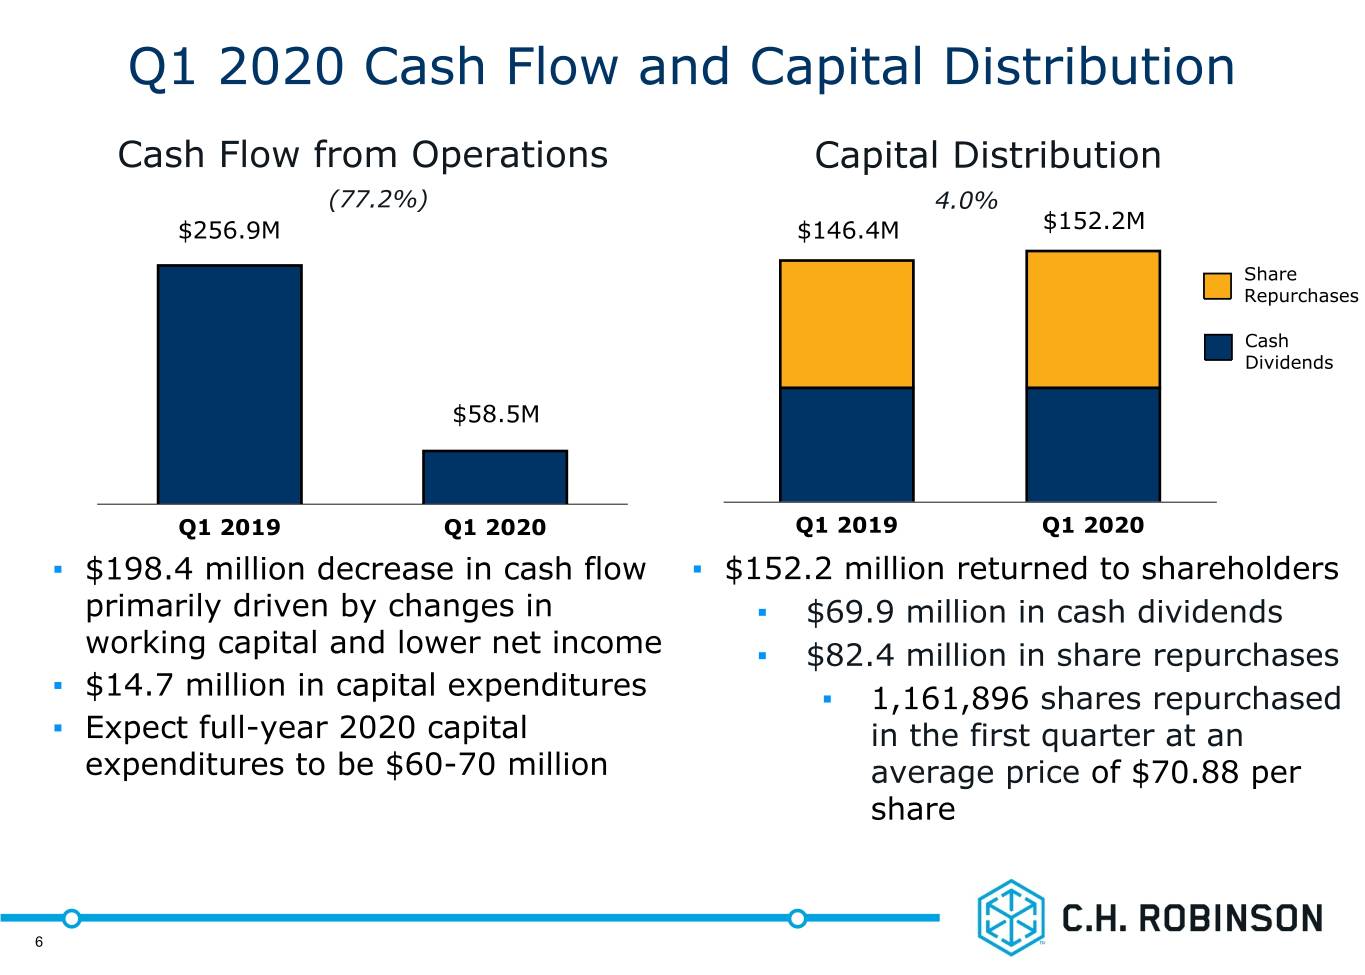
•Cash flow from operations decreased 77.2 percent to $58.5 million
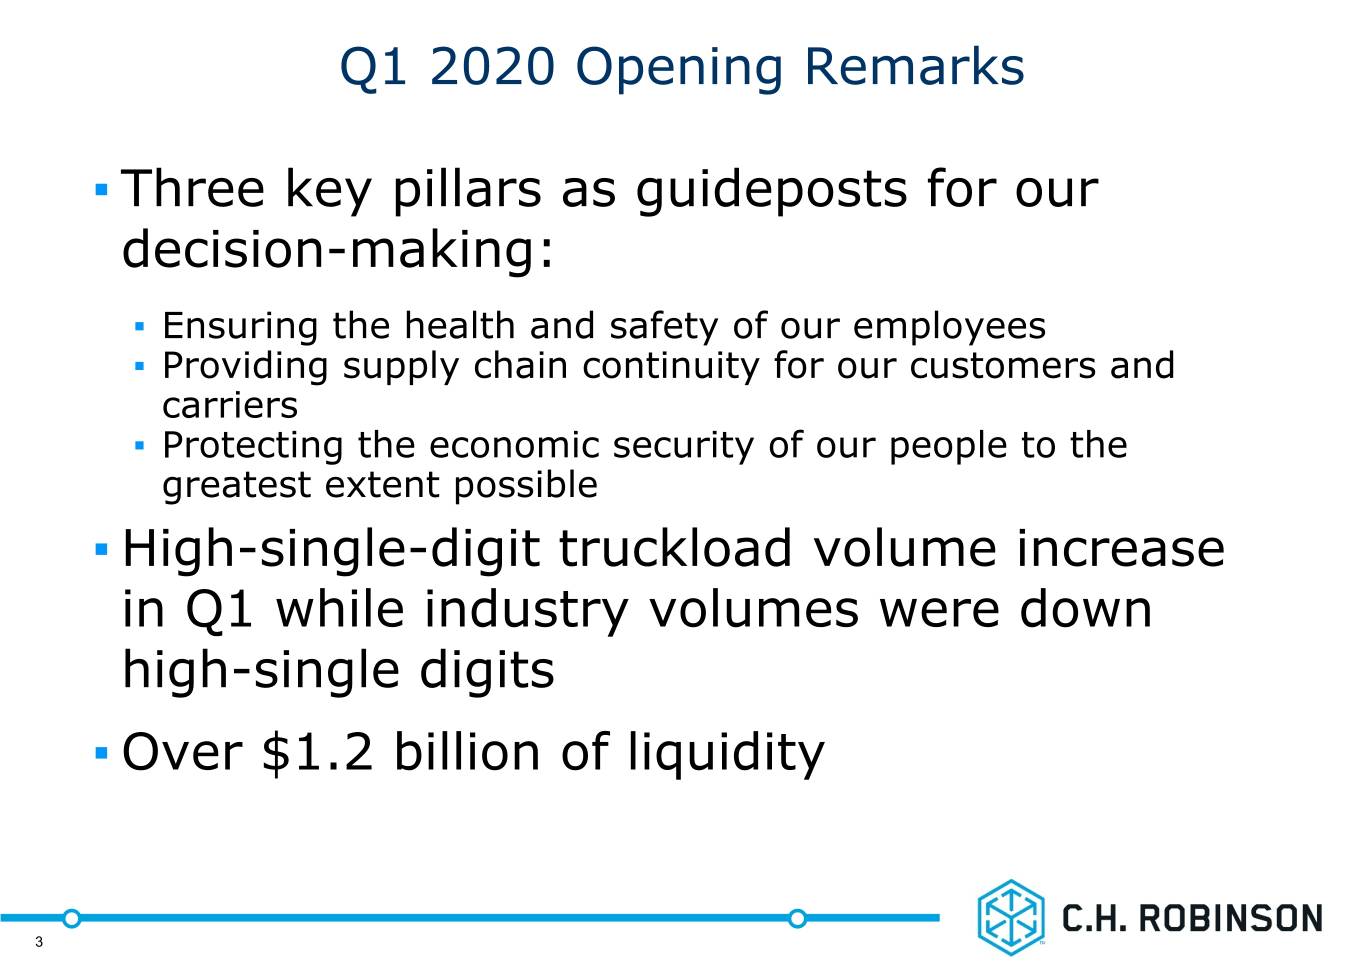
“Since the beginning of the COVID-19 pandemic, C.H. Robinson has focused on three key pillars as guideposts for our decision making: ensuring the health and safety of our employees, providing supply chain continuity for our customers and carriers, and protecting the economic security of our people to the greatest extent possible,” said Bob Biesterfeld, Chief Executive Officer of C.H. Robinson.
Biesterfeld continued, “We continue to have a strong balance sheet and exited the first quarter with over $1.2 billion of liquidity. We remain committed to maintaining our quarterly dividend, and we believe we are well positioned to weather the economic uncertainty in the months ahead.”
First Quarter Results Summary
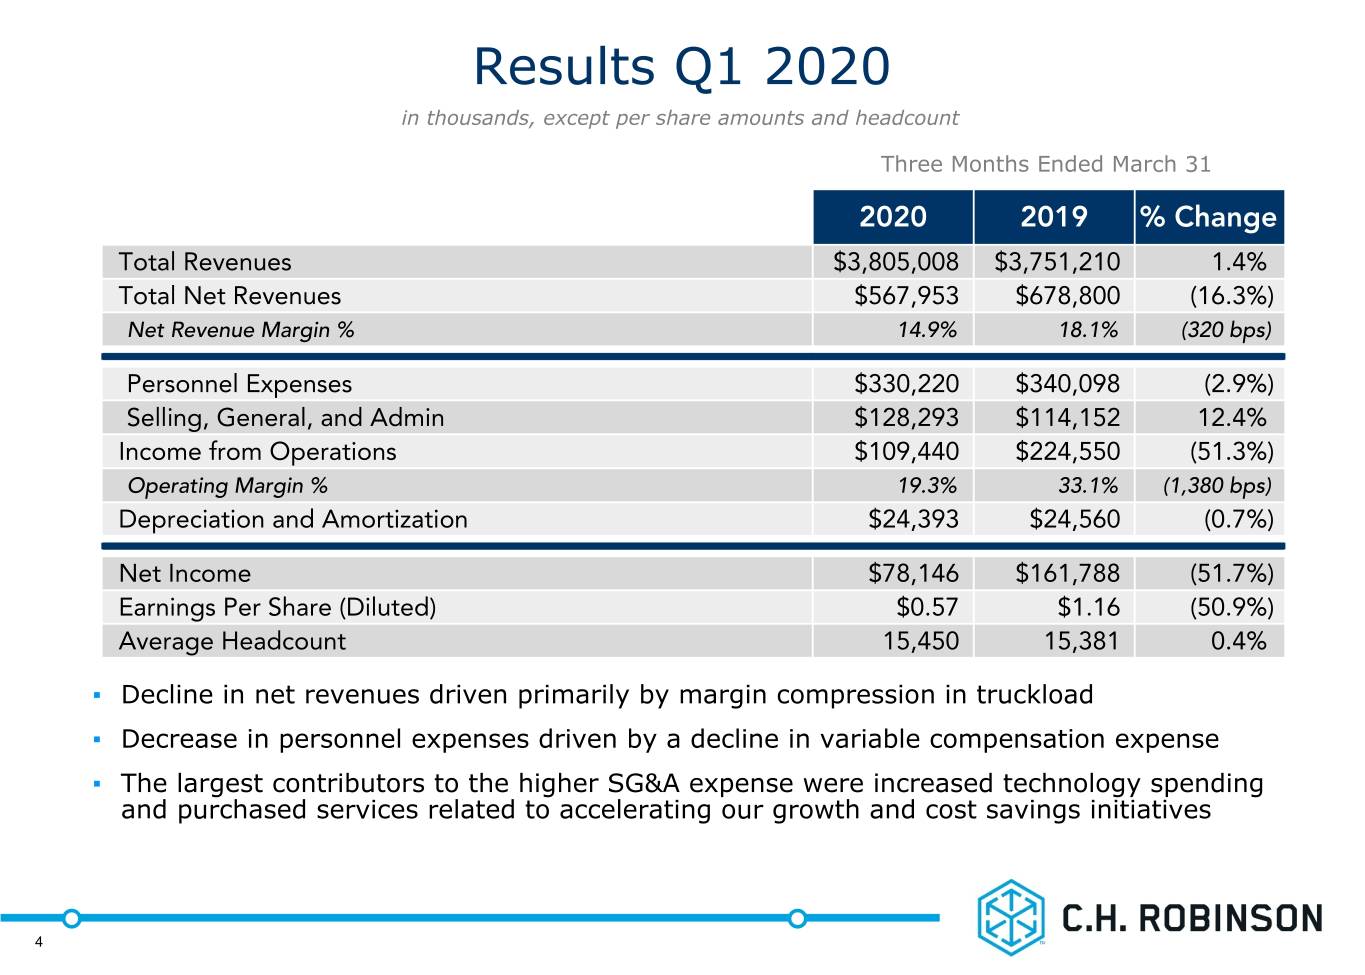
•Total revenues increased 1.4 percent to $3.8 billion, driven primarily by higher volume in truckload and less than truckload (“LTL”), mostly offset by lower pricing in truckload.
•Net revenues decreased 16.3 percent to $568.0 million, primarily driven by lower margin in truckload services.
•Operating expenses increased 0.9 percent to $458.5 million. Personnel expenses decreased 2.9 percent to $330.2 million, driven primarily by declines in performance-based compensation. Average headcount increased 0.4 percent, with acquisitions contributing approximately 2.0 percentage points of growth. Selling, general and administrative (“SG&A”) expenses increased 12.4 percent to $128.3 million. The largest contributors to the higher SG&A expense increase were increased technology spending and purchased services related to accelerating our growth and cost savings initiatives.
•Income from operations totaled $109.4 million, down 51.3 percent from last year due to declining net revenues and increased SG&A expenses. Operating margin of 19.3 percent declined 1,380 basis points.
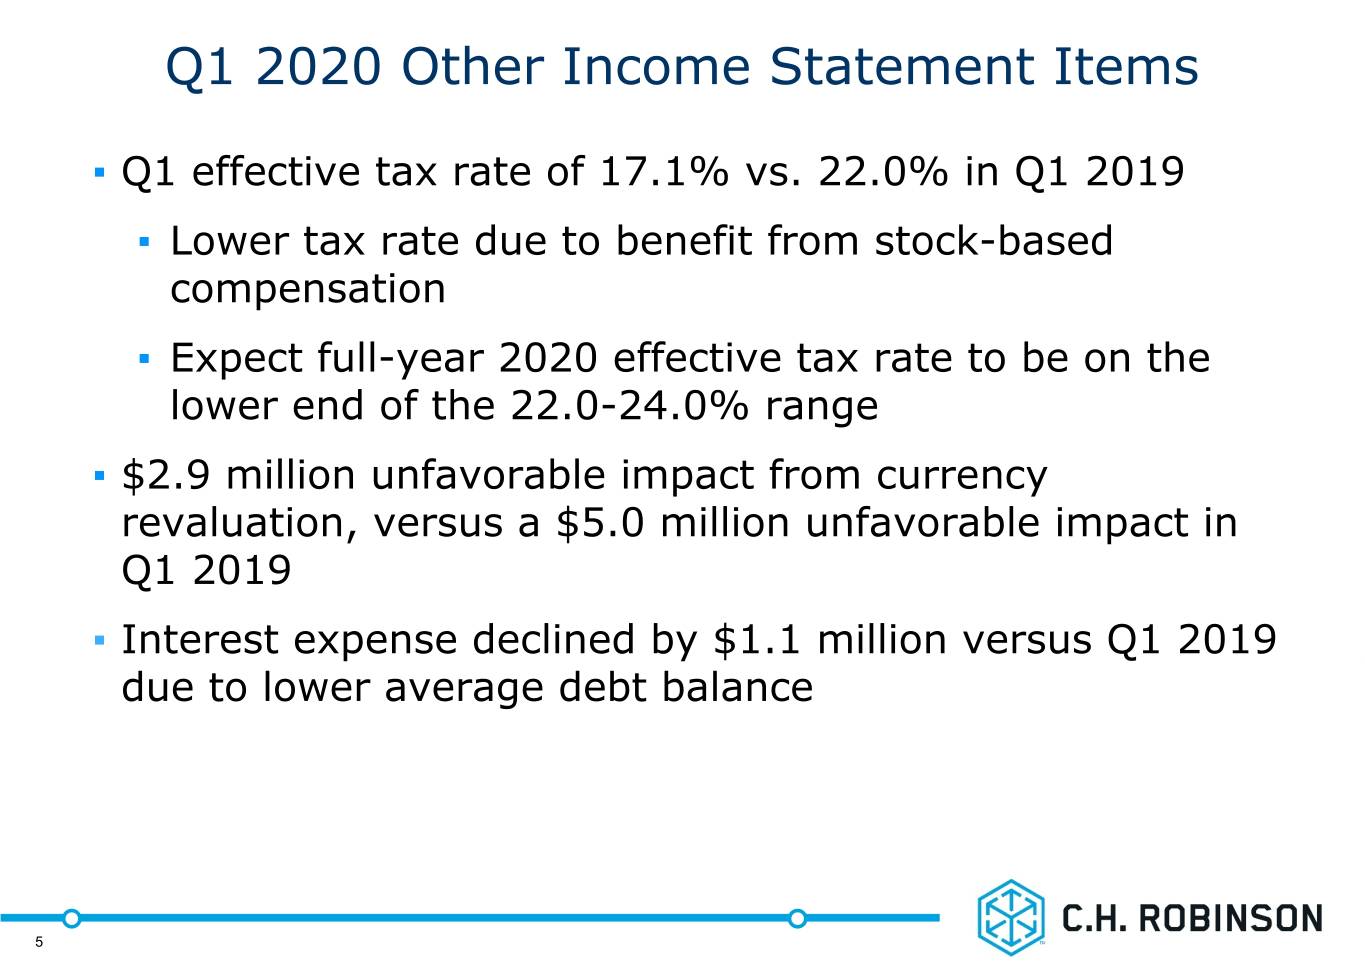
•Interest and other expenses totaled $15.2 million, which primarily consists of interest expense. Interest expense decreased by $1.1 million versus last year. The first quarter also included a $2.9 million unfavorable impact from currency revaluation.
•The effective tax rate in the quarter was 17.1 percent compared to 22.0 percent last year. The lower effective tax rate was due primarily to the tax benefit related to stock-based compensation.
•Net income totaled $78.1 million, down 51.7 percent from a year ago. Diluted EPS of $0.57 decreased 50.9 percent.
North American Surface Transportation Results
Summarized financial results of our NAST segment are as follows (dollars in thousands):
| | | | | | | | | | | | | | | | | | | | | | | |
| | | | | | | Three Months Ended March 31, | | | | |
| | | | | | | 2020 | | 2019 | | % change |
| Total revenues | | | | | | | $ | 2,823,745 | | | $ | 2,796,784 | | | 1.0 | % |
| Net revenues | | | | | | | 372,778 | | | 486,550 | | | (23.4) | % |
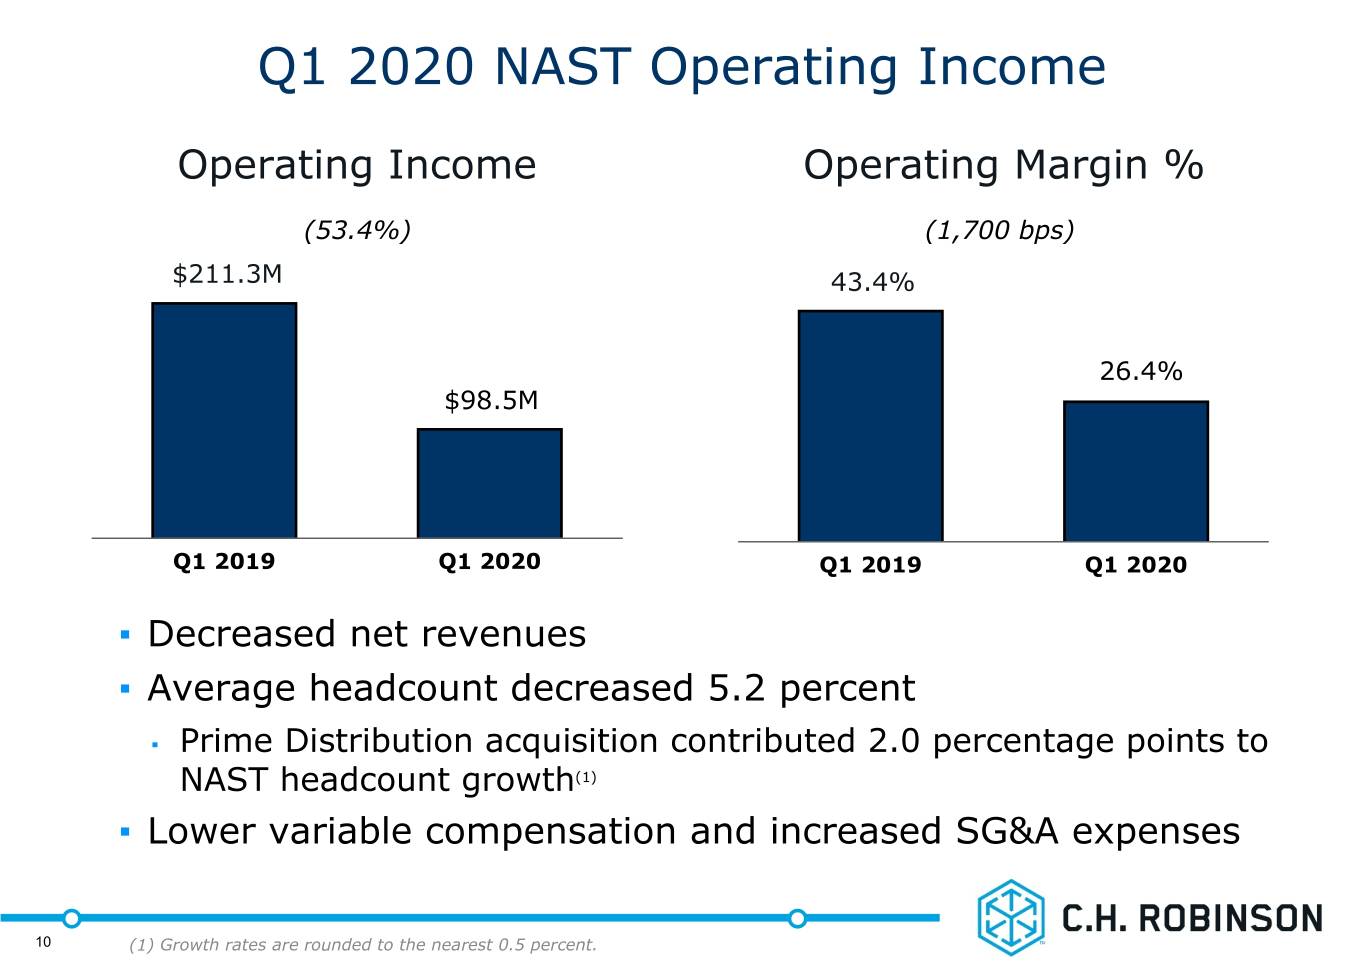
| Income from operations | | | | | | | 98,526 | | | 211,283 | | | (53.4) | % |
| | | | | | | | | | | |
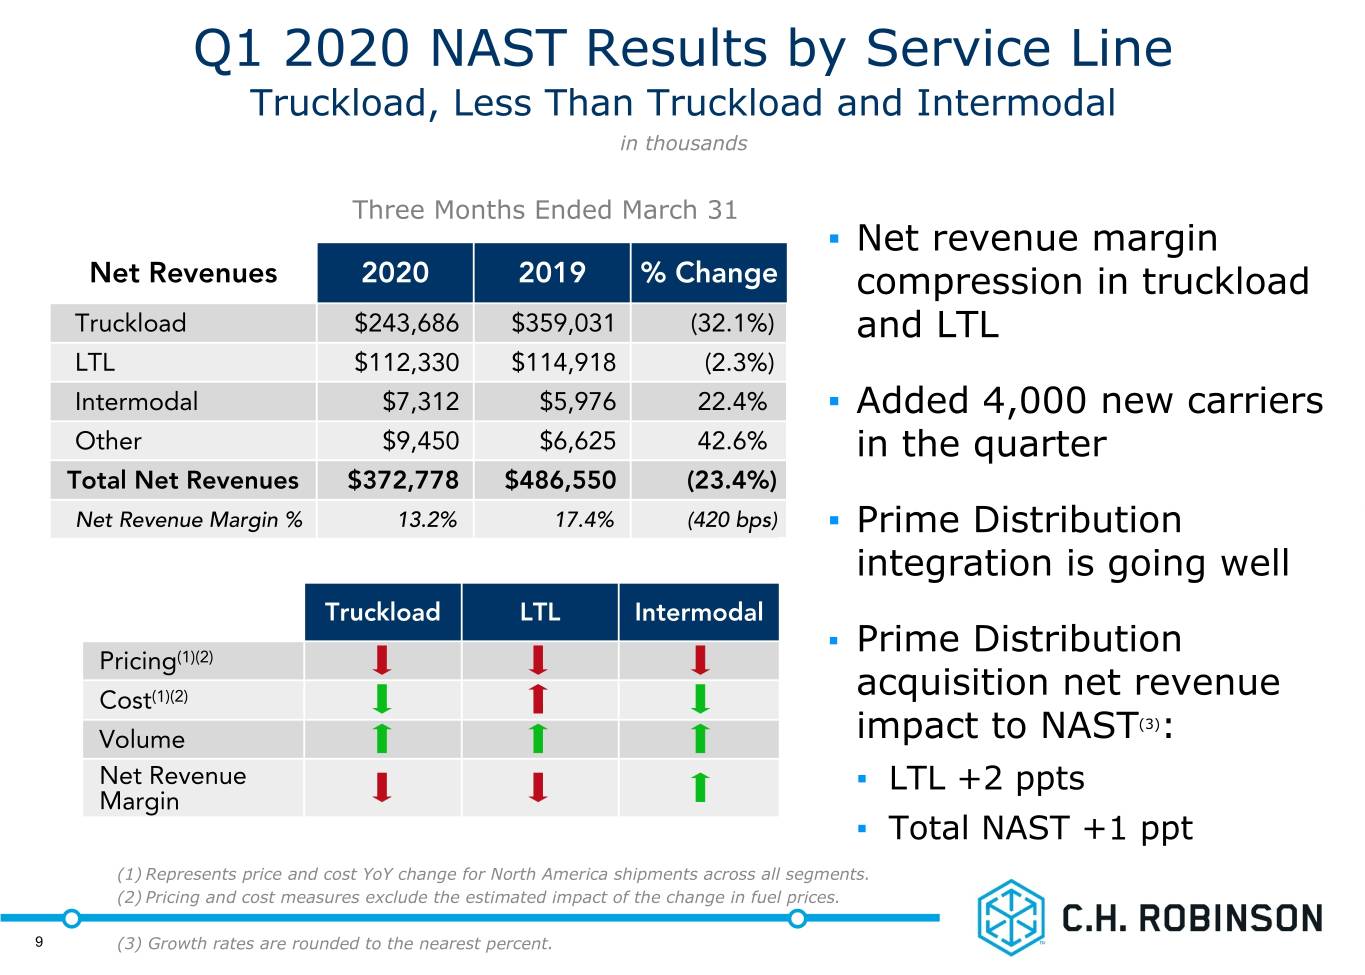
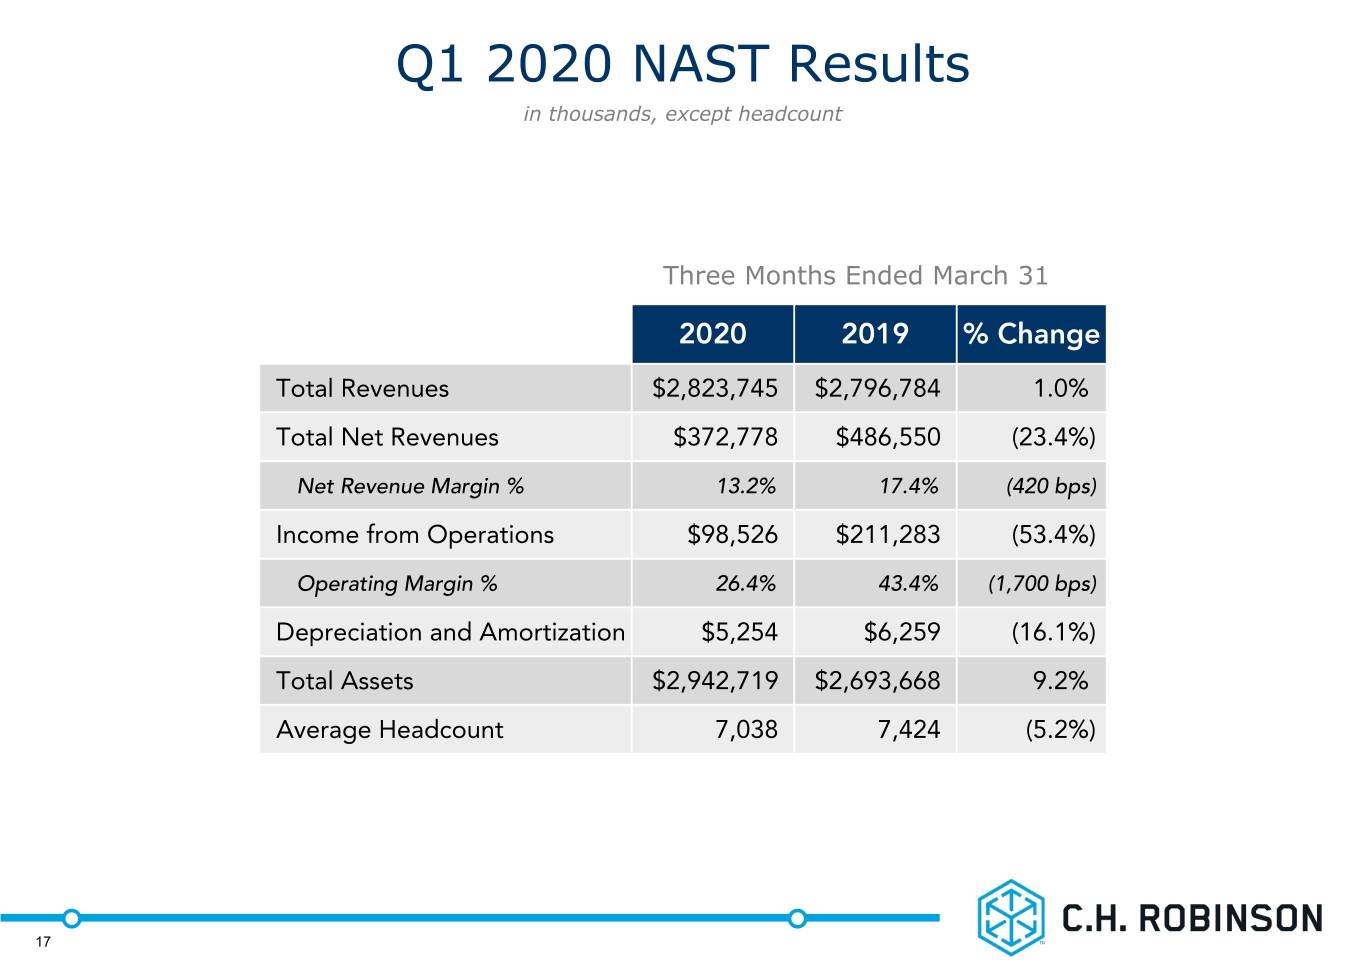
First quarter total revenues for C.H. Robinson's NAST segment totaled $2.8 billion, an increase of 1.0 percent over the prior year, primarily driven by increased truckload and LTL volumes. NAST net revenues decreased 23.4 percent in the quarter to $372.8 million, with the March 2020 acquisition of Prime Distribution Services (“Prime”) contributing 1.0 percentage point of net revenue growth in the quarter. Net revenues in truckload decreased 32.1 percent, less than truckload net revenues decreased 2.3 percent, and
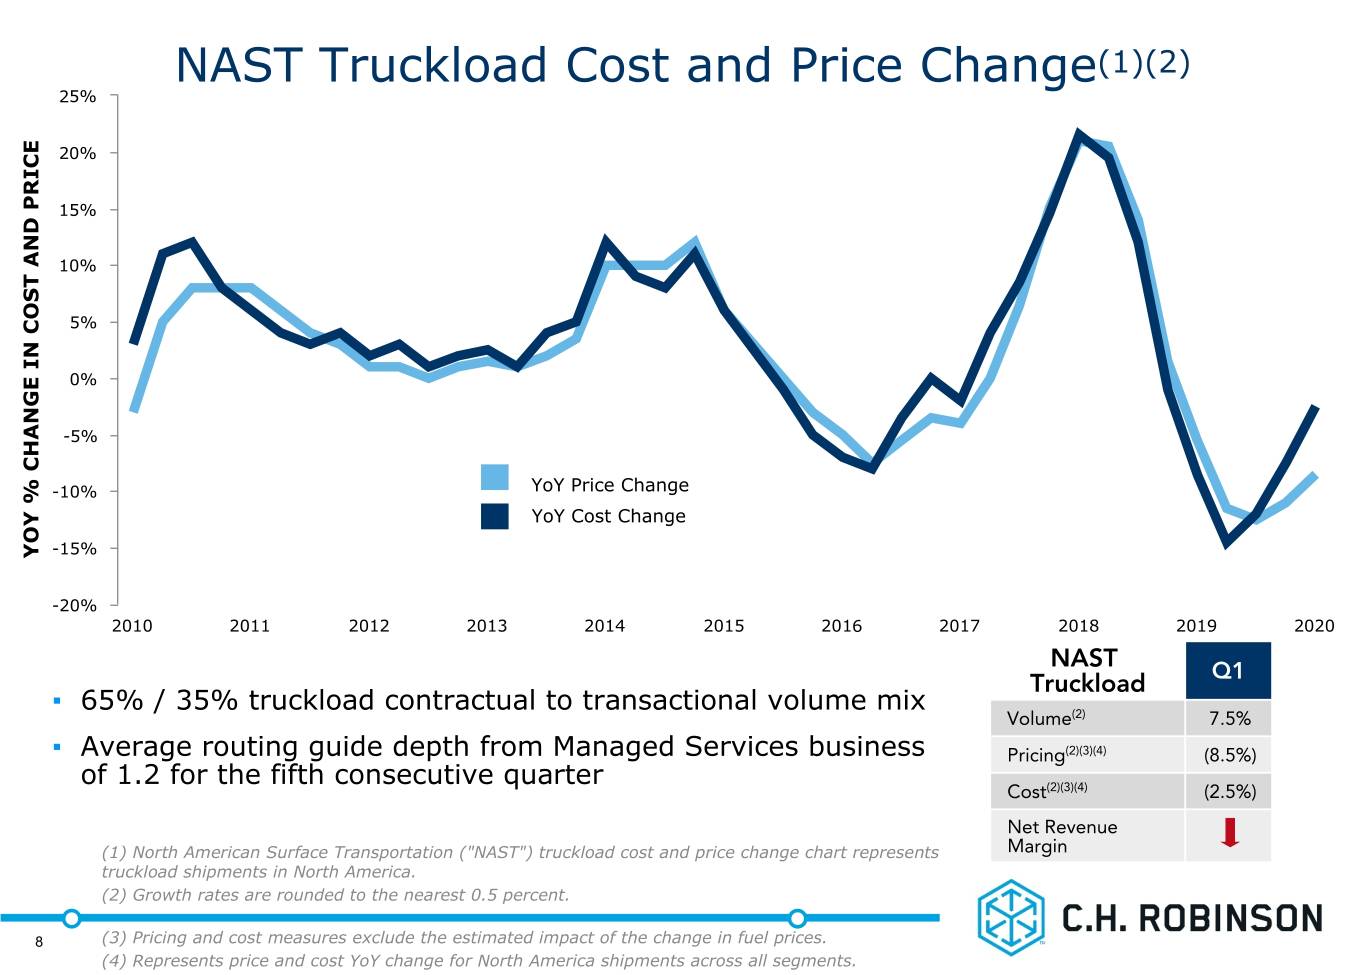
intermodal net revenues increased 22.4 percent versus the year-ago period. Excluding the impact of the change in fuel prices, average North America truckload rate per mile charged to customers decreased approximately 8.5 percent in the quarter, while truckload transportation cost per mile decreased approximately 2.5 percent. Truckload volume increased 7.5 percent in the quarter, and LTL volumes grew 7.5 percent, both representing market share gains in the quarter. Intermodal volumes grew 8 percent versus the prior year. Operating expenses decreased 0.4 percent due to decreased personnel expenses, mostly offset by increased SG&A expenses. Income from operations decreased 53.4 percent to $98.5 million, and operating margin declined 1,700 basis points to 26.4 percent. NAST average headcount was down 5.2 percent in the quarter, with Prime contributing 2.0 percentage points of growth.
Global Forwarding Results
Summarized financial results of our Global Forwarding segment are as follows (dollars in thousands):
| | | | | | | | | | | | | | | | | | | | | | | |
| | | | | | | Three Months Ended March 31, | | | | |
| | | | | | | 2020 | | 2019 | | % change |
| Total revenues | | | | | | | $ | 530,384 | | | $ | 537,567 | | | (1.3) | % |
| Net revenues | | | | | | | 128,314 | | | 127,236 | | | 0.8 | % |
| Income from operations | | | | | | | 11,959 | | | 14,203 | | | (15.8) | % |
| | | | | | | | | | | |
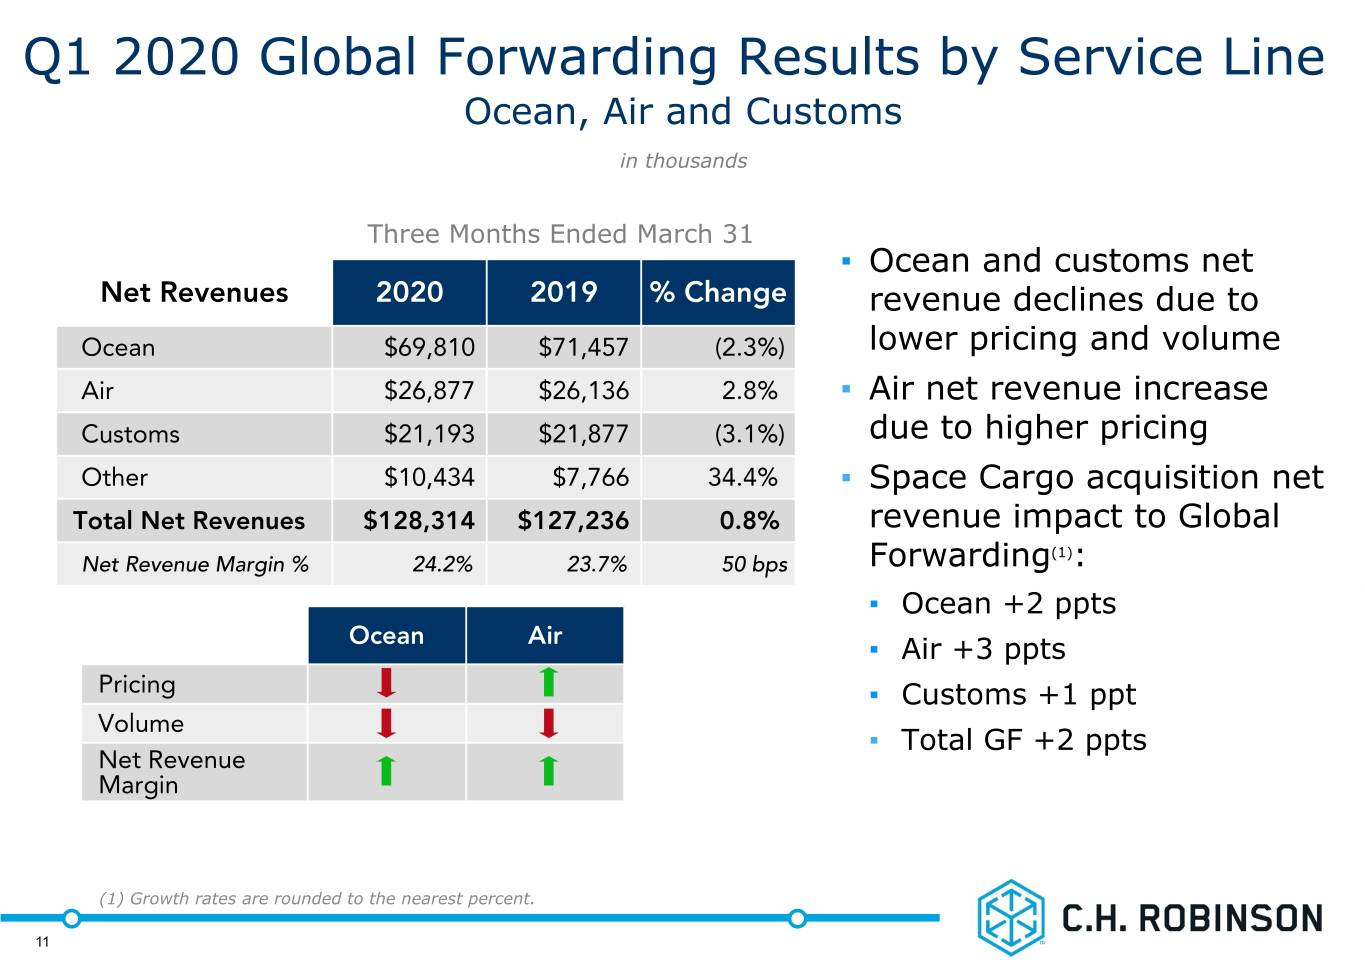
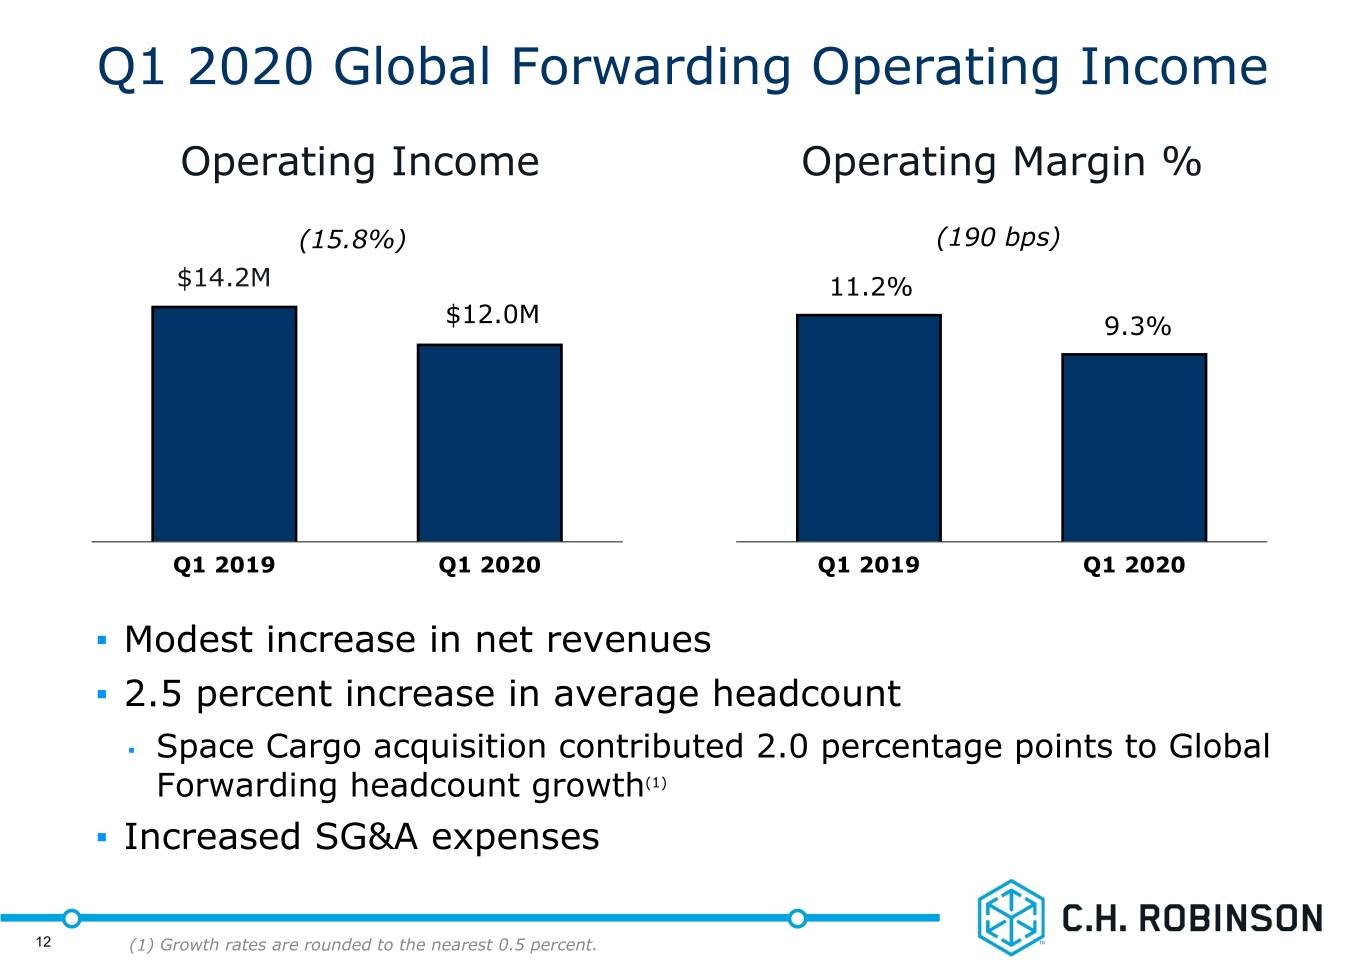
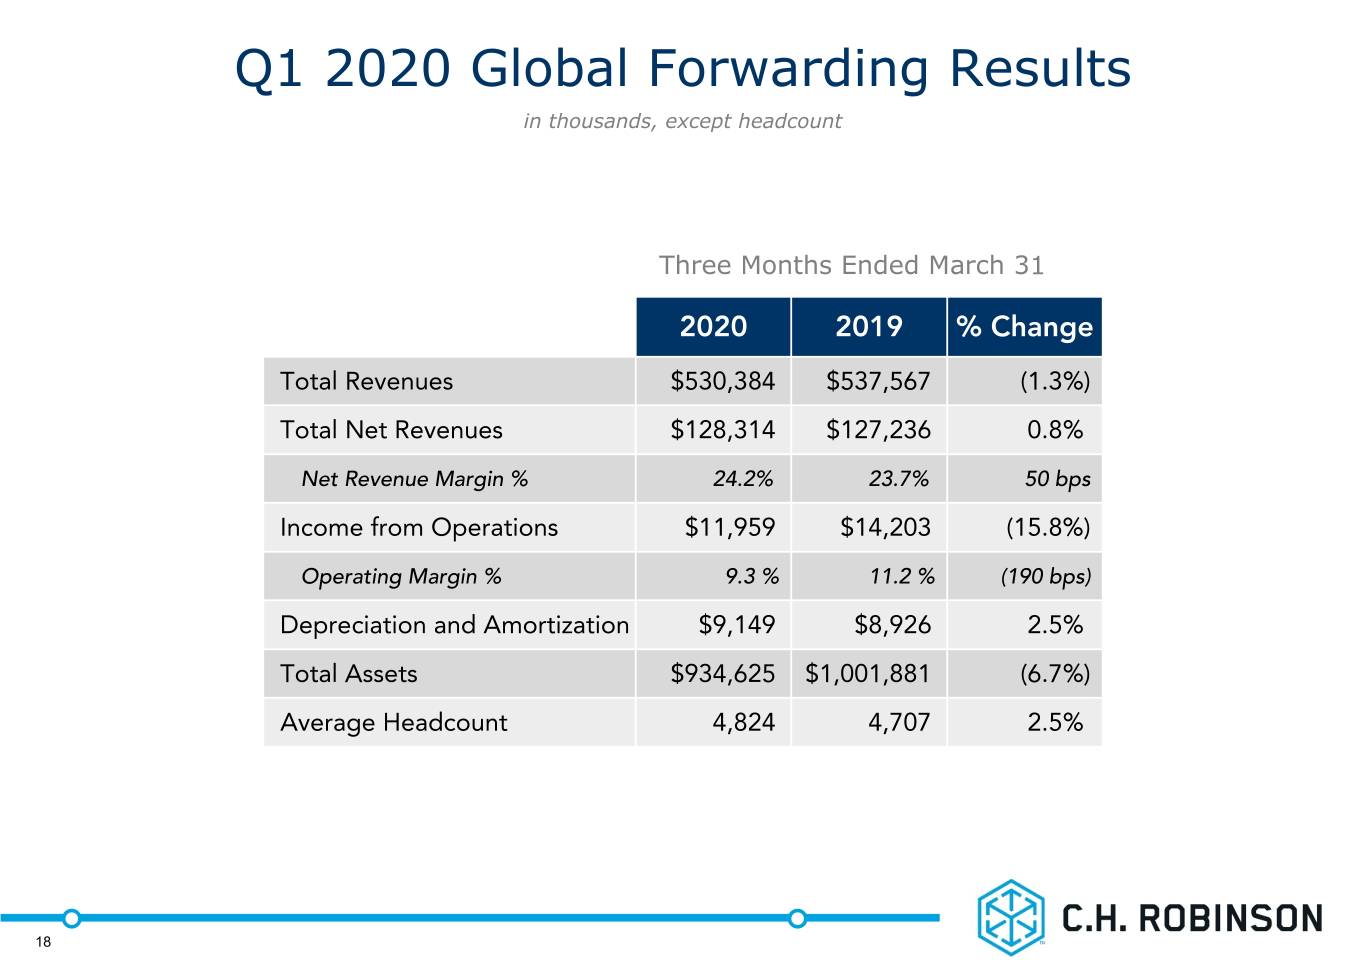
First quarter total revenues for the Global Forwarding segment decreased 1.3 percent to $530.4 million, primarily driven by lower volumes in ocean and air. Net revenues increased 0.8 percent in the quarter to $128.3 million, with the 2019 acquisition of The Space Cargo Group (“Space Cargo”) contributing 2 percentage points of net revenue growth. Ocean net revenues decreased 2.3 percent driven primarily by a 3.0 percent decline in volumes. Net revenues in air increased 2.8 percent driven by higher pricing, partially offset by an 8.0 percent decline in shipments. Customs net revenues decreased 3.1 percent, primarily driven by a 2.5 percent reduction in transaction volume. Operating expenses increased 2.9 percent, primarily driven by increased SG&A expenses. First quarter average headcount increased 2.5 percent, with Space Cargo contributing 2.0 percentage points to the growth. Income from operations decreased 15.8 percent to $12.0 million, and operating margin declined 190 basis points to 9.3 percent in the quarter.
All Other and Corporate Results
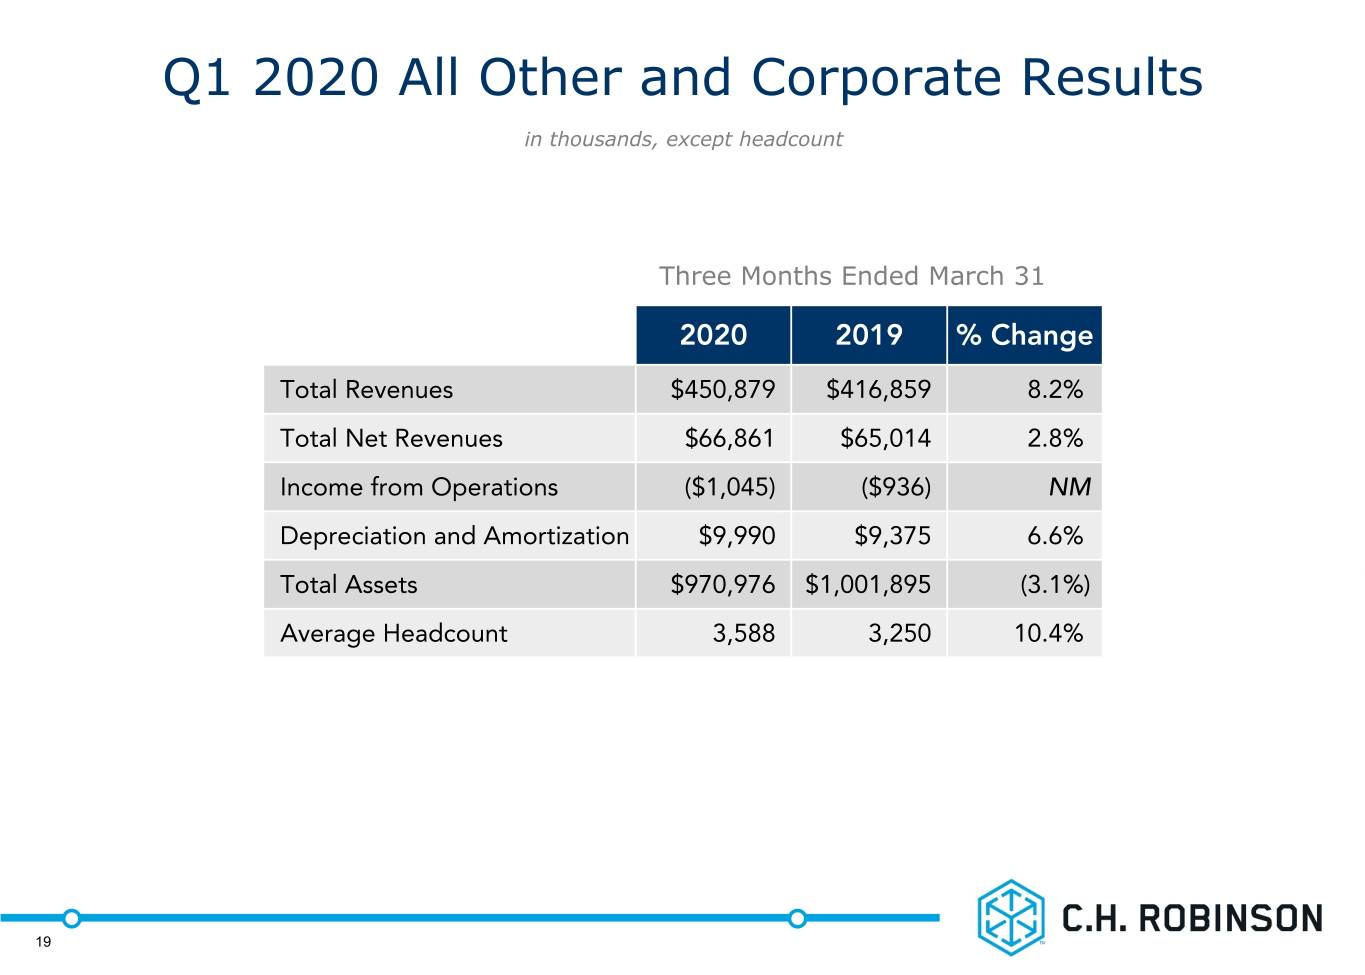
Total revenues and net revenues for Robinson Fresh, Managed Services and Other Surface Transportation are summarized as follows (dollars in thousands):
| | | | | | | | | | | | | | | | | | | | | | | |
| | | | | | | Three Months Ended March 31, | | | | |
| | | | | | | 2020 | | 2019 | | % change |
| Total revenues | | | | | | | $ | 450,879 | | | $ | 416,859 | | | 8.2 | % |
| Net revenues: | | | | | | | | | | | |
| Robinson Fresh | | | | | | | 27,458 | | | 28,658 | | | (4.2) | % |
| Managed Services | | | | | | | 22,527 | | | 20,312 | | | 10.9 | % |
| Other Surface Transportation | | | | | | | 16,876 | | | 16,044 | | | 5.2 | % |
| | | | | | | | | | | |
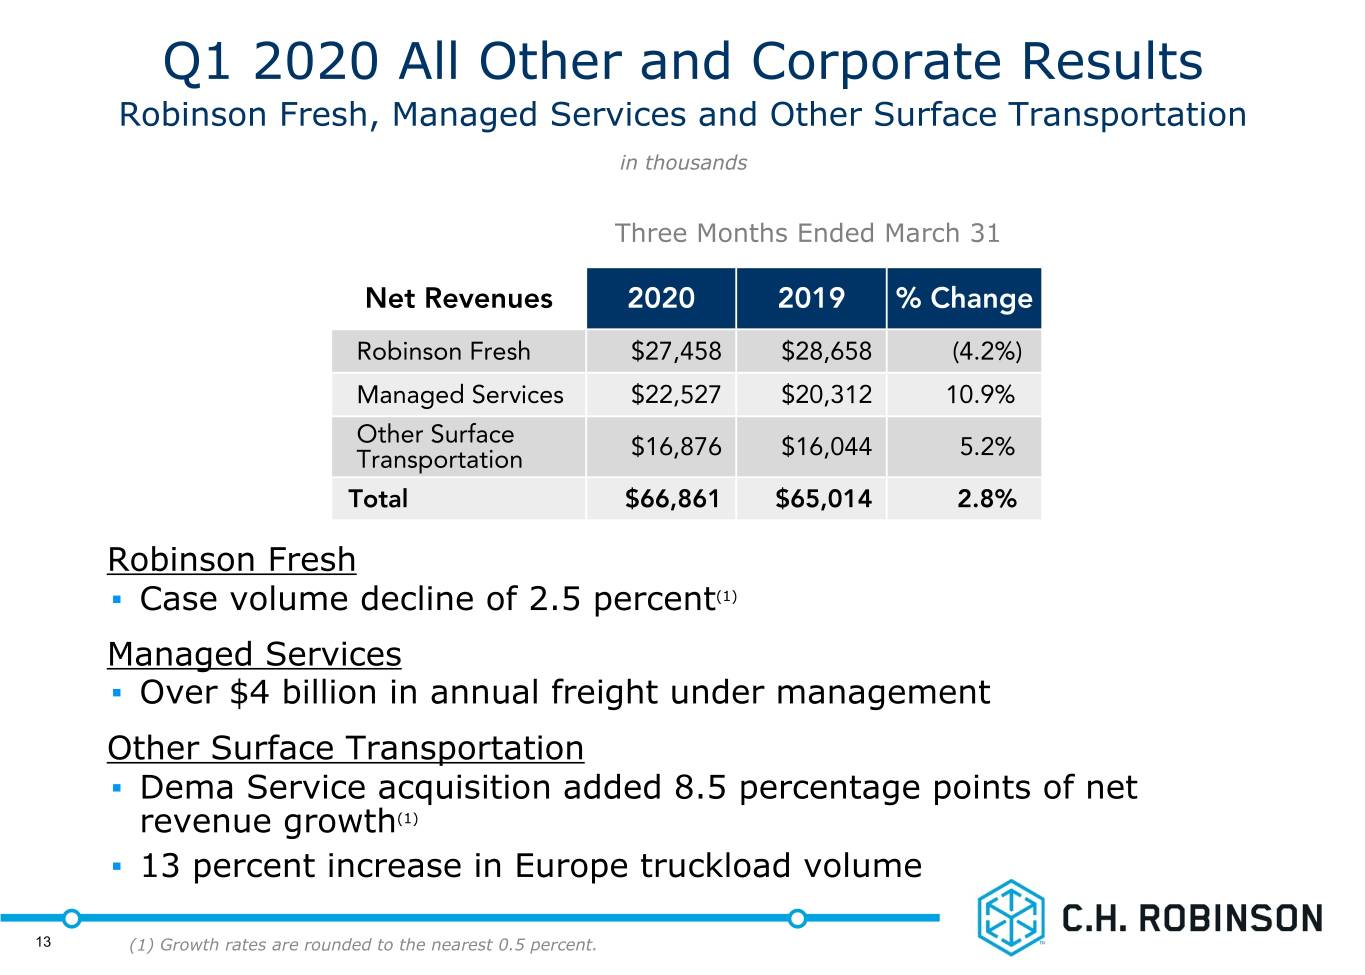
First quarter Robinson Fresh net revenues decreased 4.2 percent to $27.5 million, primarily due to a 2.5 percent decrease in case volume and a decline in margin. Managed Services net revenues increased 10.9 percent in the quarter. Other Surface Transportation net revenues increased 5.2 percent to $16.9 million, with the 2019 acquisition of Dema Service contributing 8.5 percentage points of net revenue growth. Europe truckload volume was up 13 percent in the quarter.
Other Income Statement Items
The first quarter effective tax rate was 17.1 percent, down from 22.0 percent last year. The lower effective tax rate was due primarily to the tax benefit related to stock-based compensation. We expect our 2020 full-year effective tax rate to be on the lower end of the 22 to 24 percent range that we provided in late January.
Interest and other expenses totaled $15.2 million, which primarily consists of interest expense. Interest expense decreased by $1.1 million versus last year driven by a lower average debt balance. The first quarter also included a $2.9 million unfavorable impact from currency revaluation.
Diluted weighted average shares outstanding in the quarter were down 2.1 percent due primarily to share repurchases.
Cash Flow Generation and Capital Distribution
Cash from operations totaled $58.5 million in the first quarter, down 77.2 percent versus the prior year, due to unfavorable changes in working capital and decreased earnings.
In the first quarter, $152.2 million was returned to shareholders, with $69.9 million in cash dividends and $82.4 million in share repurchases.
Capital expenditures totaled $14.7 million in the quarter. We continue to expect full-year 2020 capital expenditures to be between $60 and $70 million, with the majority dedicated to technology.
Outlook
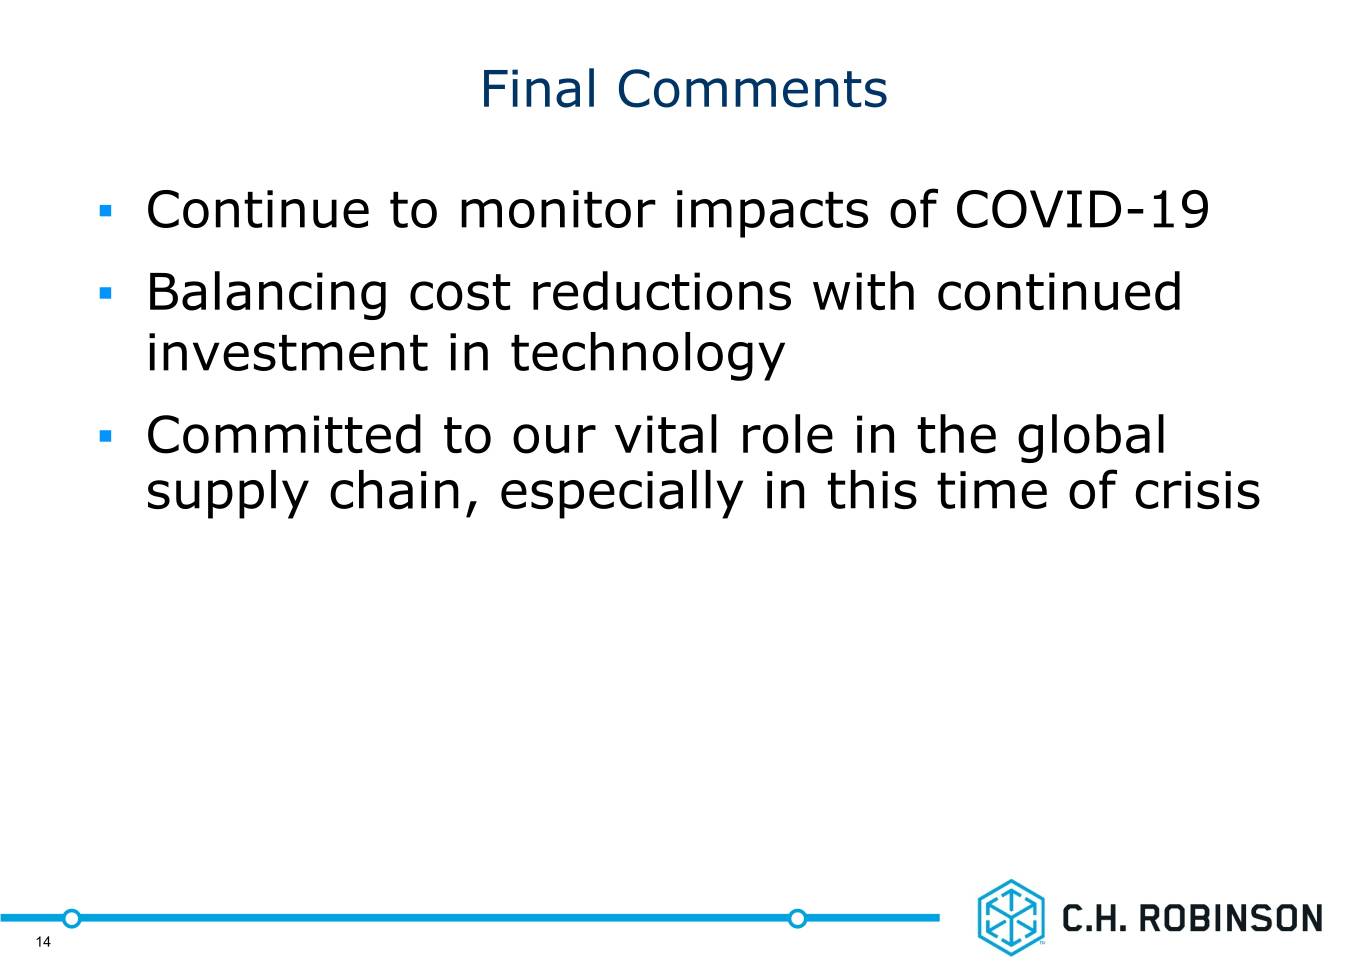
“While the situation remains fluid, one thing is certain: we are committed to our vital role in the global supply chain by delivering critical and essential goods and services – especially in this time of crisis. We will continue to make measured and thoughtful decisions that are in the best interest of our employees, customers, contract carriers, our company and the communities where we live and work while remaining true to the values and pillars that guide all of our business decisions,” Biesterfeld stated.
About C.H. Robinson
C.H. Robinson solves logistics problems for companies across the globe and across industries, from the simple to the most complex. With nearly $20 billion in freight under management and 18 million shipments annually, we are one of the world’s largest logistics platforms. Our global suite of services accelerates trade to seamlessly deliver the products and goods that drive the world’s economy. With the combination of our multimodal transportation management system and expertise, we use our information advantage to deliver smarter solutions for our more than 119,000 customers and 78,000 contract carriers. Our technology is built by and for supply chain experts to bring faster, more meaningful improvements to our customers’ businesses. As a responsible global citizen, we are also proud to contribute millions of dollars to support causes that matter to our company, our Foundation and our employees. For more information, visit us at www.chrobinson.com (Nasdaq: CHRW).
Except for the historical information contained herein, the matters set forth in this release are forward-looking statements that represent our expectations, beliefs, intentions or strategies concerning future events. These forward-looking statements are subject to certain risks and uncertainties that could cause actual results to differ materially from our historical experience or our present expectations, including, but not limited to, such factors such as changes in economic conditions, including uncertain consumer demand; changes in market demand and pressures on the pricing for our services; competition and growth rates within the third party logistics industry; freight levels and increasing costs and availability of truck capacity or alternative means of transporting freight; changes in relationships with existing contracted truck, rail, ocean, and air carriers; changes in our customer base due to possible consolidation among our customers; our ability to successfully integrate the operations of acquired companies with our historic operations; risks associated with litigation, including contingent auto liability and insurance coverage; risks associated with operations outside of the United States; risks associated with the potential impact of changes in government regulations; risks associated with the produce industry, including food safety and contamination issues; fuel price increases or decreases, or fuel shortages; cyber-security related risks; the impact of war on the economy; changes to our capital structure; risks related to the elimination of LIBOR; changes due to catastrophic events including pandemics such as COVID-19; and other risks and uncertainties detailed in our Annual and Quarterly Reports.
Any forward-looking statement speaks only as of the date on which such statement is made, and we undertake no obligation to update such statement to reflect events or circumstances arising after such date. All remarks made during our financial results conference call will be current at the time of the call, and we undertake no obligation to update the replay.
Conference Call Information:
C.H. Robinson Worldwide First Quarter 2020 Earnings Conference Call
Wednesday, April 29, 2020; 8:30 a.m. Eastern Time
Presentation slides and a simultaneous live audio webcast of the conference call may be accessed through the Investor Relations link on C.H. Robinson’s website at www.chrobinson.com.
To participate in the conference call by telephone, please call ten minutes early by dialing: 877-269-7756
International callers dial +1-201-689-7817
We invite call participants to submit questions in advance of the conference call, and we will respond to as many of the questions as we can in the time allowed. To submit your question(s) in advance of the call, please email [email protected].
Summarized Financial Results
($ in thousands, except per share data)
This table of summary results presents our service line net revenues consistent with our historical presentation and is on an enterprise basis. The service line net revenues in the table differ from the service line net revenues discussed within the segments as our segments have revenues from multiple service lines.
| | | | | | | | | | | | | | | | | | | | | | | |
| | | | | | | Three Months Ended March 31, | | | | |
| | | | | | | 2020 | | 2019 | | % change |
| Total revenues | | | | | | | $ | 3,805,008 | | | $ | 3,751,210 | | | 1.4 | % |
| Net revenues: | | | | | | | | | | | |
| Transportation | | | | | | | | | | | |
| Truckload | | | | | | | $ | 264,926 | | | $ | 377,993 | | | (29.9) | % |
| LTL | | | | | | | 113,909 | | | 116,229 | | | (2.0) | % |
| Intermodal | | | | | | | 7,553 | | | 6,076 | | | 24.3 | % |
| Ocean | | | | | | | 69,902 | | | 71,533 | | | (2.3) | % |
| Air | | | | | | | 28,338 | | | 27,582 | | | 2.7 | % |
| Customs | | | | | | | 21,193 | | | 21,878 | | | (3.1) | % |
| Other logistics services | | | | | | | 36,184 | | | 30,385 | | | 19.1 | % |
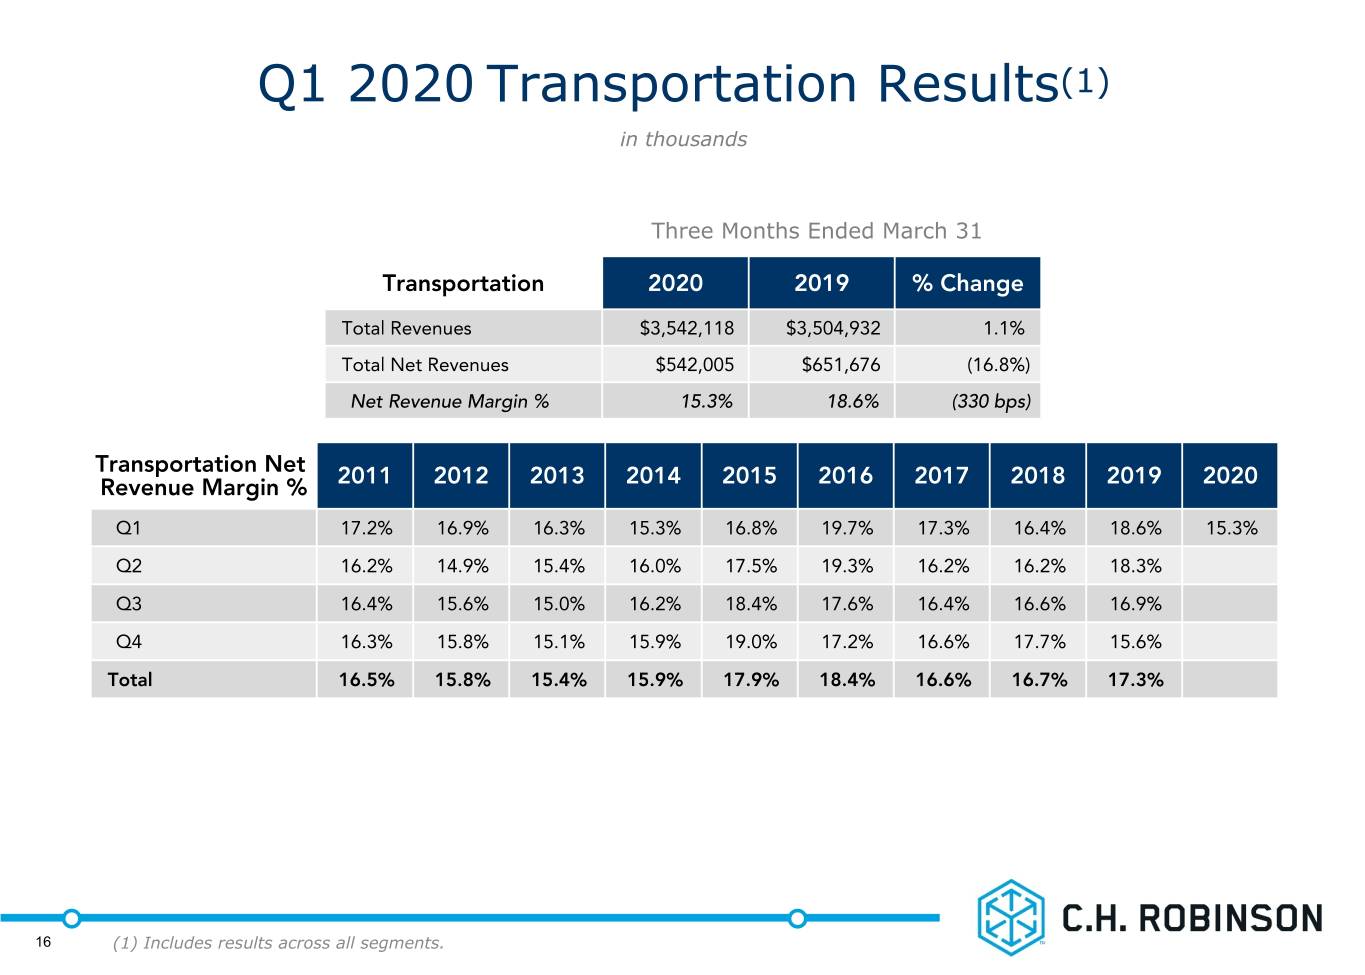
| Total transportation | | | | | | | 542,005 | | | 651,676 | | | (16.8) | % |
| Sourcing | | | | | | | 25,948 | | | 27,124 | | | (4.3) | % |
| Total net revenues | | | | | | | 567,953 | | | 678,800 | | | (16.3) | % |
| | | | | | | | | | | |
| Operating expenses | | | | | | | 458,513 | | | 454,250 | | | 0.9 | % |
| Income from operations | | | | | | | 109,440 | | | 224,550 | | | (51.3) | % |
| Net income | | | | | | | $ | 78,146 | | | $ | 161,788 | | | (51.7) | % |
| Diluted EPS | | | | | | | $ | 0.57 | | | $ | 1.16 | | | (50.9) | % |
Our total revenues represent the total dollar value of services and goods we sell to our customers. Net revenues are a non-GAAP financial measure calculated as total revenues less the cost of purchased transportation and related services and the cost of purchased products sourced for resale. We believe net revenues are a useful measure of our ability to source, add value, and sell services and products that are provided by third parties, and we consider net revenues to be our primary performance measurement. Accordingly, the discussion of our results of operations often focuses on the changes in our net revenues. The reconciliation of total revenues to net revenues is presented below (in thousands):
| | | | | | | | | | | | | | | |
| | | | | | Three Months Ended March 31, | | |
| | | | | 2020 | | 2019 |
| Revenues: | | | | | | | |
| Transportation | | | | | $ | 3,542,118 | | | $ | 3,504,932 | |
| Sourcing | | | | | 262,890 | | | 246,278 | |
| Total revenues | | | | | 3,805,008 | | | 3,751,210 | |
| Costs and expenses: | | | | | | | |
| Purchased transportation and related services | | | | | 3,000,113 | | | 2,853,256 | |
| Purchased products sourced for resale | | | | | 236,942 | | | 219,154 | |
| Total costs and expenses | | | | | 3,237,055 | | | 3,072,410 | |
| Net revenues | | | | | $ | 567,953 | | | $ | 678,800 | |
Condensed Consolidated Statements of Income
(unaudited, in thousands, except per share data)
| | | | | | | | | | | | | | | |
| | | | | Three Months Ended March 31, | | |
| | | | | | | |
| | | | | 2020 | | 2019 |
| | | | | | | |
| Revenues: | | | | | | | |
| Transportation | | | | | $ | 3,542,118 | | | $ | 3,504,932 | |
| Sourcing | | | | | 262,890 | | | 246,278 | |
| Total revenues | | | | | 3,805,008 | | | 3,751,210 | |
| Costs and expenses: | | | | | | | |
| Purchased transportation and related services | | | | | 3,000,113 | | | 2,853,256 | |
| Purchased products sourced for resale | | | | | 236,942 | | | 219,154 | |
| Personnel expenses | | | | | 330,220 | | | 340,098 | |
| Other selling, general, and administrative expenses | | | | | 128,293 | | | 114,152 | |
| Total costs and expenses | | | | | 3,695,568 | | | 3,526,660 | |
| Income from operations | | | | | 109,440 | | | 224,550 | |
| Interest and other expense | | | | | (15,228) | | | (17,140) | |
| Income before provision for income taxes | | | | | 94,212 | | | 207,410 | |
| Provision for income taxes | | | | | 16,066 | | | 45,622 | |
| Net income | | | | | $ | 78,146 | | | $ | 161,788 | |
| | | | | | | |
| Net income per share (basic) | | | | | $ | 0.58 | | | $ | 1.17 | |
| Net income per share (diluted) | | | | | $ | 0.57 | | | $ | 1.16 | |
| | | | | | | |
| Weighted average shares outstanding (basic) | | | | | 135,474 | | | 137,854 | |
| Weighted average shares outstanding (diluted) | | | | | 135,969 | | | 138,955 | |
Business Segment Information
(unaudited, dollars in thousands)
| | | | | | | | | | | | | | | | | | | | | | | | | | | | | |
| | NAST | | Global Forwarding | | | All Other and Corporate | | | | Consolidated |
| Three Months Ended March 31, 2020 | | | | | | | | | | | |
| Total revenues | | $ | 2,823,745 | | | $ | 530,384 | | | | $ | 450,879 | | | | | $ | 3,805,008 | |
| | | | | | | | | | | |
| | | | | | | | | | | |
| Net revenues | | 372,778 | | | 128,314 | | | | 66,861 | | | | | 567,953 | |
| Income (loss) from operations | | 98,526 | | | 11,959 | | | | (1,045) | | | | | 109,440 | |
| Depreciation and amortization | | 5,254 | | | 9,149 | | | | 9,990 | | | | | 24,393 | |
Total assets (1) | | 2,942,719 | | | 934,625 | | | | 970,976 | | | | | 4,848,320 | |
| Average headcount | | 7,038 | | | 4,824 | | | | 3,588 | | | | | 15,450 | |
| | | | | | | | | | | |
| | NAST | | Global Forwarding | | | All Other and Corporate | | | | Consolidated |
| Three Months Ended March 31, 2019 | | | | | | | | | | | |
| Total revenues | | $ | 2,796,784 | | | $ | 537,567 | | | | $ | 416,859 | | | | | $ | 3,751,210 | |
| | | | | | | | | | | |
| | | | | | | | | | | |
| Net revenues | | 486,550 | | | 127,236 | | | | 65,014 | | | | | 678,800 | |
| Income (loss) from operations | | 211,283 | | | 14,203 | | | | (936) | | | | | 224,550 | |
| Depreciation and amortization | | 6,259 | | | 8,926 | | | | 9,375 | | | | | 24,560 | |
Total assets (1) | | 2,693,668 | | | 1,001,881 | | | | 1,001,895 | | | | | 4,697,444 | |
| Average headcount | | 7,424 | | | 4,707 | | | | 3,250 | | | | | 15,381 | |
____________________________________________
(1) All cash and cash equivalents are included in All Other and Corporate.
Condensed Consolidated Balance Sheets
(unaudited, in thousands)
| | | | | | | | | | | |
| March 31, 2020 | | December 31, 2019 |
| Assets | | | |
| Current assets: | | | |
| Cash and cash equivalents | $ | 294,572 | | | $ | 447,858 | |
| Receivables, net of allowance for credit loss | 2,092,613 | | | 1,974,381 | |
| Contract assets, net of allowance for credit loss | 123,558 | | | 132,874 | |
| Prepaid expenses and other | 95,896 | | | 85,005 | |
| Total current assets | 2,606,639 | | | 2,640,118 | |
| | | | |
| Property and equipment, net | 211,799 | | | 208,423 | |
| Right-of-use lease assets | 345,908 | | | 310,860 | |
| Intangible and other assets | 1,683,974 | | | 1,481,659 | |
| Total assets | $ | 4,848,320 | | | $ | 4,641,060 | |
| | | |
| Liabilities and stockholders’ investment | | | |
| Current liabilities: | | | |
| Accounts payable and outstanding checks | $ | 1,150,554 | | | $ | 1,062,835 | |
| Accrued expenses: | | | |
| Compensation | 88,528 | | | 112,784 | |
| Transportation expense | 93,900 | | | 101,194 | |
| Income taxes | 14,473 | | | 12,354 | |
| Other accrued liabilities | 65,930 | | | 62,706 | |
| Current lease liabilities | 70,423 | | | 61,280 | |
| Current portion of debt | 320,917 | | | 142,885 | |
| Total current liabilities | 1,804,725 | | | 1,556,038 | |
| | | |
| Long-term debt | 1,092,660 | | | 1,092,448 | |
| Noncurrent lease liabilities | 286,210 | | | 259,444 | |
| Noncurrent income taxes payable | 21,576 | | | 22,354 | |
| Deferred tax liabilities | 55,766 | | | 39,776 | |
| Other long-term liabilities | 265 | | | 270 | |
| Total liabilities | 3,261,202 | | | 2,970,330 | |
| | | |
| Total stockholders’ investment | 1,587,118 | | | 1,670,730 | |
| Total liabilities and stockholders’ investment | $ | 4,848,320 | | | $ | 4,641,060 | |
Condensed Consolidated Statements of Cash Flow
(unaudited, in thousands, except operational data)
| | | | | | | | | | | |
| Three Months Ended March 31, | | |
| 2020 | | 2019 |
| Operating activities: | | | |
| Net income | $ | 78,146 | | | $ | 161,788 | |
| Adjustments to reconcile net income to net cash provided by operating activities: | | | |
| Depreciation and amortization | 24,393 | | | 24,560 | |
| Provision for credit losses | 5,675 | | | 1,774 | |
| Stock-based compensation | 11,397 | | | 17,123 | |
| Deferred income taxes | 1,622 | | | (364) | |
| Excess tax benefit on stock-based compensation | (3,737) | | | (4,458) | |
| Other operating activities | 788 | | | 576 | |
| Changes in operating elements, net of acquisitions: | | | |
| Receivables | (133,142) | | | 117,720 | |
| Contract assets | 8,713 | | | (5,921) | |
| Prepaid expenses and other | (11,038) | | | (6,367) | |
| Accounts payable and outstanding checks | 98,946 | | | (10,742) | |
| Accrued compensation | (23,879) | | | (87,259) | |
| Accrued transportation expenses | (7,294) | | | 7,331 | |
| Accrued income taxes | 5,196 | | | 39,078 | |
| Other accrued liabilities | 1,829 | | | 1,801 | |
| Other assets and liabilities | 884 | | | 291 | |
| Net cash provided by operating activities | 58,499 | | | 256,931 | |
| | | |
| Investing activities: | | | |
| Purchases of property and equipment | (7,841) | | | (8,619) | |
| Purchases and development of software | (6,862) | | | (5,246) | |
| Acquisitions, net of cash acquired | (223,617) | | | (44,143) | |
| Other investing activities | — | | | 8 | |
| Net cash used for investing activities | (238,320) | | | (58,000) | |
| | | |
| Financing activities: | | | |
| Proceeds from stock issued for employee benefit plans | 11,269 | | | 19,615 | |
| Net repurchases of common stock | (82,358) | | | (79,666) | |
| Cash dividends | (69,871) | | | (69,742) | |
| | | |
| | | |
| Proceeds from short-term borrowings | 765,600 | | | 14,000 | |
| Payments on short-term borrowings | (587,600) | | | (19,000) | |
| Net cash used for financing activities | 37,040 | | | (134,793) | |
| Effect of exchange rates on cash | (10,505) | | | 2,720 | |
| | | |
| Net change in cash and cash equivalents | (153,286) | | | 66,858 | |
| Cash and cash equivalents, beginning of period | 447,858 | | | 378,615 | |
| Cash and cash equivalents, end of period | $ | 294,572 | | | $ | 445,473 | |
| | | |
| As of March 31, | | |
| Operational Data: | 2020 | | 2019 |
| Employees | 15,474 | | | 15,514 | |
Source: C.H. Robinson
CHRW-IR