
Ciena Corporation Earnings Presentation Period ended August 1, 2020 September 3, 2020 Copyright © Ciena Corporation 2020. All rights reserved. Confidential & Proprietary.
Forward-looking statements and non-GAAP measures Information in this presentation and related comments of presenters contain a number of forward-looking statements. These statements are based on current expectations, forecasts, assumptions and other information available to the Company as of the date hereof. Forward-looking statements include Ciena’s long-term financial targets, prospective financial results, return of capital plans, business strategies, expectations about its addressable markets and market share, and business outlook for future periods, as well as statements regarding Ciena’s expectations, beliefs, intentions or strategies regarding the future. Often, these can be identified by forward-looking words such as “target” “anticipate,” “believe,” “could,” “estimate,” “expect,” “intend,” “may,” “should,” “will,” “plan,” “predict,” “potential,” “project, “continue,” and “would” or similar words. Ciena's actual results, performance or events may differ materially from these forward-looking statements made or implied due to a number of risks and uncertainties relating to Ciena's business, including: the effect of broader economic and market conditions on our customers and their business; our ability to execute our business and growth strategies; the duration and severity of the COVID-19 pandemic and the impact of countermeasures taken to mitigate its spread on macroeconomic conditions, economic activity, demand for our technology solutions, short- and long-term changes in customer or end user needs, continuity of supply chain, our business operations, liquidity and financial results; changes in network spending or network strategy by our customers; seasonality and the timing and size of customer orders, including our ability to recognize revenue relating to such sales; the level of competitive pressure we encounter; the product, customer and geographic mix of sales within the period; supply chain disruptions and the level of success relating to efforts to optimize Ciena's operations; changes in foreign currency exchange rates affecting revenue and operating expense; factors beyond our control such as natural disasters, acts of war or terrorism, and public health emergencies, including the COVID-19 pandemic; the impact of the Tax Cuts and Jobs Act; changes in tax or trade regulations, including the imposition of tariffs, duties or efforts to withdraw from or materially modify international trade agreements; and the other risk factors disclosed in Ciena’s periodic reports filed with the Securities and Exchange Commission (SEC) including Ciena’s Annual Report on Form 10-K filed with the SEC on December 20, 2019 and Ciena’s Quarterly Report on Form 10-Q to be filed with the SEC. All information, statements, and projections in this presentation and the related earnings call speak only as of the date of this presentation and related earnings call. Ciena assumes no obligation to update any forward-looking or other information included in this presentation or related earnings calls, whether as a result of new information, future events or otherwise. In addition, this presentation includes historical, and may include prospective, non-GAAP measures of Ciena’s gross margin, operating expense, operating profit, EBITDA, net income, and net income per share. These measures are not intended to be a substitute for financial information presented in accordance with GAAP. A reconciliation of non-GAAP measures used in this presentation to Ciena’s GAAP results for the relevant period can be found in the Appendix to this presentation. Additional information can also be found in our press release filed this morning and in our reports on Form 10-Q filed with the Securities and Exchange Commission. Copyright © Ciena Corporation 2020. All rights reserved. Confidential & Proprietary. 2
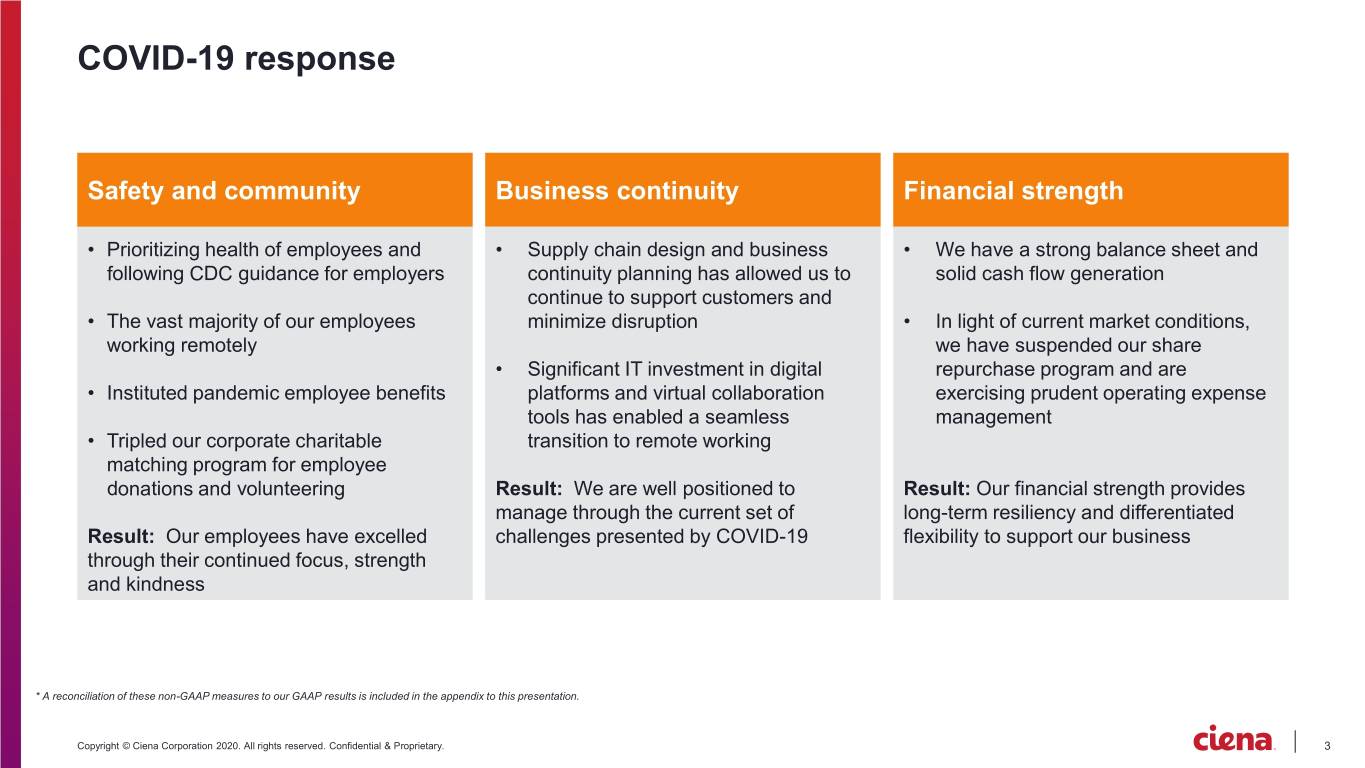
Safety and community Business continuity Financial strength • Prioritizing health of employees and • Supply chain design and business • We have a strong balance sheet and following CDC guidance for employers continuity planning has allowed us to solid cash flow generation continue to support customers and • The vast majority of our employees minimize disruption • In light of current market conditions, working remotely we have suspended our share • Significant IT investment in digital repurchase program and are • Instituted pandemic employee benefits platforms and virtual collaboration exercising prudent operating expense tools has enabled a seamless management • Tripled our corporate charitable transition to remote working matching program for employee donations and volunteering Result: We are well positioned to Result: Our financial strength provides manage through the current set of long-term resiliency and differentiated Result: Our employees have excelled challenges presented by COVID-19 flexibility to support our business through their continued focus, strength and kindness * A reconciliation of these non-GAAP measures to our GAAP results is included in the appendix to this presentation. Copyright © Ciena Corporation 2020. All rights reserved. Confidential & Proprietary. 3
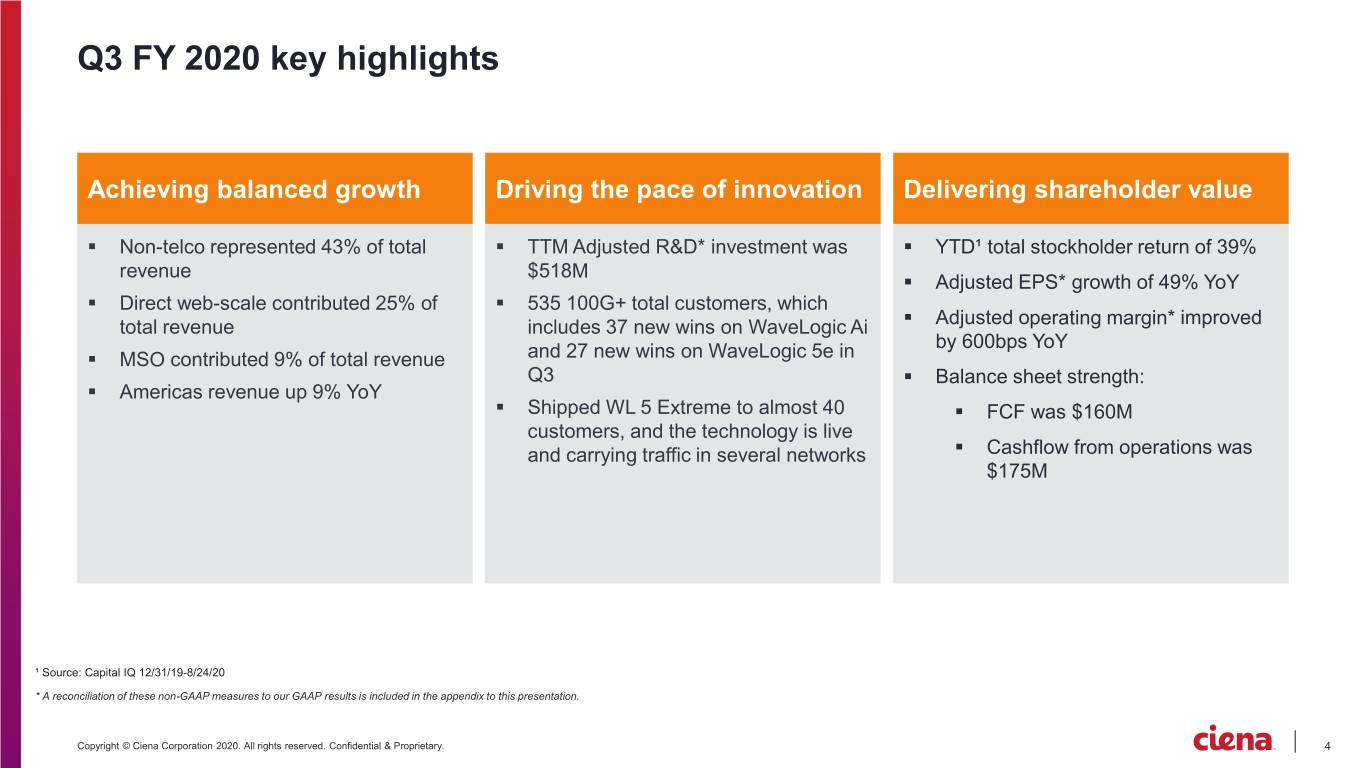
Achieving balanced growth Driving the pace of innovation Delivering shareholder value . Non-telco represented 43% of total . TTM Adjusted R&D* investment was revenue $518M . Direct web-scale contributed 25% of . 535 100G+ total customers, which total revenue includes 37 new wins on WaveLogic Ai . MSO contributed 9% of total revenue and 27 new wins on WaveLogic 5e in Q3 . Americas revenue up 9% YoY . Shipped WL 5 Extreme to almost 40 customers, and the technology is live and carrying traffic in several networks ¹ Source: Capital IQ 12/31/19-8/24/20 * A reconciliation of these non-GAAP measures to our GAAP results is included in the appendix to this presentation. Copyright © Ciena Corporation 2020. All rights reserved. Confidential & Proprietary. 4
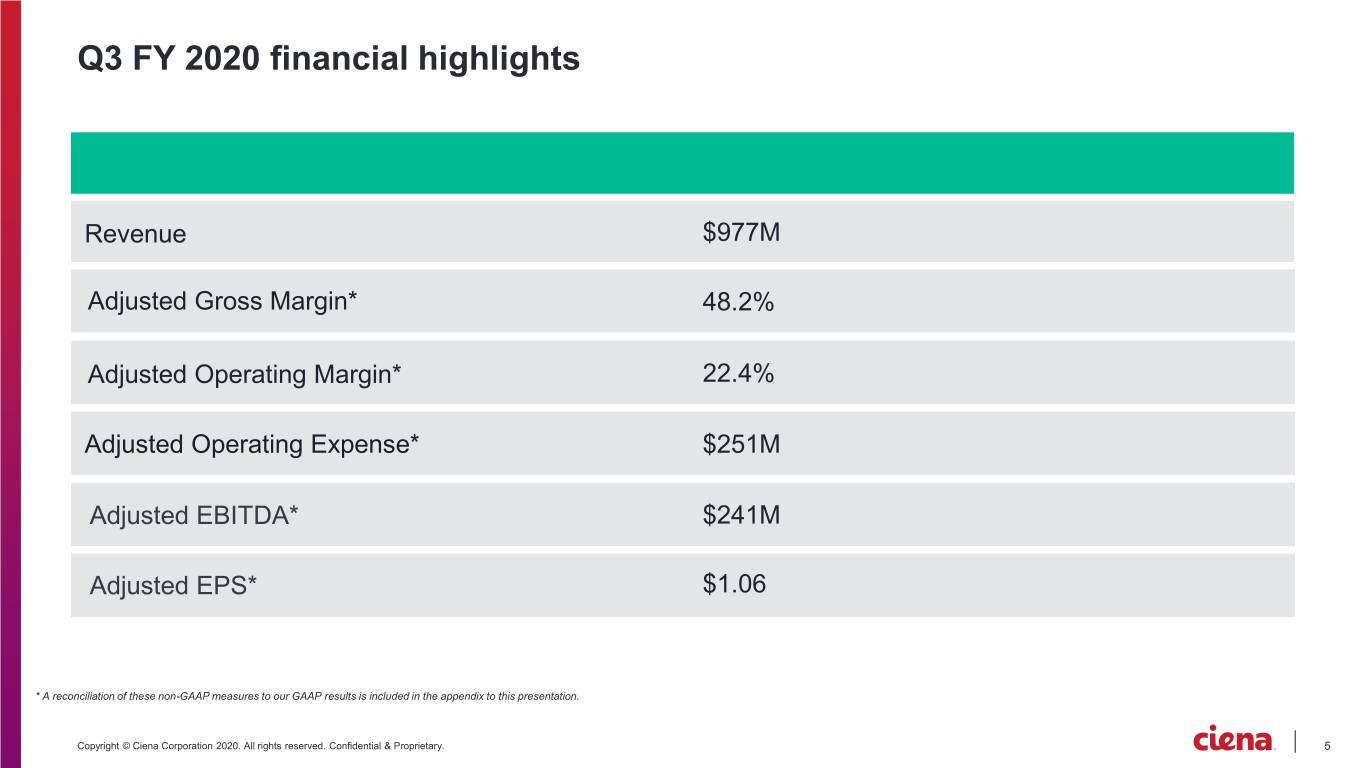
Q3 FY 2020 financial highlights Adjusted Operating Expense* * A reconciliation of these non-GAAP measures to our GAAP results is included in the appendix to this presentation. Copyright © Ciena Corporation 2020. All rights reserved. Confidential & Proprietary. 5
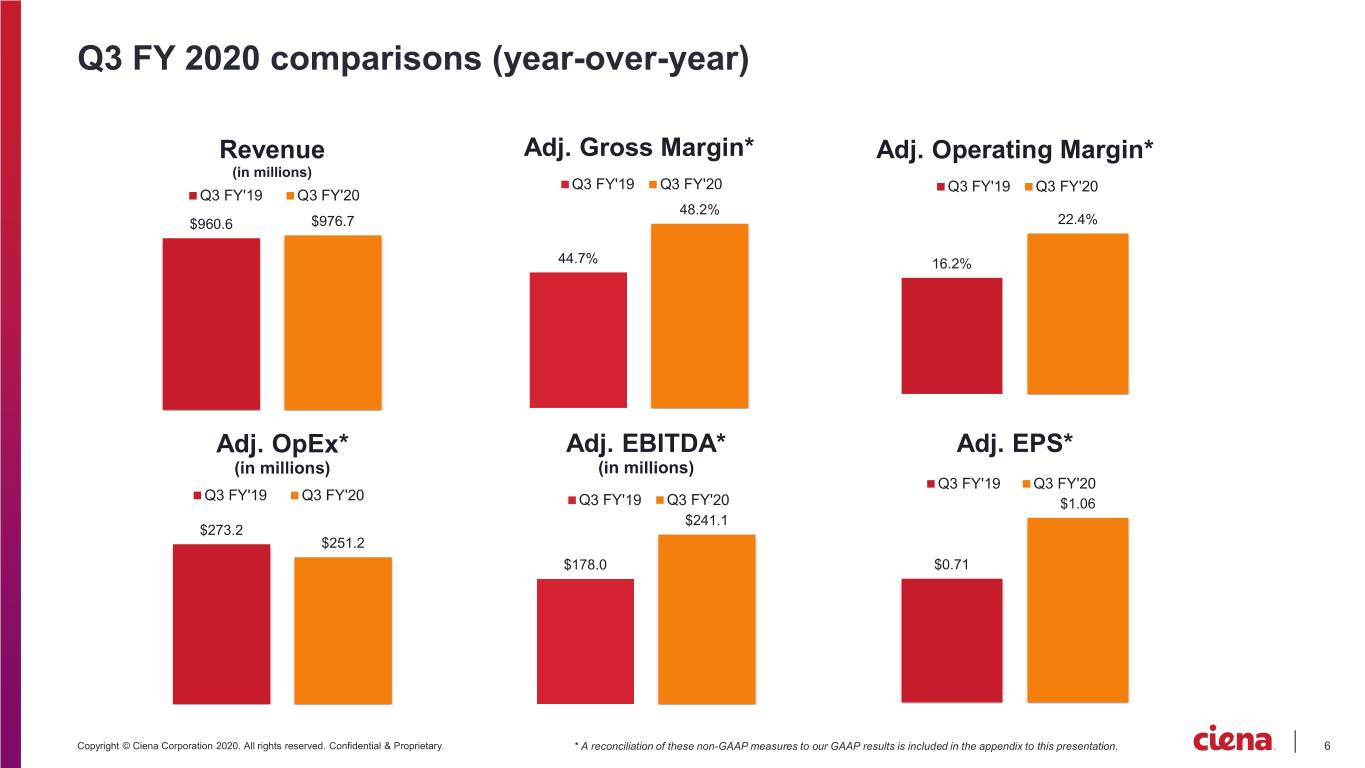
Q3 FY 2020 comparisons (year-over-year) Revenue Adj. Gross Margin* Adj. Operating Margin* (in millions) Q3 FY'19 Q3 FY'20 Q3 FY'19 Q3 FY'20 Q3 FY'19 Q3 FY'20 48.2% $960.6 $976.7 22.4% 44.7% 16.2% Adj. OpEx* Adj. EBITDA* Adj. EPS* (in millions) (in millions) Q3 FY'19 Q3 FY'20 Q3 FY'19 Q3 FY'20 Q3 FY'19 Q3 FY'20 $1.06 $241.1 $273.2 $251.2 $178.0 $0.71 Copyright © Ciena Corporation 2020. All rights reserved. Confidential & Proprietary. * A reconciliation of these non-GAAP measures to our GAAP results is included in the appendix to this presentation. 6
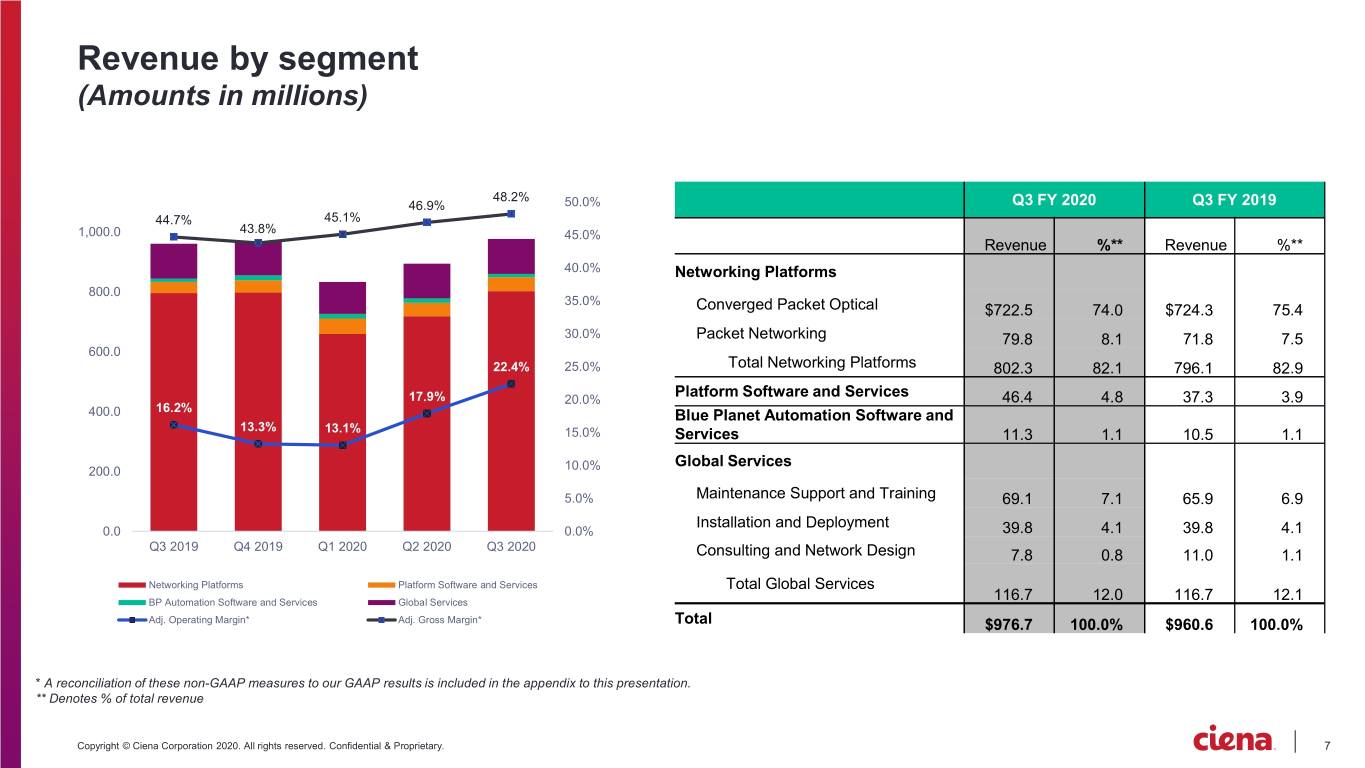
Revenue by segment (Amounts in millions) 48.2% 46.9% 50.0% Q3 FY 2020 Q3 FY 2019 44.7% 45.1% 1,000.0 43.8% 45.0% Revenue %** Revenue %** 40.0% Networking Platforms 800.0 35.0% Converged Packet Optical $722.5 74.0 $724.3 75.4 30.0% Packet Networking 79.8 8.1 71.8 7.5 600.0 22.4% 25.0% Total Networking Platforms 802.3 82.1 796.1 82.9 17.9% 20.0% Platform Software and Services 46.4 4.8 37.3 3.9 16.2% 400.0 Blue Planet Automation Software and 13.3% 13.1% 15.0% Services 11.3 1.1 10.5 1.1 Global Services 200.0 10.0% 5.0% Maintenance Support and Training 69.1 7.1 65.9 6.9 Installation and Deployment 0.0 0.0% 39.8 4.1 39.8 4.1 Q3 2019 Q4 2019 Q1 2020 Q2 2020 Q3 2020 Consulting and Network Design 7.8 0.8 11.0 1.1 Networking Platforms Platform Software and Services Total Global Services BP Automation Software and Services Global Services 116.7 12.0 116.7 12.1 Adj. Operating Margin* Adj. Gross Margin* Total $976.7 100.0% $960.6 100.0% * A reconciliation of these non-GAAP measures to our GAAP results is included in the appendix to this presentation. ** Denotes % of total revenue Copyright © Ciena Corporation 2020. All rights reserved. Confidential & Proprietary. 7
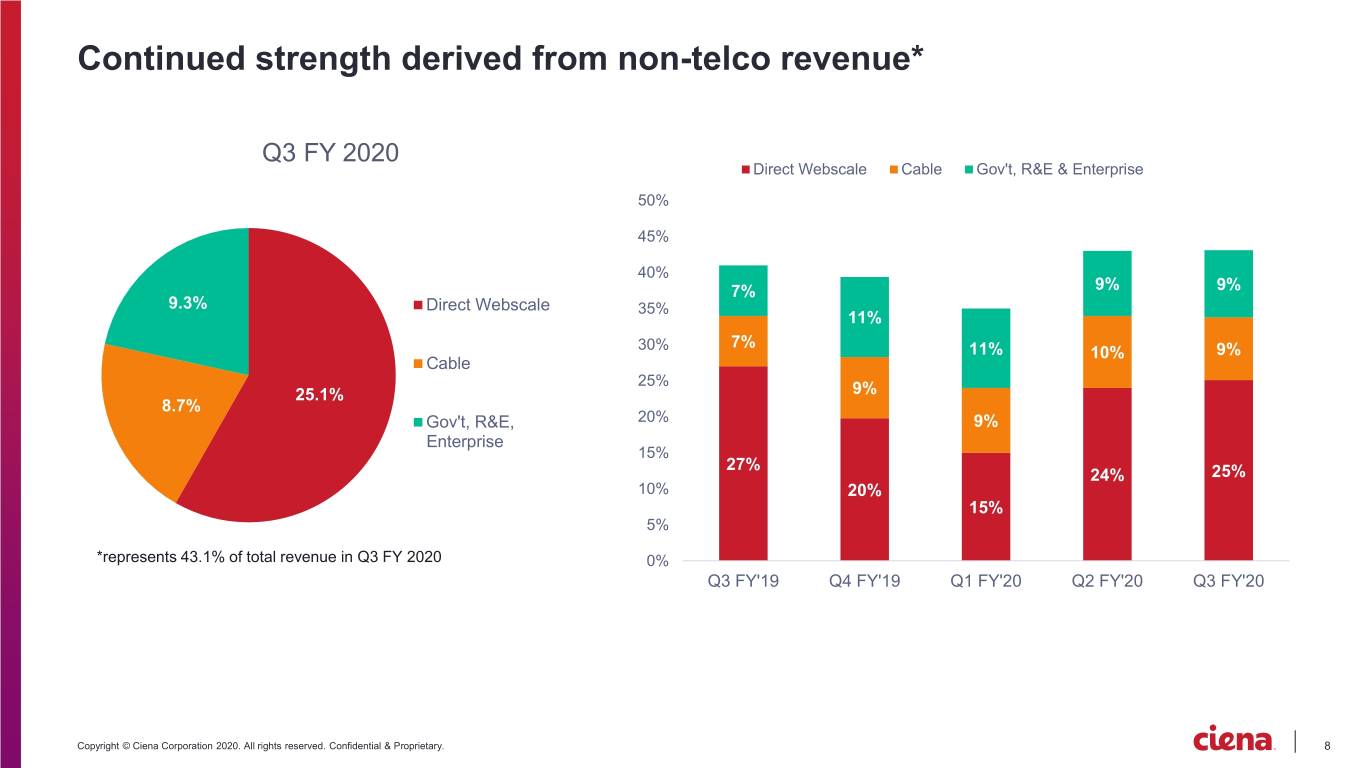
Continued strength derived from non-telco revenue* Q3 FY 2020 Direct Webscale Cable Gov't, R&E & Enterprise 50% 45% 40% 7% 9% 9% 9.3% Direct Webscale 35% 11% 30% 7% 11% 10% 9% Cable 25% 25.1% 9% 8.7% Gov't, R&E, 20% 9% Enterprise 15% 27% 24% 25% 10% 20% 15% 5% *represents 43.1% of total revenue in Q3 FY 2020 0% Q3 FY'19 Q4 FY'19 Q1 FY'20 Q2 FY'20 Q3 FY'20 Copyright © Ciena Corporation 2020. All rights reserved. Confidential & Proprietary. 8
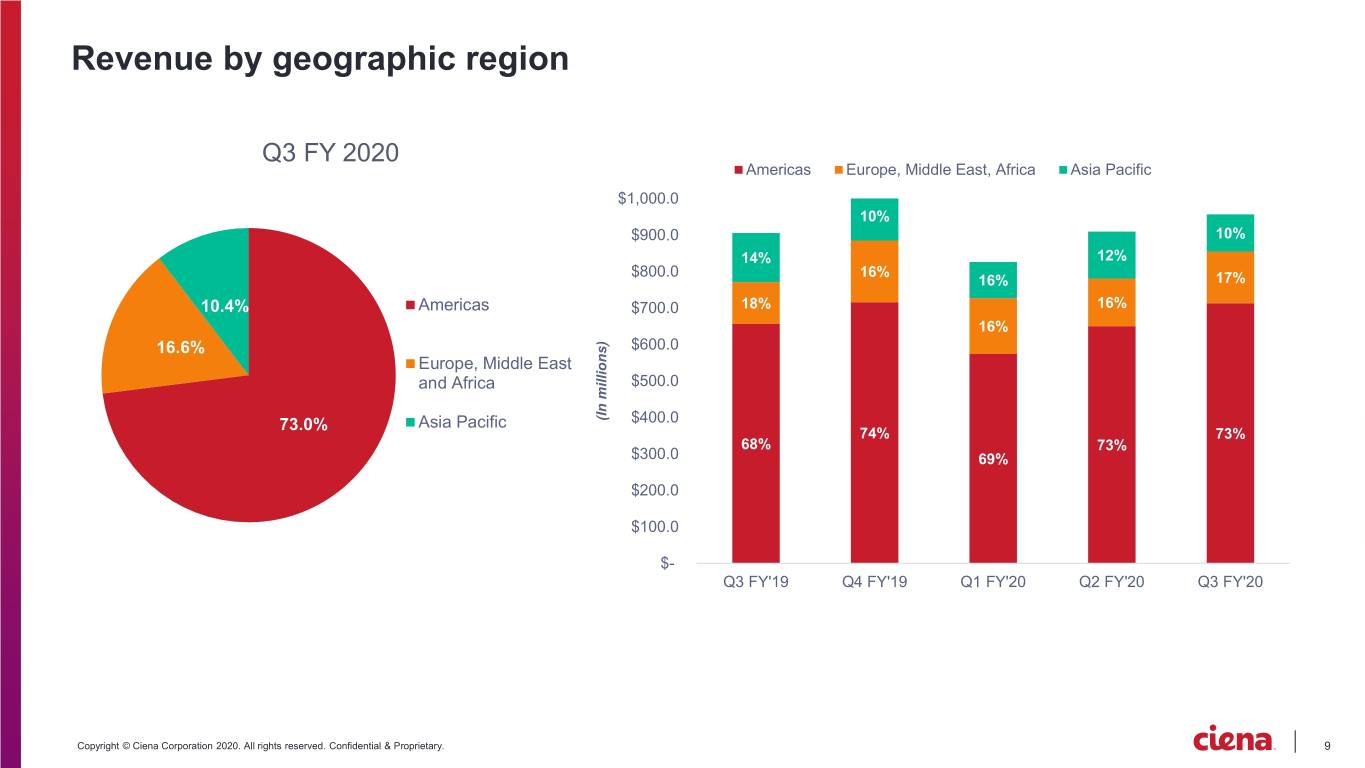
Revenue by geographic region Q3 FY 2020 Americas Europe, Middle East, Africa Asia Pacific $1,000.0 10% $900.0 10% 14% 12% $800.0 16% 16% 17% 10.4% Americas $700.0 18% 16% 16% 16.6% $600.0 Europe, Middle East and Africa $500.0 73.0% Asia Pacific (In millions) $400.0 74% 73% 68% 73% $300.0 69% $200.0 $100.0 $- Q3 FY'19 Q4 FY'19 Q1 FY'20 Q2 FY'20 Q3 FY'20 Copyright © Ciena Corporation 2020. All rights reserved. Confidential & Proprietary. 9
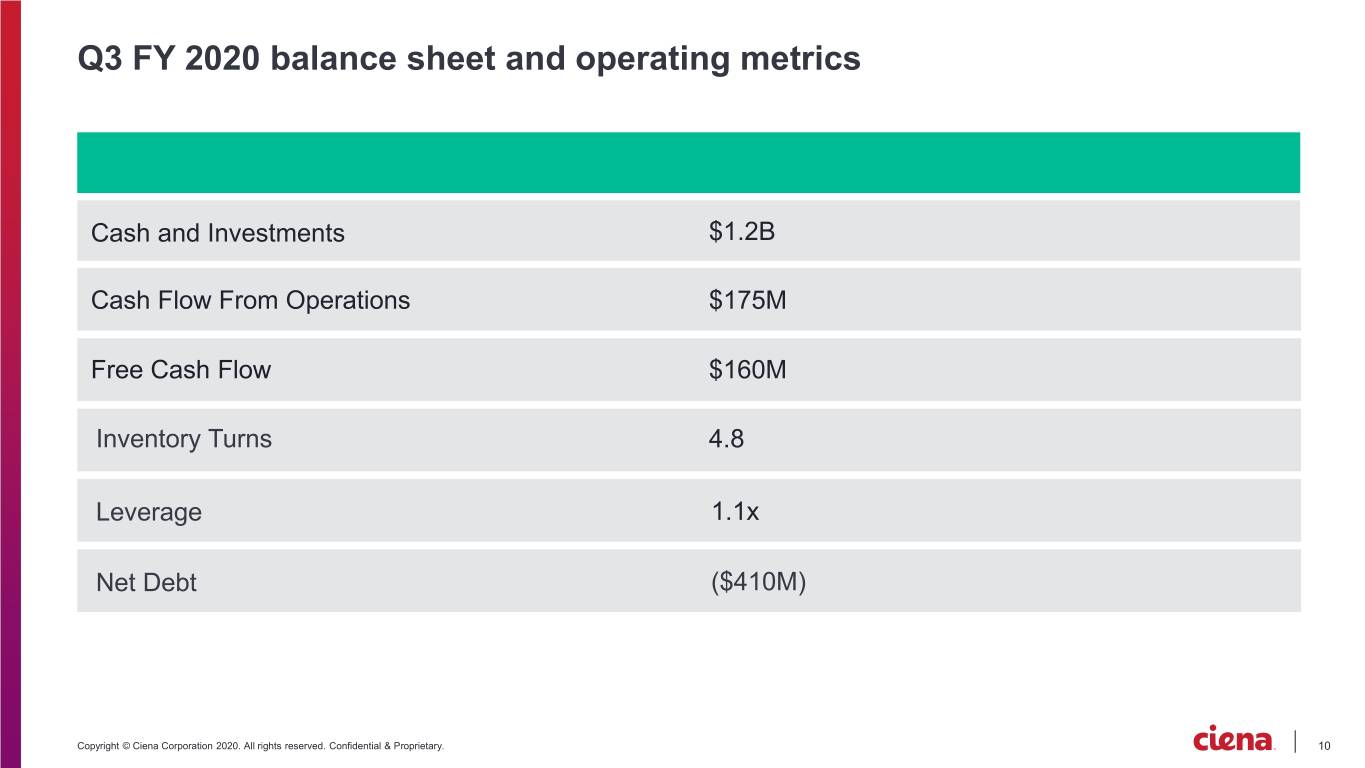
Q3 FY 2020 balance sheet and operating metrics Free Cash Flow Copyright © Ciena Corporation 2020. All rights reserved. Confidential & Proprietary. 10
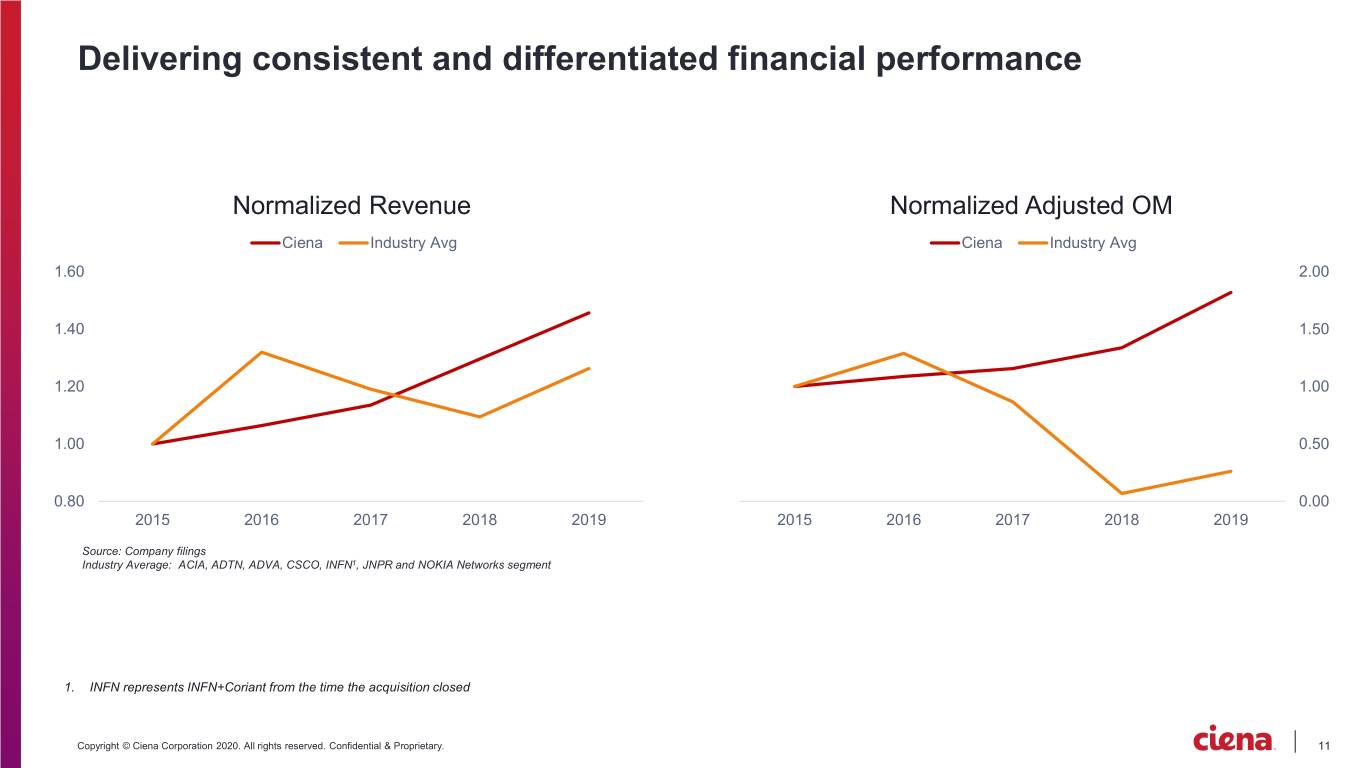
Delivering consistent and differentiated financial performance Normalized Revenue Normalized Adjusted OM Ciena Industry Avg Ciena Industry Avg 1.60 2.00 1.40 1.50 1.20 1.00 1.00 0.50 0.80 0.00 2015 2016 2017 2018 2019 2015 2016 2017 2018 2019 Source: Company filings Industry Average: ACIA, ADTN, ADVA, CSCO, INFN1, JNPR and NOKIA Networks segment 1. INFN represents INFN+Coriant from the time the acquisition closed Copyright © Ciena Corporation 2020. All rights reserved. Confidential & Proprietary. 11
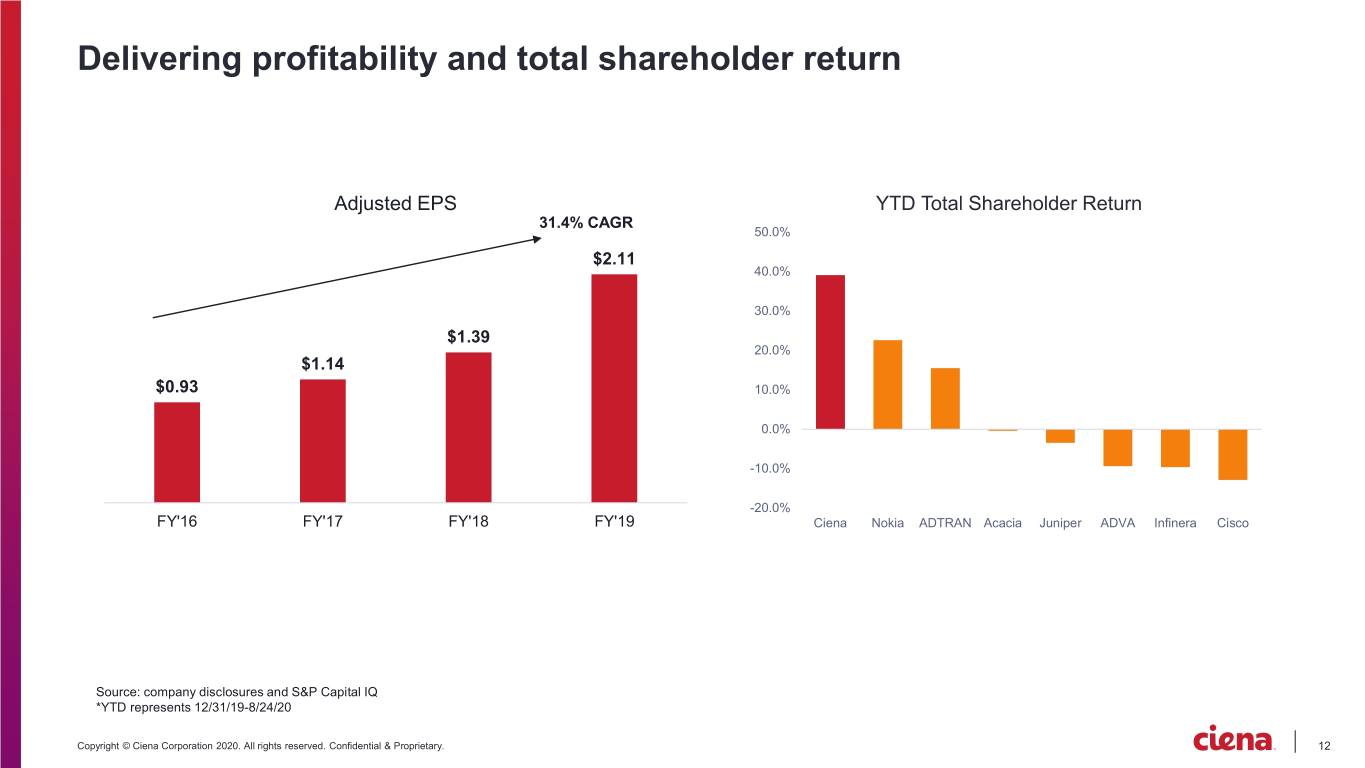
Delivering profitability and total shareholder return Adjusted EPS YTD Total Shareholder Return 31.4% CAGR 50.0% $2.11 40.0% 30.0% $1.39 20.0% $1.14 $0.93 10.0% 0.0% -10.0% -20.0% FY'16 FY'17 FY'18 FY'19 Ciena Nokia ADTRAN Acacia Juniper ADVA Infinera Cisco Source: company disclosures and S&P Capital IQ *YTD represents 12/31/19-8/24/20 Copyright © Ciena Corporation 2020. All rights reserved. Confidential & Proprietary. 12

Q3 fiscal 2020 appendix Copyright © Ciena Corporation 2020. All rights reserved. Confidential & Proprietary. 13
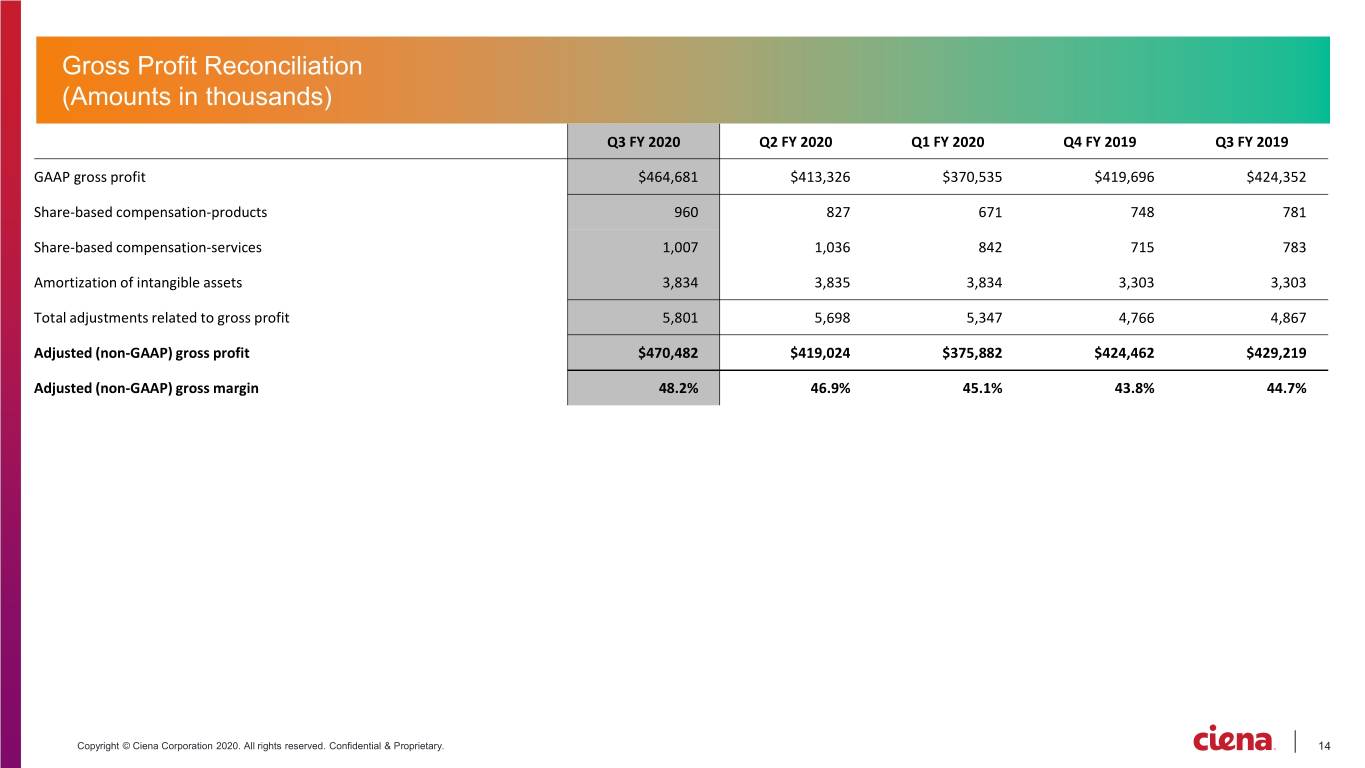
Q3 FY 2020 Q2 FY 2020 Q1 FY 2020 Q4 FY 2019 Q3 FY 2019 GAAP gross profit $464,681 $413,326 $370,535 $419,696 $424,352 Share-based compensation-products 960 827 671 748 781 Share-based compensation-services 1,007 1,036 842 715 783 Amortization of intangible assets 3,834 3,835 3,834 3,303 3,303 Total adjustments related to gross profit 5,801 5,698 5,347 4,766 4,867 Adjusted (non-GAAP) gross profit $470,482 $419,024 $375,882 $424,462 $429,219 Adjusted (non-GAAP) gross margin 48.2% 46.9% 45.1% 43.8% 44.7% Copyright © Ciena Corporation 2020. All rights reserved. Confidential & Proprietary. 14
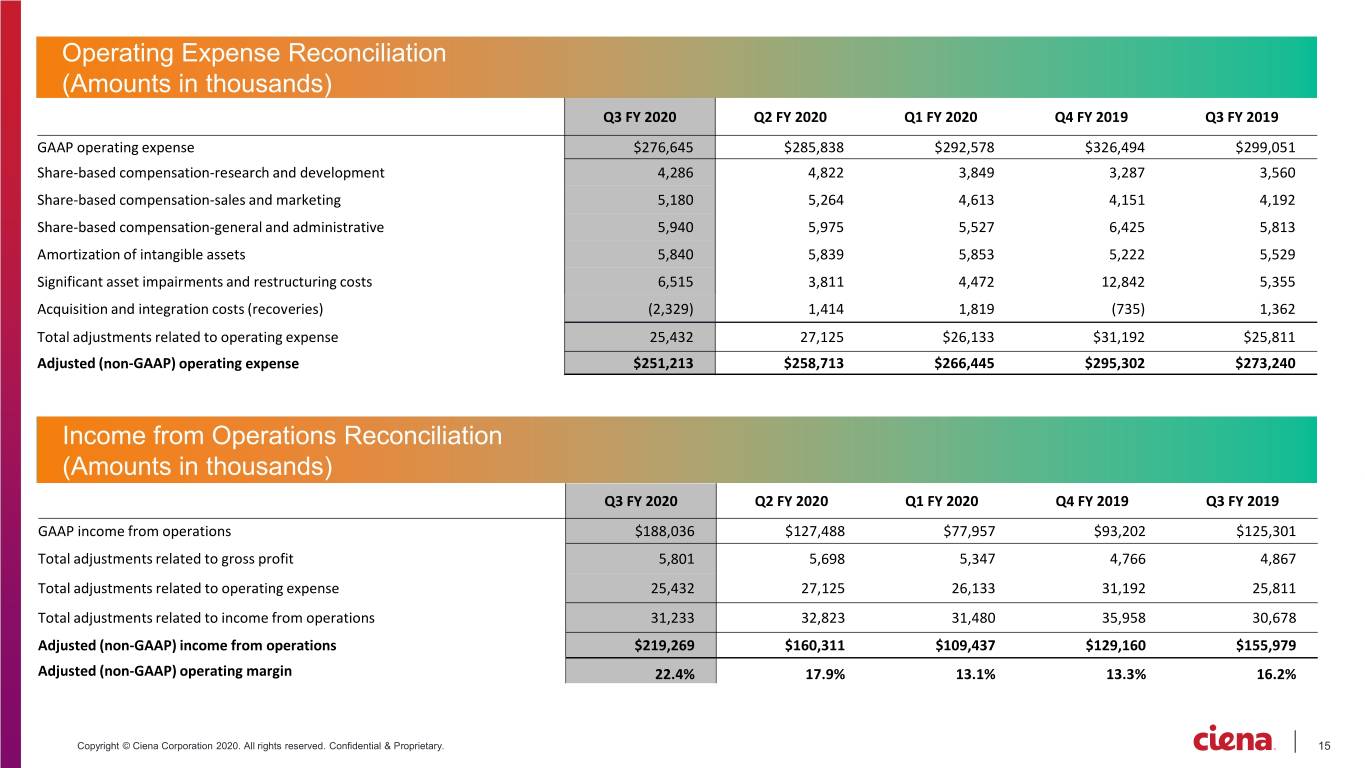
Q3 FY 2020 Q2 FY 2020 Q1 FY 2020 Q4 FY 2019 Q3 FY 2019 GAAP operating expense $276,645 $285,838 $292,578 $326,494 $299,051 Share-based compensation-research and development 4,286 4,822 3,849 3,287 3,560 Share-based compensation-sales and marketing 5,180 5,264 4,613 4,151 4,192 Share-based compensation-general and administrative 5,940 5,975 5,527 6,425 5,813 Amortization of intangible assets 5,840 5,839 5,853 5,222 5,529 Significant asset impairments and restructuring costs 6,515 3,811 4,472 12,842 5,355 Acquisition and integration costs (recoveries) (2,329) 1,414 1,819 (735) 1,362 Total adjustments related to operating expense 25,432 27,125 $26,133 $31,192 $25,811 Adjusted (non-GAAP) operating expense $251,213 $258,713 $266,445 $295,302 $273,240 Q3 FY 2020 Q2 FY 2020 Q1 FY 2020 Q4 FY 2019 Q3 FY 2019 GAAP income from operations $188,036 $127,488 $77,957 $93,202 $125,301 Total adjustments related to gross profit 5,801 5,698 5,347 4,766 4,867 Total adjustments related to operating expense 25,432 27,125 26,133 31,192 25,811 Total adjustments related to income from operations 31,233 32,823 31,480 35,958 30,678 Adjusted (non-GAAP) income from operations $219,269 $160,311 $109,437 $129,160 $155,979 Adjusted (non-GAAP) operating margin 22.4% 17.9% 13.1% 13.3% 16.2% Copyright © Ciena Corporation 2020. All rights reserved. Confidential & Proprietary. 15
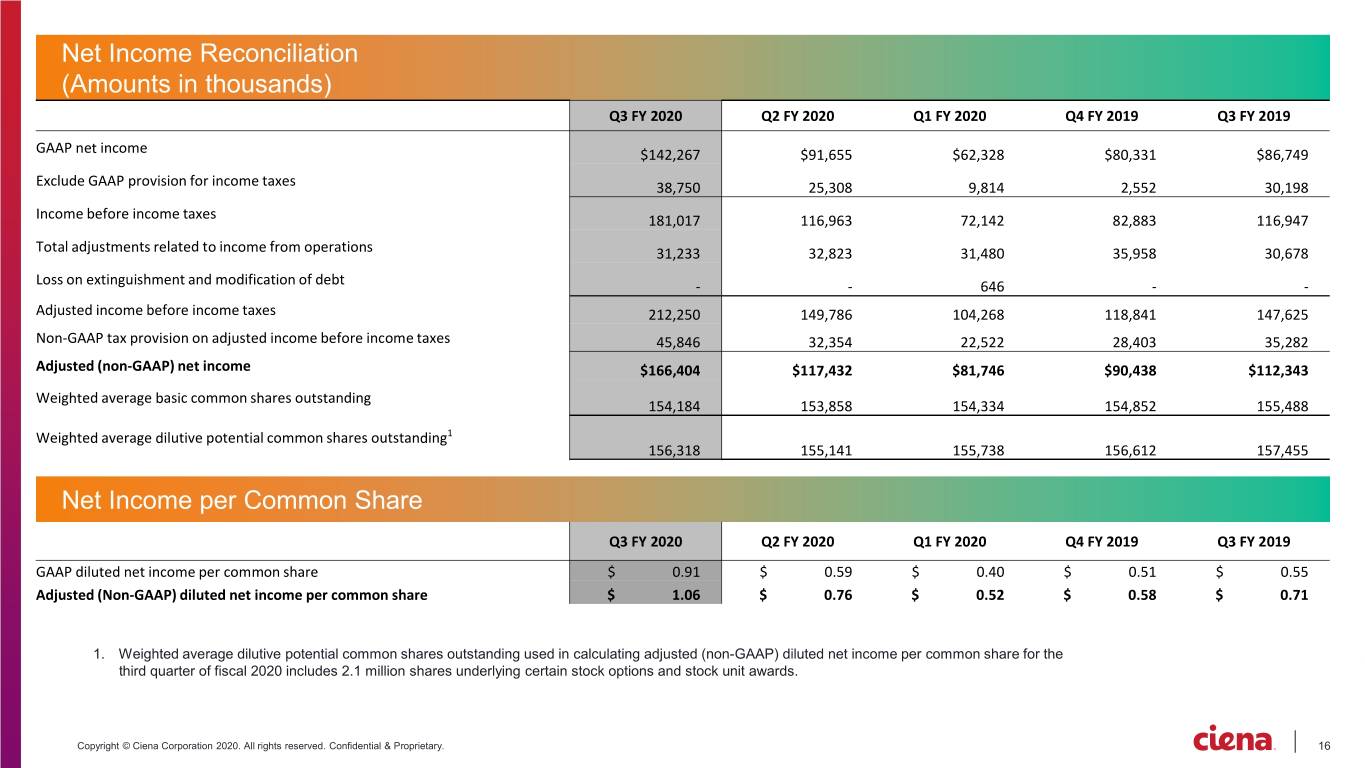
Q3 FY 2020 Q2 FY 2020 Q1 FY 2020 Q4 FY 2019 Q3 FY 2019 GAAP net income $142,267 $91,655 $62,328 $80,331 $86,749 Exclude GAAP provision for income taxes 38,750 25,308 9,814 2,552 30,198 Income before income taxes 181,017 116,963 72,142 82,883 116,947 Total adjustments related to income from operations 31,233 32,823 31,480 35,958 30,678 Loss on extinguishment and modification of debt - - 646 - - Adjusted income before income taxes 212,250 149,786 104,268 118,841 147,625 Non-GAAP tax provision on adjusted income before income taxes 45,846 32,354 22,522 28,403 35,282 Adjusted (non-GAAP) net income $166,404 $117,432 $81,746 $90,438 $112,343 Weighted average basic common shares outstanding 154,184 153,858 154,334 154,852 155,488 Weighted average dilutive potential common shares outstanding1 156,318 155,141 155,738 156,612 157,455 Q3 FY 2020 Q2 FY 2020 Q1 FY 2020 Q4 FY 2019 Q3 FY 2019 GAAP diluted net income per common share $ 0.91 $ 0.59 $ 0.40 $ 0.51 $ 0.55 Adjusted (Non-GAAP) diluted net income per common share $ 1.06 $ 0.76 $ 0.52 $ 0.58 $ 0.71 1. Weighted average dilutive potential common shares outstanding used in calculating adjusted (non-GAAP) diluted net income per common share for the third quarter of fiscal 2020 includes 2.1 million shares underlying certain stock options and stock unit awards. Copyright © Ciena Corporation 2020. All rights reserved. Confidential & Proprietary. 16
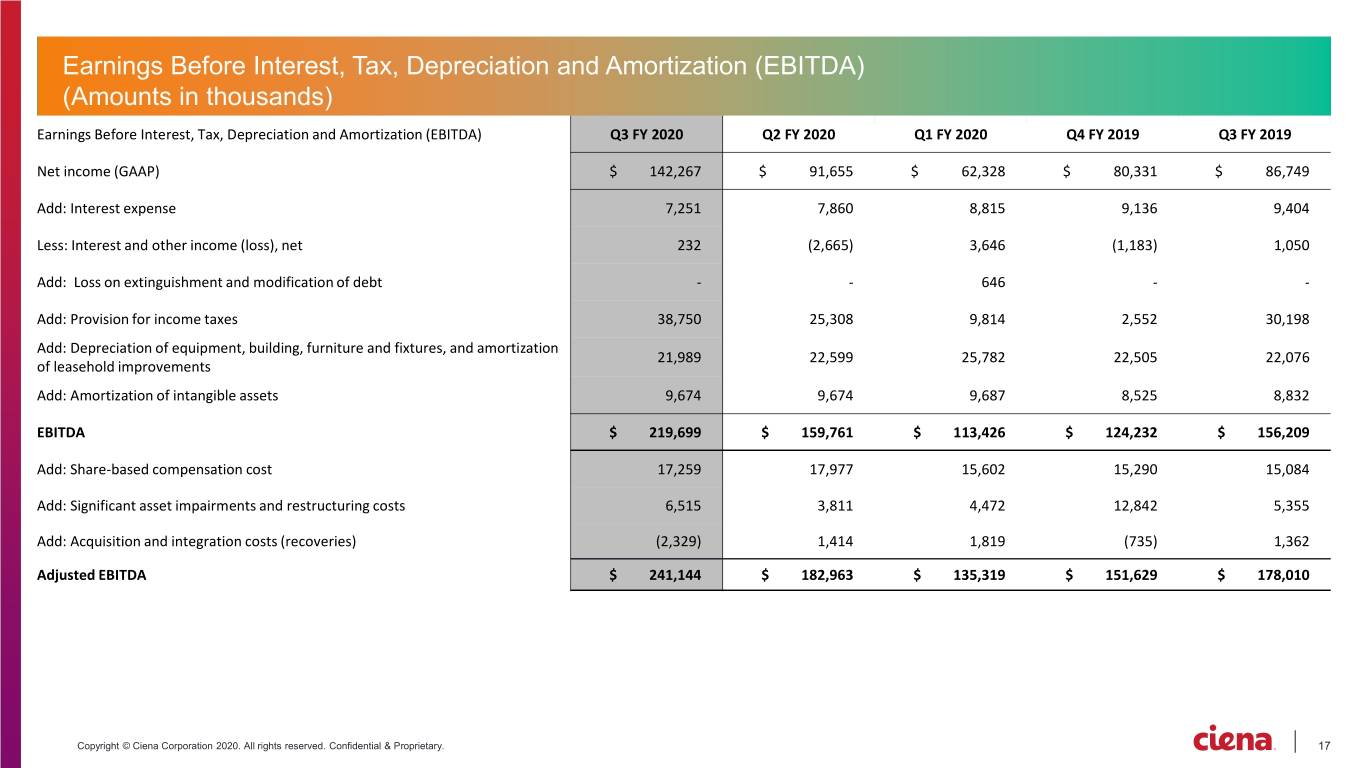
Earnings Before Interest, Tax, Depreciation and Amortization (EBITDA) Q3 FY 2020 Q2 FY 2020 Q1 FY 2020 Q4 FY 2019 Q3 FY 2019 Net income (GAAP) $ 142,267 $ 91,655 $ 62,328 $ 80,331 $ 86,749 Add: Interest expense 7,251 7,860 8,815 9,136 9,404 Less: Interest and other income (loss), net 232 (2,665) 3,646 (1,183) 1,050 Add: Loss on extinguishment and modification of debt - - 646 - - Add: Provision for income taxes 38,750 25,308 9,814 2,552 30,198 Add: Depreciation of equipment, building, furniture and fixtures, and amortization 21,989 22,599 25,782 22,505 22,076 of leasehold improvements Add: Amortization of intangible assets 9,674 9,674 9,687 8,525 8,832 EBITDA $ 219,699 $ 159,761 $ 113,426 $ 124,232 $ 156,209 Add: Share-based compensation cost 17,259 17,977 15,602 15,290 15,084 Add: Significant asset impairments and restructuring costs 6,515 3,811 4,472 12,842 5,355 Add: Acquisition and integration costs (recoveries) (2,329) 1,414 1,819 (735) 1,362 Adjusted EBITDA $ 241,144 $ 182,963 $ 135,319 $ 151,629 $ 178,010 Copyright © Ciena Corporation 2020. All rights reserved. Confidential & Proprietary. 17