
© Ciena Corporation 2023. All rights reserved. Proprietary information. Ciena Corporation Period ended April 29, 2023 June 6, 2023 Earnings Presentation
2© Ciena Corporation 2023. All rights reserved. Proprietary information. Forward-looking statements and non-GAAP measures Information in this presentation and related comments of presenters contain a number of forward-looking statements. These statements are based on current expectations, forecasts, assumptions and other information available to the Company as of the date hereof. Forward-looking statements include Ciena’s prospective financial results, return of capital plans, business strategies, expectations about its addressable markets and market share, and business outlook for future periods, as well as statements regarding Ciena’s expectations, beliefs, intentions or strategies regarding the future. Often, these can be identified by forward-looking words such as “target” “anticipate,” “believe,” “could,” “estimate,” “expect,” “intend,” “may,” “should,” “will,” “plan,” “predict,” “potential,” “project", “continue,” and “would” or similar words. Ciena's actual results, performance or events may differ materially from these forward-looking statements made or implied due to a number of risks and uncertainties relating to Ciena's business, including: the effect of broader economic and market conditions on our customers and their business; our ability to execute our business and growth strategies; the impact of supply chain constraints or disruptions; the duration and severity of the COVID-19 pandemic and the impact of countermeasures taken to mitigate its spread on macroeconomic conditions, economic activity, demand for our technology solutions, short- and long-term changes in customer or end user needs, continuity of supply chain, our business operations, liquidity and financial results; changes in network spending or network strategy by our customers; seasonality and the timing and size of customer orders, including our ability to recognize revenue relating to such sales; the level of competitive pressure we encounter; the product, customer and geographic mix of sales within the period; changes in foreign currency exchange rates; factors beyond our control such as natural disasters, climate change, acts of war or terrorism, geopolitical events, including but not limited to the ongoing conflict between Ukraine and Russia, and public health emergencies; changes in tax or trade regulations, including the imposition of tariffs, duties or efforts to withdraw from or materially modify international trade agreements; and the other risk factors disclosed in Ciena’s periodic reports filed with the Securities and Exchange Commission (SEC) including Ciena’s Annual Report on Form 10-K filed with the SEC on December 16, 2022 and Ciena’s Quarterly Report on Form 10-Q to be filed with the SEC. All information, statements, and projections in this presentation and the related earnings call speak only as of the date of this presentation and related earnings call. Ciena assumes no obligation to update any forward-looking or other information included in this presentation or related earnings calls, whether as a result of new information, future events or otherwise. In addition, this presentation includes historical, and may include prospective, non-GAAP measures of Ciena’s gross margin, operating expense, operating margin, EBITDA, and net income per share. These measures are not intended to be a substitute for financial information presented in accordance with GAAP. A reconciliation of non-GAAP measures used in this presentation to Ciena’s GAAP results for the relevant period can be found in the Appendix to this presentation. Additional information can also be found in our press release filed this morning and in our reports on Form 10-Q and Form 10K filed with the Securities and Exchange Commission.
3© Ciena Corporation 2023. All rights reserved. Proprietary information. Table of Contents 1 Overview & recent achievements 2 Market context and Ciena's portfolio 3 Q2 FY 2023 financial performance 4 Appendix

4© Ciena Corporation 2023. All rights reserved. Proprietary information. Overview & recent achievements
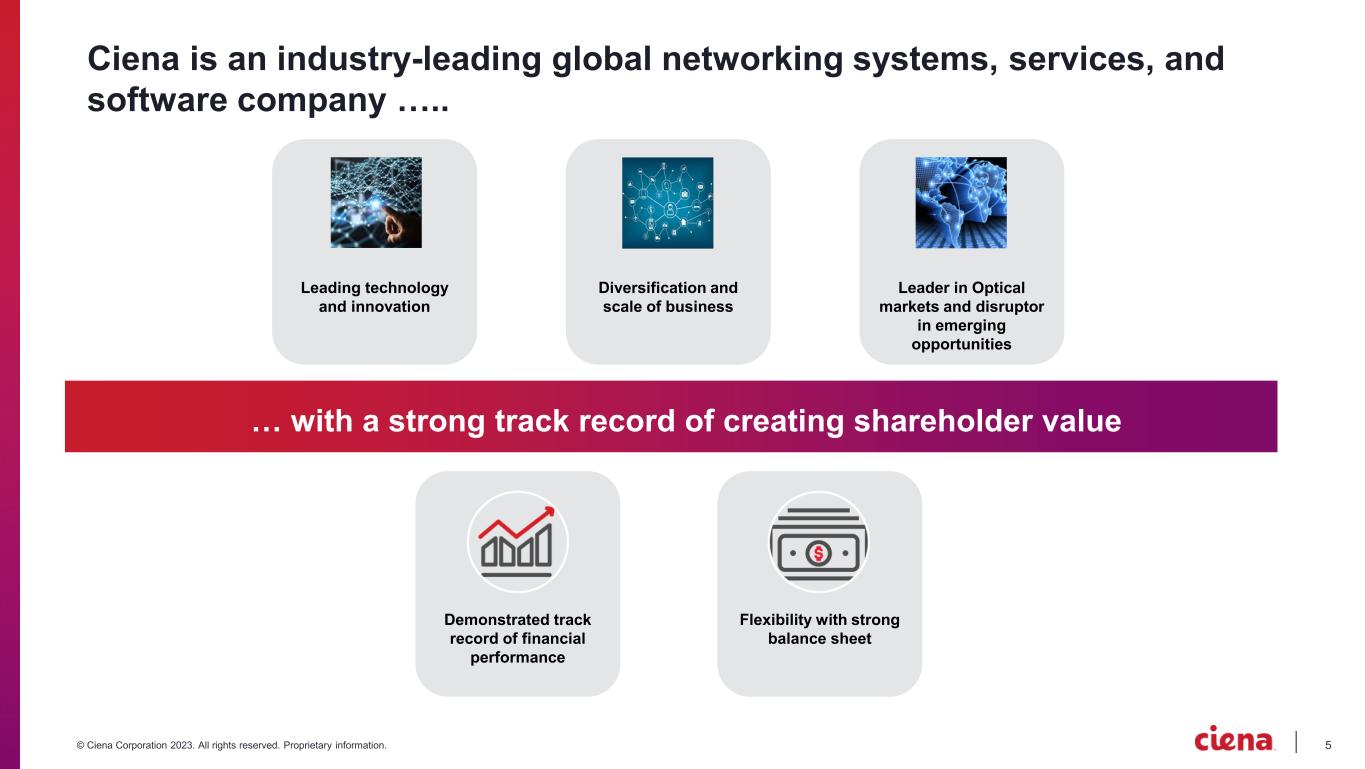
5© Ciena Corporation 2023. All rights reserved. Proprietary information. Ciena is an industry-leading global networking systems, services, and software company ….. Leading technology and innovation … with a strong track record of creating shareholder value Diversification and scale of business Leader in Optical markets and disruptor in emerging opportunities Demonstrated track record of financial performance Flexibility with strong balance sheet
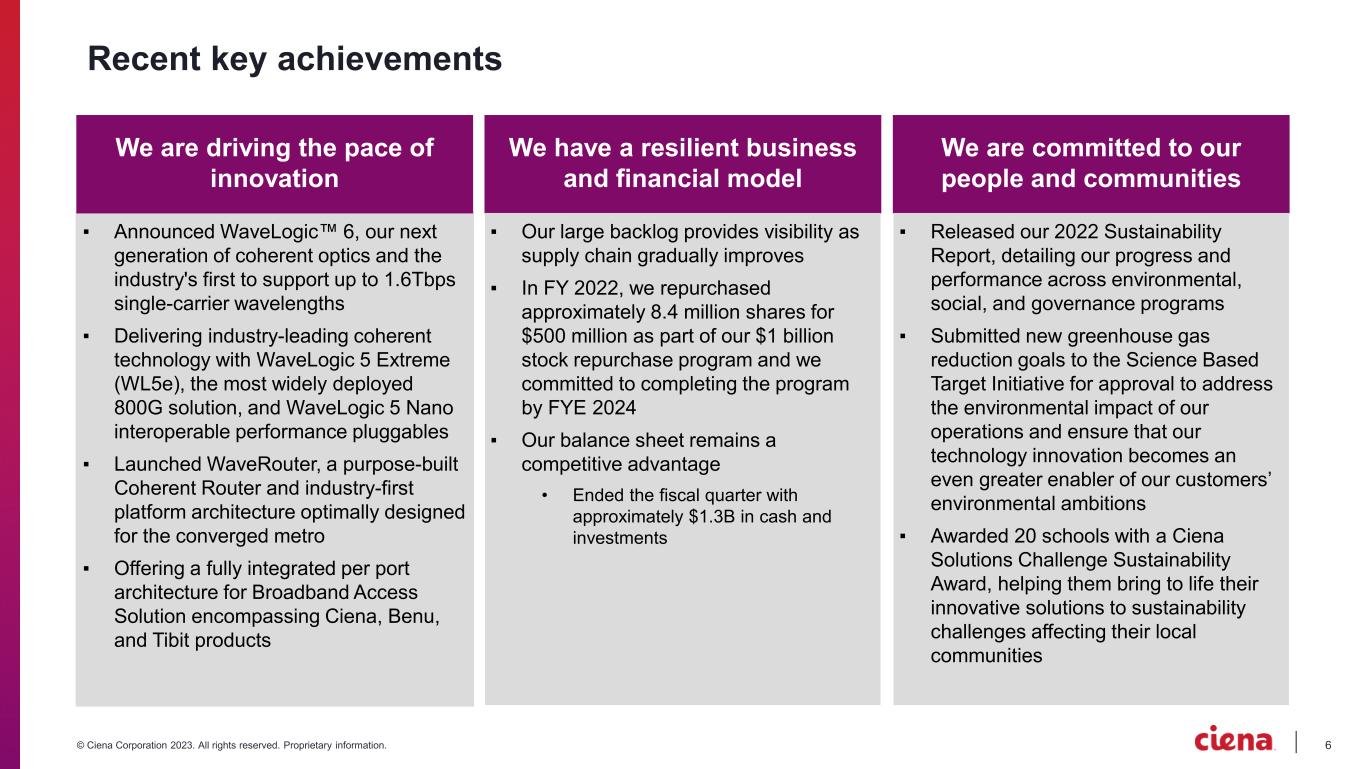
6© Ciena Corporation 2023. All rights reserved. Proprietary information. Recent key achievements ▪ Announced WaveLogic™ 6, our next generation of coherent optics and the industry's first to support up to 1.6Tbps single-carrier wavelengths ▪ Delivering industry-leading coherent technology with WaveLogic 5 Extreme (WL5e), the most widely deployed 800G solution, and WaveLogic 5 Nano interoperable performance pluggables ▪ Launched WaveRouter, a purpose-built Coherent Router and industry-first platform architecture optimally designed for the converged metro ▪ Offering a fully integrated per port architecture for Broadband Access Solution encompassing Ciena, Benu, and Tibit products We are driving the pace of innovation We are committed to our people and communities We have a resilient business and financial model ▪ Our large backlog provides visibility as supply chain gradually improves ▪ In FY 2022, we repurchased approximately 8.4 million shares for $500 million as part of our $1 billion stock repurchase program and we committed to completing the program by FYE 2024 ▪ Our balance sheet remains a competitive advantage • Ended the fiscal quarter with approximately $1.3B in cash and investments ▪ Released our 2022 Sustainability Report, detailing our progress and performance across environmental, social, and governance programs ▪ Submitted new greenhouse gas reduction goals to the Science Based Target Initiative for approval to address the environmental impact of our operations and ensure that our technology innovation becomes an even greater enabler of our customers’ environmental ambitions ▪ Awarded 20 schools with a Ciena Solutions Challenge Sustainability Award, helping them bring to life their innovative solutions to sustainability challenges affecting their local communities

7© Ciena Corporation 2023. All rights reserved. Proprietary information. Market context and Ciena's portfolio
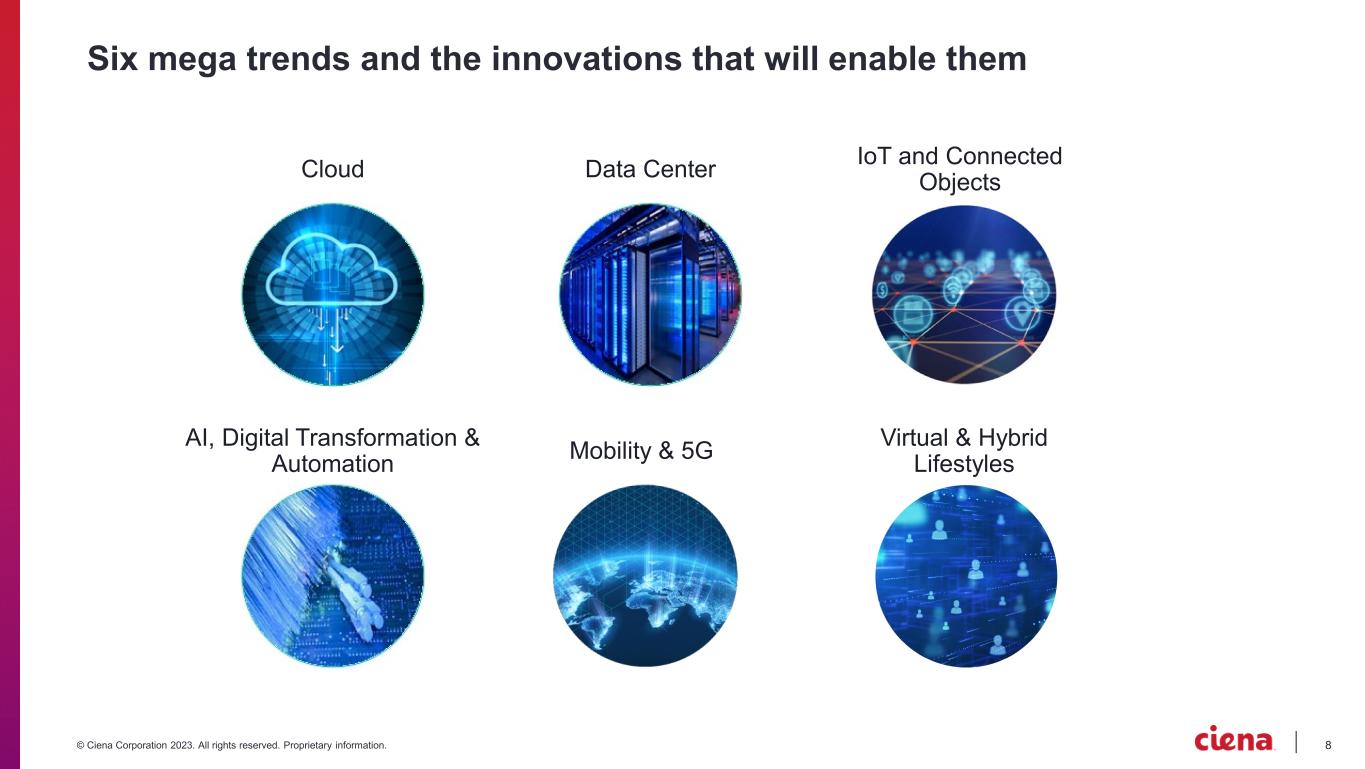
8© Ciena Corporation 2023. All rights reserved. Proprietary information. Six mega trends and the innovations that will enable them AI, Digital Transformation & Automation Cloud Data Center Mobility & 5G IoT and Connected Objects Virtual & Hybrid Lifestyles
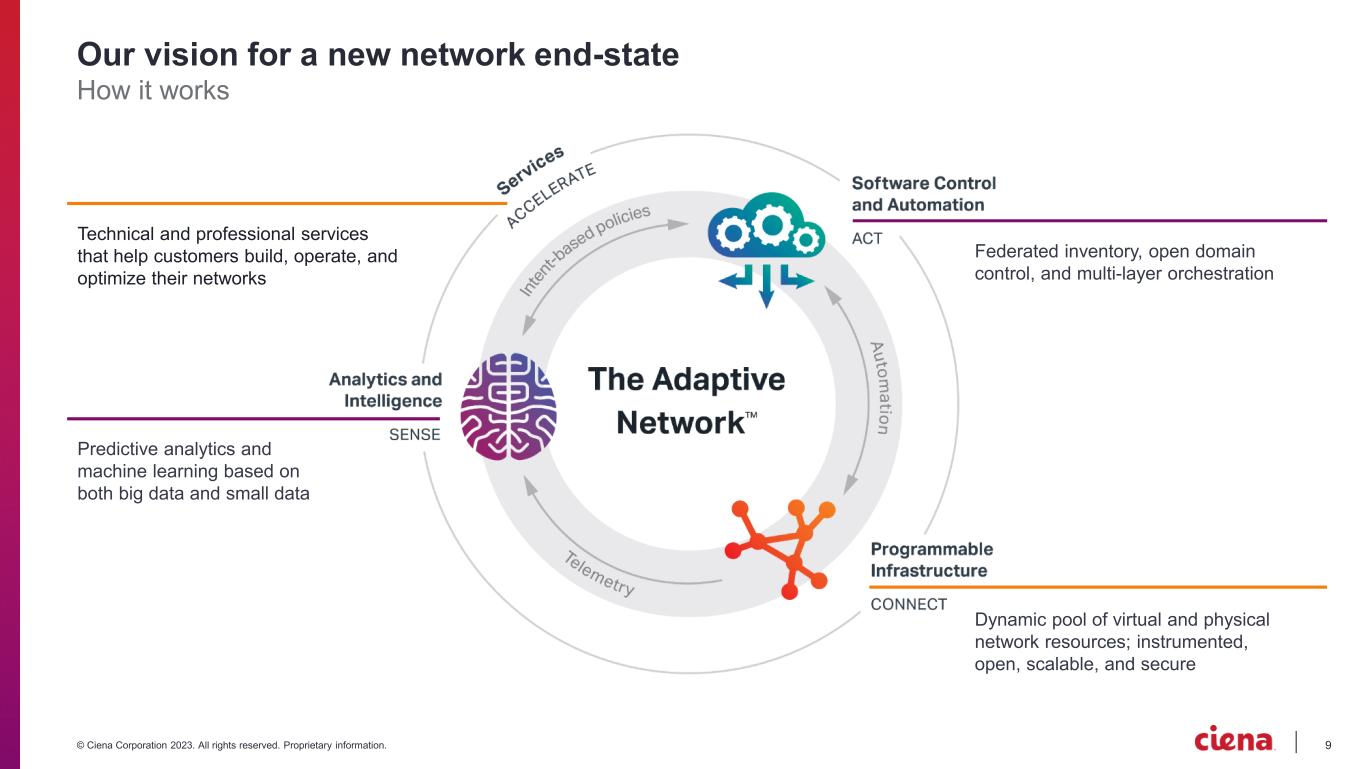
9© Ciena Corporation 2023. All rights reserved. Proprietary information. Technical and professional services that help customers build, operate, and optimize their networks Predictive analytics and machine learning based on both big data and small data Dynamic pool of virtual and physical network resources; instrumented, open, scalable, and secure Federated inventory, open domain control, and multi-layer orchestration Our vision for a new network end-state How it works
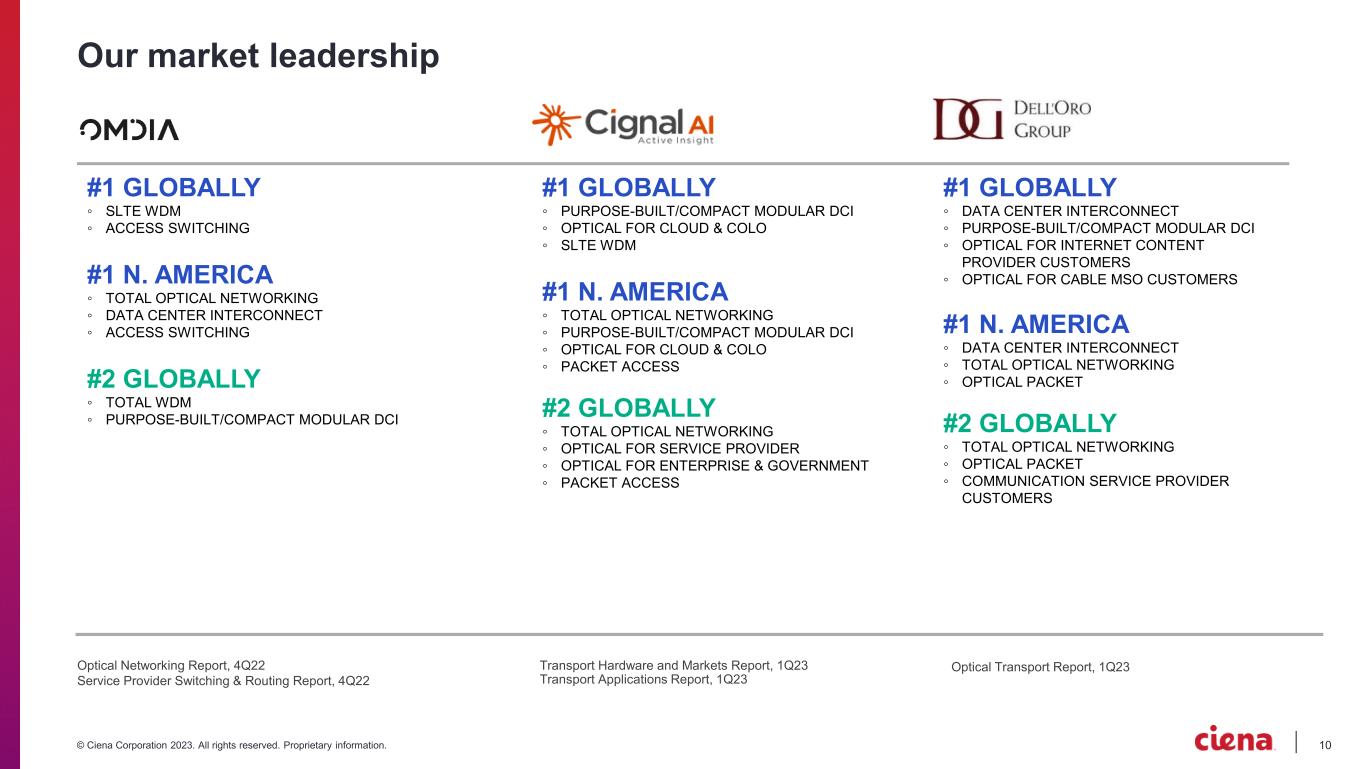
10© Ciena Corporation 2023. All rights reserved. Proprietary information. Our market leadership Optical Transport Report, 1Q23Optical Networking Report, 4Q22 Service Provider Switching & Routing Report, 4Q22 Transport Hardware and Markets Report, 1Q23 Transport Applications Report, 1Q23 #1 GLOBALLY ◦ DATA CENTER INTERCONNECT ◦ PURPOSE-BUILT/COMPACT MODULAR DCI ◦ OPTICAL FOR INTERNET CONTENT PROVIDER CUSTOMERS ◦ OPTICAL FOR CABLE MSO CUSTOMERS #1 N. AMERICA ◦ DATA CENTER INTERCONNECT ◦ TOTAL OPTICAL NETWORKING ◦ OPTICAL PACKET #2 GLOBALLY ◦ TOTAL OPTICAL NETWORKING ◦ OPTICAL PACKET ◦ COMMUNICATION SERVICE PROVIDER CUSTOMERS #1 GLOBALLY ◦ SLTE WDM ◦ ACCESS SWITCHING #1 N. AMERICA ◦ TOTAL OPTICAL NETWORKING ◦ DATA CENTER INTERCONNECT ◦ ACCESS SWITCHING #2 GLOBALLY ◦ TOTAL WDM ◦ PURPOSE-BUILT/COMPACT MODULAR DCI #1 GLOBALLY ◦ PURPOSE-BUILT/COMPACT MODULAR DCI ◦ OPTICAL FOR CLOUD & COLO ◦ SLTE WDM #1 N. AMERICA ◦ TOTAL OPTICAL NETWORKING ◦ PURPOSE-BUILT/COMPACT MODULAR DCI ◦ OPTICAL FOR CLOUD & COLO ◦ PACKET ACCESS #2 GLOBALLY ◦ TOTAL OPTICAL NETWORKING ◦ OPTICAL FOR SERVICE PROVIDER ◦ OPTICAL FOR ENTERPRISE & GOVERNMENT ◦ PACKET ACCESS

11© Ciena Corporation 2023. All rights reserved. Proprietary information. Q2 FY 2023 results
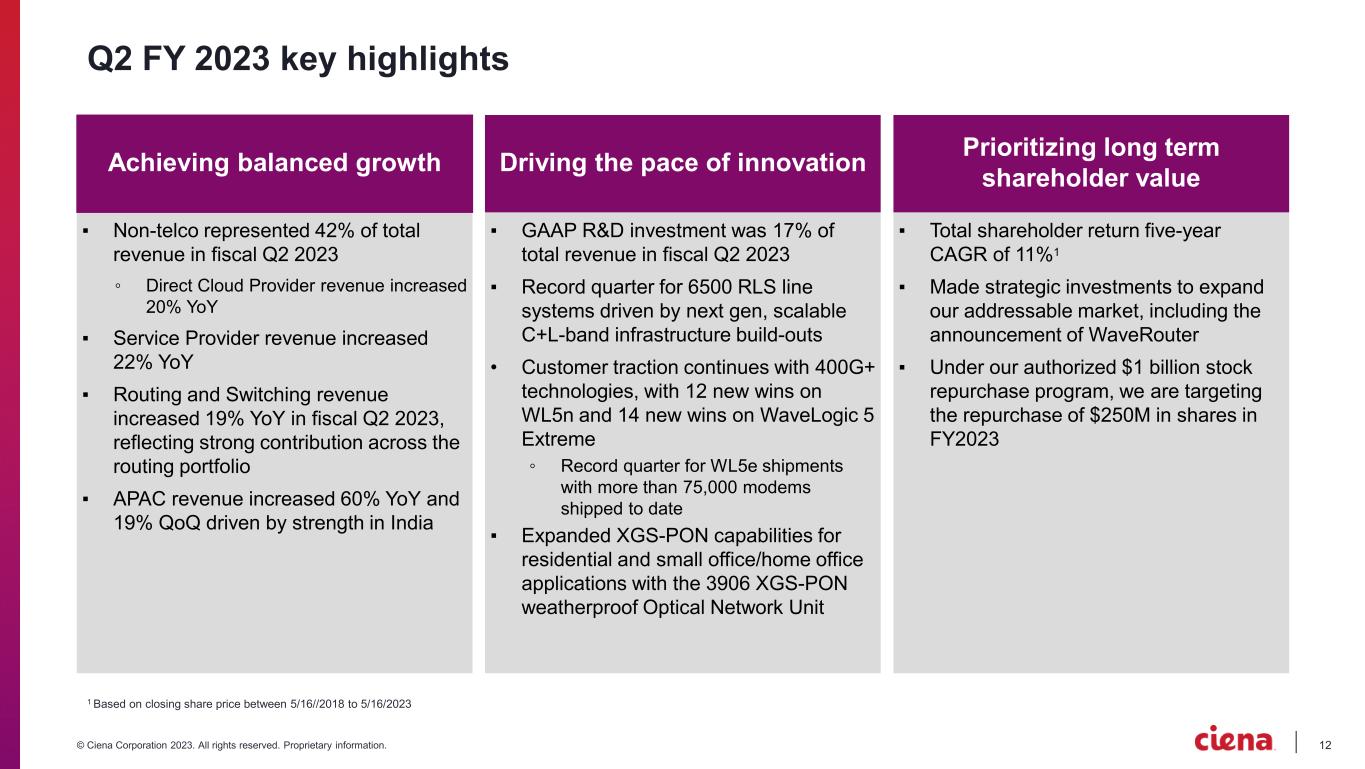
12© Ciena Corporation 2023. All rights reserved. Proprietary information. Q2 FY 2023 key highlights ▪ Non-telco represented 42% of total revenue in fiscal Q2 2023 ◦ Direct Cloud Provider revenue increased 20% YoY ▪ Service Provider revenue increased 22% YoY ▪ Routing and Switching revenue increased 19% YoY in fiscal Q2 2023, reflecting strong contribution across the routing portfolio ▪ APAC revenue increased 60% YoY and 19% QoQ driven by strength in India ▪ GAAP R&D investment was 17% of total revenue in fiscal Q2 2023 ▪ Record quarter for 6500 RLS line systems driven by next gen, scalable C+L-band infrastructure build-outs • Customer traction continues with 400G+ technologies, with 12 new wins on WL5n and 14 new wins on WaveLogic 5 Extreme ◦ Record quarter for WL5e shipments with more than 75,000 modems shipped to date ▪ Expanded XGS-PON capabilities for residential and small office/home office applications with the 3906 XGS-PON weatherproof Optical Network Unit ▪ Total shareholder return five-year CAGR of 11%1 ▪ Made strategic investments to expand our addressable market, including the announcement of WaveRouter ▪ Under our authorized $1 billion stock repurchase program, we are targeting the repurchase of $250M in shares in FY2023 1 Based on closing share price between 5/16//2018 to 5/16/2023 Achieving balanced growth Prioritizing long term shareholder valueDriving the pace of innovation
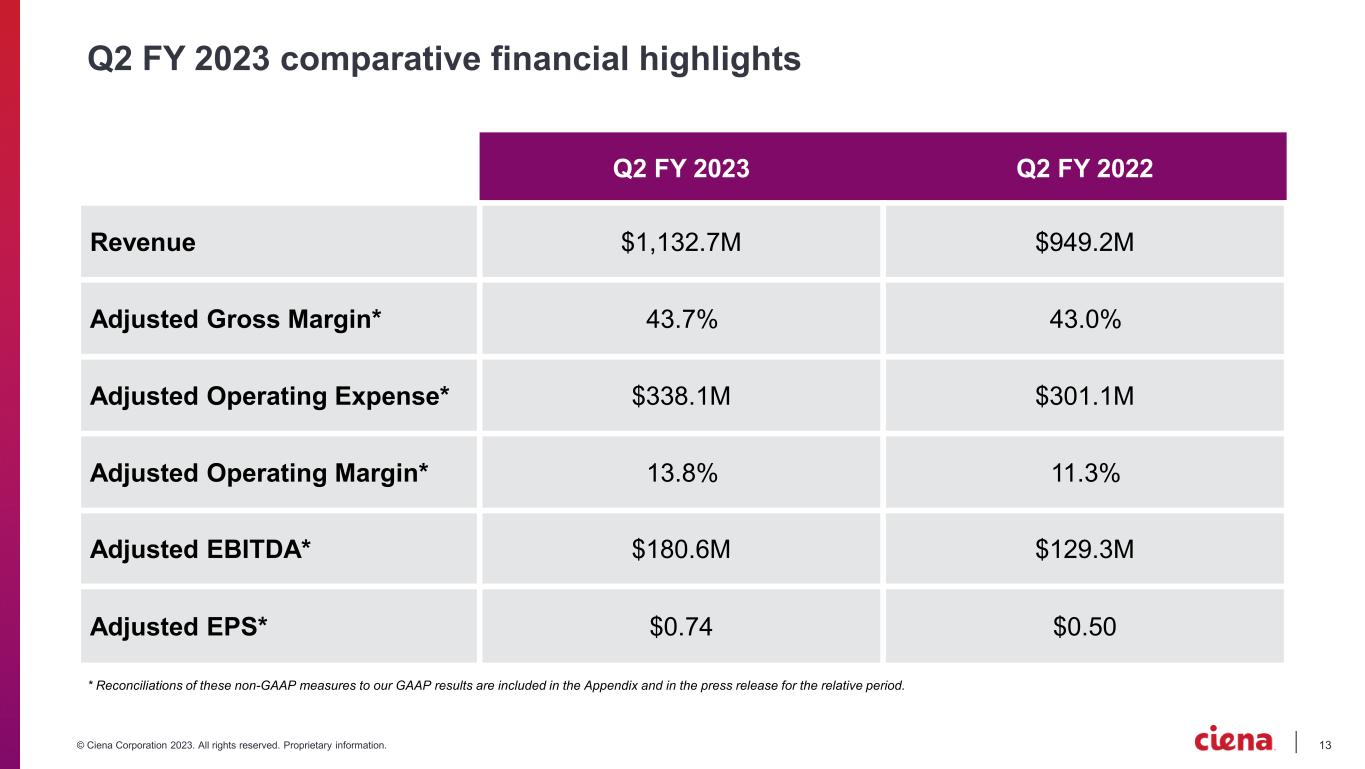
13© Ciena Corporation 2023. All rights reserved. Proprietary information. Q2 FY 2023 comparative financial highlights * Reconciliations of these non-GAAP measures to our GAAP results are included in the Appendix and in the press release for the relative period. Q2 FY 2023 Q2 FY 2022 Revenue $1,132.7M $949.2M Adjusted Gross Margin* 43.7% 43.0% Adjusted Operating Expense* $338.1M $301.1M Adjusted Operating Margin* 13.8% 11.3% Adjusted EBITDA* $180.6M $129.3M Adjusted EPS* $0.74 $0.50
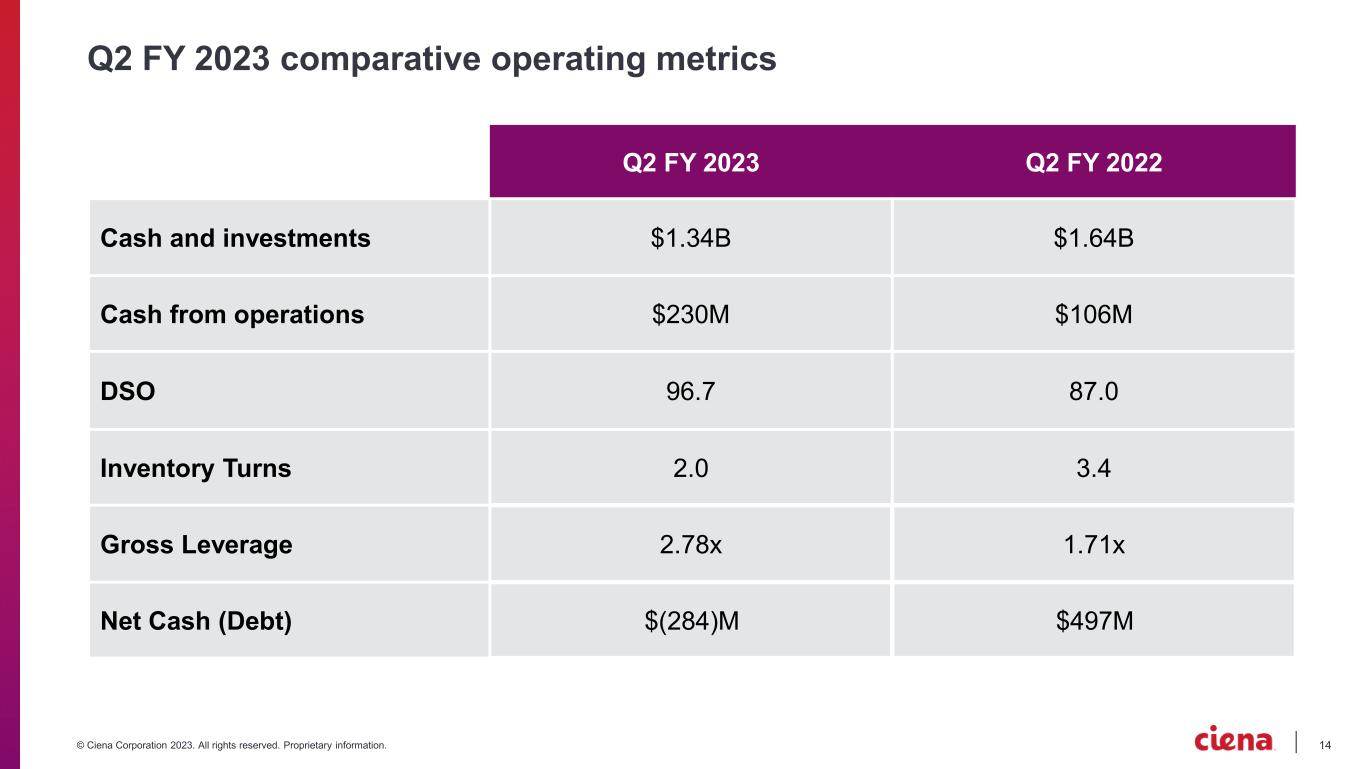
14© Ciena Corporation 2023. All rights reserved. Proprietary information. Q2 FY 2023 comparative operating metrics Q2 FY 2023 Q2 FY 2022 Cash and investments $1.34B $1.64B Cash from operations $230M $106M DSO 96.7 87.0 Inventory Turns 2.0 3.4 Gross Leverage 2.78x 1.71x Net Cash (Debt) $(284)M $497M
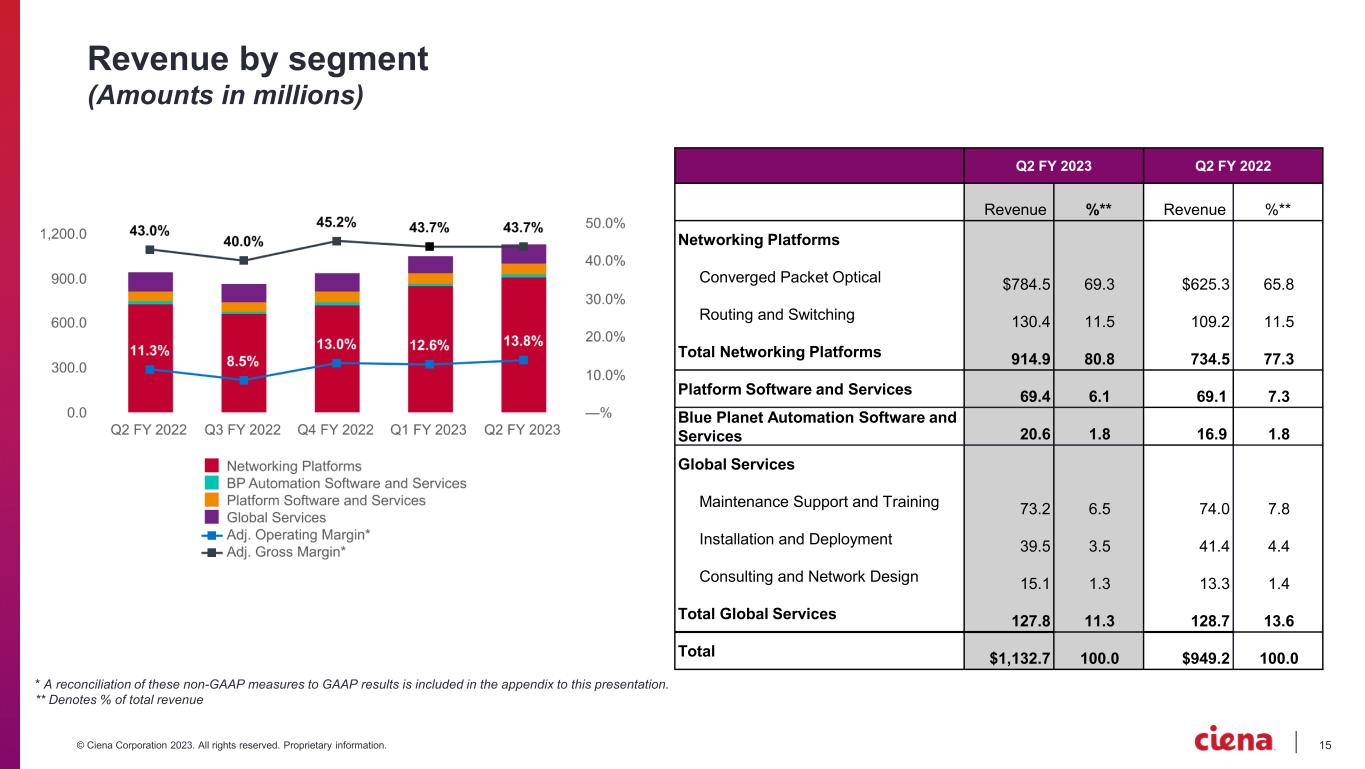
15© Ciena Corporation 2023. All rights reserved. Proprietary information. Revenue by segment (Amounts in millions) Q2 FY 2023 Q2 FY 2022 Revenue %** Revenue %** Networking Platforms Converged Packet Optical $784.5 69.3 $625.3 65.8 Routing and Switching 130.4 11.5 109.2 11.5 Total Networking Platforms 914.9 80.8 734.5 77.3 Platform Software and Services 69.4 6.1 69.1 7.3 Blue Planet Automation Software and Services 20.6 1.8 16.9 1.8 Global Services Maintenance Support and Training 73.2 6.5 74.0 7.8 Installation and Deployment 39.5 3.5 41.4 4.4 Consulting and Network Design 15.1 1.3 13.3 1.4 Total Global Services 127.8 11.3 128.7 13.6 Total $1,132.7 100.0 $949.2 100.0 * A reconciliation of these non-GAAP measures to GAAP results is included in the appendix to this presentation. ** Denotes % of total revenue
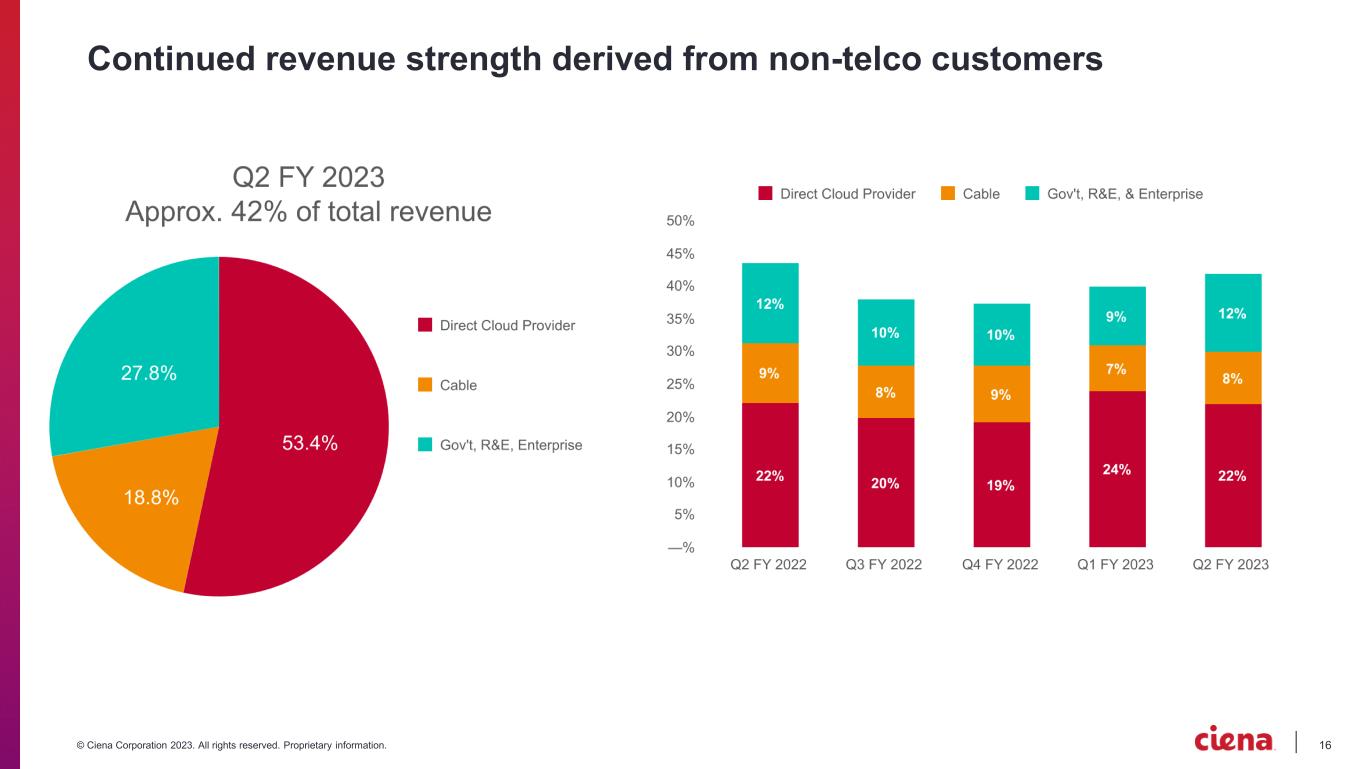
16© Ciena Corporation 2023. All rights reserved. Proprietary information. Continued revenue strength derived from non-telco customers
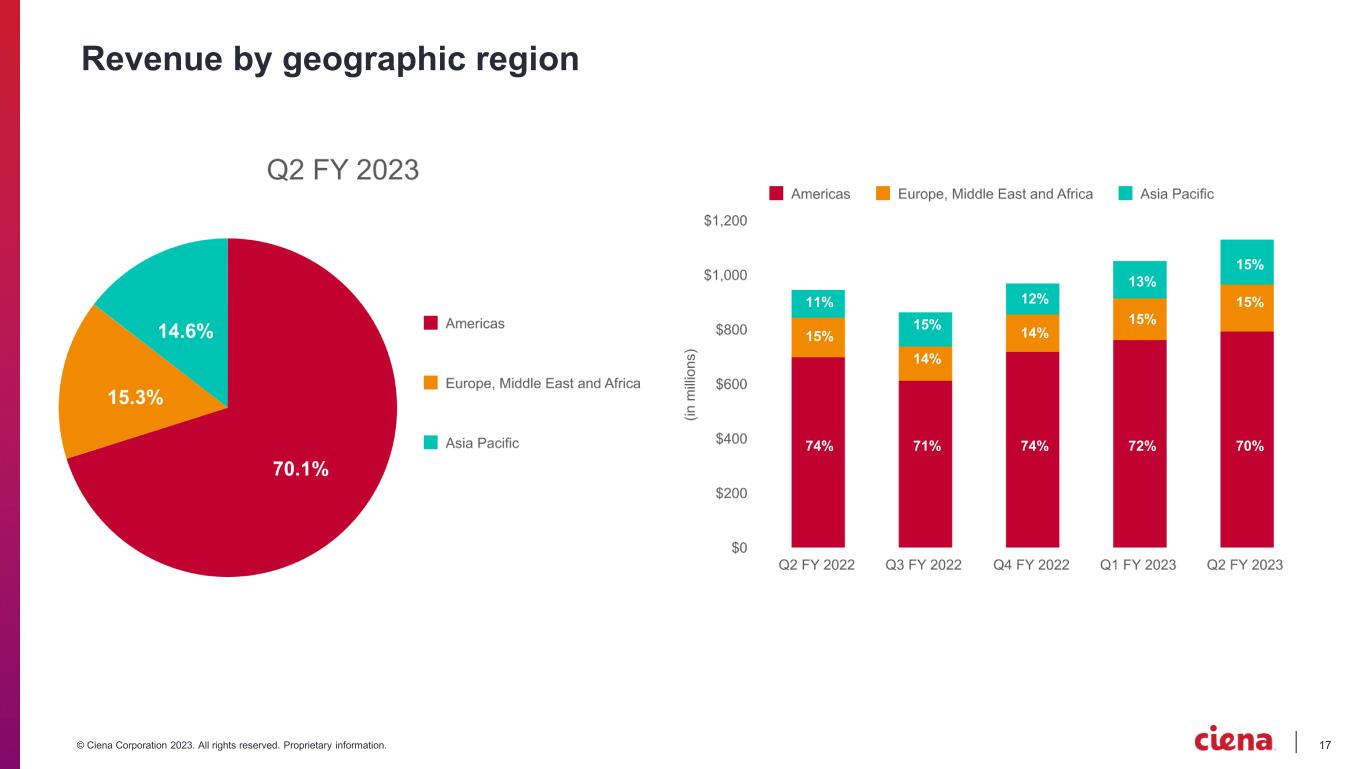
17© Ciena Corporation 2023. All rights reserved. Proprietary information. Revenue by geographic region 11% 15% 13% 15% 14% 15% 74% 71% 74% 72% 14% 12% 15% 15% 70%

18© Ciena Corporation 2023. All rights reserved. Proprietary information. Q2 FY 2023 appendix
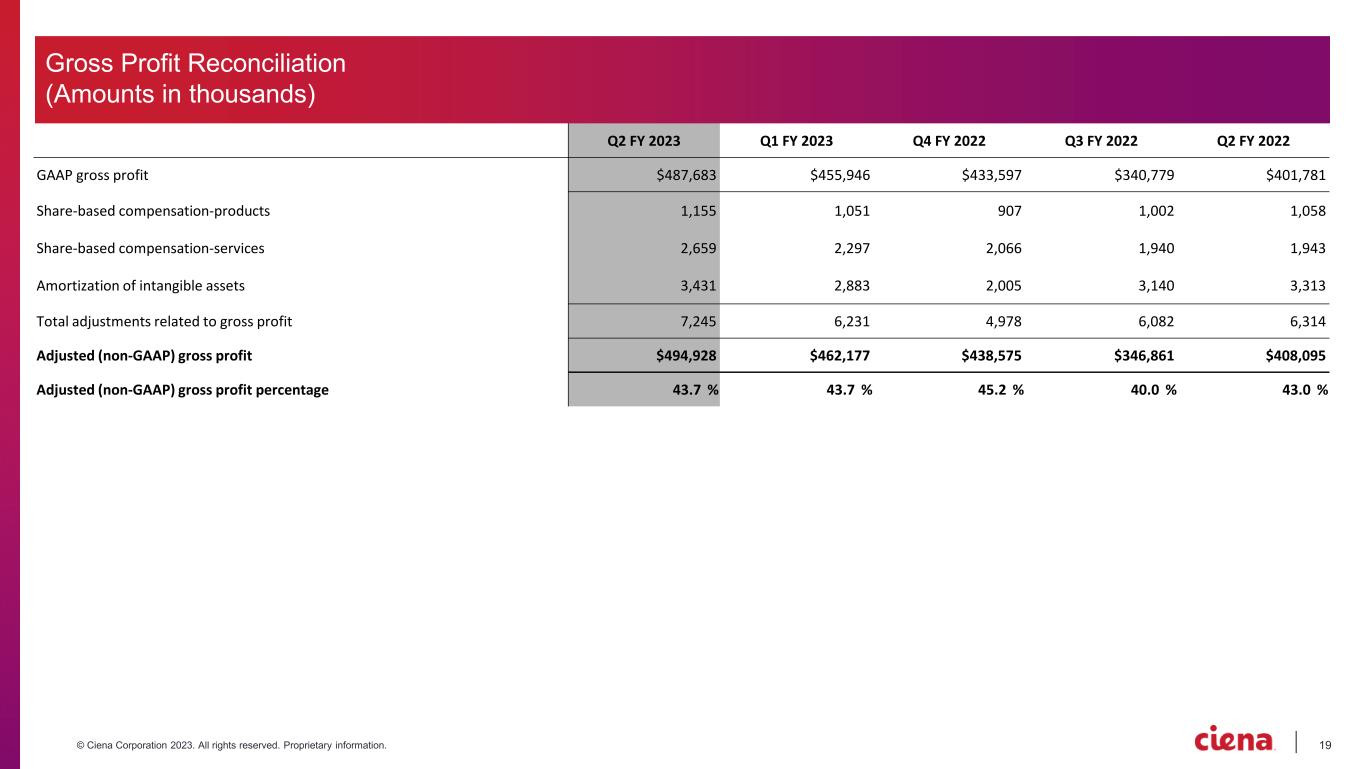
19© Ciena Corporation 2023. All rights reserved. Proprietary information. Q2 FY 2023 Q1 FY 2023 Q4 FY 2022 Q3 FY 2022 Q2 FY 2022 GAAP gross profit $487,683 $455,946 $433,597 $340,779 $401,781 Share-based compensation-products 1,155 1,051 907 1,002 1,058 Share-based compensation-services 2,659 2,297 2,066 1,940 1,943 Amortization of intangible assets 3,431 2,883 2,005 3,140 3,313 Total adjustments related to gross profit 7,245 6,231 4,978 6,082 6,314 Adjusted (non-GAAP) gross profit $494,928 $462,177 $438,575 $346,861 $408,095 Adjusted (non-GAAP) gross profit percentage 43.7 % 43.7 % 45.2 % 40.0 % 43.0 % Gross Profit Reconciliation (Amounts in thousands)
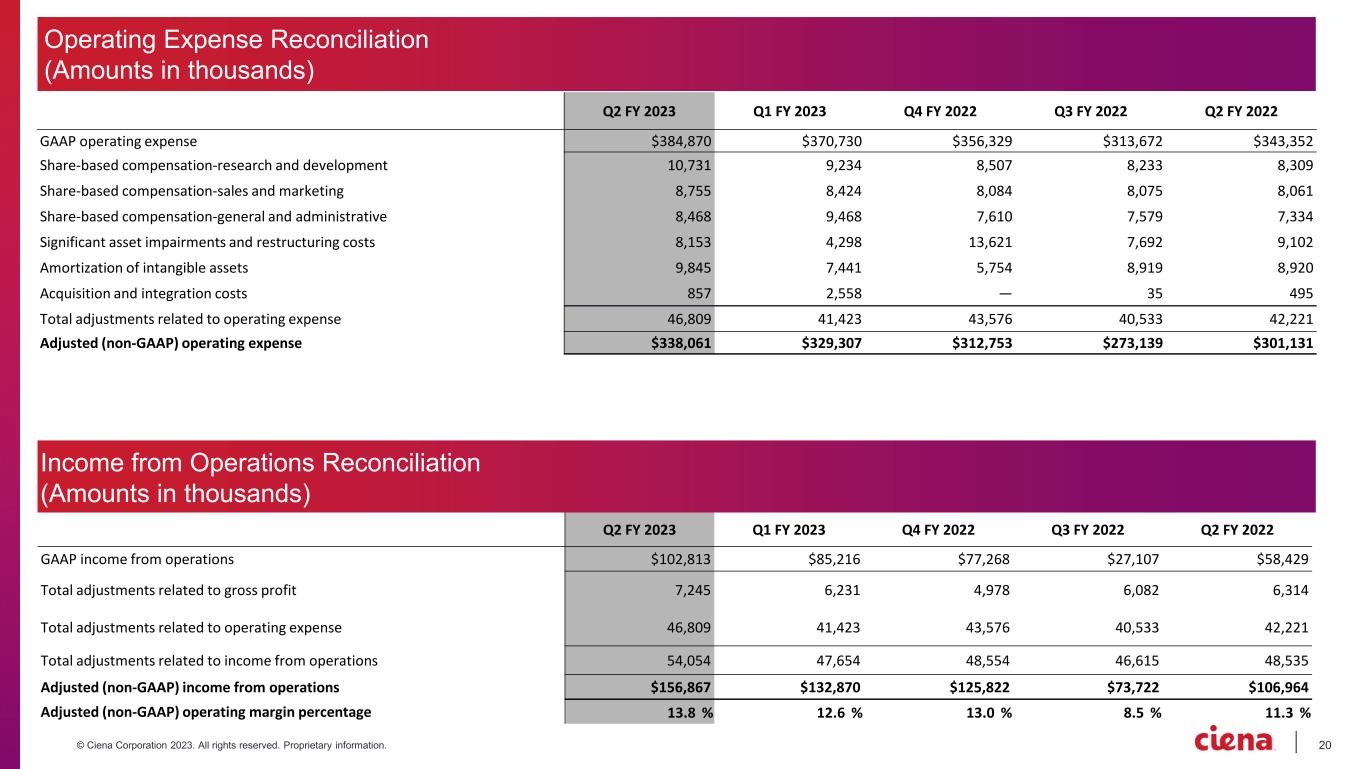
20© Ciena Corporation 2023. All rights reserved. Proprietary information. Q2 FY 2023 Q1 FY 2023 Q4 FY 2022 Q3 FY 2022 Q2 FY 2022 GAAP operating expense $384,870 $370,730 $356,329 $313,672 $343,352 Share-based compensation-research and development 10,731 9,234 8,507 8,233 8,309 Share-based compensation-sales and marketing 8,755 8,424 8,084 8,075 8,061 Share-based compensation-general and administrative 8,468 9,468 7,610 7,579 7,334 Significant asset impairments and restructuring costs 8,153 4,298 13,621 7,692 9,102 Amortization of intangible assets 9,845 7,441 5,754 8,919 8,920 Acquisition and integration costs 857 2,558 — 35 495 Total adjustments related to operating expense 46,809 41,423 43,576 40,533 42,221 Adjusted (non-GAAP) operating expense $338,061 $329,307 $312,753 $273,139 $301,131 Q2 FY 2023 Q1 FY 2023 Q4 FY 2022 Q3 FY 2022 Q2 FY 2022 GAAP income from operations $102,813 $85,216 $77,268 $27,107 $58,429 Total adjustments related to gross profit 7,245 6,231 4,978 6,082 6,314 Total adjustments related to operating expense 46,809 41,423 43,576 40,533 42,221 Total adjustments related to income from operations 54,054 47,654 48,554 46,615 48,535 Adjusted (non-GAAP) income from operations $156,867 $132,870 $125,822 $73,722 $106,964 Adjusted (non-GAAP) operating margin percentage 13.8 % 12.6 % 13.0 % 8.5 % 11.3 % Operating Expense Reconciliation (Amounts in thousands) Income from Operations Reconciliation (Amounts in thousands)
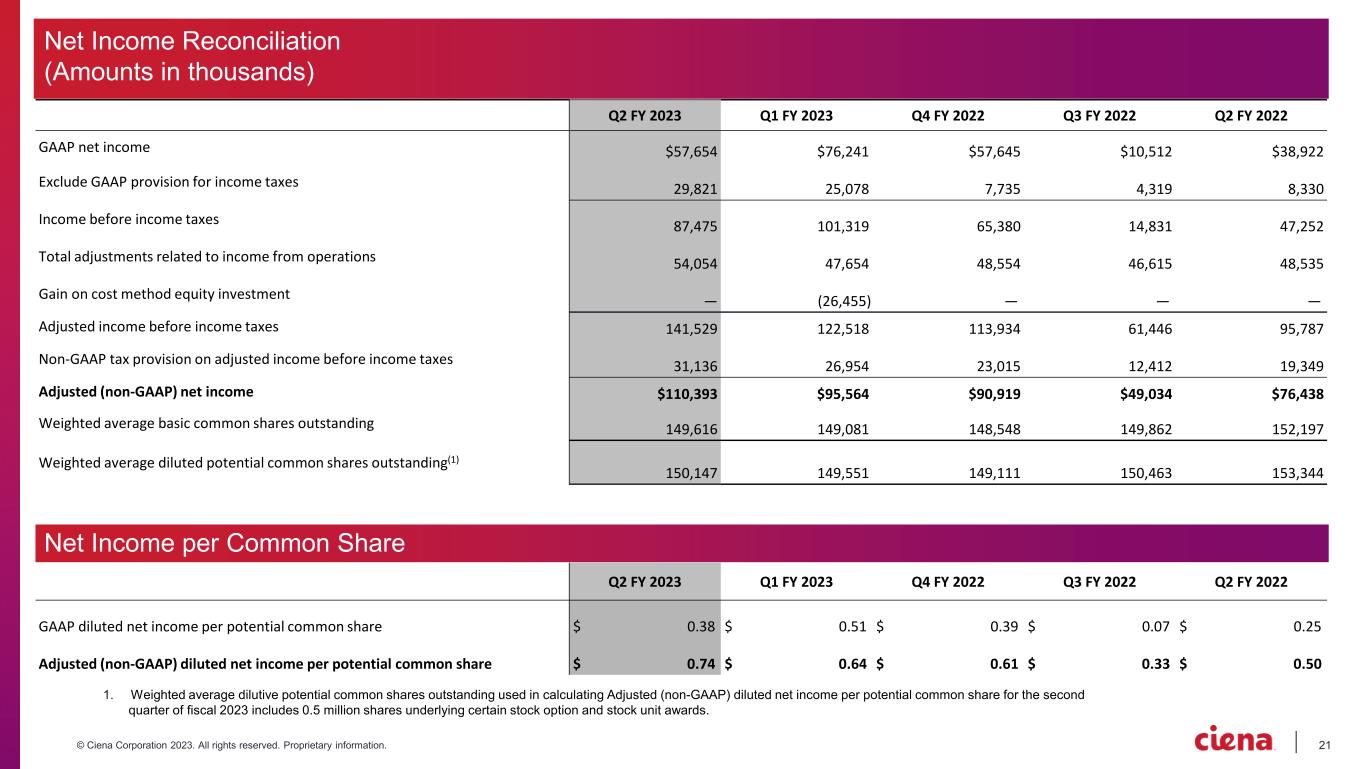
21© Ciena Corporation 2023. All rights reserved. Proprietary information. Q2 FY 2023 Q1 FY 2023 Q4 FY 2022 Q3 FY 2022 Q2 FY 2022 GAAP net income $57,654 $76,241 $57,645 $10,512 $38,922 Exclude GAAP provision for income taxes 29,821 25,078 7,735 4,319 8,330 Income before income taxes 87,475 101,319 65,380 14,831 47,252 Total adjustments related to income from operations 54,054 47,654 48,554 46,615 48,535 Gain on cost method equity investment — (26,455) — — — Adjusted income before income taxes 141,529 122,518 113,934 61,446 95,787 Non-GAAP tax provision on adjusted income before income taxes 31,136 26,954 23,015 12,412 19,349 Adjusted (non-GAAP) net income $110,393 $95,564 $90,919 $49,034 $76,438 Weighted average basic common shares outstanding 149,616 149,081 148,548 149,862 152,197 Weighted average diluted potential common shares outstanding(1) 150,147 149,551 149,111 150,463 153,344 Q2 FY 2023 Q1 FY 2023 Q4 FY 2022 Q3 FY 2022 Q2 FY 2022 GAAP diluted net income per potential common share $ 0.38 $ 0.51 $ 0.39 $ 0.07 $ 0.25 Adjusted (non-GAAP) diluted net income per potential common share $ 0.74 $ 0.64 $ 0.61 $ 0.33 $ 0.50 1. Weighted average dilutive potential common shares outstanding used in calculating Adjusted (non-GAAP) diluted net income per potential common share for the second quarter of fiscal 2023 includes 0.5 million shares underlying certain stock option and stock unit awards. Net Income Reconciliation (Amounts in thousands) Net Income per Common Share
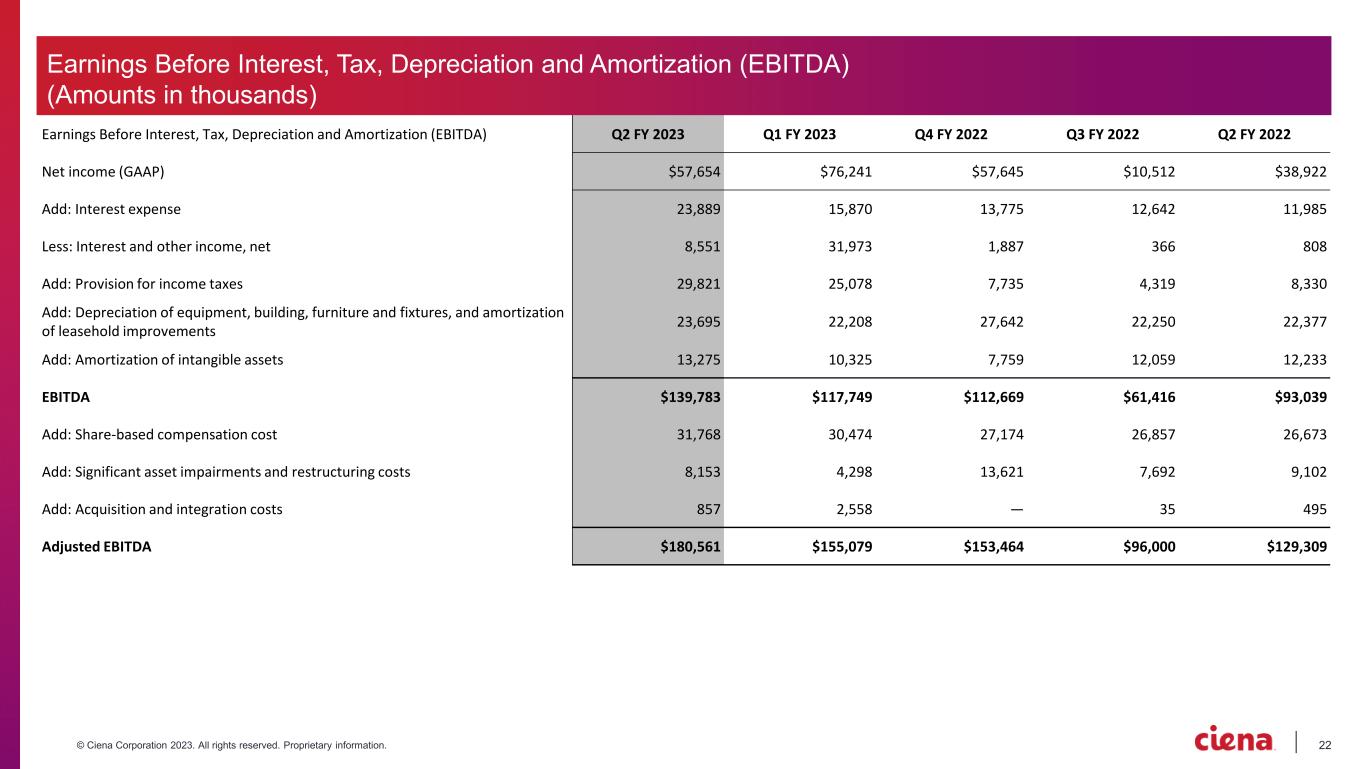
22© Ciena Corporation 2023. All rights reserved. Proprietary information. Earnings Before Interest, Tax, Depreciation and Amortization (EBITDA) Q2 FY 2023 Q1 FY 2023 Q4 FY 2022 Q3 FY 2022 Q2 FY 2022 Net income (GAAP) $57,654 $76,241 $57,645 $10,512 $38,922 Add: Interest expense 23,889 15,870 13,775 12,642 11,985 Less: Interest and other income, net 8,551 31,973 1,887 366 808 Add: Provision for income taxes 29,821 25,078 7,735 4,319 8,330 Add: Depreciation of equipment, building, furniture and fixtures, and amortization of leasehold improvements 23,695 22,208 27,642 22,250 22,377 Add: Amortization of intangible assets 13,275 10,325 7,759 12,059 12,233 EBITDA $139,783 $117,749 $112,669 $61,416 $93,039 Add: Share-based compensation cost 31,768 30,474 27,174 26,857 26,673 Add: Significant asset impairments and restructuring costs 8,153 4,298 13,621 7,692 9,102 Add: Acquisition and integration costs 857 2,558 — 35 495 Adjusted EBITDA $180,561 $155,079 $153,464 $96,000 $129,309 Earnings Before Interest, Tax, Depreciation and Amortization (EBITDA) (Amounts in thousands)