
Copyright © Ciena Corporation 2021. All rights reserved. Proprietary information. Ciena Corporation Period ended May 1, 2021 June 3, 2021 Earnings Presentation
2Copyright © Ciena Corporation 2021. All rights reserved. Proprietary information. Forward-looking statements and non-GAAP measures Information in this presentation and related comments of presenters contain a number of forward-looking statements that involve risks and uncertainties. These statements are based on current expectations, forecasts, assumptions and other information available to the Company as of the date hereof. Forward-looking statements include Ciena’s prospective financial results, return of capital plans, business strategies, expectations about its addressable markets and market share, and business outlook for future periods, as well as statements regarding Ciena’s expectations, beliefs, intentions or strategies regarding the future. Often, these can be identified by forward-looking words such as “target” “anticipate,” “believe,” “could,” “estimate,” “expect,” “intend,” “may,” “should,” “will,” “plan,” “predict,” “potential,” “project, “continue,” and “would” or similar words. Ciena's actual results, performance or events may differ materially from these forward-looking statements made or implied due to a number of risks and uncertainties relating to Ciena's business, including: the effect of broader economic and market conditions on our customers and their business; our ability to execute successfully our business and growth strategies; the duration and severity of the COVID-19 pandemic and its impact on macroeconomic conditions, economic activity, demand for our technology solutions, short- and long-term changes in customer or end user needs, continuity of supply chain, our business operations, liquidity and financial results; changes in network spending or network strategy by our customers; seasonality and the timing and size of customer orders, including our ability to recognize revenue relating to such sales; the level of competitive pressure we encounter; the product, customer and geographic mix of sales within the period; supply chain disruptions and the level of success relating to efforts to optimize Ciena's operations; changes in foreign currency exchange rates affecting revenue and operating expense; factors beyond our control such as natural disasters, acts of war or terrorism, and public health emergencies, including the COVID-19 pandemic; the impact of the Tax Cuts and Jobs Act; changes in tax or trade regulations, including the imposition of tariffs, duties or efforts to withdraw from or materially modify international trade agreements; changes in estimates of prospective income tax rates and any adjustments to Ciena's provisional estimates whether related to further guidance, analysis or otherwise; and the other risk factors disclosed in Ciena’s periodic reports filed with the Securities and Exchange Commission (SEC) including Ciena’s Annual Report on Form 10-K filed with the SEC on December 18, 2020 and Ciena’s Quarterly Report on Form 10-Q for the second quarter of fiscal 2021 to be filed with the SEC. All information, statements, and projections in this presentation and the related earnings call speak only as of the date of this presentation and related earnings call. Ciena assumes no obligation to update any forward-looking or other information included in this presentation or related earnings calls, whether as a result of new information, future events or otherwise. In addition, this presentation includes historical, and may include prospective, non-GAAP measures of Ciena’s gross margin, operating expense, operating profit, EBITDA, net income, and net income per share. These measures are not intended to be a substitute for financial information presented in accordance with GAAP. A reconciliation of non- GAAP measures used in this presentation to Ciena’s GAAP results for the relevant period can be found in the Appendix to this presentation. Additional information can also be found in our press release filed this morning and in our reports on Forms 10-K and 10-Q filed with the Securities and Exchange Commission.
3Copyright © Ciena Corporation 2021. All rights reserved. Proprietary information. COVID-19 response • Prioritizing health of employees and following CDC guidance for employers • The vast majority of our employees are working remotely • Instituted pandemic employee benefits • Enhanced our corporate charitable matching program for employee donations and volunteering Result: Our employees have excelled through their continued focus, strength and kindness Safety and community Financial strengthBusiness continuity • Supply chain design and business continuity planning has enabled us to continue to support customers and mitigate disruption • Significant IT investment in digital platforms and virtual collaboration tools has enabled a seamless transition to remote working Result: We are well positioned to manage through the current set of challenges presented by COVID-19 • We have a strong balance sheet and have demonstrated solid cash flow generation over time • In light of our confidence around cash generation, we reinstated our share repurchase plan starting in the first quarter of 2021 Result: Our financial strength provides long-term resiliency and differentiated flexibility to support our business As COVID-19 challenges vary around the world, we remain vigilant and committed to our customers and employees

4Copyright © Ciena Corporation 2021. All rights reserved. Proprietary information. Q2 FY 2021 results
5Copyright © Ciena Corporation 2021. All rights reserved. Proprietary information. Q2 FY 2021 key achievements • WaveLogic™ 5 Extreme (WL5e) added 16 new wins, bringing our total number of revenue customers to 95 • Blue Planet has roughly 200 total customers for our automation software and services portfolio ▪ Roughly a dozen wins in our Routing and Switching portfolio including global Tier 1 service providers, MSOs and enterprises We are driving the pace of innovation We are committed to our people and communities We have a durable business and financial model • Despite headwinds from COVID-19 our profitability has remained strong • Adj. operating margin* was 15.8% • Our balance sheet represents a competitive advantage • Ended the quarter with over $1.4B in cash and investments • Leverage remains below our target level • Launched Digital Inclusion Commitment initiative with a goal to provide opportunities for 100,000 underserved students in our global communities • Announced innovative programs with customers to promote our digital inclusion mission • Supporting our employees through empowering programs, a focus on well-being and commitment to diversity, inclusion and belonging * A reconciliation of these non-GAAP measures to our GAAP results is included in the appendix to this presentation. In this challenging period we continued to drive the pace of innovation and demonstrate resilience while focusing on kindness to others

6Copyright © Ciena Corporation 2021. All rights reserved. Proprietary information. Market context
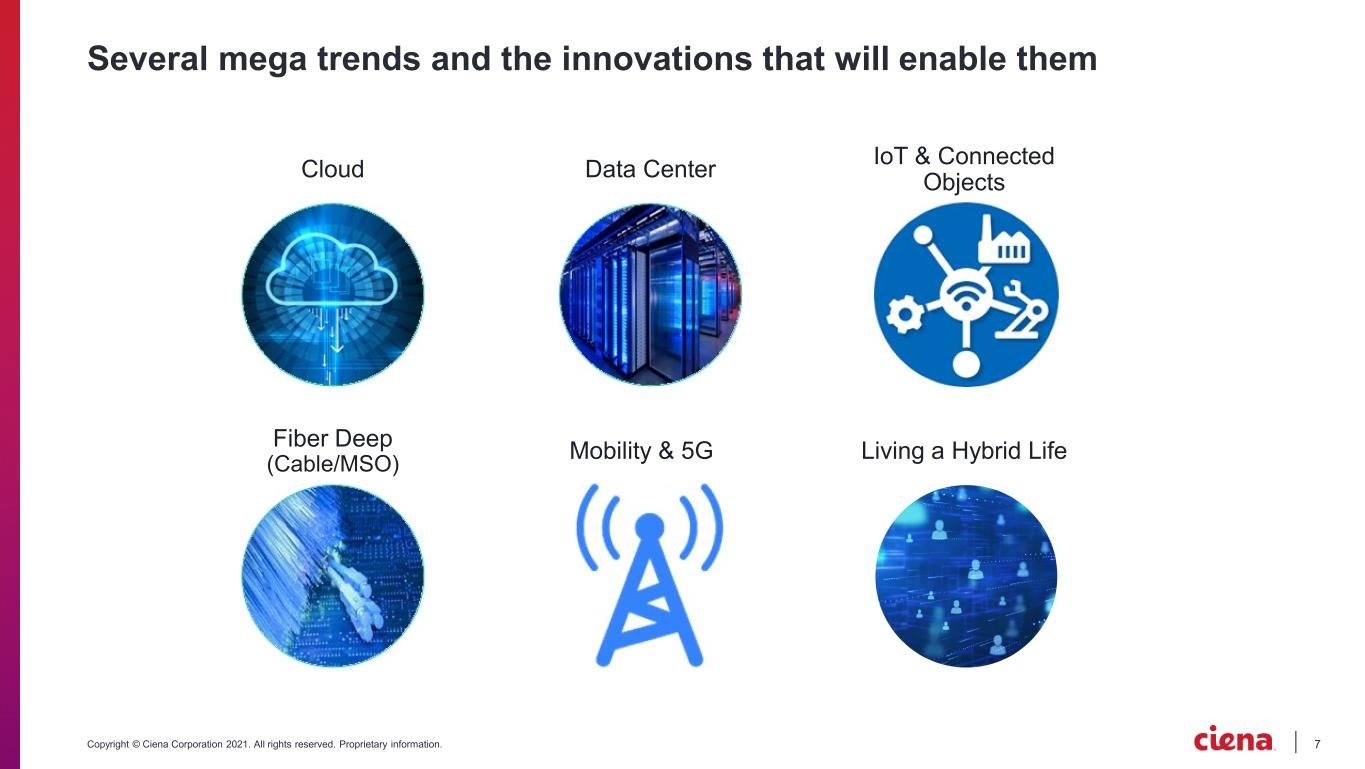
7Copyright © Ciena Corporation 2021. All rights reserved. Proprietary information. Several mega trends and the innovations that will enable them Fiber Deep (Cable/MSO) Cloud Data Center Mobility & 5G IoT & Connected Objects Living a Hybrid Life
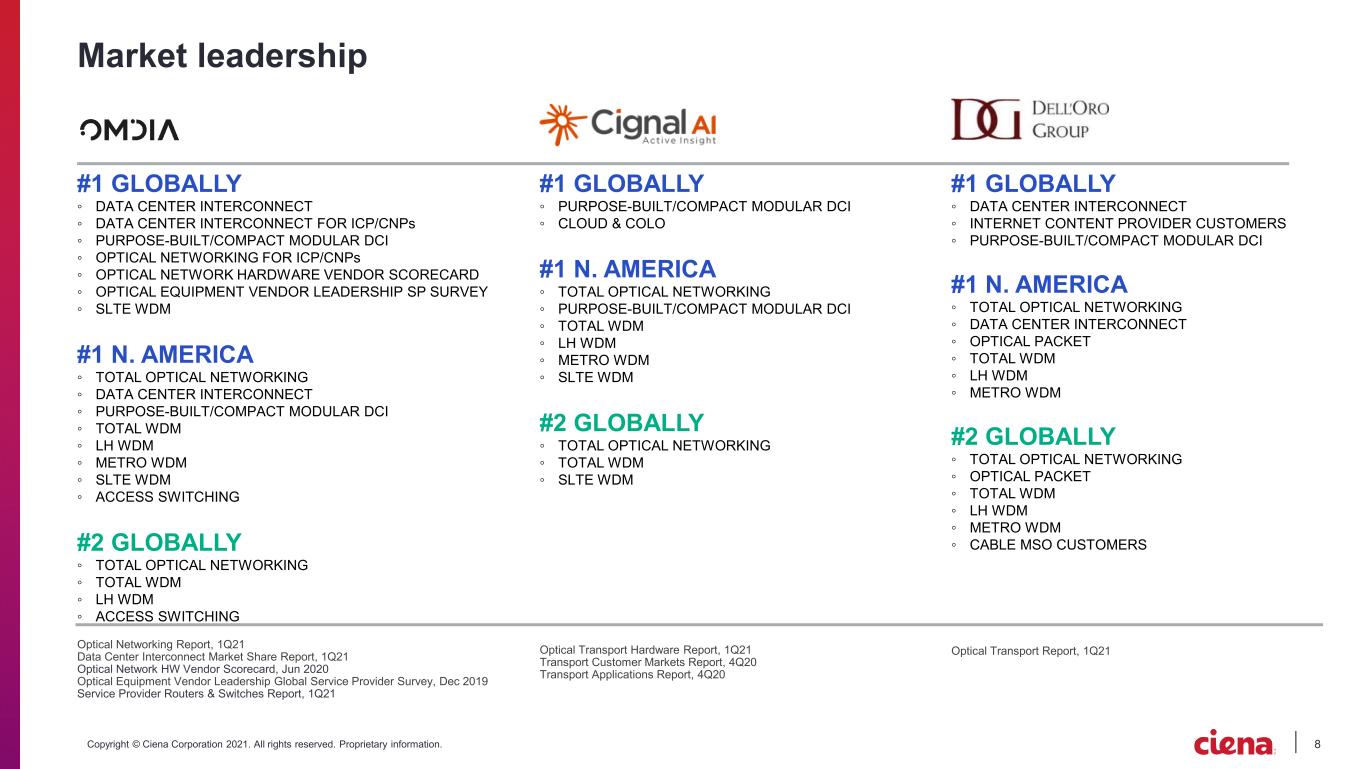
8Copyright © Ciena Corporation 2021. All rights reserved. Proprietary information. #1 GLOBALLY ◦ DATA CENTER INTERCONNECT ◦ INTERNET CONTENT PROVIDER CUSTOMERS ◦ PURPOSE-BUILT/COMPACT MODULAR DCI #1 N. AMERICA ◦ TOTAL OPTICAL NETWORKING ◦ DATA CENTER INTERCONNECT ◦ OPTICAL PACKET ◦ TOTAL WDM ◦ LH WDM ◦ METRO WDM #2 GLOBALLY ◦ TOTAL OPTICAL NETWORKING ◦ OPTICAL PACKET ◦ TOTAL WDM ◦ LH WDM ◦ METRO WDM ◦ CABLE MSO CUSTOMERS #1 GLOBALLY ◦ DATA CENTER INTERCONNECT ◦ DATA CENTER INTERCONNECT FOR ICP/CNPs ◦ PURPOSE-BUILT/COMPACT MODULAR DCI ◦ OPTICAL NETWORKING FOR ICP/CNPs ◦ OPTICAL NETWORK HARDWARE VENDOR SCORECARD ◦ OPTICAL EQUIPMENT VENDOR LEADERSHIP SP SURVEY ◦ SLTE WDM #1 N. AMERICA ◦ TOTAL OPTICAL NETWORKING ◦ DATA CENTER INTERCONNECT ◦ PURPOSE-BUILT/COMPACT MODULAR DCI ◦ TOTAL WDM ◦ LH WDM ◦ METRO WDM ◦ SLTE WDM ◦ ACCESS SWITCHING #2 GLOBALLY ◦ TOTAL OPTICAL NETWORKING ◦ TOTAL WDM ◦ LH WDM ◦ ACCESS SWITCHING #1 GLOBALLY ◦ PURPOSE-BUILT/COMPACT MODULAR DCI ◦ CLOUD & COLO #1 N. AMERICA ◦ TOTAL OPTICAL NETWORKING ◦ PURPOSE-BUILT/COMPACT MODULAR DCI ◦ TOTAL WDM ◦ LH WDM ◦ METRO WDM ◦ SLTE WDM #2 GLOBALLY ◦ TOTAL OPTICAL NETWORKING ◦ TOTAL WDM ◦ SLTE WDM Market leadership Optical Transport Report, 1Q21Optical Networking Report, 1Q21Data Center Interconnect Market Share Report, 1Q21 Optical Network HW Vendor Scorecard, Jun 2020 Optical Equipment Vendor Leadership Global Service Provider Survey, Dec 2019 Service Provider Routers & Switches Report, 1Q21 Optical Transport Hardware Report, 1Q21 Transport Customer Markets Report, 4Q20 Transport Applications Report, 4Q20
9Copyright © Ciena Corporation 2021. All rights reserved. Proprietary information. Ciena’s Adaptive Network™ vision and portfolio
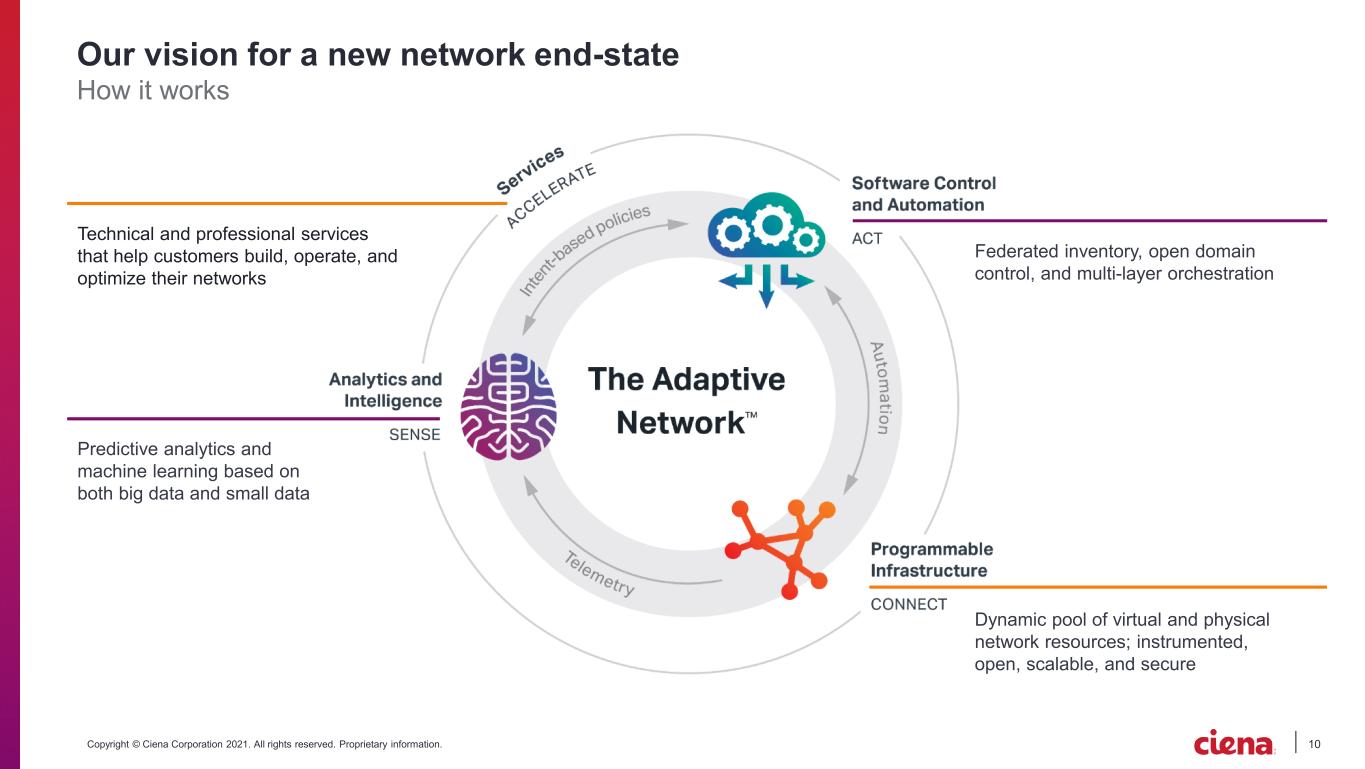
10Copyright © Ciena Corporation 2021. All rights reserved. Proprietary information. Technical and professional services that help customers build, operate, and optimize their networks Predictive analytics and machine learning based on both big data and small data Dynamic pool of virtual and physical network resources; instrumented, open, scalable, and secure Federated inventory, open domain control, and multi-layer orchestration Our vision for a new network end-state How it works
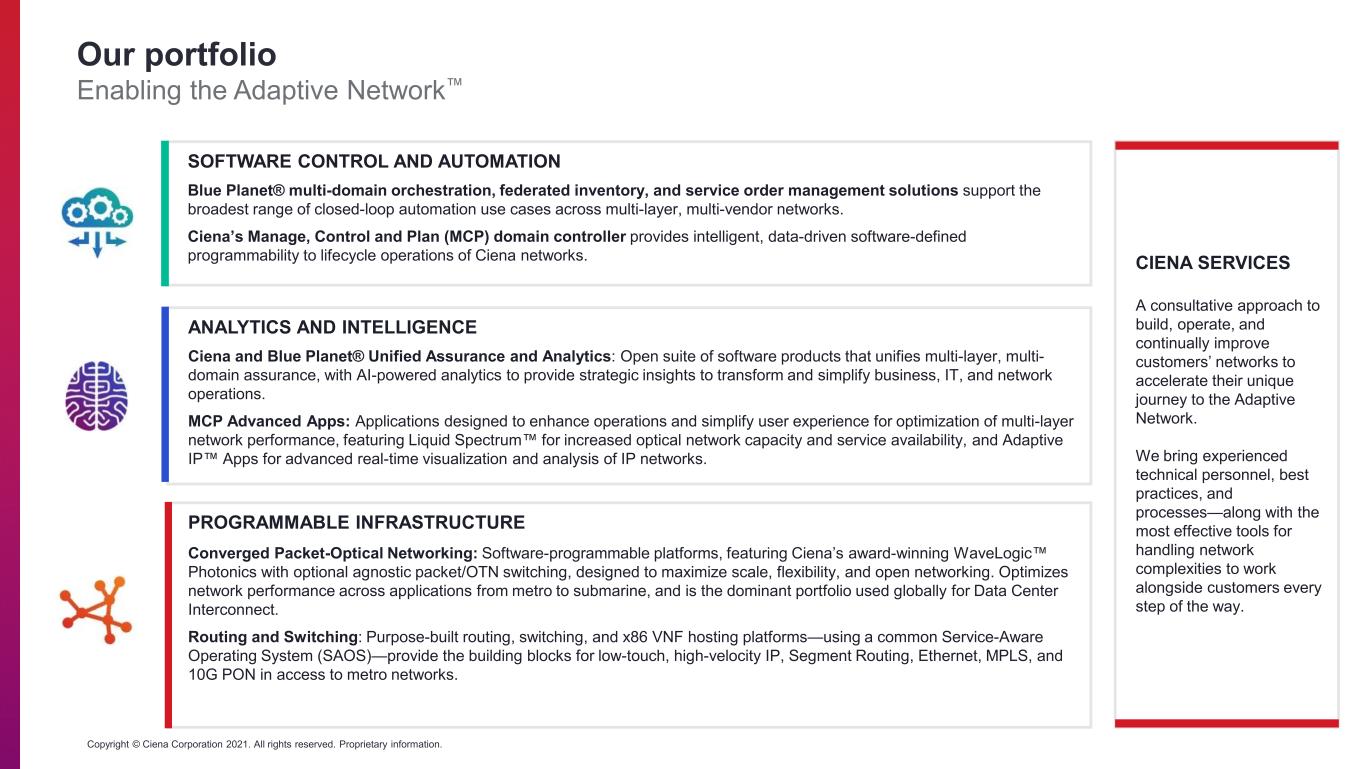
11Copyright © Ciena Corporation 2021. All rights reserved. Proprietary information. Our portfolio Enabling the Adaptive Network™ CIENA SERVICES A consultative approach to build, operate, and continually improve customers’ networks to accelerate their unique journey to the Adaptive Network. We bring experienced technical personnel, best practices, and processes—along with the most effective tools for handling network complexities to work alongside customers every step of the way. ANALYTICS AND INTELLIGENCE Ciena and Blue Planet® Unified Assurance and Analytics: Open suite of software products that unifies multi-layer, multi- domain assurance, with AI-powered analytics to provide strategic insights to transform and simplify business, IT, and network operations. MCP Advanced Apps: Applications designed to enhance operations and simplify user experience for optimization of multi-layer network performance, featuring Liquid Spectrum™ for increased optical network capacity and service availability, and Adaptive IP™ Apps for advanced real-time visualization and analysis of IP networks. PROGRAMMABLE INFRASTRUCTURE Converged Packet-Optical Networking: Software-programmable platforms, featuring Ciena’s award-winning WaveLogic™ Photonics with optional agnostic packet/OTN switching, designed to maximize scale, flexibility, and open networking. Optimizes network performance across applications from metro to submarine, and is the dominant portfolio used globally for Data Center Interconnect. Routing and Switching: Purpose-built routing, switching, and x86 VNF hosting platforms—using a common Service-Aware Operating System (SAOS)—provide the building blocks for low-touch, high-velocity IP, Segment Routing, Ethernet, MPLS, and 10G PON in access to metro networks. SOFTWARE CONTROL AND AUTOMATION Blue Planet® multi-domain orchestration, federated inventory, and service order management solutions support the broadest range of closed-loop automation use cases across multi-layer, multi-vendor networks. Ciena’s Manage, Control and Plan (MCP) domain controller provides intelligent, data-driven software-defined programmability to lifecycle operations of Ciena networks.

12Copyright © Ciena Corporation 2021. All rights reserved. Proprietary information. Q2 FY 2021 results
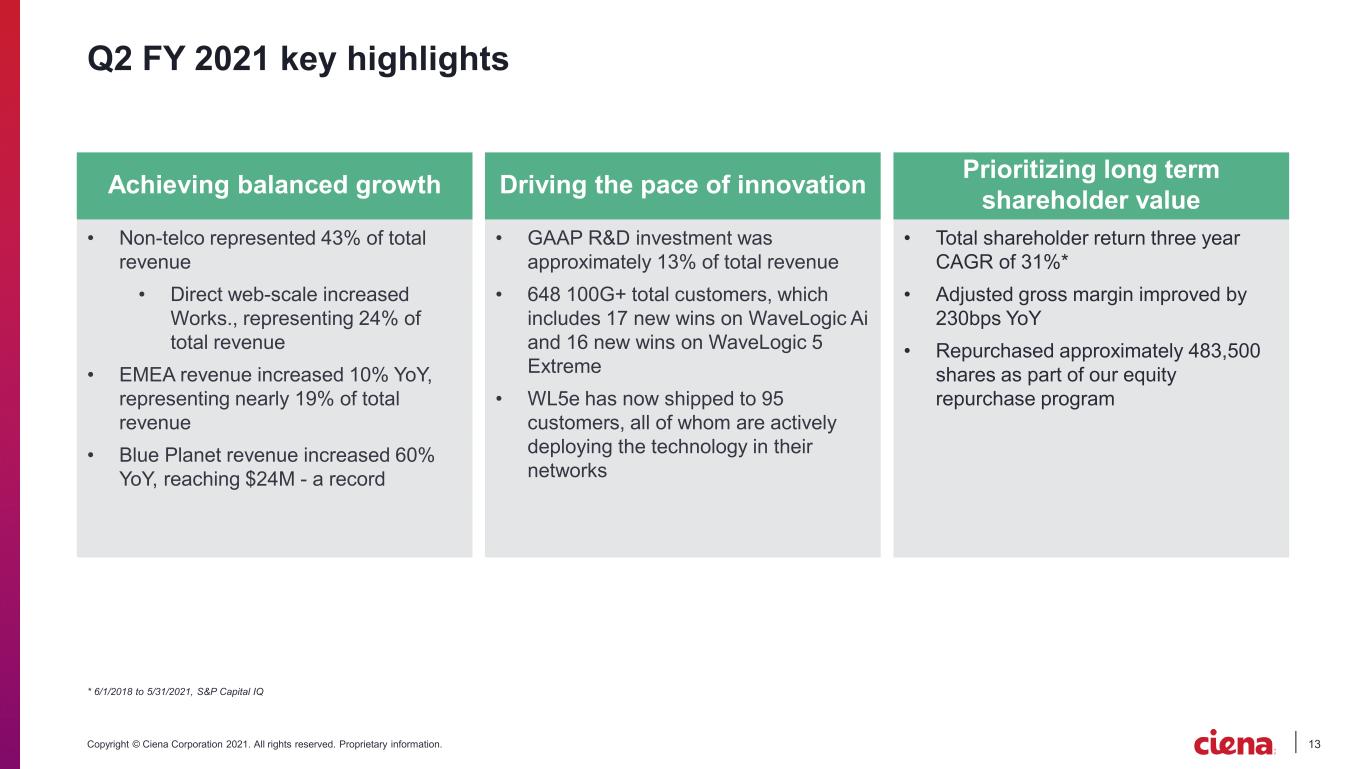
13Copyright © Ciena Corporation 2021. All rights reserved. Proprietary information. Q2 FY 2021 key highlights • Non-telco represented 43% of total revenue • Direct web-scale increased Works., representing 24% of total revenue • EMEA revenue increased 10% YoY, representing nearly 19% of total revenue • Blue Planet revenue increased 60% YoY, reaching $24M - a record Achieving balanced growth Prioritizing long term shareholder valueDriving the pace of innovation • GAAP R&D investment was approximately 13% of total revenue • 648 100G+ total customers, which includes 17 new wins on WaveLogic Ai and 16 new wins on WaveLogic 5 Extreme • WL5e has now shipped to 95 customers, all of whom are actively deploying the technology in their networks • Total shareholder return three year CAGR of 31%* • Adjusted gross margin improved by 230bps YoY • Repurchased approximately 483,500 shares as part of our equity repurchase program * 6/1/2018 to 5/31/2021, S&P Capital IQ
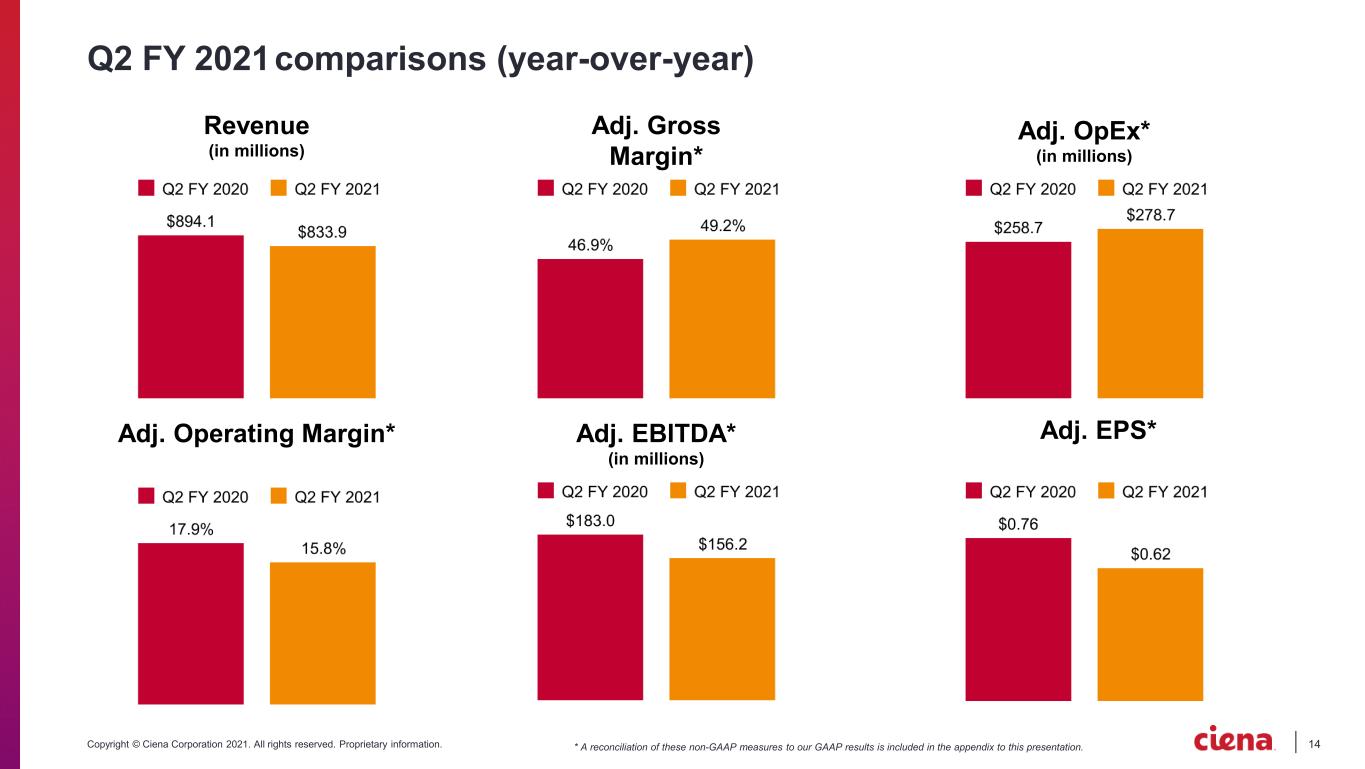
14Copyright © Ciena Corporation 2021. All rights reserved. Proprietary information. Q2 FY 2021comparisons (year-over-year) * A reconciliation of these non-GAAP measures to our GAAP results is included in the appendix to this presentation. Revenue (in millions) Adj. Gross Margin* Adj. Operating Margin* Adj. OpEx* (in millions) Adj. EBITDA* (in millions) Adj. EPS*
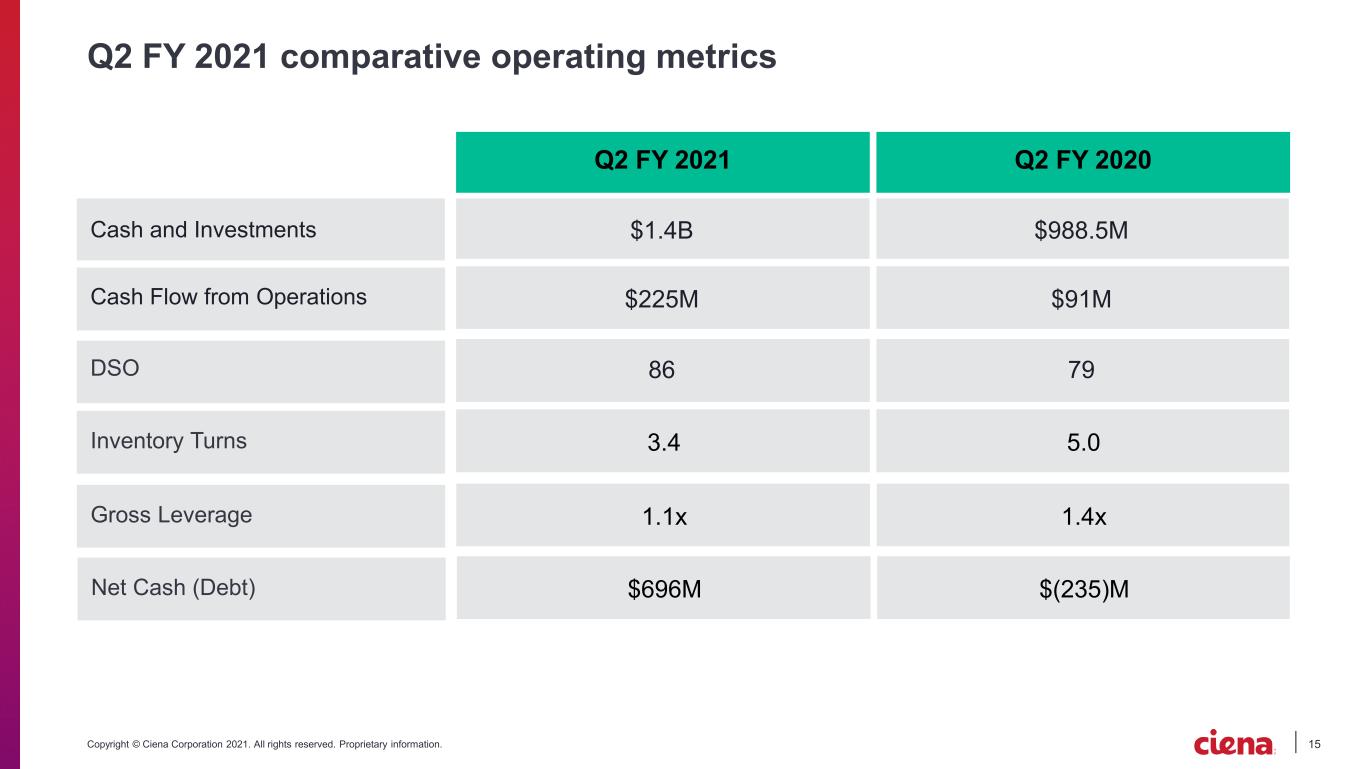
15Copyright © Ciena Corporation 2021. All rights reserved. Proprietary information. Q2 FY 2021 comparative operating metrics Cash and Investments Cash Flow from Operations DSO Q2 FY 2021 Inventory Turns Q2 FY 2020 $1.4B $225M 86 3.4 $988.5M $91M 79 5.0 Gross Leverage 1.1x 1.4x Net Cash (Debt) $696M $(235)M
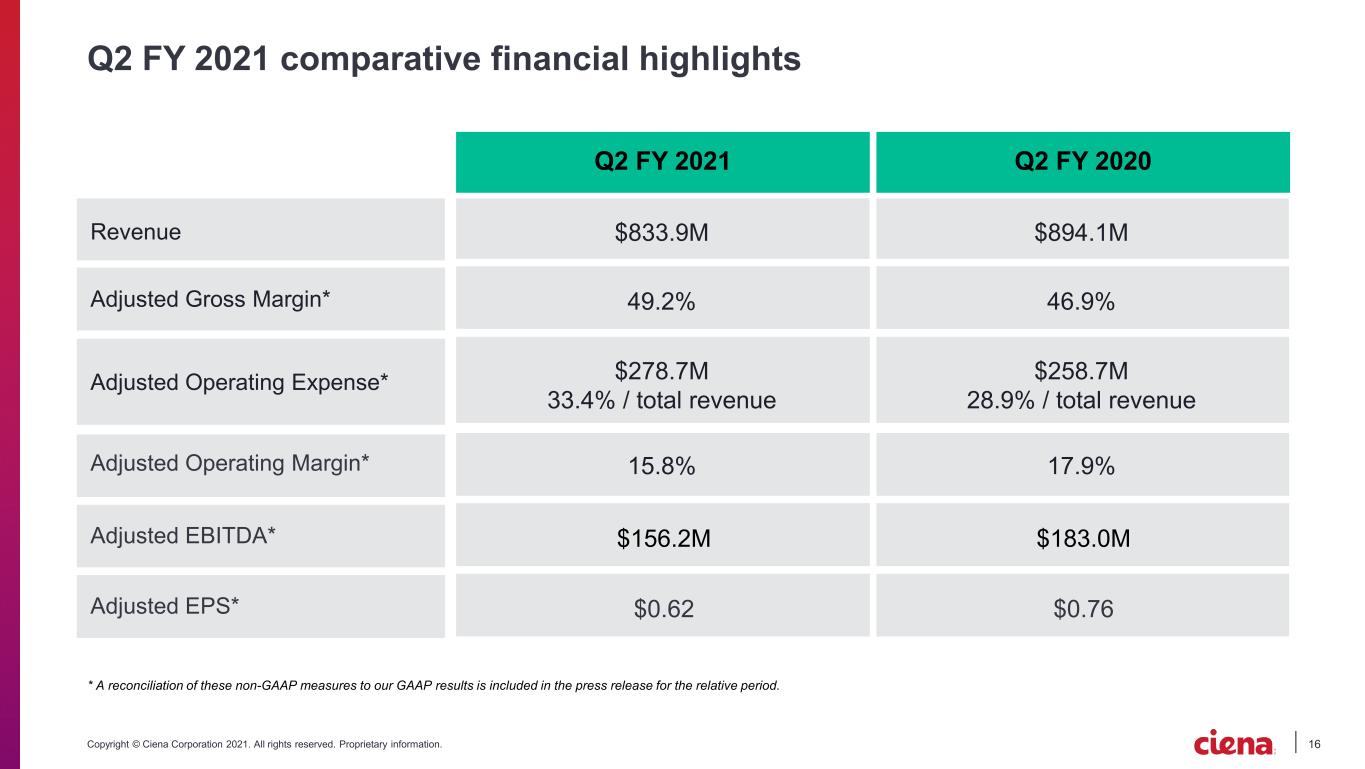
16Copyright © Ciena Corporation 2021. All rights reserved. Proprietary information. Q2 FY 2021 comparative financial highlights Revenue Adjusted Gross Margin* Adjusted Operating Expense* Adjusted Operating Margin* Q2 FY 2021 Adjusted EBITDA* Adjusted EPS* Q2 FY 2020 $833.9M 49.2% $278.7M 33.4% / total revenue 15.8% $156.2M $0.62 $894.1M 46.9% $258.7M 28.9% / total revenue 17.9% $183.0M $0.76 * A reconciliation of these non-GAAP measures to our GAAP results is included in the press release for the relative period.
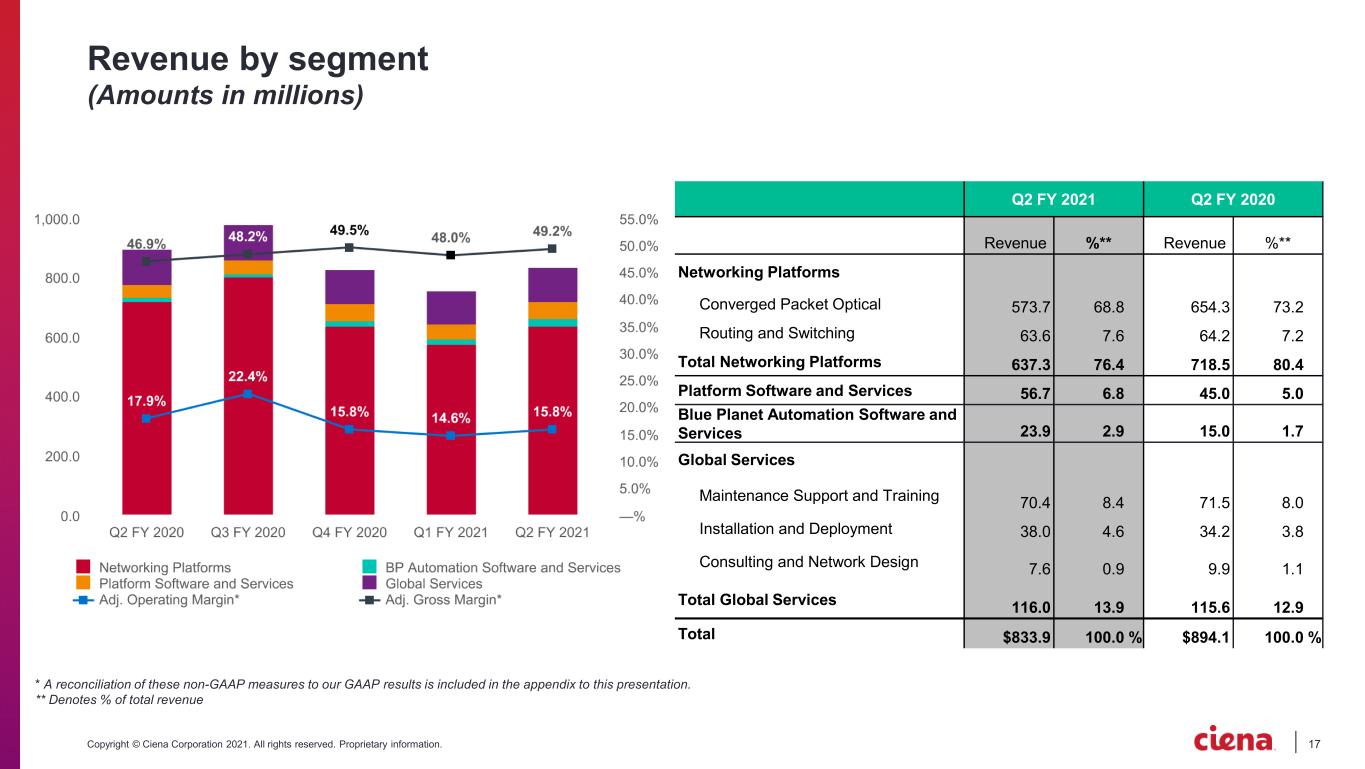
17Copyright © Ciena Corporation 2021. All rights reserved. Proprietary information. Revenue by segment (Amounts in millions) Q2 FY 2021 Q2 FY 2020 Revenue %** Revenue %** Networking Platforms Converged Packet Optical 573.7 68.8 654.3 73.2 Routing and Switching 63.6 7.6 64.2 7.2 Total Networking Platforms 637.3 76.4 718.5 80.4 Platform Software and Services 56.7 6.8 45.0 5.0 Blue Planet Automation Software and Services 23.9 2.9 15.0 1.7 Global Services Maintenance Support and Training 70.4 8.4 71.5 8.0 Installation and Deployment 38.0 4.6 34.2 3.8 Consulting and Network Design 7.6 0.9 9.9 1.1 Total Global Services 116.0 13.9 115.6 12.9 Total $833.9 100.0 % $894.1 100.0 % * A reconciliation of these non-GAAP measures to our GAAP results is included in the appendix to this presentation. ** Denotes % of total revenue
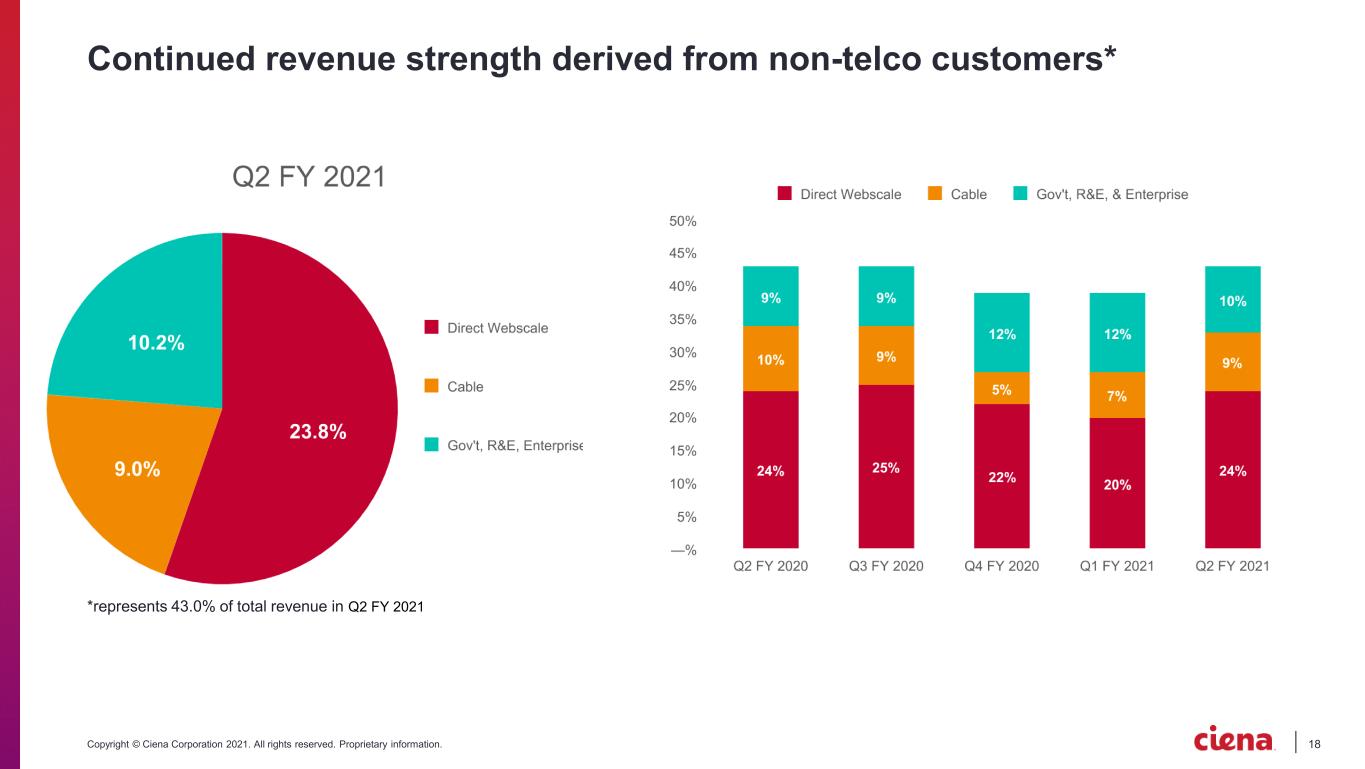
18Copyright © Ciena Corporation 2021. All rights reserved. Proprietary information. Continued revenue strength derived from non-telco customers* *represents 43.0% of total revenue in Q2 FY 2021
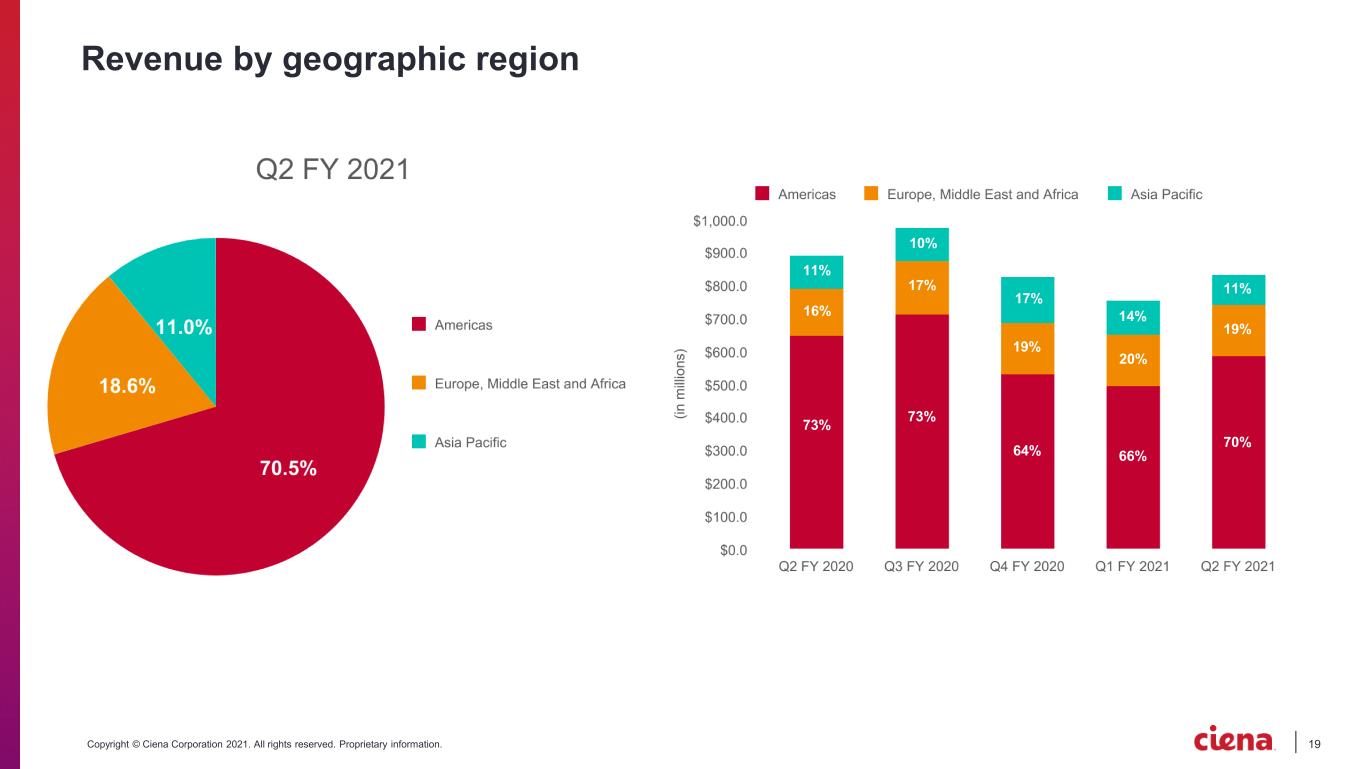
19Copyright © Ciena Corporation 2021. All rights reserved. Proprietary information. Revenue by geographic region 10% 17% 14% 11% 11% 17% 19% 20% 19% 73% 73% 64% 66% 70% 16%
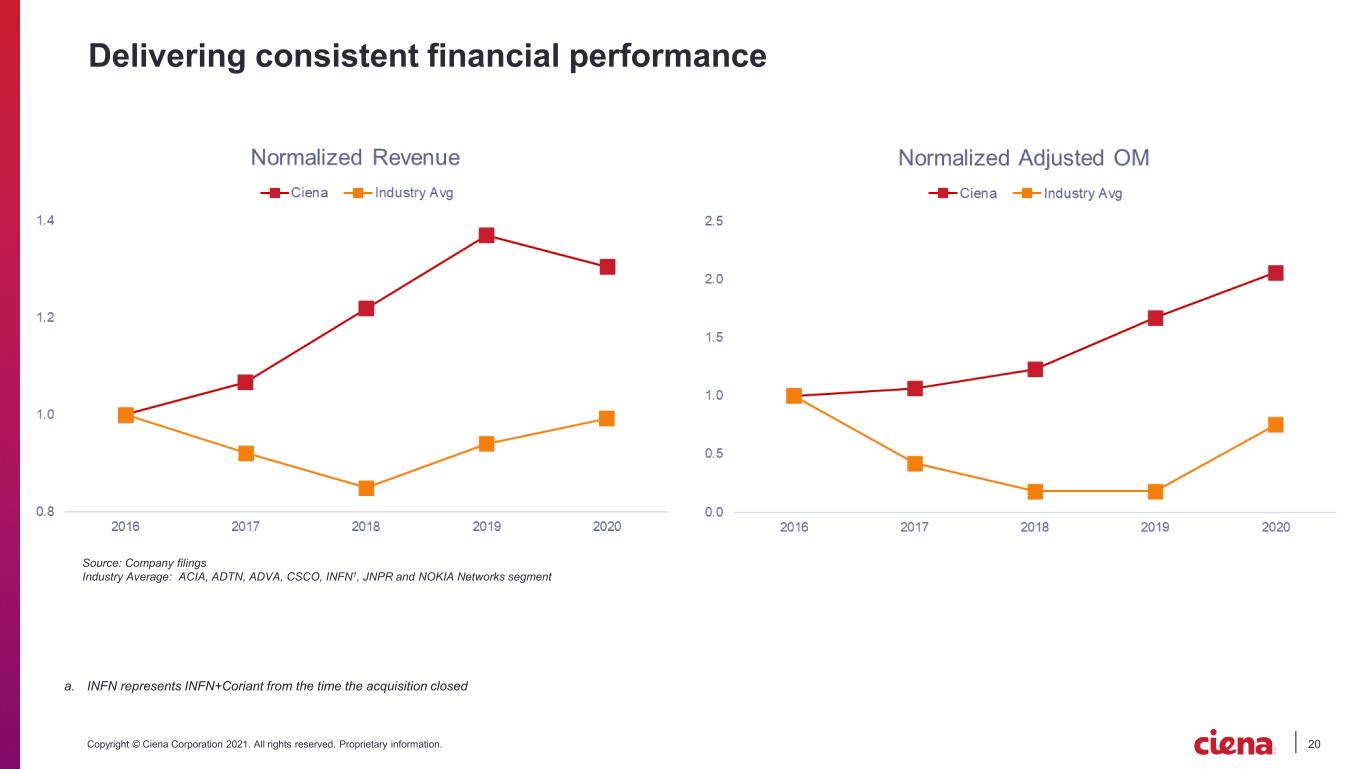
20Copyright © Ciena Corporation 2021. All rights reserved. Proprietary information. Source: Company filings Industry Average: ACIA, ADTN, ADVA, CSCO, INFN1, JNPR and NOKIA Networks segment Delivering consistent financial performance a. INFN represents INFN+Coriant from the time the acquisition closed
21Copyright © Ciena Corporation 2021. All rights reserved. Proprietary information. Q2 FY 2021 appendix
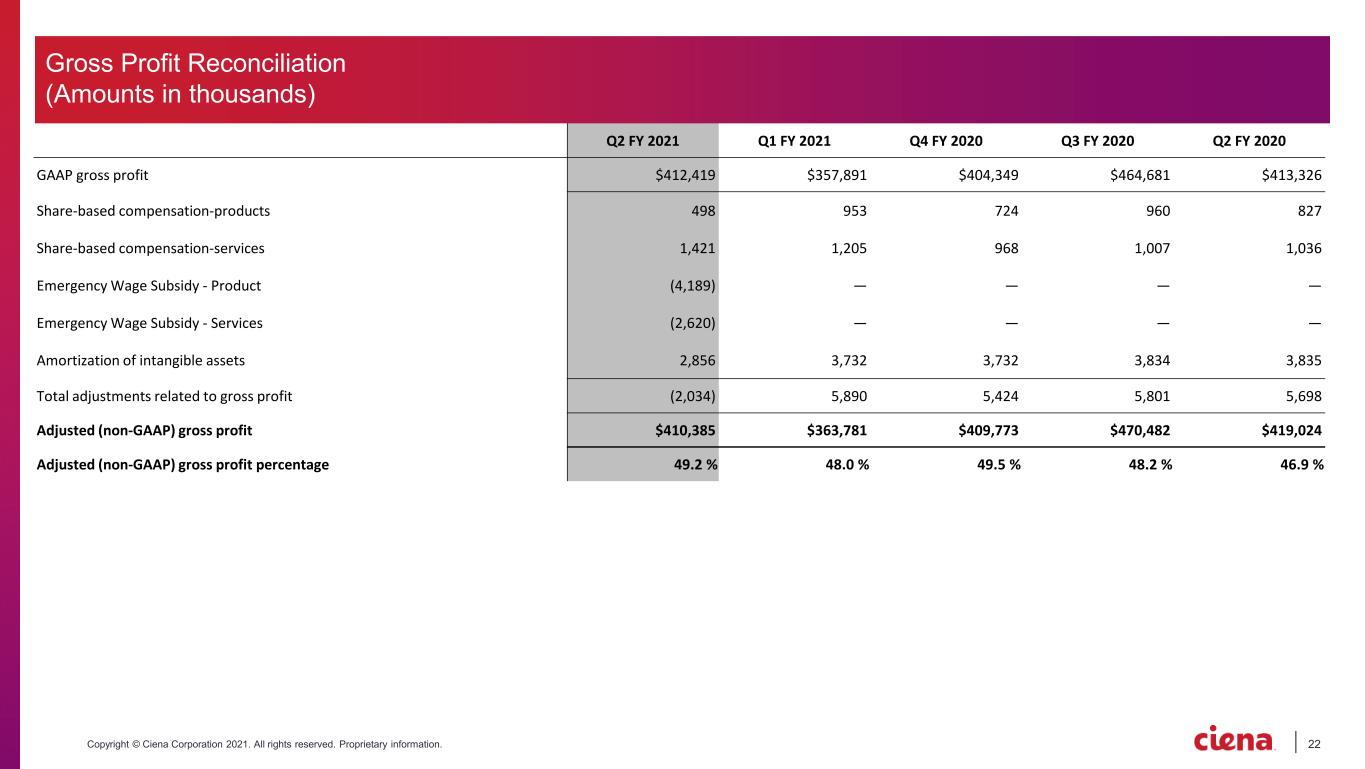
22Copyright © Ciena Corporation 2021. All rights reserved. Proprietary information. Q2 FY 2021 Q1 FY 2021 Q4 FY 2020 Q3 FY 2020 Q2 FY 2020 GAAP gross profit $412,419 $357,891 $404,349 $464,681 $413,326 Share-based compensation-products 498 953 724 960 827 Share-based compensation-services 1,421 1,205 968 1,007 1,036 Emergency Wage Subsidy - Product (4,189) — — — — Emergency Wage Subsidy - Services (2,620) — — — — Amortization of intangible assets 2,856 3,732 3,732 3,834 3,835 Total adjustments related to gross profit (2,034) 5,890 5,424 5,801 5,698 Adjusted (non-GAAP) gross profit $410,385 $363,781 $409,773 $470,482 $419,024 Adjusted (non-GAAP) gross profit percentage 49.2 % 48.0 % 49.5 % 48.2 % 46.9 % Gross Profit Reconciliation (Amounts in thousands)
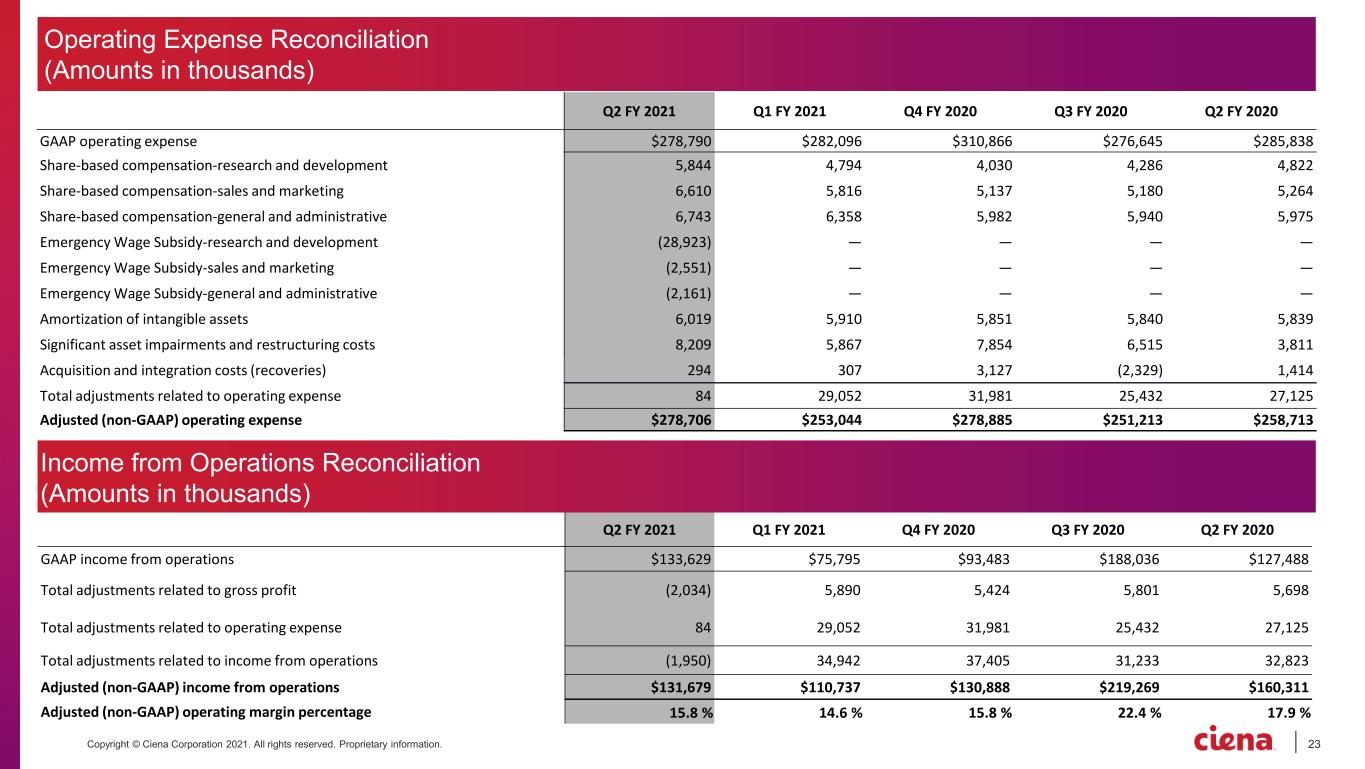
23Copyright © Ciena Corporation 2021. All rights reserved. Proprietary information. Q2 FY 2021 Q1 FY 2021 Q4 FY 2020 Q3 FY 2020 Q2 FY 2020 GAAP operating expense $278,790 $282,096 $310,866 $276,645 $285,838 Share-based compensation-research and development 5,844 4,794 4,030 4,286 4,822 Share-based compensation-sales and marketing 6,610 5,816 5,137 5,180 5,264 Share-based compensation-general and administrative 6,743 6,358 5,982 5,940 5,975 Emergency Wage Subsidy-research and development (28,923) — — — — Emergency Wage Subsidy-sales and marketing (2,551) — — — — Emergency Wage Subsidy-general and administrative (2,161) — — — — Amortization of intangible assets 6,019 5,910 5,851 5,840 5,839 Significant asset impairments and restructuring costs 8,209 5,867 7,854 6,515 3,811 Acquisition and integration costs (recoveries) 294 307 3,127 (2,329) 1,414 Total adjustments related to operating expense 84 29,052 31,981 25,432 27,125 Adjusted (non-GAAP) operating expense $278,706 $253,044 $278,885 $251,213 $258,713 Q2 FY 2021 Q1 FY 2021 Q4 FY 2020 Q3 FY 2020 Q2 FY 2020 GAAP income from operations $133,629 $75,795 $93,483 $188,036 $127,488 Total adjustments related to gross profit (2,034) 5,890 5,424 5,801 5,698 Total adjustments related to operating expense 84 29,052 31,981 25,432 27,125 Total adjustments related to income from operations (1,950) 34,942 37,405 31,233 32,823 Adjusted (non-GAAP) income from operations $131,679 $110,737 $130,888 $219,269 $160,311 Adjusted (non-GAAP) operating margin percentage 15.8 % 14.6 % 15.8 % 22.4 % 17.9 % Operating Expense Reconciliation (Amounts in thousands) Income from Operations Reconciliation (Amounts in thousands)
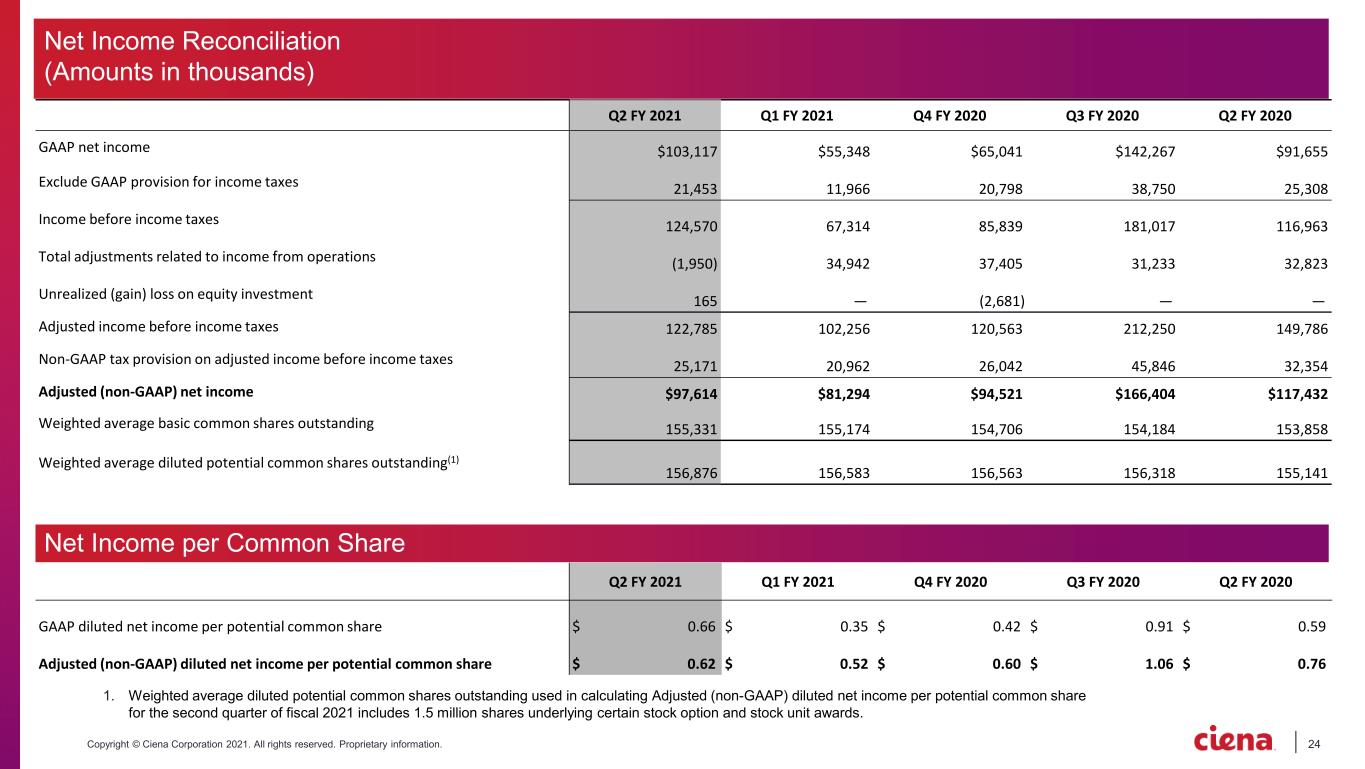
24Copyright © Ciena Corporation 2021. All rights reserved. Proprietary information. Q2 FY 2021 Q1 FY 2021 Q4 FY 2020 Q3 FY 2020 Q2 FY 2020 GAAP net income $103,117 $55,348 $65,041 $142,267 $91,655 Exclude GAAP provision for income taxes 21,453 11,966 20,798 38,750 25,308 Income before income taxes 124,570 67,314 85,839 181,017 116,963 Total adjustments related to income from operations (1,950) 34,942 37,405 31,233 32,823 Unrealized (gain) loss on equity investment 165 — (2,681) — — Adjusted income before income taxes 122,785 102,256 120,563 212,250 149,786 Non-GAAP tax provision on adjusted income before income taxes 25,171 20,962 26,042 45,846 32,354 Adjusted (non-GAAP) net income $97,614 $81,294 $94,521 $166,404 $117,432 Weighted average basic common shares outstanding 155,331 155,174 154,706 154,184 153,858 Weighted average diluted potential common shares outstanding(1) 156,876 156,583 156,563 156,318 155,141 Q2 FY 2021 Q1 FY 2021 Q4 FY 2020 Q3 FY 2020 Q2 FY 2020 GAAP diluted net income per potential common share $ 0.66 $ 0.35 $ 0.42 $ 0.91 $ 0.59 Adjusted (non-GAAP) diluted net income per potential common share $ 0.62 $ 0.52 $ 0.60 $ 1.06 $ 0.76 1. Weighted average diluted potential common shares outstanding used in calculating Adjusted (non-GAAP) diluted net income per potential common share for the second quarter of fiscal 2021 includes 1.5 million shares underlying certain stock option and stock unit awards. Net Income Reconciliation (Amounts in thousands) Net Income per Common Share
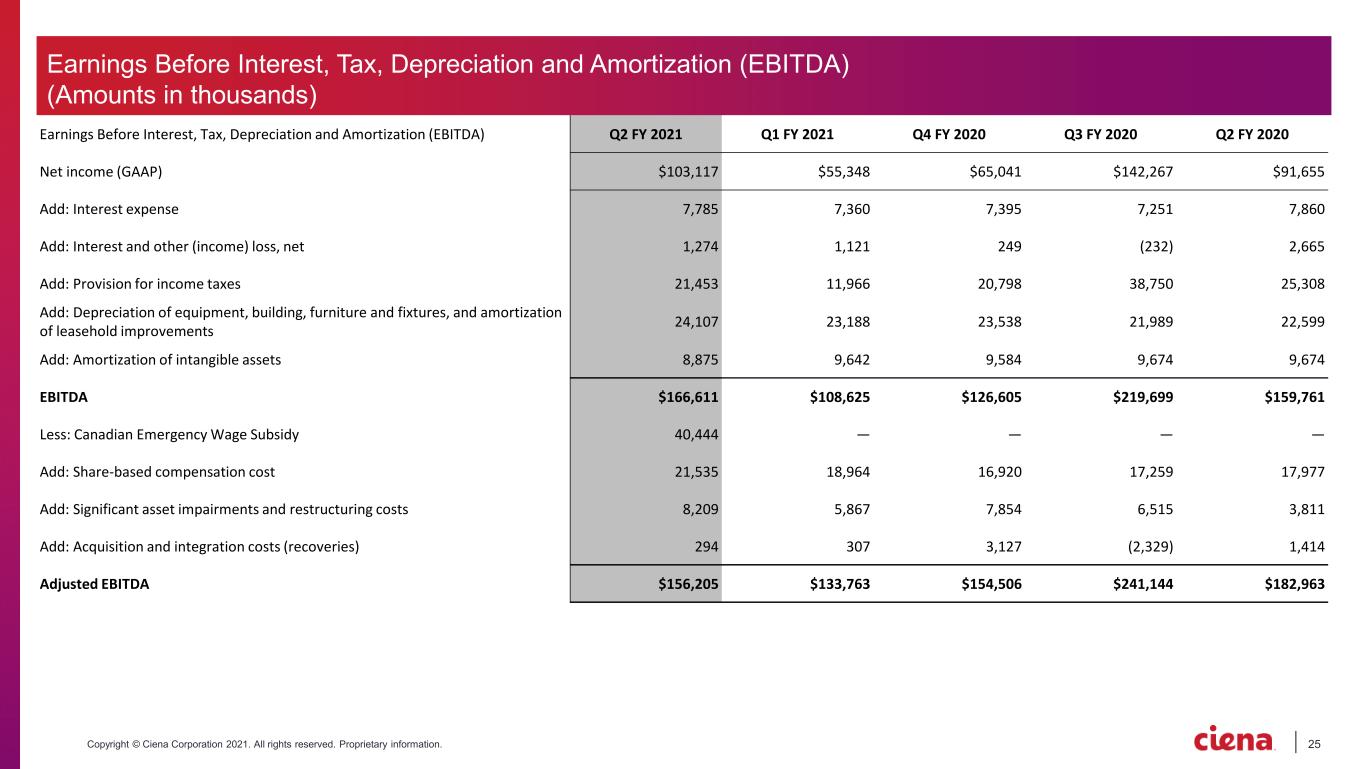
25Copyright © Ciena Corporation 2021. All rights reserved. Proprietary information. Earnings Before Interest, Tax, Depreciation and Amortization (EBITDA) Q2 FY 2021 Q1 FY 2021 Q4 FY 2020 Q3 FY 2020 Q2 FY 2020 Net income (GAAP) $103,117 $55,348 $65,041 $142,267 $91,655 Add: Interest expense 7,785 7,360 7,395 7,251 7,860 Add: Interest and other (income) loss, net 1,274 1,121 249 (232) 2,665 Add: Provision for income taxes 21,453 11,966 20,798 38,750 25,308 Add: Depreciation of equipment, building, furniture and fixtures, and amortization of leasehold improvements 24,107 23,188 23,538 21,989 22,599 Add: Amortization of intangible assets 8,875 9,642 9,584 9,674 9,674 EBITDA $166,611 $108,625 $126,605 $219,699 $159,761 Less: Canadian Emergency Wage Subsidy 40,444 — — — — Add: Share-based compensation cost 21,535 18,964 16,920 17,259 17,977 Add: Significant asset impairments and restructuring costs 8,209 5,867 7,854 6,515 3,811 Add: Acquisition and integration costs (recoveries) 294 307 3,127 (2,329) 1,414 Adjusted EBITDA $156,205 $133,763 $154,506 $241,144 $182,963 Earnings Before Interest, Tax, Depreciation and Amortization (EBITDA) (Amounts in thousands)