Copyright © Ciena Corporation 2021. All rights reserved. Proprietary information. Ciena Corporation Period ended October 30, 2021 December 9, 2021 Earnings Presentation
2Copyright © Ciena Corporation 2021. All rights reserved. Proprietary information. Forward-looking statements and non-GAAP measures Information in this presentation and related comments of presenters contain a number of forward-looking statements. These statements are based on current expectations, forecasts, assumptions and other information available to the Company as of the date hereof. Forward-looking statements include Ciena’s prospective financial results, return of capital plans, business strategies, expectations about its addressable markets and market share, and business outlook for future periods, as well as statements regarding Ciena’s expectations, beliefs, intentions or strategies regarding the future. Often, these can be identified by forward-looking words such as “target” “anticipate,” “believe,” “could,” “estimate,” “expect,” “intend,” “may,” “should,” “will,” “plan,” “predict,” “potential,” “project, “continue,” and “would” or similar words. Ciena's actual results, performance or events may differ materially from these forward-looking statements made or implied due to a number of risks and uncertainties relating to Ciena's business, including: the effect of broader economic and market conditions on our customers and their business; our ability to execute our business and growth strategies; the duration and severity of the COVID-19 pandemic and the impact of countermeasures taken to mitigate its spread on macroeconomic conditions, economic activity, demand for our technology solutions, short- and long-term changes in customer or end user needs, continuity of supply chain, our business operations, liquidity and financial results; changes in network spending or network strategy by our customers; seasonality and the timing and size of customer orders, including our ability to recognize revenue relating to such sales; the level of competitive pressure we encounter; the product, customer and geographic mix of sales within the period; supply chain disruptions and the level of success relating to efforts to optimize Ciena's operations; changes in foreign currency exchange rates affecting revenue and operating expense; factors beyond our control such as natural disasters, climate change, acts of war or terrorism, and public health emergencies, including the COVID-19 pandemic; the impact of the Tax Cuts and Jobs Act; changes in tax or trade regulations, including the imposition of tariffs, duties or efforts to withdraw from or materially modify international trade agreements; and the other risk factors disclosed in Ciena’s periodic reports filed with the Securities and Exchange Commission (SEC) including Ciena’s Quarterly Report on Form 10-Q filed with the SEC on September 8, 2021 and Ciena’s Annual Report on Form 10-K to be filed with the SEC. All information, statements, and projections in this presentation and the related earnings call speak only as of the date of this presentation and related earnings call. Ciena assumes no obligation to update any forward-looking or other information included in this presentation or related earnings calls, whether as a result of new information, future events or otherwise. In addition, this presentation includes historical, and may include prospective, non-GAAP measures of Ciena’s gross margin, operating expense, operating profit, EBITDA, net income, and net income per share. These measures are not intended to be a substitute for financial information presented in accordance with GAAP. A reconciliation of non- GAAP measures used in this presentation to Ciena’s GAAP results for the relevant period can be found in the Appendix to this presentation. Additional information can also be found in our press release filed this morning and in our reports on Form 10-Q filed with the Securities and Exchange Commission.

3Copyright © Ciena Corporation 2021. All rights reserved. Proprietary information. Fiscal 2021 results
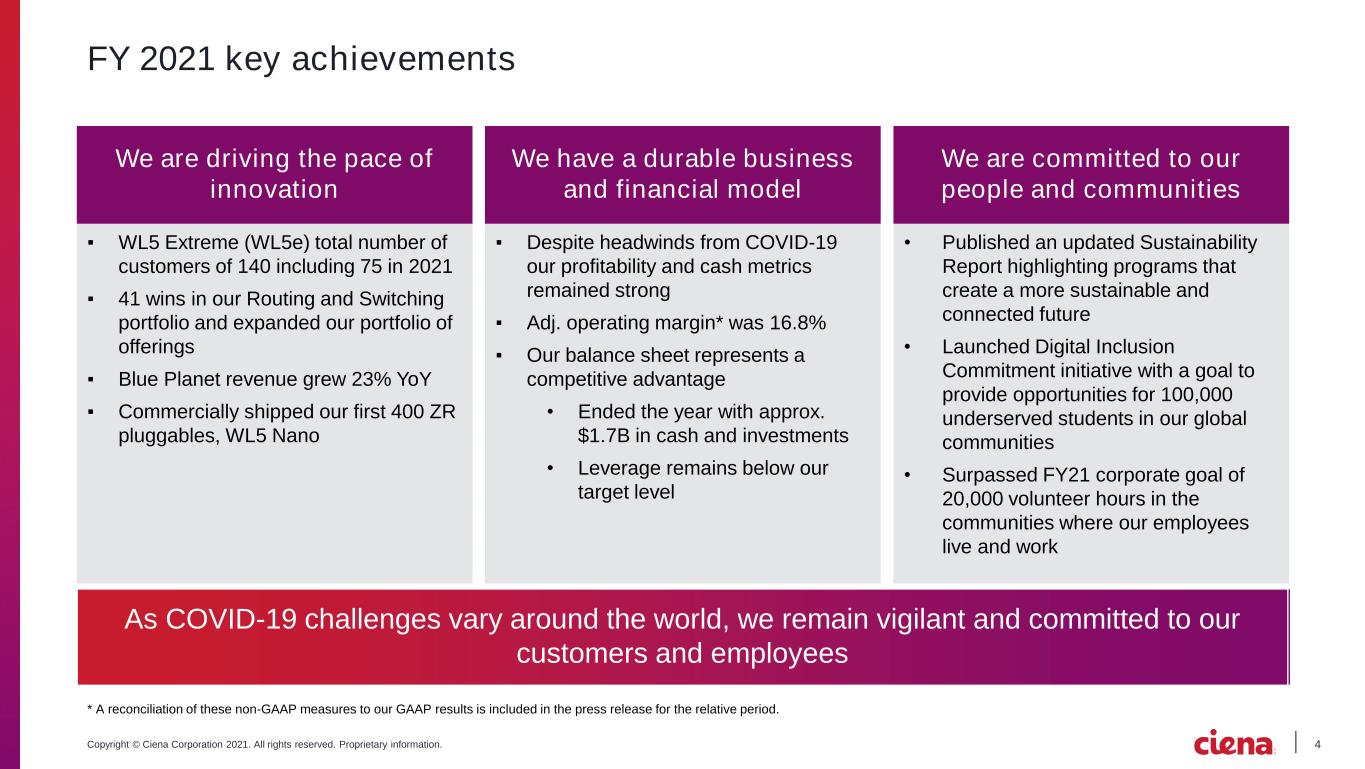
4Copyright © Ciena Corporation 2021. All rights reserved. Proprietary information. FY 2021 key achievements ▪ WL5 Extreme (WL5e) total number of customers of 140 including 75 in 2021 ▪ 41 wins in our Routing and Switching portfolio and expanded our portfolio of offerings ▪ Blue Planet revenue grew 23% YoY ▪ Commercially shipped our first 400 ZR pluggables, WL5 Nano We are driving the pace of innovation We are committed to our people and communities We have a durable business and financial model ▪ Despite headwinds from COVID-19 our profitability and cash metrics remained strong ▪ Adj. operating margin* was 16.8% ▪ Our balance sheet represents a competitive advantage • Ended the year with approx. $1.7B in cash and investments • Leverage remains below our target level • Published an updated Sustainability Report highlighting programs that create a more sustainable and connected future • Launched Digital Inclusion Commitment initiative with a goal to provide opportunities for 100,000 underserved students in our global communities • Surpassed FY21 corporate goal of 20,000 volunteer hours in the communities where our employees live and work As COVID-19 challenges vary around the world, we remain vigilant and committed to our customers and employees * A reconciliation of these non-GAAP measures to our GAAP results is included in the press release for the relative period.
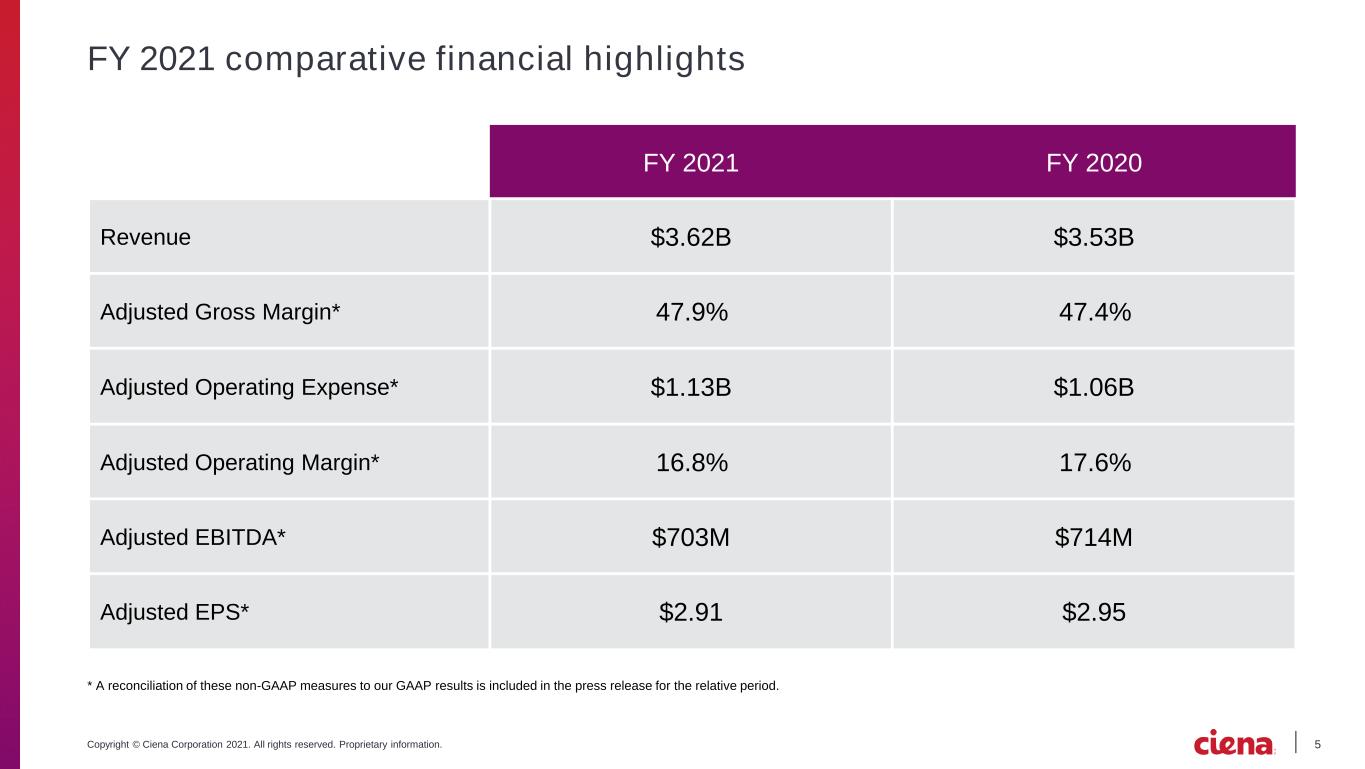
5Copyright © Ciena Corporation 2021. All rights reserved. Proprietary information. FY 2021 comparative financial highlights * A reconciliation of these non-GAAP measures to our GAAP results is included in the press release for the relative period. FY 2021 FY 2020 Revenue $3.62B $3.53B Adjusted Gross Margin* 47.9% 47.4% Adjusted Operating Expense* $1.13B $1.06B Adjusted Operating Margin* 16.8% 17.6% Adjusted EBITDA* $703M $714M Adjusted EPS* $2.91 $2.95
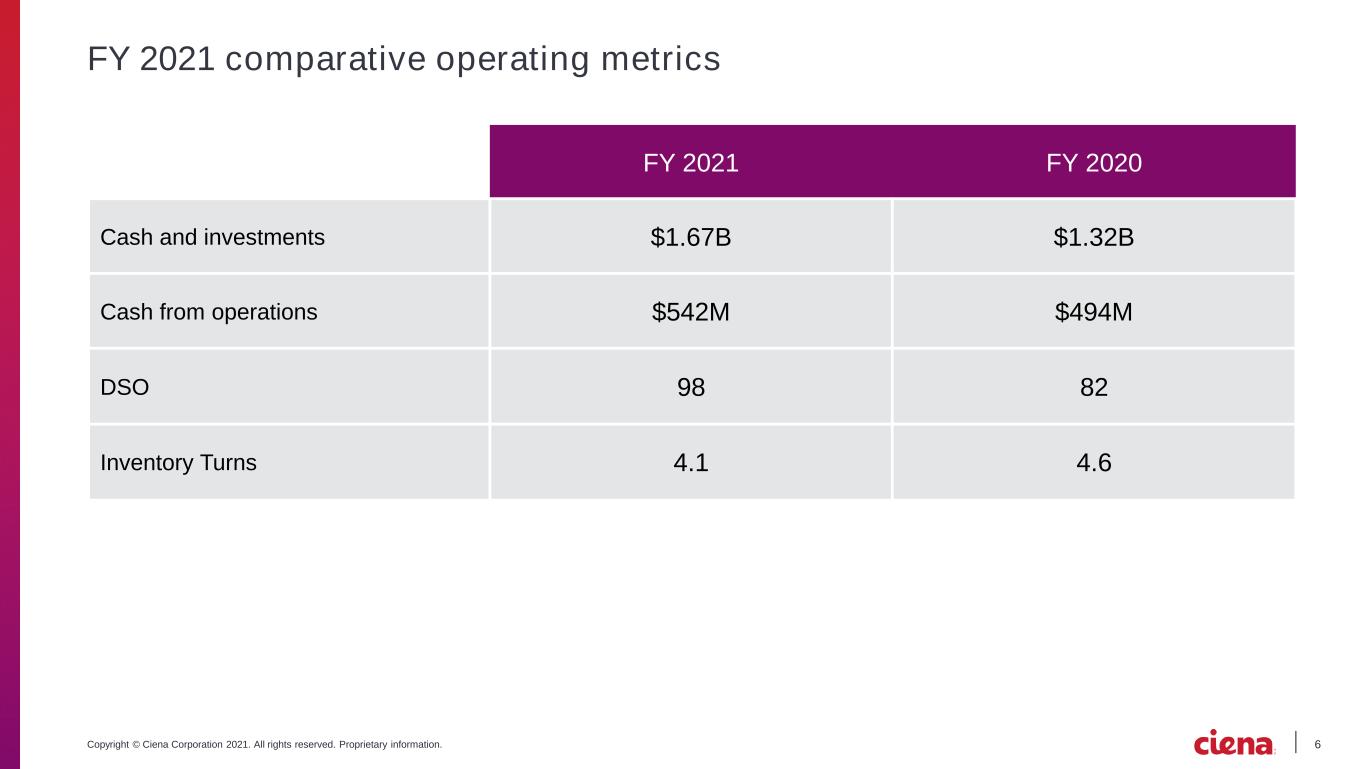
6Copyright © Ciena Corporation 2021. All rights reserved. Proprietary information. FY 2021 comparative operating metrics FY 2021 FY 2020 Cash and investments $1.67B $1.32B Cash from operations $542M $494M DSO 98 82 Inventory Turns 4.1 4.6

7Copyright © Ciena Corporation 2021. All rights reserved. Proprietary information. Market context
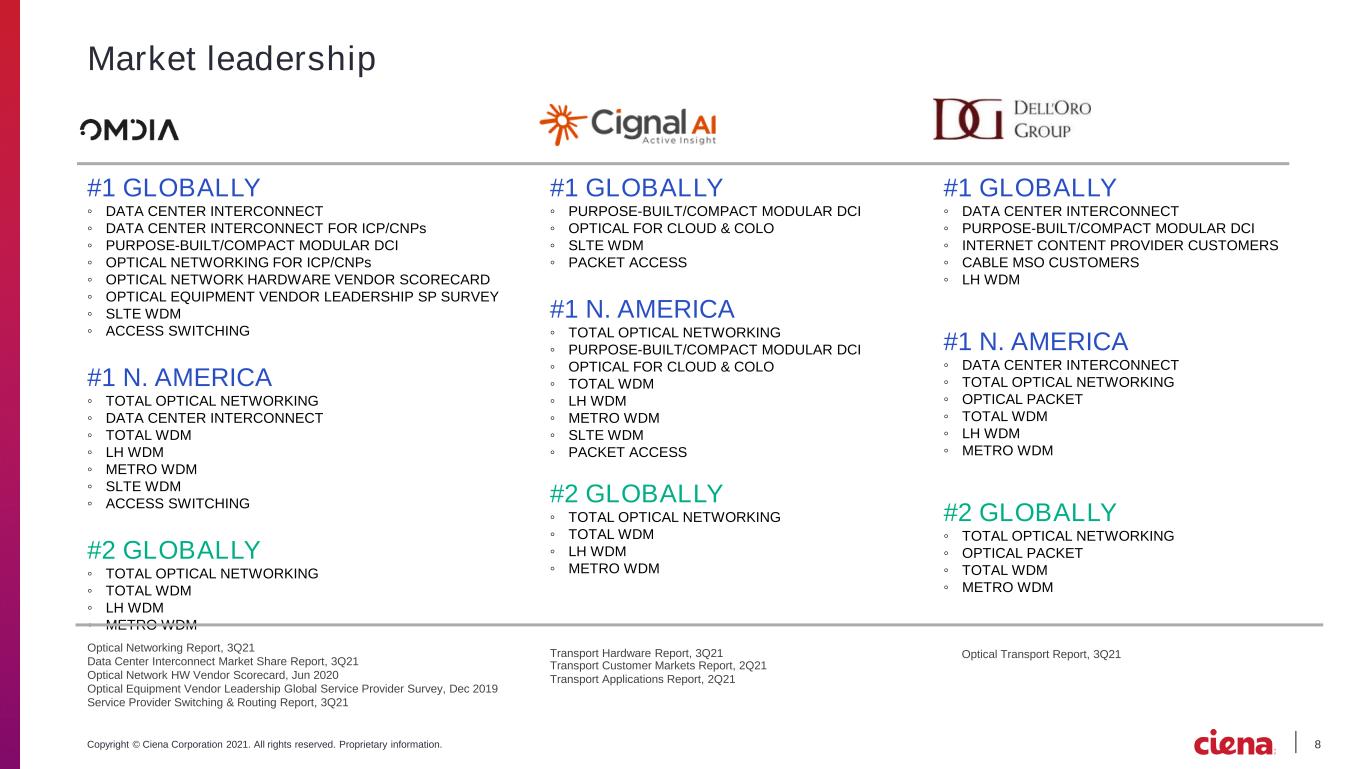
8Copyright © Ciena Corporation 2021. All rights reserved. Proprietary information. #1 GLOBALLY ◦ DATA CENTER INTERCONNECT ◦ PURPOSE-BUILT/COMPACT MODULAR DCI ◦ INTERNET CONTENT PROVIDER CUSTOMERS ◦ CABLE MSO CUSTOMERS ◦ LH WDM #1 N. AMERICA ◦ DATA CENTER INTERCONNECT ◦ TOTAL OPTICAL NETWORKING ◦ OPTICAL PACKET ◦ TOTAL WDM ◦ LH WDM ◦ METRO WDM #2 GLOBALLY ◦ TOTAL OPTICAL NETWORKING ◦ OPTICAL PACKET ◦ TOTAL WDM ◦ METRO WDM #1 GLOBALLY ◦ DATA CENTER INTERCONNECT ◦ DATA CENTER INTERCONNECT FOR ICP/CNPs ◦ PURPOSE-BUILT/COMPACT MODULAR DCI ◦ OPTICAL NETWORKING FOR ICP/CNPs ◦ OPTICAL NETWORK HARDWARE VENDOR SCORECARD ◦ OPTICAL EQUIPMENT VENDOR LEADERSHIP SP SURVEY ◦ SLTE WDM ◦ ACCESS SWITCHING #1 N. AMERICA ◦ TOTAL OPTICAL NETWORKING ◦ DATA CENTER INTERCONNECT ◦ TOTAL WDM ◦ LH WDM ◦ METRO WDM ◦ SLTE WDM ◦ ACCESS SWITCHING #2 GLOBALLY ◦ TOTAL OPTICAL NETWORKING ◦ TOTAL WDM ◦ LH WDM ◦ METRO WDM #1 GLOBALLY ◦ PURPOSE-BUILT/COMPACT MODULAR DCI ◦ OPTICAL FOR CLOUD & COLO ◦ SLTE WDM ◦ PACKET ACCESS #1 N. AMERICA ◦ TOTAL OPTICAL NETWORKING ◦ PURPOSE-BUILT/COMPACT MODULAR DCI ◦ OPTICAL FOR CLOUD & COLO ◦ TOTAL WDM ◦ LH WDM ◦ METRO WDM ◦ SLTE WDM ◦ PACKET ACCESS #2 GLOBALLY ◦ TOTAL OPTICAL NETWORKING ◦ TOTAL WDM ◦ LH WDM ◦ METRO WDM Market leadership Optical Transport Report, 3Q21 Optical Networking Report, 3Q21 Data Center Interconnect Market Share Report, 3Q21 Optical Network HW Vendor Scorecard, Jun 2020 Optical Equipment Vendor Leadership Global Service Provider Survey, Dec 2019 Service Provider Switching & Routing Report, 3Q21 Transport Hardware Report, 3Q21 Transport Customer Markets Report, 2Q21 Transport Applications Report, 2Q21
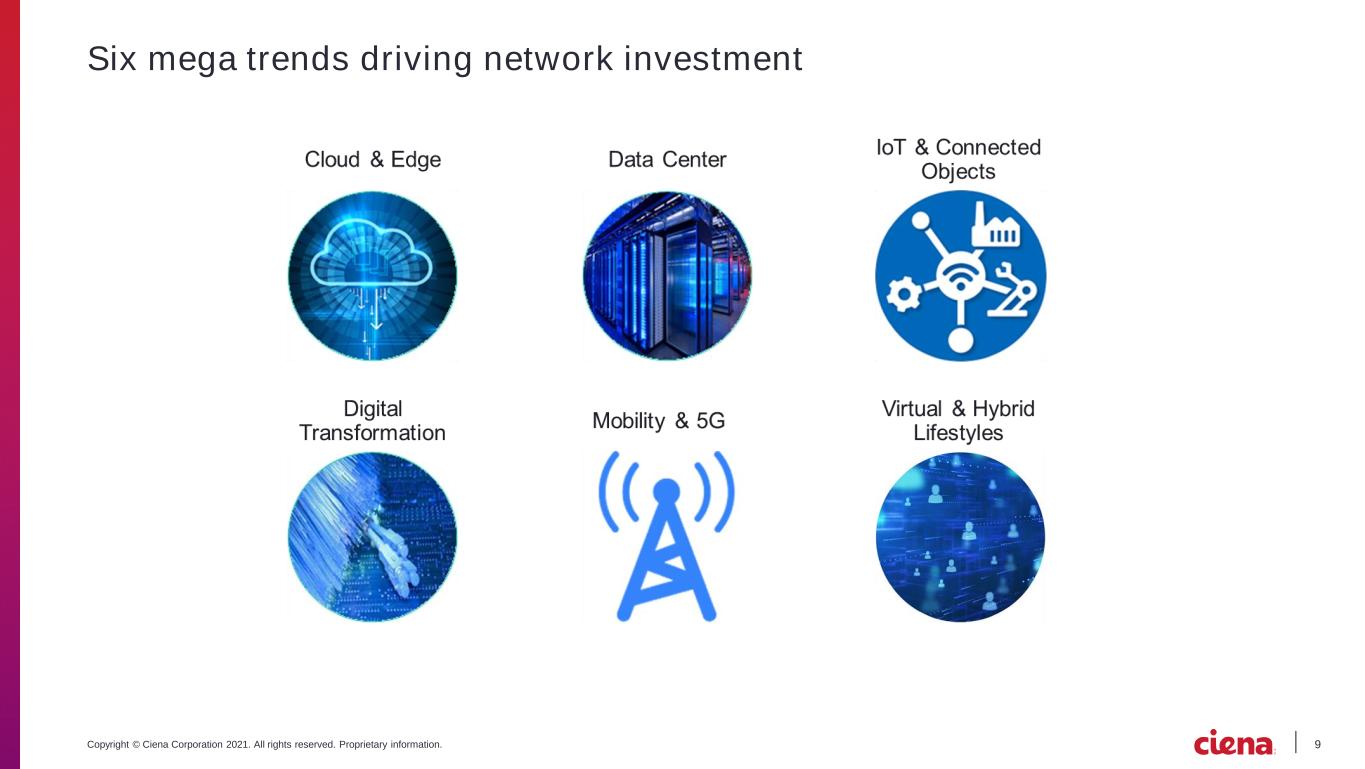
9Copyright © Ciena Corporation 2021. All rights reserved. Proprietary information. Six mega trends driving network investment
10Copyright © Ciena Corporation 2021. All rights reserved. Proprietary information. Q4 Fiscal 2021 results
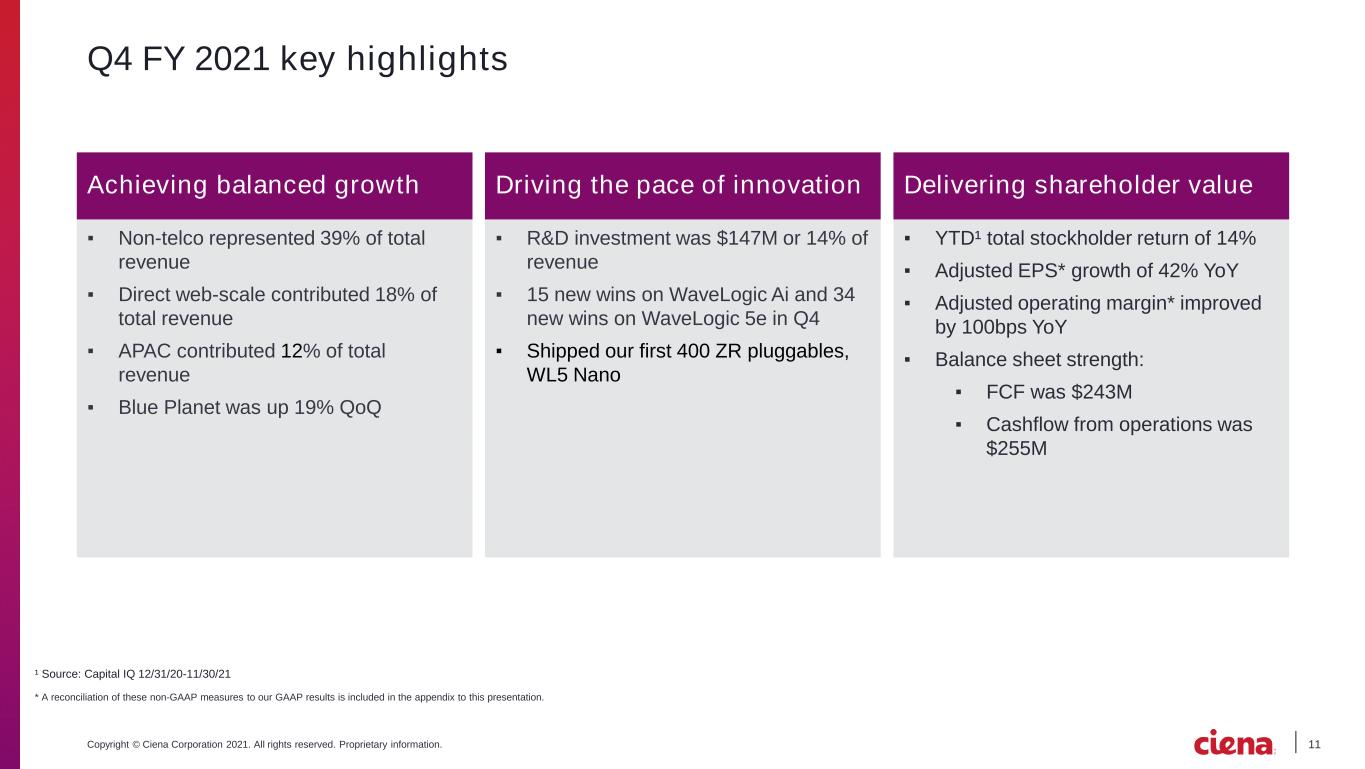
11Copyright © Ciena Corporation 2021. All rights reserved. Proprietary information. Q4 FY 2021 key highlights ▪ Non-telco represented 39% of total revenue ▪ Direct web-scale contributed 18% of total revenue ▪ APAC contributed 12% of total revenue ▪ Blue Planet was up 19% QoQ Achieving balanced growth Delivering shareholder valueDriving the pace of innovation ▪ R&D investment was $147M or 14% of revenue ▪ 15 new wins on WaveLogic Ai and 34 new wins on WaveLogic 5e in Q4 ▪ Shipped our first 400 ZR pluggables, WL5 Nano ▪ YTD¹ total stockholder return of 14% ▪ Adjusted EPS* growth of 42% YoY ▪ Adjusted operating margin* improved by 100bps YoY ▪ Balance sheet strength: ▪ FCF was $243M ▪ Cashflow from operations was $255M * A reconciliation of these non-GAAP measures to our GAAP results is included in the appendix to this presentation. ¹ Source: Capital IQ 12/31/20-11/30/21
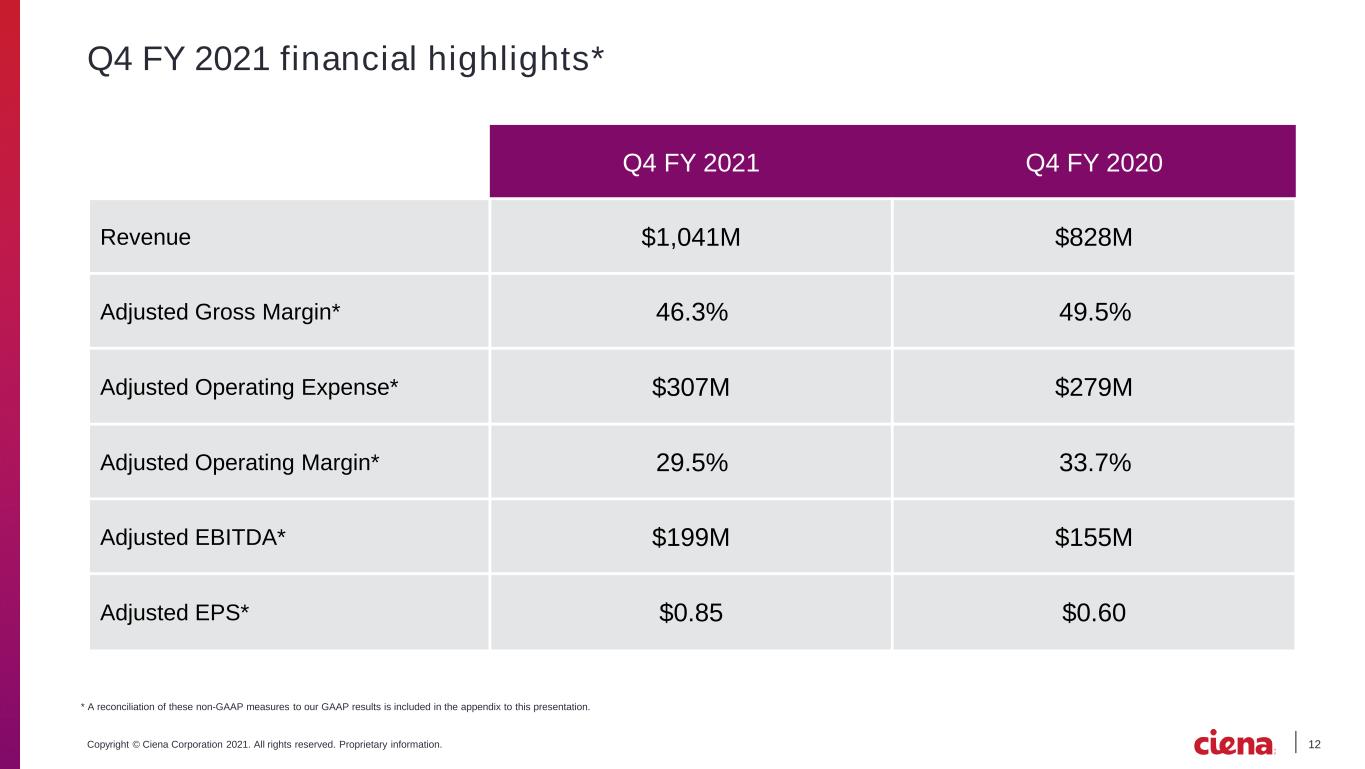
12Copyright © Ciena Corporation 2021. All rights reserved. Proprietary information. Q4 FY 2021 financial highlights* * A reconciliation of these non-GAAP measures to our GAAP results is included in the appendix to this presentation. Q4 FY 2021 Q4 FY 2020 Revenue $1,041M $828M Adjusted Gross Margin* 46.3% 49.5% Adjusted Operating Expense* $307M $279M Adjusted Operating Margin* 29.5% 33.7% Adjusted EBITDA* $199M $155M Adjusted EPS* $0.85 $0.60
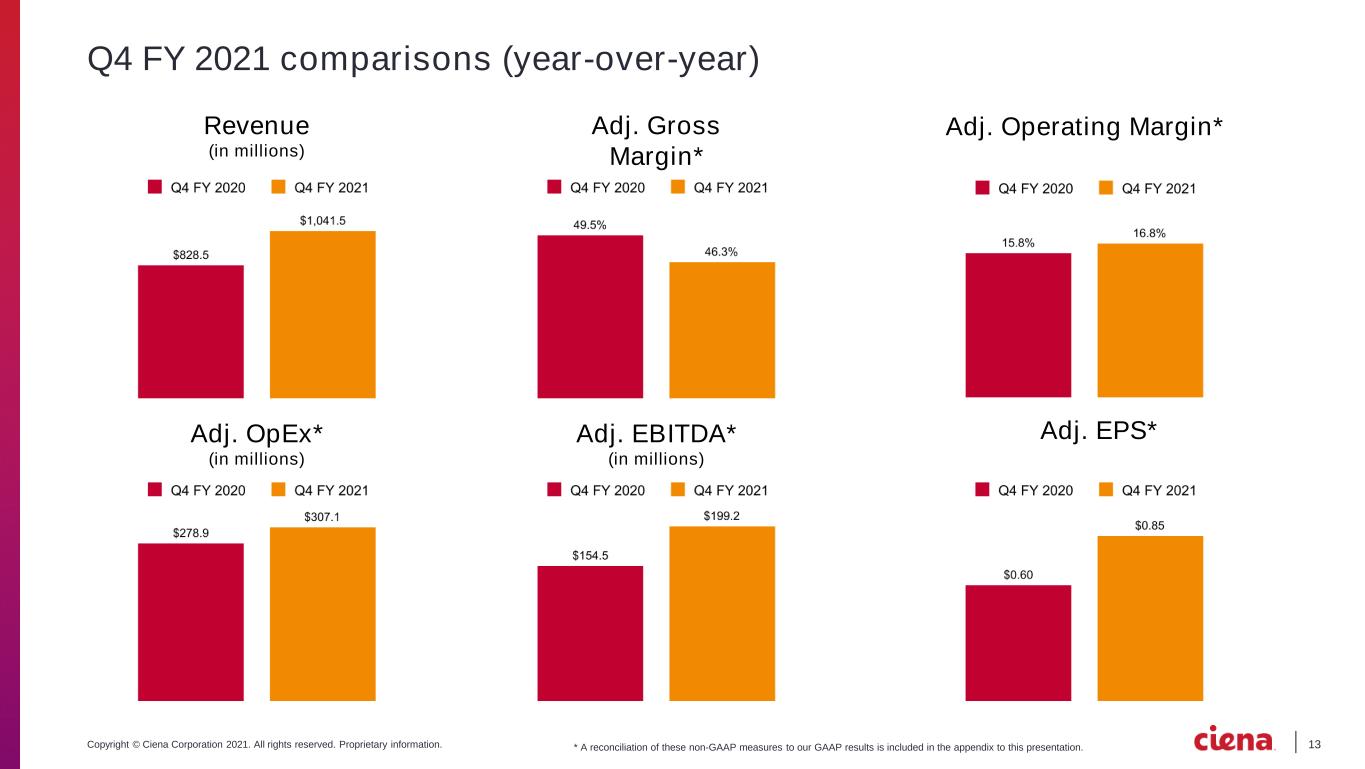
13Copyright © Ciena Corporation 2021. All rights reserved. Proprietary information. Q4 FY 2021 comparisons (year-over-year) * A reconciliation of these non-GAAP measures to our GAAP results is included in the appendix to this presentation. Revenue (in millions) Adj. Gross Margin* Adj. Operating Margin* Adj. OpEx* (in millions) Adj. EBITDA* (in millions) Adj. EPS*
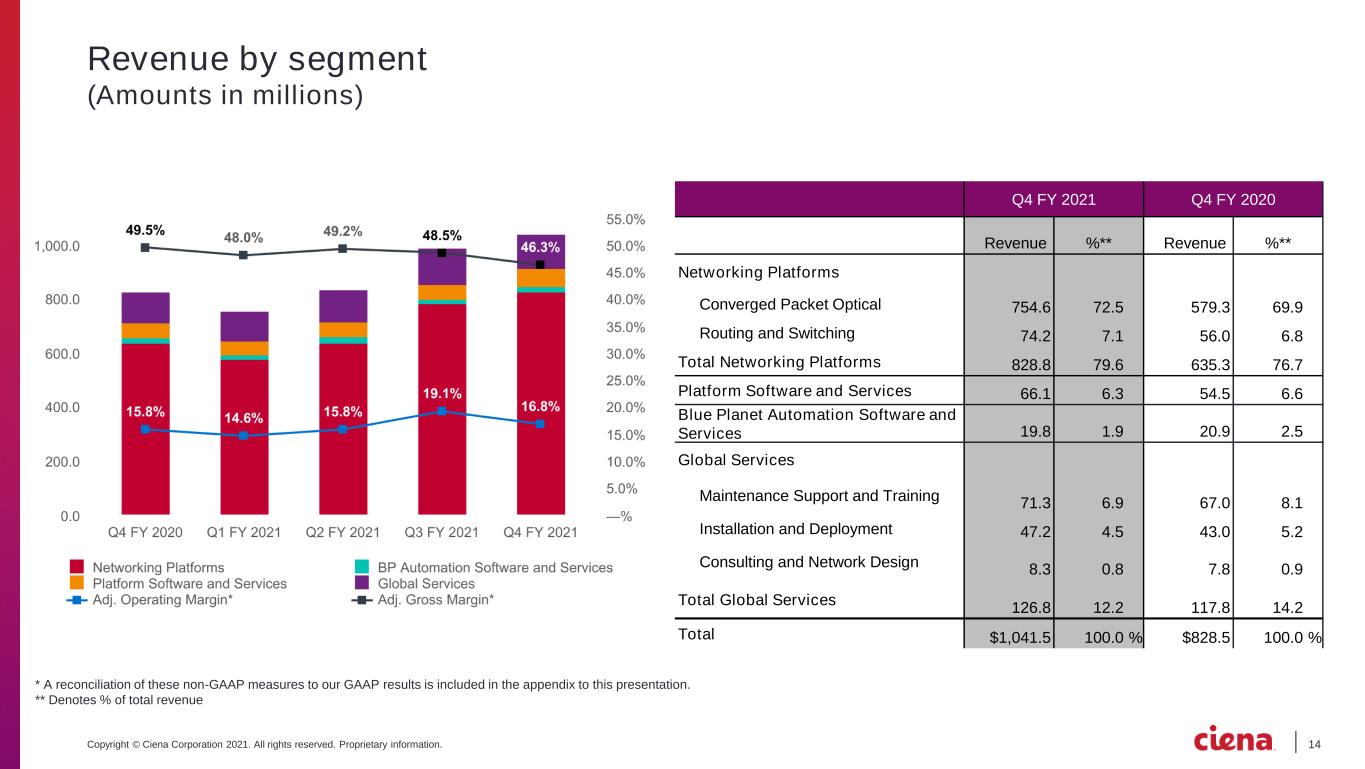
14Copyright © Ciena Corporation 2021. All rights reserved. Proprietary information. Revenue by segment (Amounts in millions) Q4 FY 2021 Q4 FY 2020 Revenue %** Revenue %** Networking Platforms Converged Packet Optical 754.6 72.5 579.3 69.9 Routing and Switching 74.2 7.1 56.0 6.8 Total Networking Platforms 828.8 79.6 635.3 76.7 Platform Software and Services 66.1 6.3 54.5 6.6 Blue Planet Automation Software and Services 19.8 1.9 20.9 2.5 Global Services Maintenance Support and Training 71.3 6.9 67.0 8.1 Installation and Deployment 47.2 4.5 43.0 5.2 Consulting and Network Design 8.3 0.8 7.8 0.9 Total Global Services 126.8 12.2 117.8 14.2 Total $1,041.5 100.0 % $828.5 100.0 % * A reconciliation of these non-GAAP measures to our GAAP results is included in the appendix to this presentation. ** Denotes % of total revenue
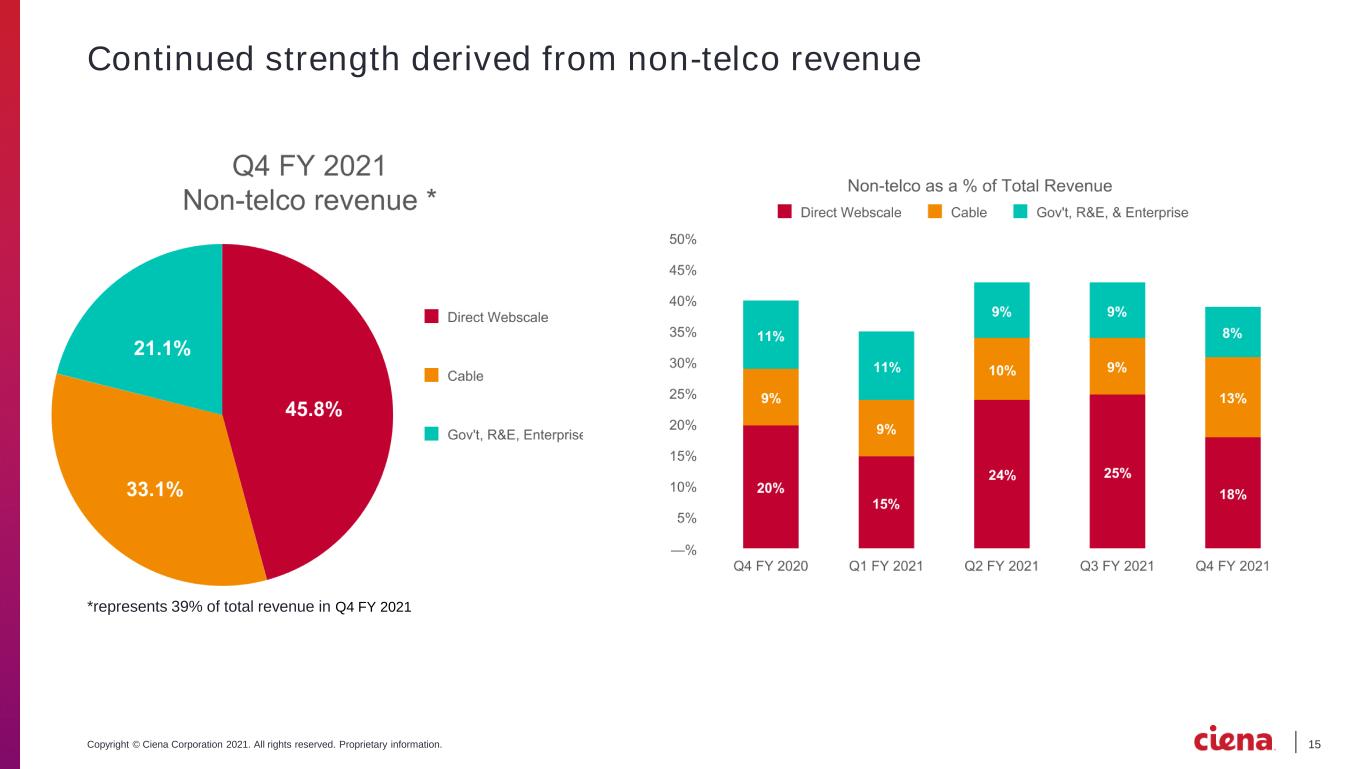
15Copyright © Ciena Corporation 2021. All rights reserved. Proprietary information. Continued strength derived from non-telco revenue *represents 39% of total revenue in Q4 FY 2021
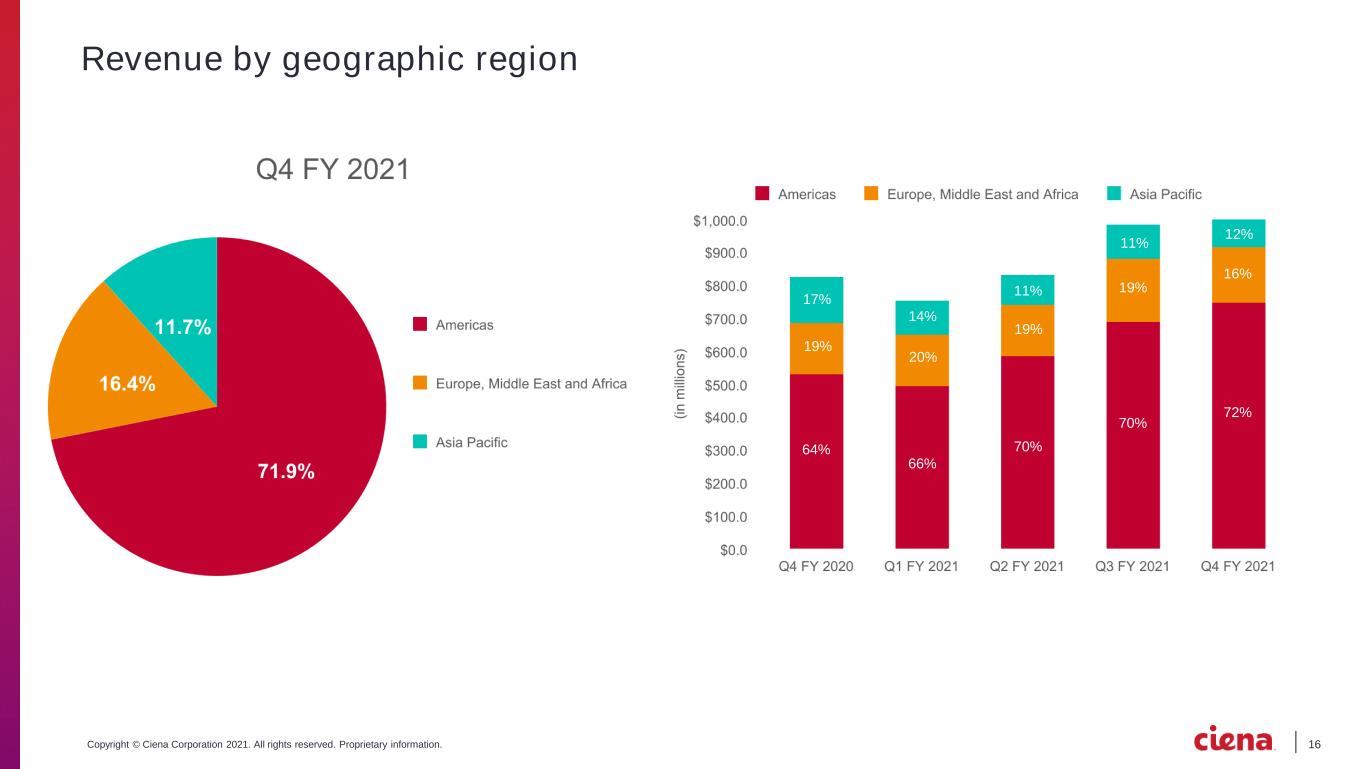
16Copyright © Ciena Corporation 2021. All rights reserved. Proprietary information. Revenue by geographic region 17% 14% 11% 11% 12% 19% 20% 19% 19% 16% 64% 66% 70% 70% 72%
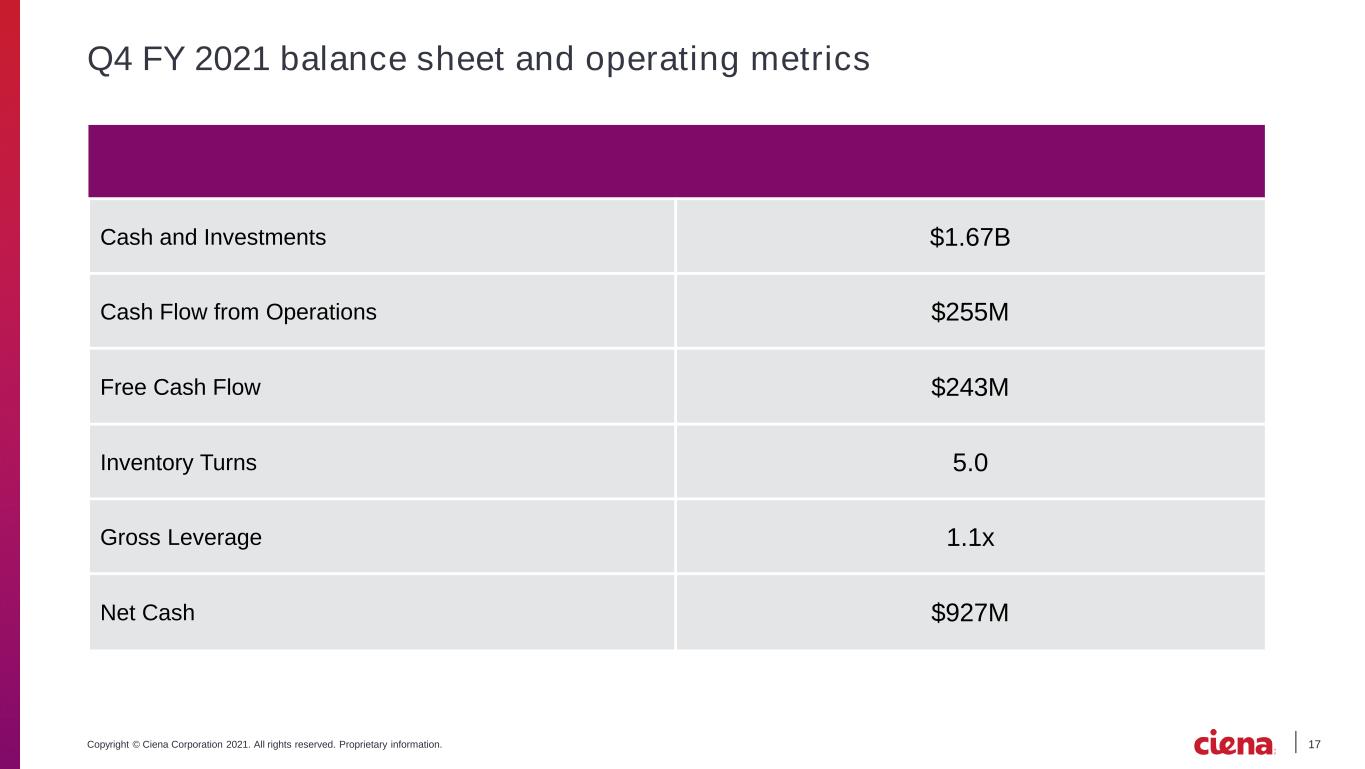
17Copyright © Ciena Corporation 2021. All rights reserved. Proprietary information. Q4 FY 2021 balance sheet and operating metrics Cash and Investments $1.67B Cash Flow from Operations $255M Free Cash Flow $243M Inventory Turns 5.0 Gross Leverage 1.1x Net Cash $927M
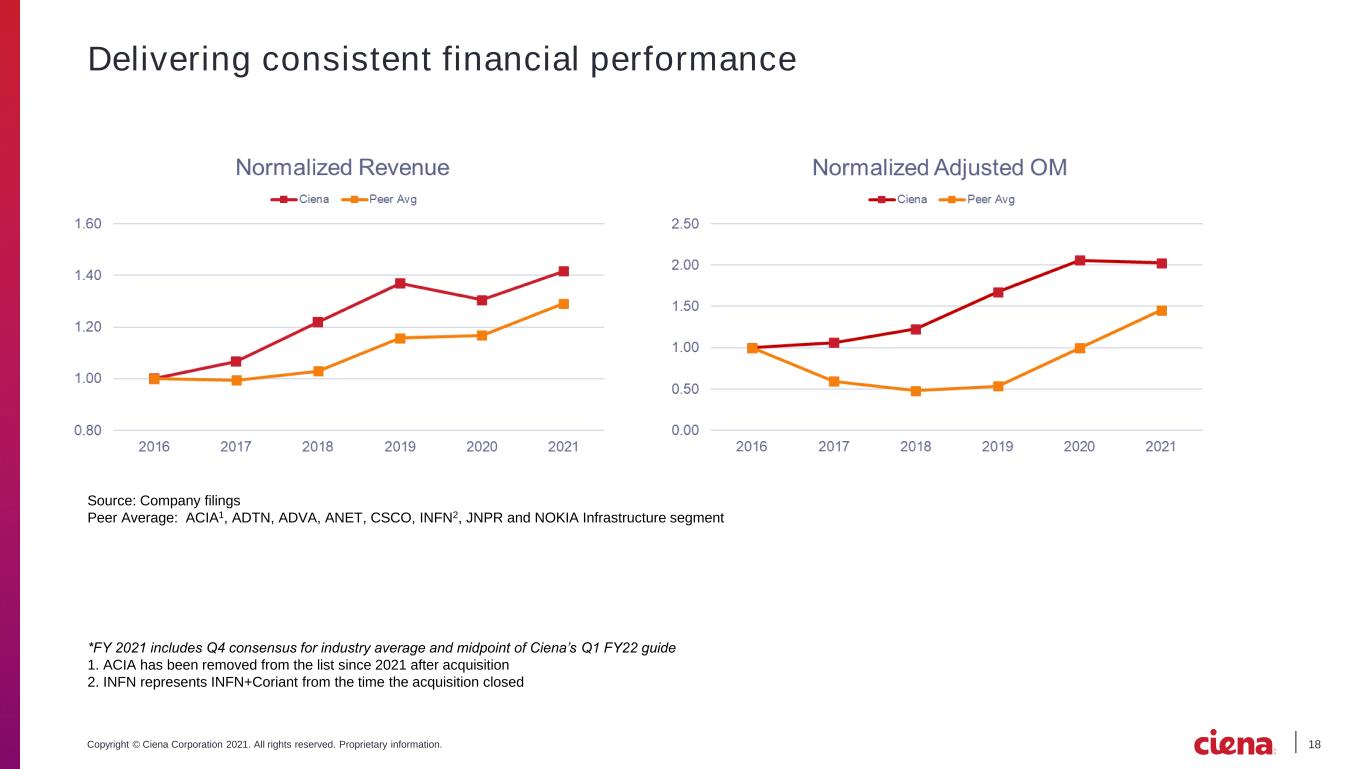
18Copyright © Ciena Corporation 2021. All rights reserved. Proprietary information. Delivering consistent financial performance *FY 2021 includes Q4 consensus for industry average and midpoint of Ciena’s Q1 FY22 guide 1. ACIA has been removed from the list since 2021 after acquisition 2. INFN represents INFN+Coriant from the time the acquisition closed Source: Company filings Peer Average: ACIA1, ADTN, ADVA, ANET, CSCO, INFN2, JNPR and NOKIA Infrastructure segment
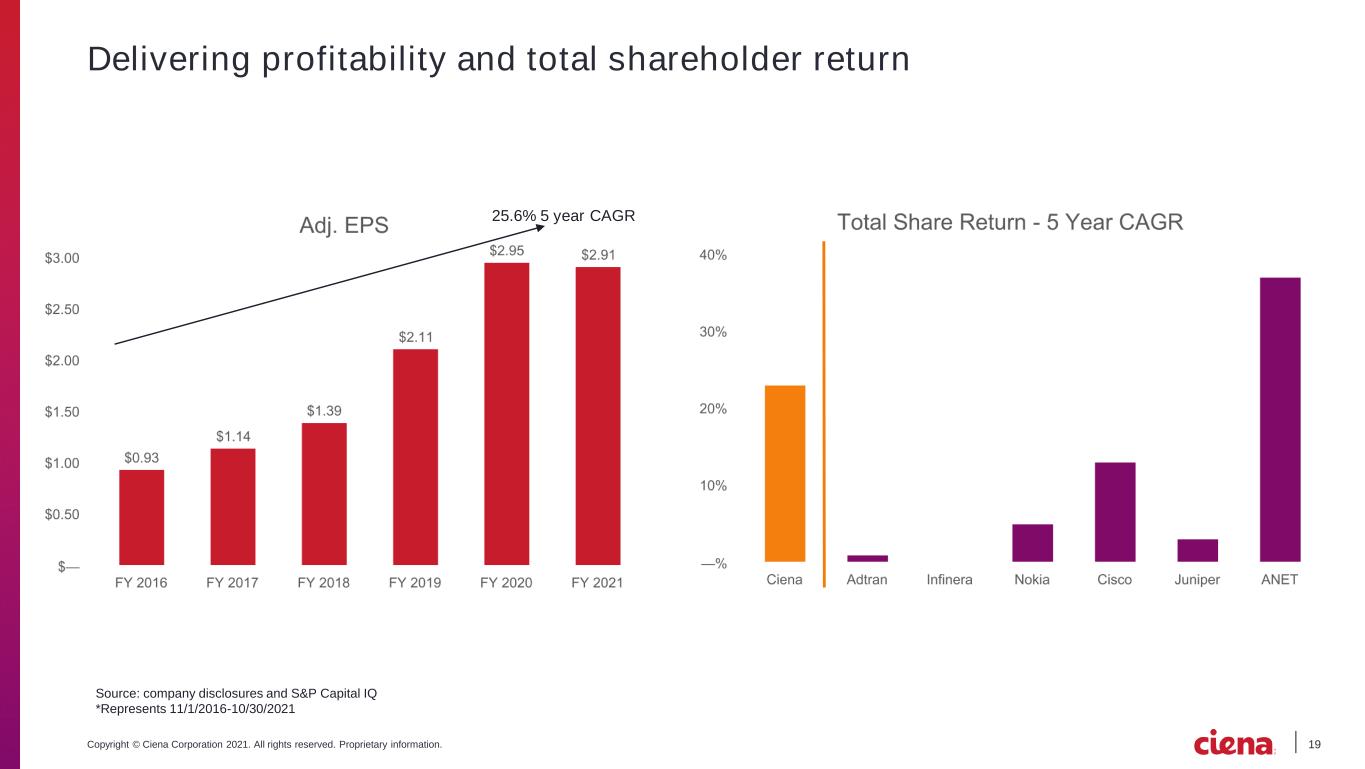
19Copyright © Ciena Corporation 2021. All rights reserved. Proprietary information. Delivering profitability and total shareholder return 25.6% 5 year CAGR Source: company disclosures and S&P Capital IQ *Represents 11/1/2016-10/30/2021
20Copyright © Ciena Corporation 2021. All rights reserved. Proprietary information. Q4 Fiscal 2021 appendix
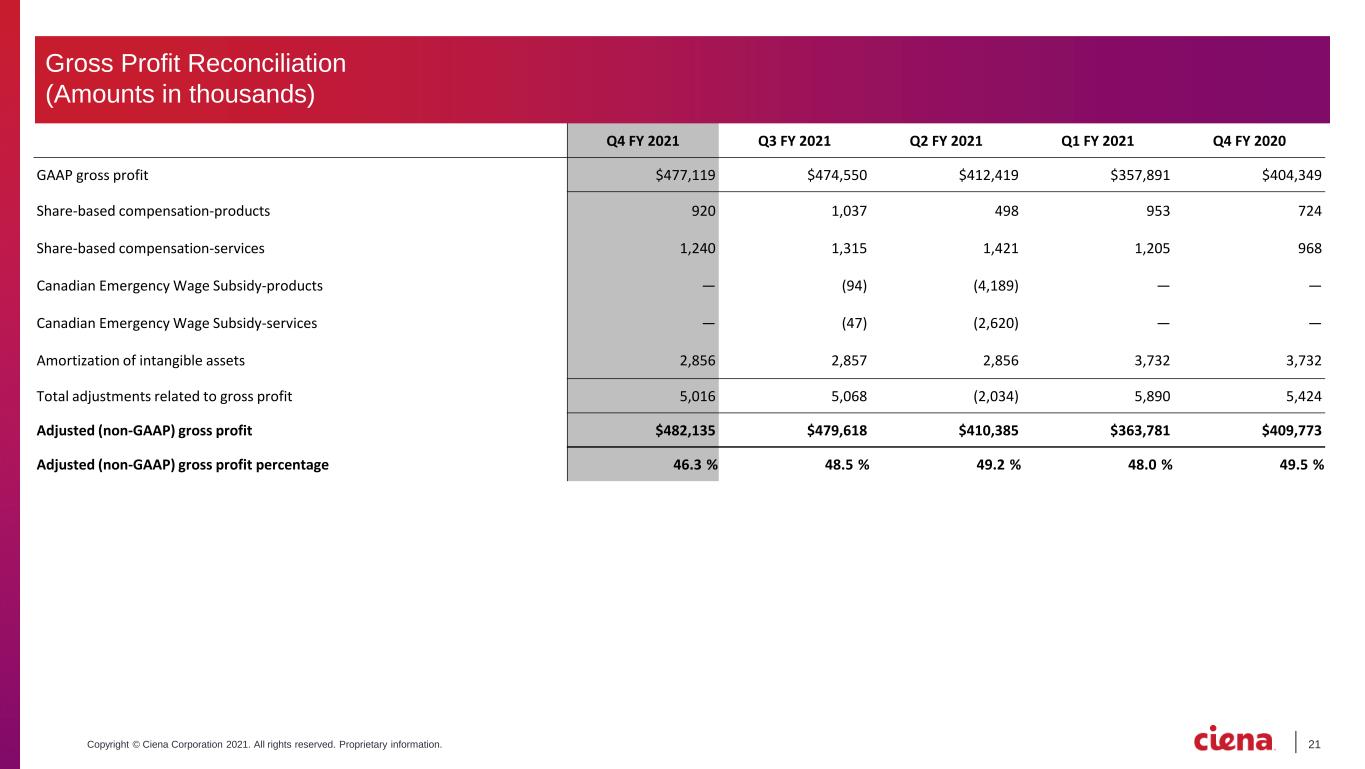
21Copyright © Ciena Corporation 2021. All rights reserved. Proprietary information. Q4 FY 2021 Q3 FY 2021 Q2 FY 2021 Q1 FY 2021 Q4 FY 2020 GAAP gross profit $477,119 $474,550 $412,419 $357,891 $404,349 Share-based compensation-products 920 1,037 498 953 724 Share-based compensation-services 1,240 1,315 1,421 1,205 968 Canadian Emergency Wage Subsidy-products — (94) (4,189) — — Canadian Emergency Wage Subsidy-services — (47) (2,620) — — Amortization of intangible assets 2,856 2,857 2,856 3,732 3,732 Total adjustments related to gross profit 5,016 5,068 (2,034) 5,890 5,424 Adjusted (non-GAAP) gross profit $482,135 $479,618 $410,385 $363,781 $409,773 Adjusted (non-GAAP) gross profit percentage 46.3 % 48.5 % 49.2 % 48.0 % 49.5 % Gross Profit Reconciliation (Amounts in thousands)
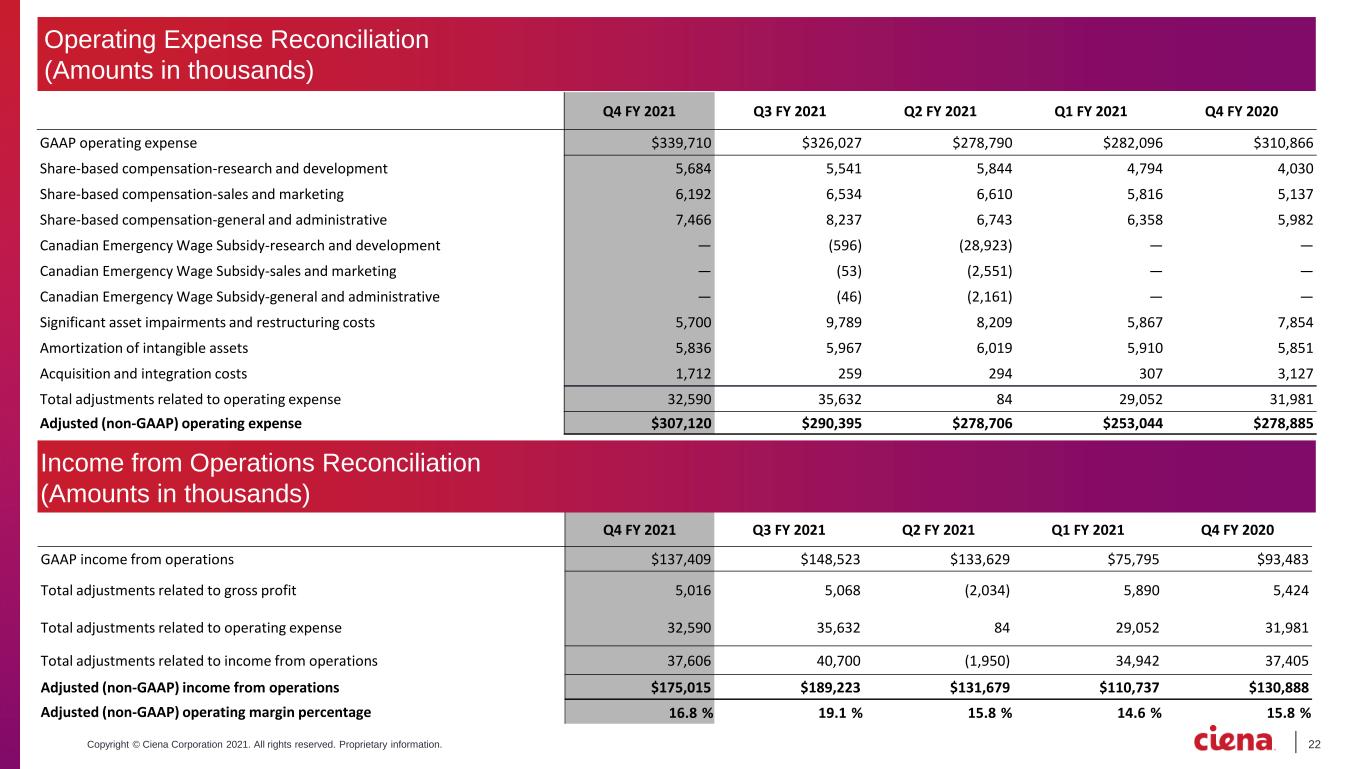
22Copyright © Ciena Corporation 2021. All rights reserved. Proprietary information. Q4 FY 2021 Q3 FY 2021 Q2 FY 2021 Q1 FY 2021 Q4 FY 2020 GAAP operating expense $339,710 $326,027 $278,790 $282,096 $310,866 Share-based compensation-research and development 5,684 5,541 5,844 4,794 4,030 Share-based compensation-sales and marketing 6,192 6,534 6,610 5,816 5,137 Share-based compensation-general and administrative 7,466 8,237 6,743 6,358 5,982 Canadian Emergency Wage Subsidy-research and development — (596) (28,923) — — Canadian Emergency Wage Subsidy-sales and marketing — (53) (2,551) — — Canadian Emergency Wage Subsidy-general and administrative — (46) (2,161) — — Significant asset impairments and restructuring costs 5,700 9,789 8,209 5,867 7,854 Amortization of intangible assets 5,836 5,967 6,019 5,910 5,851 Acquisition and integration costs 1,712 259 294 307 3,127 Total adjustments related to operating expense 32,590 35,632 84 29,052 31,981 Adjusted (non-GAAP) operating expense $307,120 $290,395 $278,706 $253,044 $278,885 Q4 FY 2021 Q3 FY 2021 Q2 FY 2021 Q1 FY 2021 Q4 FY 2020 GAAP income from operations $137,409 $148,523 $133,629 $75,795 $93,483 Total adjustments related to gross profit 5,016 5,068 (2,034) 5,890 5,424 Total adjustments related to operating expense 32,590 35,632 84 29,052 31,981 Total adjustments related to income from operations 37,606 40,700 (1,950) 34,942 37,405 Adjusted (non-GAAP) income from operations $175,015 $189,223 $131,679 $110,737 $130,888 Adjusted (non-GAAP) operating margin percentage 16.8 % 19.1 % 15.8 % 14.6 % 15.8 % Operating Expense Reconciliation (Amounts in thousands) Income from Operations Reconciliation (Amounts in thousands)
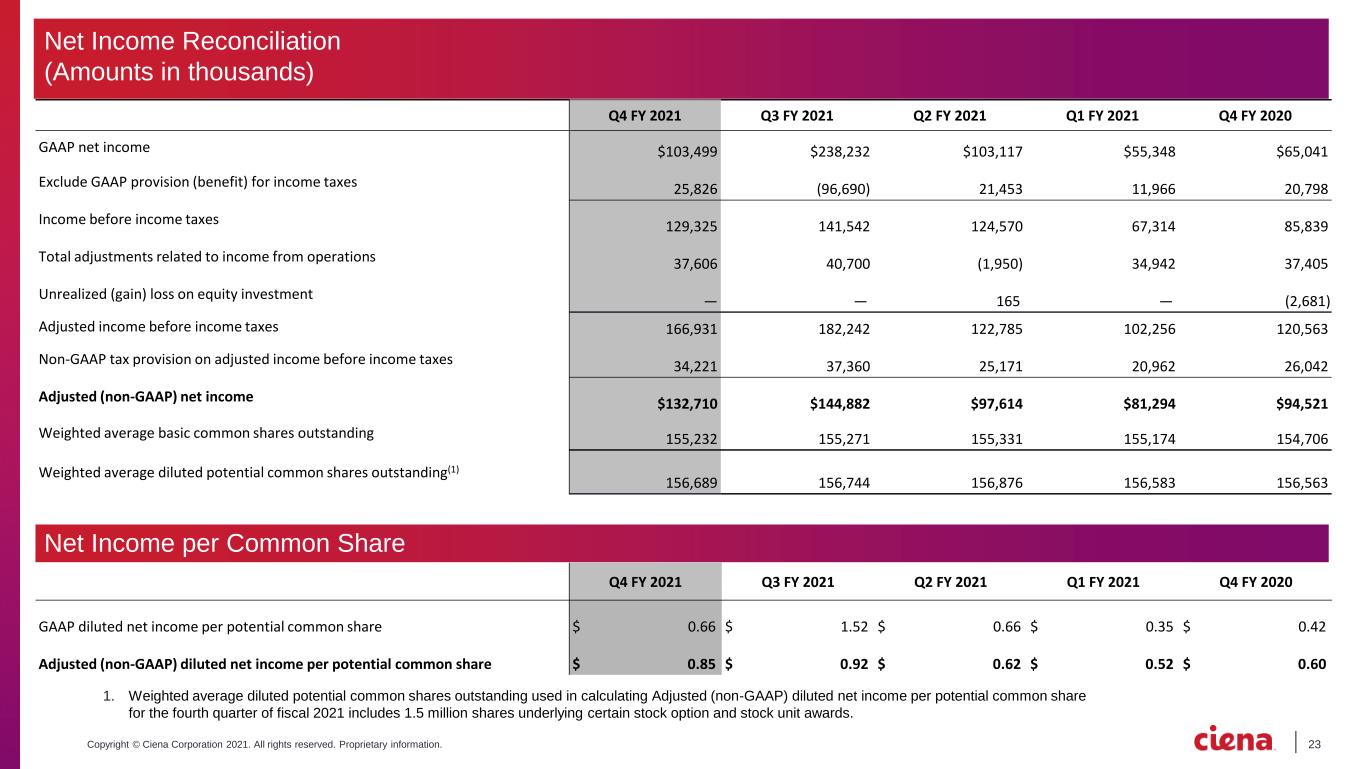
23Copyright © Ciena Corporation 2021. All rights reserved. Proprietary information. Q4 FY 2021 Q3 FY 2021 Q2 FY 2021 Q1 FY 2021 Q4 FY 2020 GAAP net income $103,499 $238,232 $103,117 $55,348 $65,041 Exclude GAAP provision (benefit) for income taxes 25,826 (96,690) 21,453 11,966 20,798 Income before income taxes 129,325 141,542 124,570 67,314 85,839 Total adjustments related to income from operations 37,606 40,700 (1,950) 34,942 37,405 Unrealized (gain) loss on equity investment — — 165 — (2,681) Adjusted income before income taxes 166,931 182,242 122,785 102,256 120,563 Non-GAAP tax provision on adjusted income before income taxes 34,221 37,360 25,171 20,962 26,042 Adjusted (non-GAAP) net income $132,710 $144,882 $97,614 $81,294 $94,521 Weighted average basic common shares outstanding 155,232 155,271 155,331 155,174 154,706 Weighted average diluted potential common shares outstanding(1) 156,689 156,744 156,876 156,583 156,563 Q4 FY 2021 Q3 FY 2021 Q2 FY 2021 Q1 FY 2021 Q4 FY 2020 GAAP diluted net income per potential common share $ 0.66 $ 1.52 $ 0.66 $ 0.35 $ 0.42 Adjusted (non-GAAP) diluted net income per potential common share $ 0.85 $ 0.92 $ 0.62 $ 0.52 $ 0.60 1. Weighted average diluted potential common shares outstanding used in calculating Adjusted (non-GAAP) diluted net income per potential common share for the fourth quarter of fiscal 2021 includes 1.5 million shares underlying certain stock option and stock unit awards. Net Income Reconciliation (Amounts in thousands) Net Income per Common Share
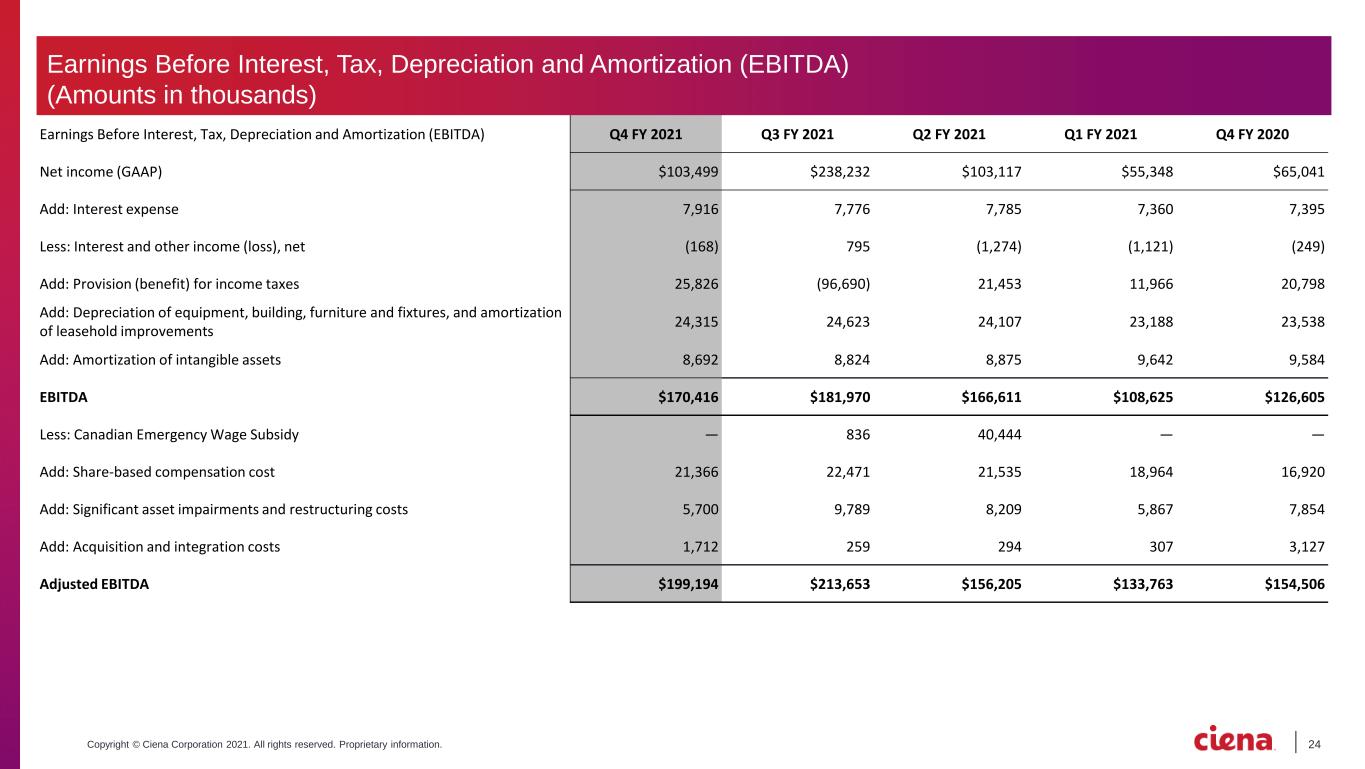
24Copyright © Ciena Corporation 2021. All rights reserved. Proprietary information. Earnings Before Interest, Tax, Depreciation and Amortization (EBITDA) Q4 FY 2021 Q3 FY 2021 Q2 FY 2021 Q1 FY 2021 Q4 FY 2020 Net income (GAAP) $103,499 $238,232 $103,117 $55,348 $65,041 Add: Interest expense 7,916 7,776 7,785 7,360 7,395 Less: Interest and other income (loss), net (168) 795 (1,274) (1,121) (249) Add: Provision (benefit) for income taxes 25,826 (96,690) 21,453 11,966 20,798 Add: Depreciation of equipment, building, furniture and fixtures, and amortization of leasehold improvements 24,315 24,623 24,107 23,188 23,538 Add: Amortization of intangible assets 8,692 8,824 8,875 9,642 9,584 EBITDA $170,416 $181,970 $166,611 $108,625 $126,605 Less: Canadian Emergency Wage Subsidy — 836 40,444 — — Add: Share-based compensation cost 21,366 22,471 21,535 18,964 16,920 Add: Significant asset impairments and restructuring costs 5,700 9,789 8,209 5,867 7,854 Add: Acquisition and integration costs 1,712 259 294 307 3,127 Adjusted EBITDA $199,194 $213,653 $156,205 $133,763 $154,506 Earnings Before Interest, Tax, Depreciation and Amortization (EBITDA) (Amounts in thousands)