© Ciena Corporation 2023. All rights reserved. Proprietary Information. Ciena Corporation Fiscal Q1 2024 Earnings Presentation Period ended January 27, 2024 March 7, 2024
© Ciena Corporation 2023. All rights reserved. Proprietary Information.2 Forward-looking statements and non-GAAP measures You are encouraged to review the Investors section of our website, where we routinely post press releases, Securities and Exchange Commission ("SEC") filings, recent news, financial results, supplemental financial information, and other announcements. From time to time we exclusively post material information to this website along with other disclosure channels that we use. This press release contains certain forward-looking statements that involve risks and uncertainties. These statements are based on current expectations, forecasts, assumptions and other information available to the Company as of the date hereof. Forward-looking statements include statements regarding Ciena's expectations, beliefs, intentions or strategies regarding the future and can be identified by forward-looking words such as "anticipate," "believe," "could," "estimate," "expect," "intend," "may," "should," "will," and "would" or similar words. Ciena's actual results, performance or events may differ materially from these forward-looking statements made or implied due to a number of risks and uncertainties relating to Ciena's business, including: the effect of broader economic and market conditions on our customers, their spending and their businesses and markets; our ability to execute our business and growth strategies; the impact of macroeconomic conditions and global supply chain constraints or disruptions including increased supply costs and lead times; the impact of the introduction of new technologies by us or our competitors; seasonality and the timing and size of customer orders, their delivery dates and our ability to recognize revenue relating to such sales; the level of competitive pressure we encounter; the product, customer and geographic mix of sales within the period; changes in foreign currency exchange rates; factors beyond our control such as natural disasters, climate change, acts of war or terrorism, geopolitical tensions or events, including but not limited to the ongoing conflicts between Ukraine and Russia, and Israel and Hamas, and public health emergencies or epidemics, including the COVID-19 pandemic; changes in tax or trade regulations, including the imposition of tariffs, duties or efforts to withdraw from or materially modify international trade agreements; cyberattacks, data breaches or other security incidents involving our enterprise network environment or our products; regulatory changes, litigation involving our intellectual property or government investigations; and the other risk factors disclosed in Ciena’s periodic reports filed with the Securities and Exchange Commission (SEC) including its Annual Report on Form 10-K filed with the SEC on December 15, 2023 and included in its Quarterly Report on Form 10-Q for the first quarter of fiscal 2024 to be filed with the SEC. All information, statements, and projections in this presentation and the related earnings call speak only as of the date of this presentation and related earnings call. Ciena assumes no obligation to update any forward-looking or other information included in this presentation or related earnings calls, whether as a result of new information, future events or otherwise. In addition, this presentation includes historical, and may include prospective, non-GAAP measures of Ciena’s gross margin, operating expense, operating margin, EBITDA, and net income per share. These measures are not intended to be a substitute for financial information presented in accordance with GAAP. A reconciliation of non-GAAP measures used in this presentation to Ciena’s GAAP results for the relevant period can be found in the Appendix to this presentation. Additional information can also be found in our press release filed this morning and in our reports on Form 10-Q and Form 10K filed with the Securities and Exchange Commission..
© Ciena Corporation 2023. All rights reserved. Proprietary Information.3 Table of Contents 1. Overview & Ciena's portfolio 2. Market context 3. Fiscal Q1 2024 financial performance 4. Appendix

© Ciena Corporation 2023. All rights reserved. Proprietary Information. Overview
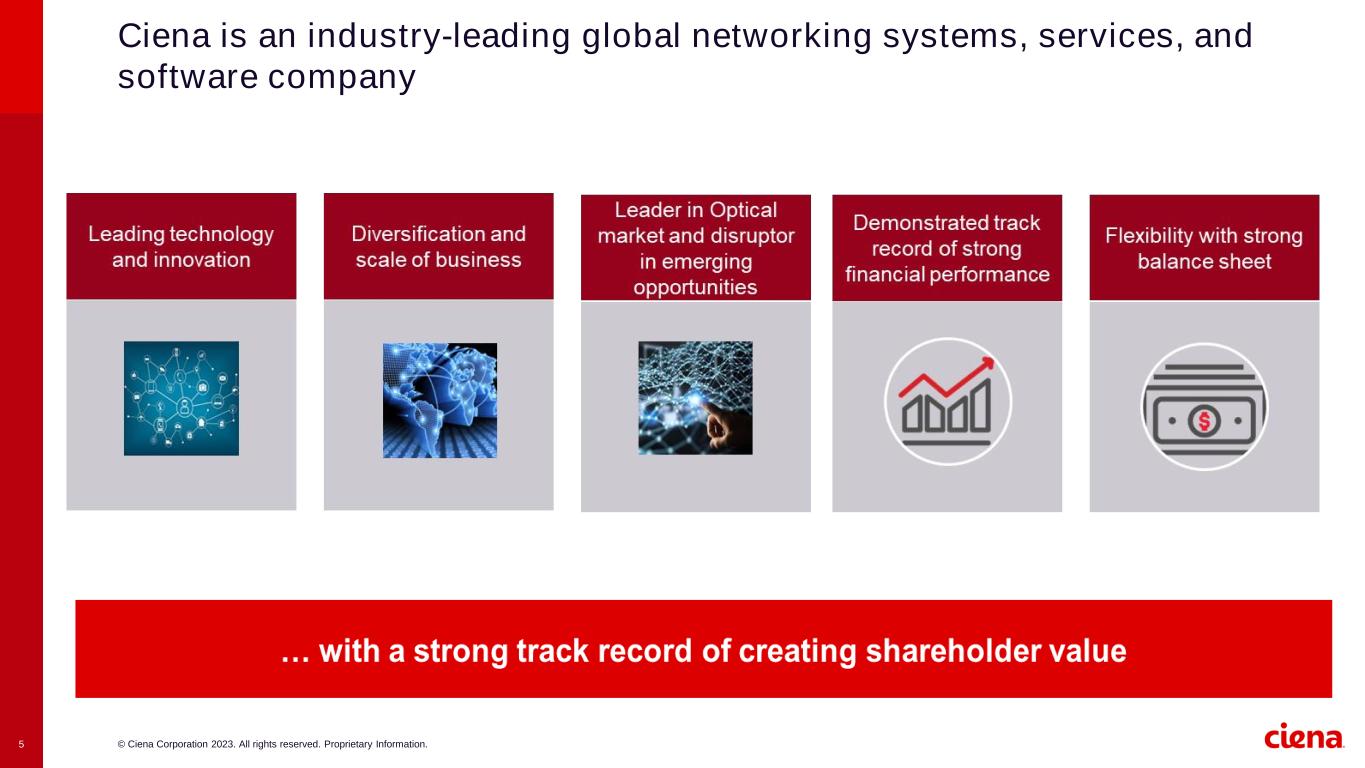
© Ciena Corporation 2023. All rights reserved. Proprietary Information.5 Ciena is an industry-leading global networking systems, services, and software company
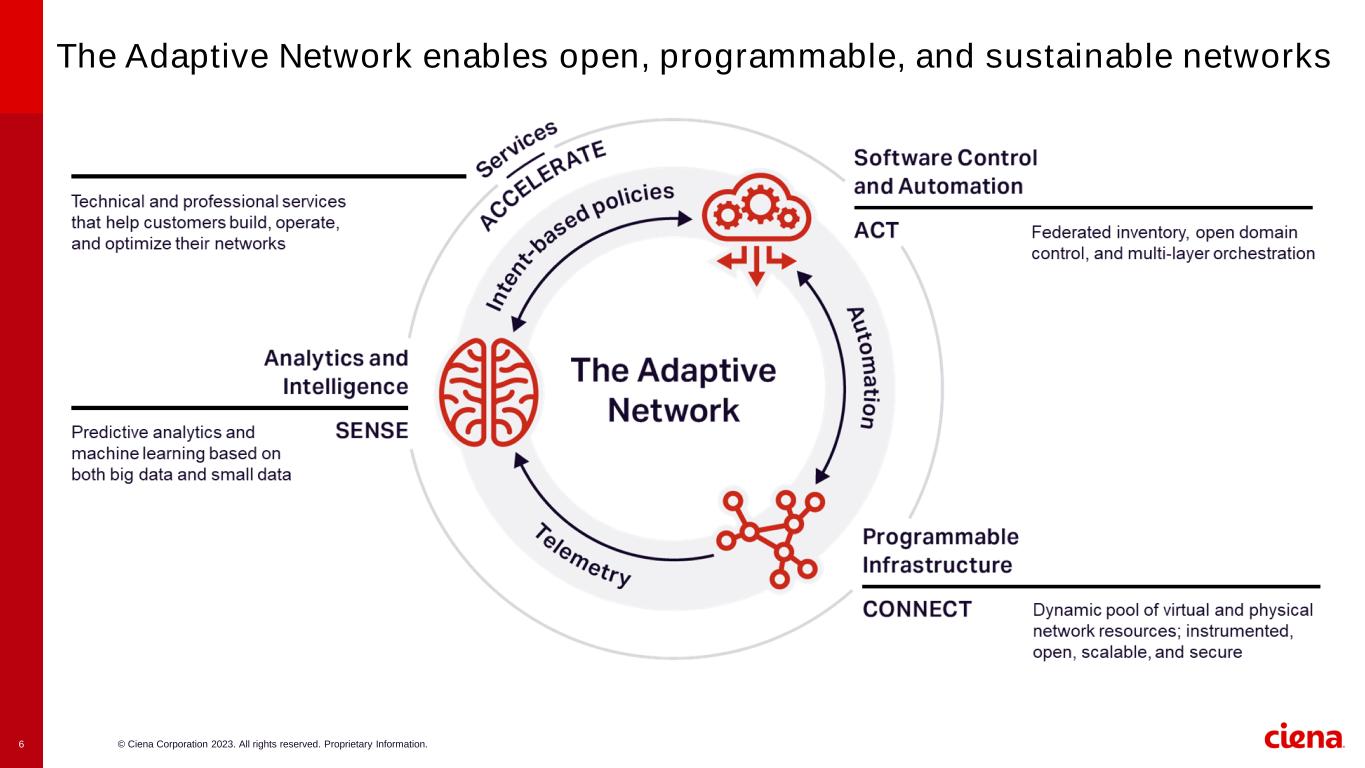
© Ciena Corporation 2023. All rights reserved. Proprietary Information.6 The Adaptive Network enables open, programmable, and sustainable networks

© Ciena Corporation 2023. All rights reserved. Proprietary Information. Market context
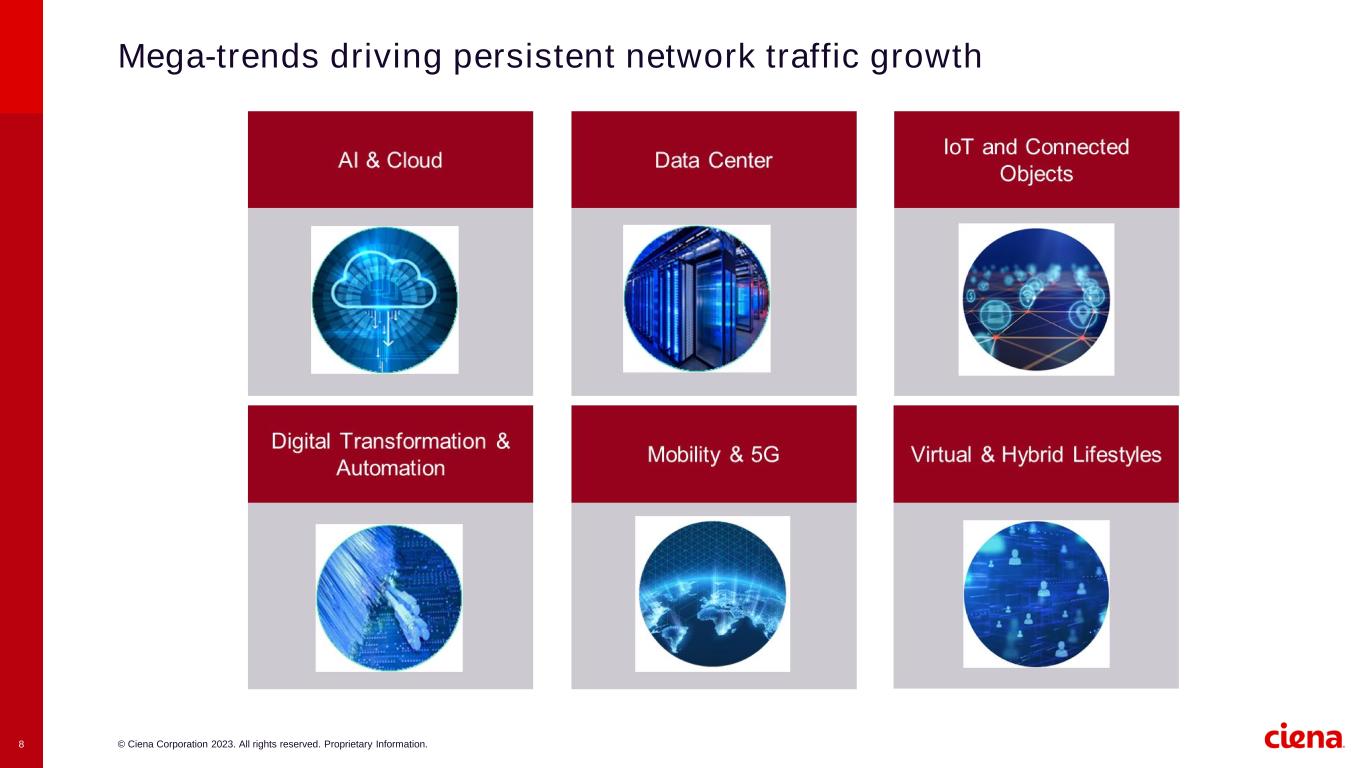
© Ciena Corporation 2023. All rights reserved. Proprietary Information.8 Mega-trends driving persistent network traffic growth
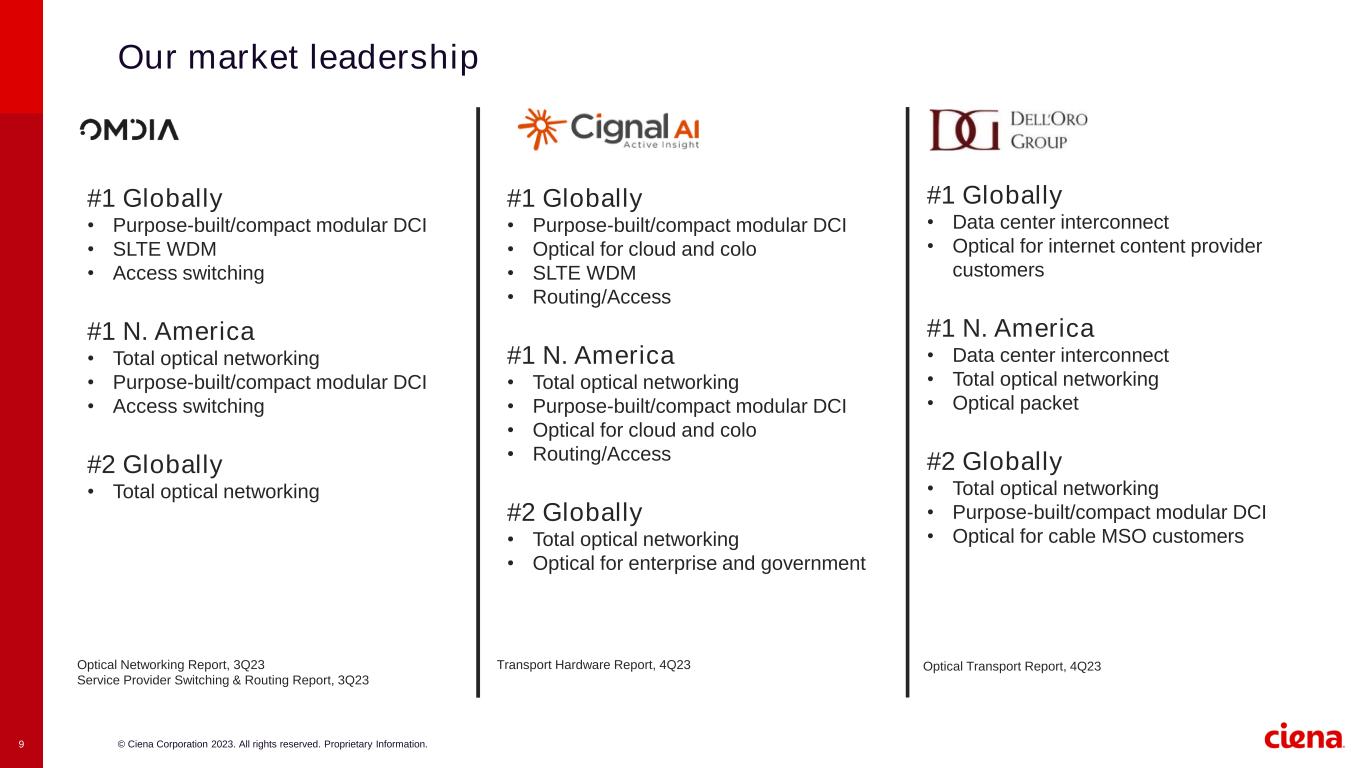
© Ciena Corporation 2023. All rights reserved. Proprietary Information.9 Our market leadership Optical Transport Report, 4Q23Optical Networking Report, 3Q23 Service Provider Switching & Routing Report, 3Q23 Transport Hardware Report, 4Q23 #1 Globally • Data center interconnect • Optical for internet content provider customers #1 N. America • Data center interconnect • Total optical networking • Optical packet #2 Globally • Total optical networking • Purpose-built/compact modular DCI • Optical for cable MSO customers #1 Globally • Purpose-built/compact modular DCI • SLTE WDM • Access switching #1 N. America • Total optical networking • Purpose-built/compact modular DCI • Access switching #2 Globally • Total optical networking #1 Globally • Purpose-built/compact modular DCI • Optical for cloud and colo • SLTE WDM • Routing/Access #1 N. America • Total optical networking • Purpose-built/compact modular DCI • Optical for cloud and colo • Routing/Access #2 Globally • Total optical networking • Optical for enterprise and government
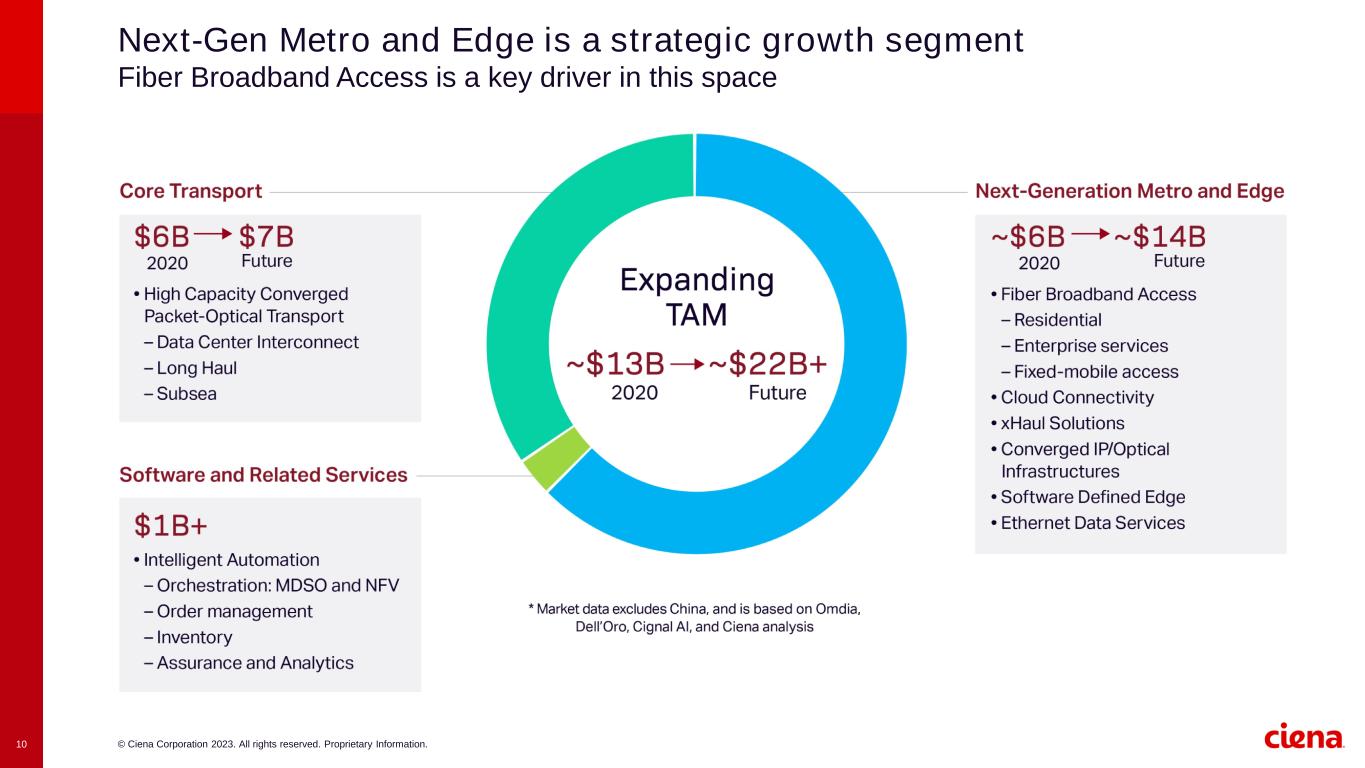
© Ciena Corporation 2023. All rights reserved. Proprietary Information.10 Next-Gen Metro and Edge is a strategic growth segment Fiber Broadband Access is a key driver in this space

© Ciena Corporation 2023. All rights reserved. Proprietary Information. Q1 FY 2024 results
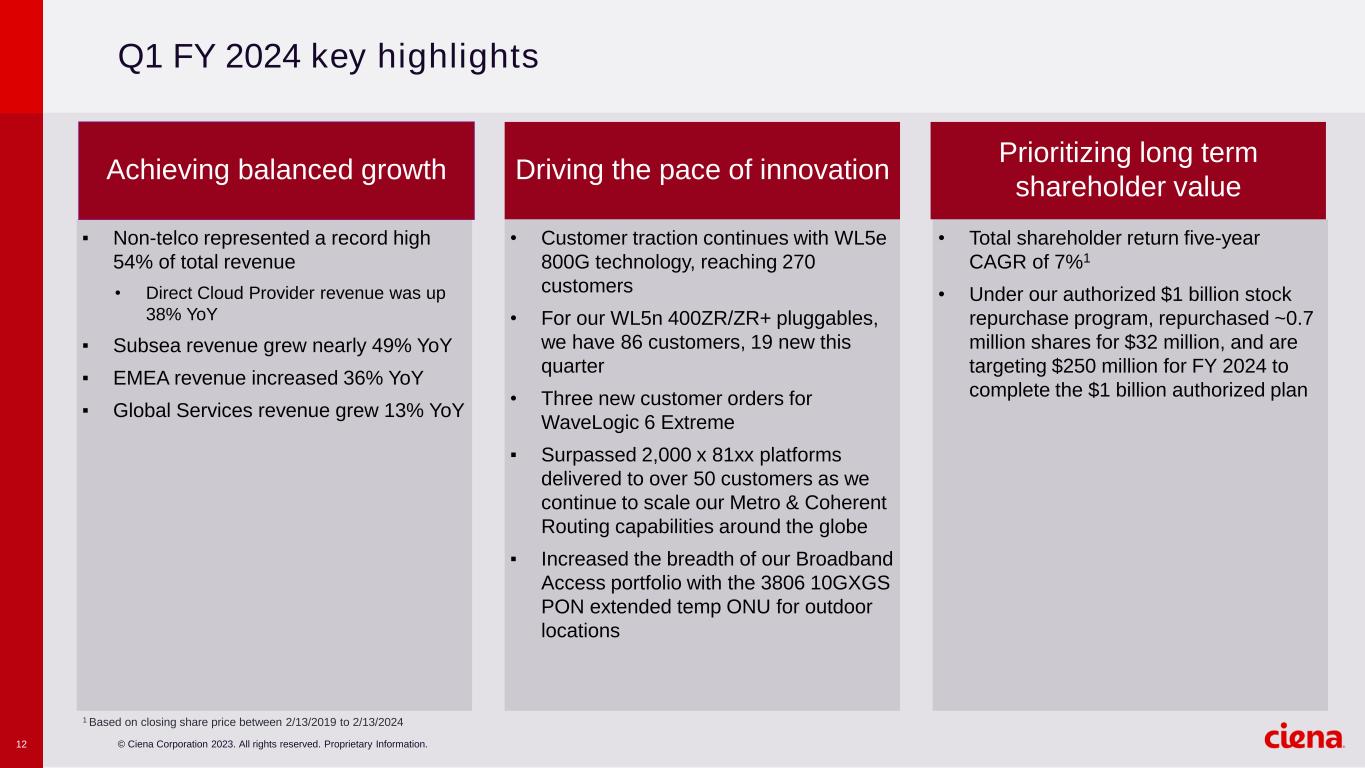
© Ciena Corporation 2023. All rights reserved. Proprietary Information.12 Q1 FY 2024 key highlights ▪ Non-telco represented a record high 54% of total revenue • Direct Cloud Provider revenue was up 38% YoY ▪ Subsea revenue grew nearly 49% YoY ▪ EMEA revenue increased 36% YoY ▪ Global Services revenue grew 13% YoY • Customer traction continues with WL5e 800G technology, reaching 270 customers • For our WL5n 400ZR/ZR+ pluggables, we have 86 customers, 19 new this quarter • Three new customer orders for WaveLogic 6 Extreme ▪ Surpassed 2,000 x 81xx platforms delivered to over 50 customers as we continue to scale our Metro & Coherent Routing capabilities around the globe ▪ Increased the breadth of our Broadband Access portfolio with the 3806 10GXGS PON extended temp ONU for outdoor locations • Total shareholder return five-year CAGR of 7%1 • Under our authorized $1 billion stock repurchase program, repurchased ~0.7 million shares for $32 million, and are targeting $250 million for FY 2024 to complete the $1 billion authorized plan 1 Based on closing share price between 2/13/2019 to 2/13/2024 Achieving balanced growth Prioritizing long term shareholder value Driving the pace of innovation
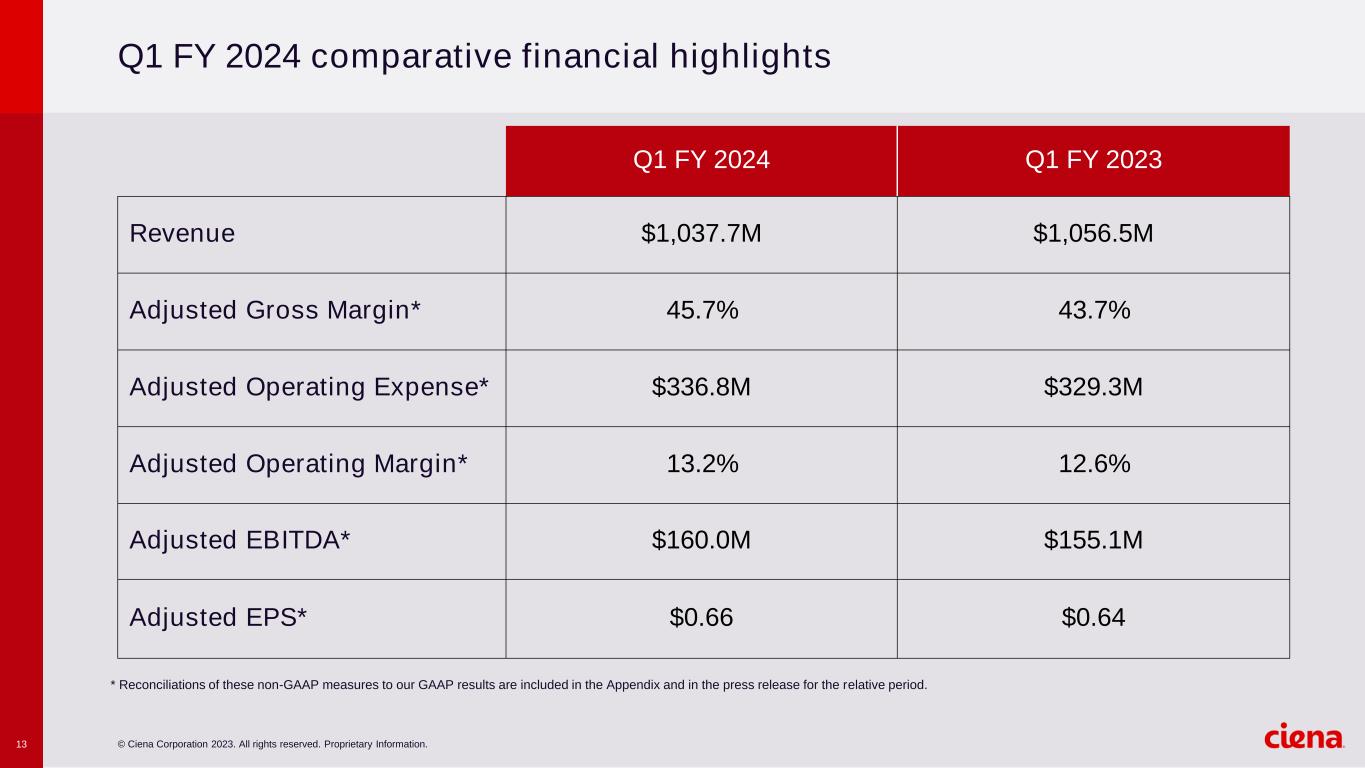
© Ciena Corporation 2023. All rights reserved. Proprietary Information.13 Q1 FY 2024 comparative financial highlights * Reconciliations of these non-GAAP measures to our GAAP results are included in the Appendix and in the press release for the relative period. Q1 FY 2024 Q1 FY 2023 Revenue $1,037.7M $1,056.5M Adjusted Gross Margin* 45.7% 43.7% Adjusted Operating Expense* $336.8M $329.3M Adjusted Operating Margin* 13.2% 12.6% Adjusted EBITDA* $160.0M $155.1M Adjusted EPS* $0.66 $0.64
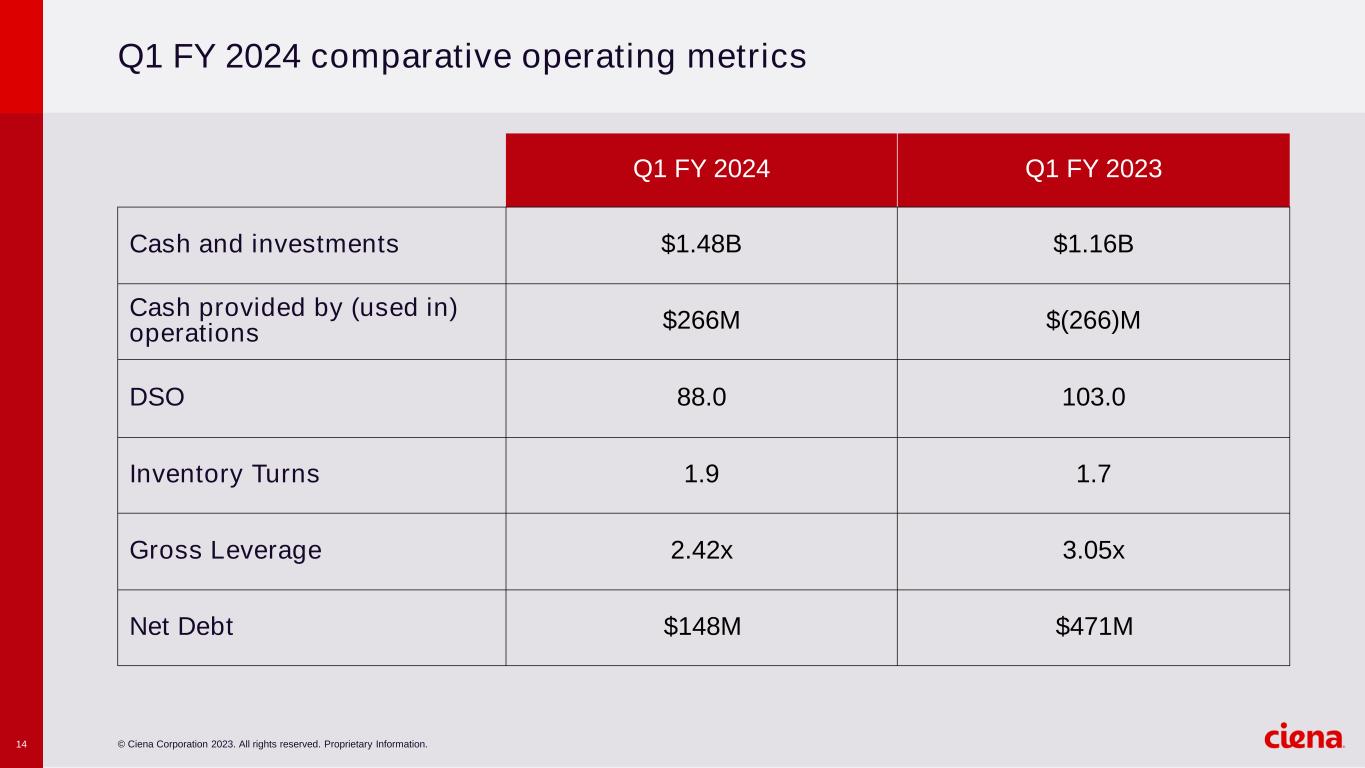
© Ciena Corporation 2023. All rights reserved. Proprietary Information.14 Q1 FY 2024 comparative operating metrics Q1 FY 2024 Q1 FY 2023 Cash and investments $1.48B $1.16B Cash provided by (used in) operations $266M $(266)M DSO 88.0 103.0 Inventory Turns 1.9 1.7 Gross Leverage 2.42x 3.05x Net Debt $148M $471M
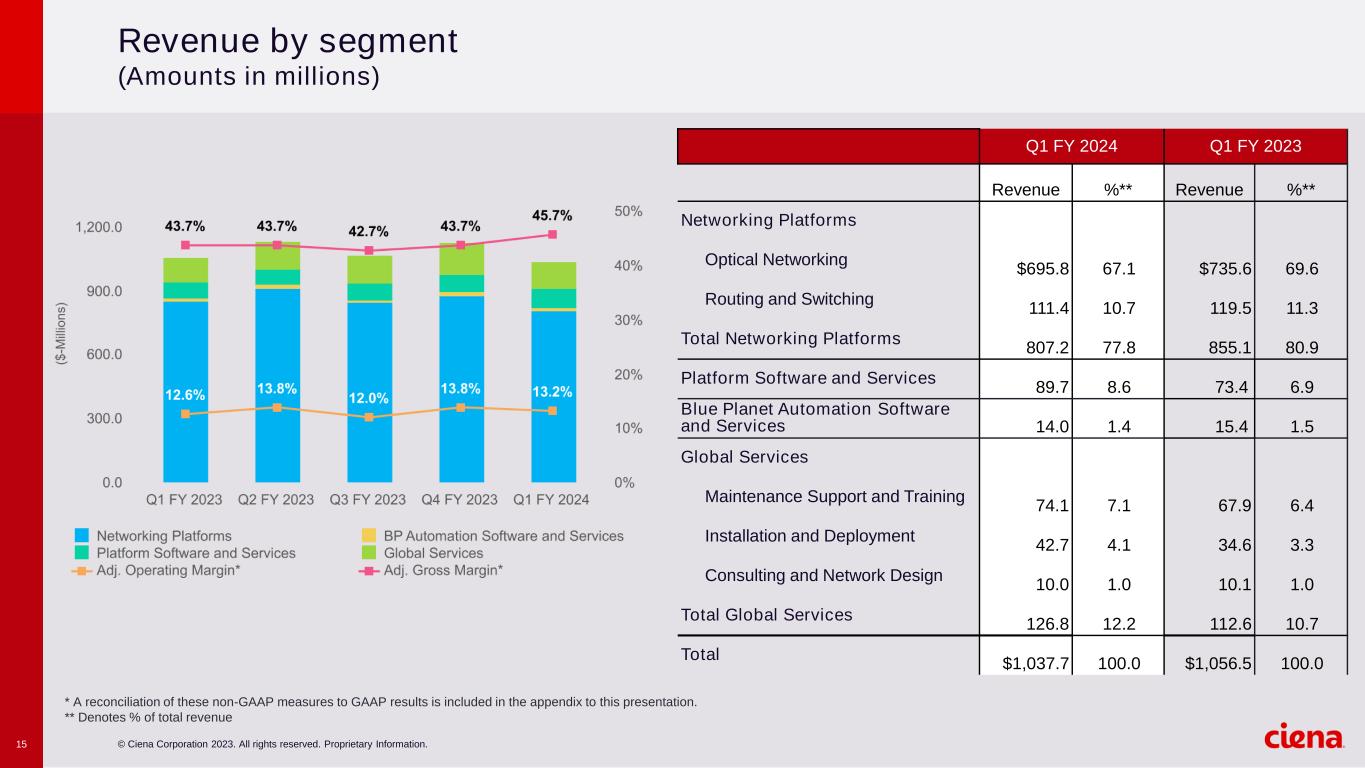
© Ciena Corporation 2023. All rights reserved. Proprietary Information.15 Revenue by segment (Amounts in millions) Q1 FY 2024 Q1 FY 2023 Revenue %** Revenue %** Networking Platforms Optical Networking $695.8 67.1 $735.6 69.6 Routing and Switching 111.4 10.7 119.5 11.3 Total Networking Platforms 807.2 77.8 855.1 80.9 Platform Software and Services 89.7 8.6 73.4 6.9 Blue Planet Automation Software and Services 14.0 1.4 15.4 1.5 Global Services Maintenance Support and Training 74.1 7.1 67.9 6.4 Installation and Deployment 42.7 4.1 34.6 3.3 Consulting and Network Design 10.0 1.0 10.1 1.0 Total Global Services 126.8 12.2 112.6 10.7 Total $1,037.7 100.0 $1,056.5 100.0 * A reconciliation of these non-GAAP measures to GAAP results is included in the appendix to this presentation. ** Denotes % of total revenue
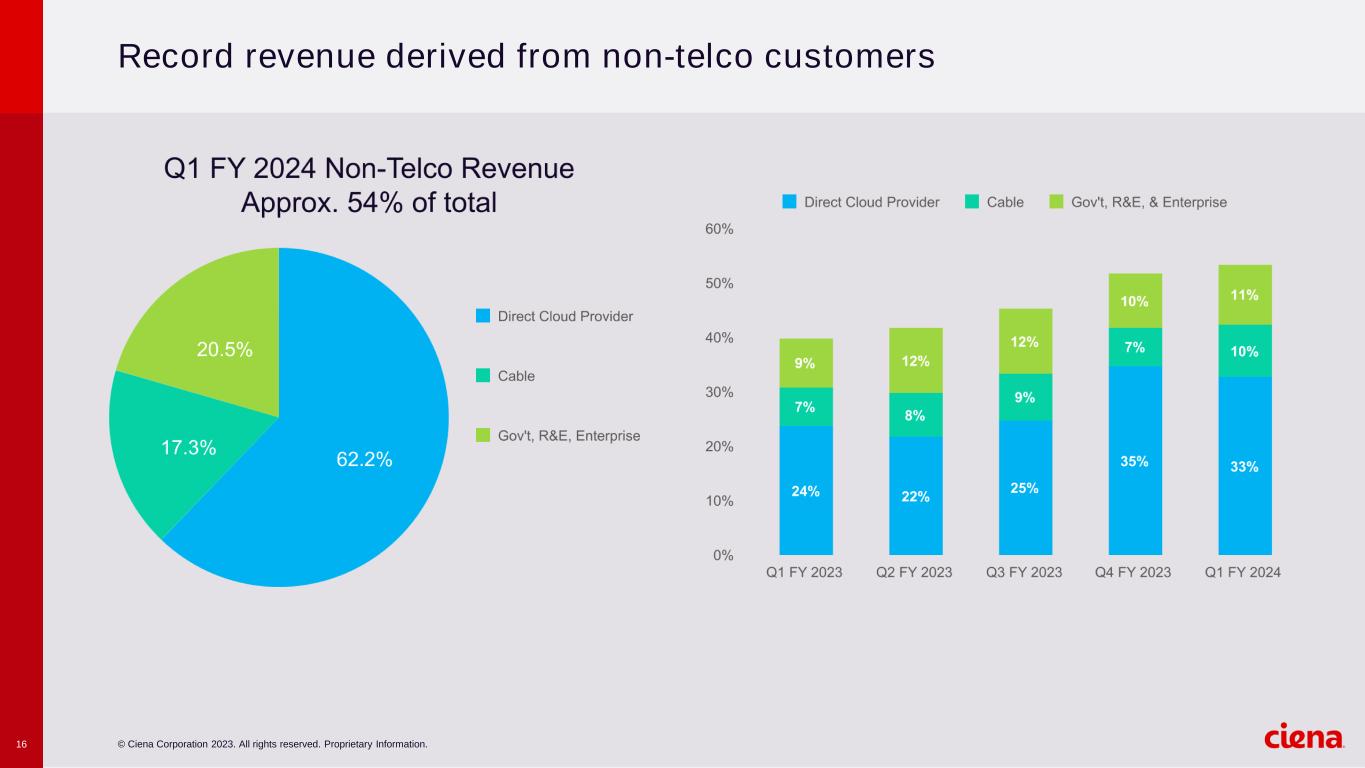
© Ciena Corporation 2023. All rights reserved. Proprietary Information.16 Record revenue derived from non-telco customers
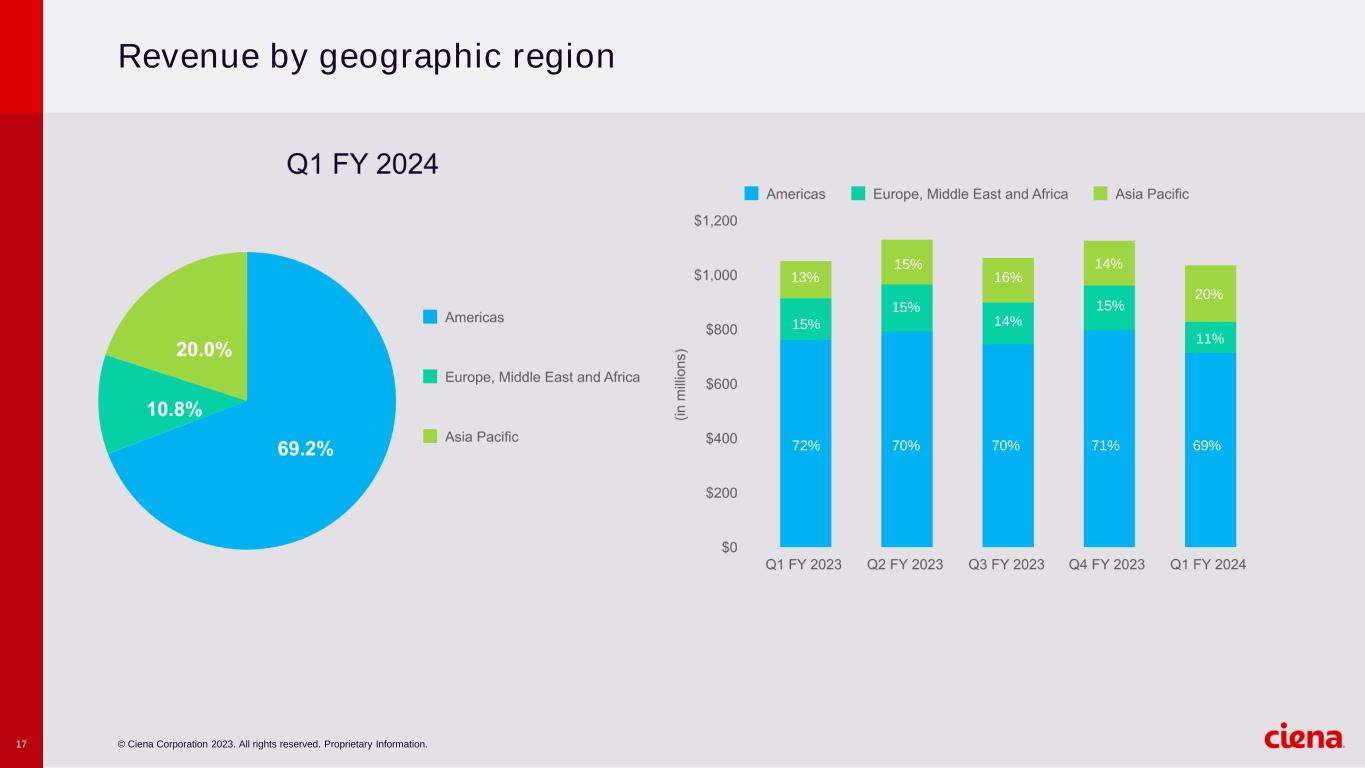
© Ciena Corporation 2023. All rights reserved. Proprietary Information.17 Revenue by geographic region 13% 15% 14% 15% 15% 15% 72% 70% 70% 71% 14% 16% 20% 11% 69%

© Ciena Corporation 2023. All rights reserved. Proprietary Information. Q1 FY 2024 appendix
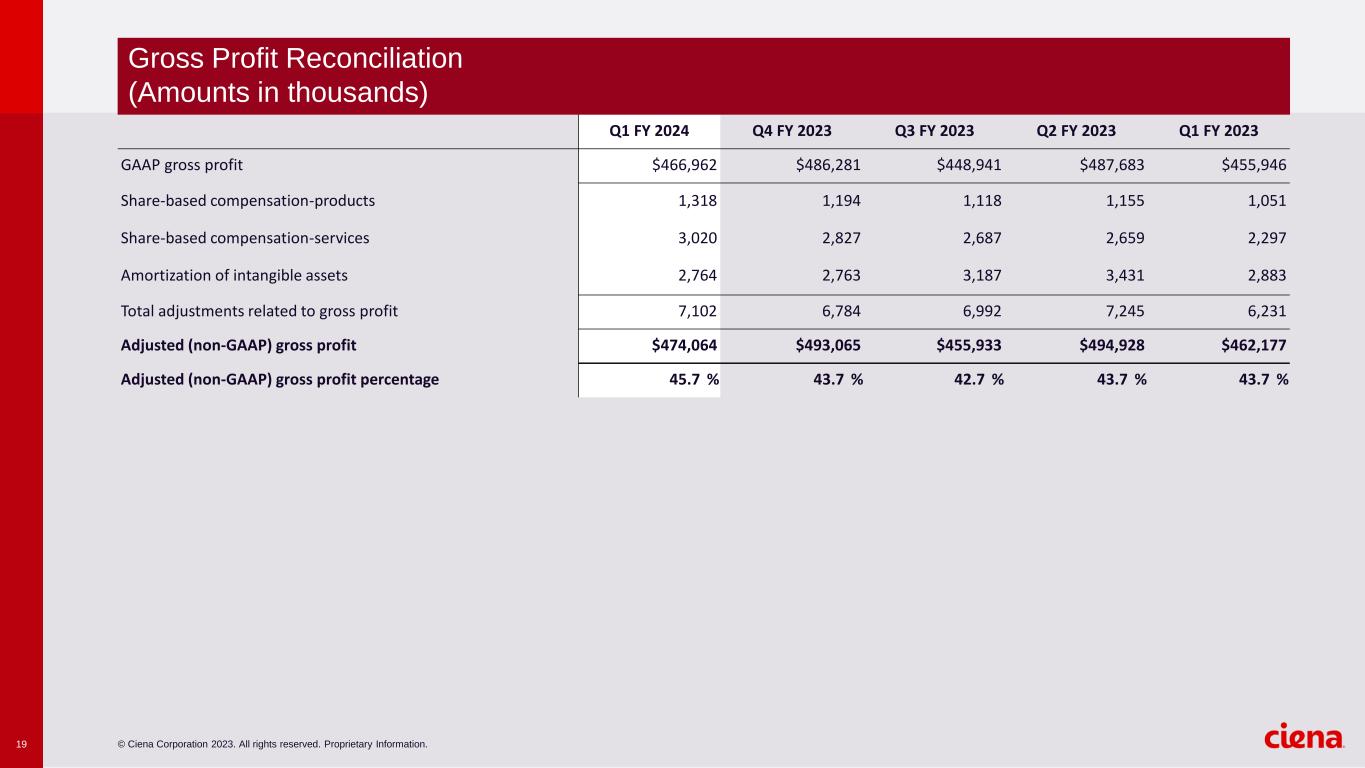
© Ciena Corporation 2023. All rights reserved. Proprietary Information.19 Q1 FY 2024 Q4 FY 2023 Q3 FY 2023 Q2 FY 2023 Q1 FY 2023 GAAP gross profit $466,962 $486,281 $448,941 $487,683 $455,946 Share-based compensation-products 1,318 1,194 1,118 1,155 1,051 Share-based compensation-services 3,020 2,827 2,687 2,659 2,297 Amortization of intangible assets 2,764 2,763 3,187 3,431 2,883 Total adjustments related to gross profit 7,102 6,784 6,992 7,245 6,231 Adjusted (non-GAAP) gross profit $474,064 $493,065 $455,933 $494,928 $462,177 Adjusted (non-GAAP) gross profit percentage 45.7 % 43.7 % 42.7 % 43.7 % 43.7 % Gross Profit Reconciliation (Amounts in thousands)
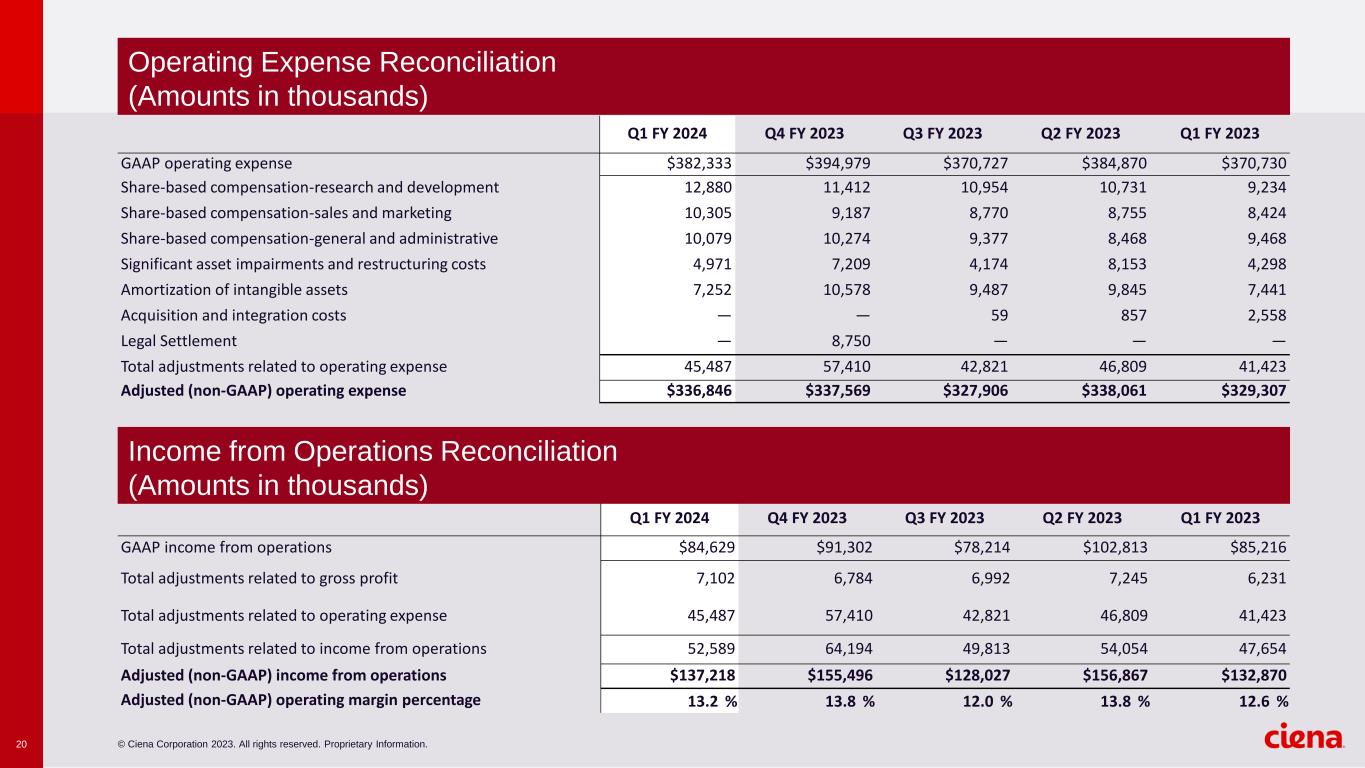
© Ciena Corporation 2023. All rights reserved. Proprietary Information.20 Q1 FY 2024 Q4 FY 2023 Q3 FY 2023 Q2 FY 2023 Q1 FY 2023 GAAP operating expense $382,333 $394,979 $370,727 $384,870 $370,730 Share-based compensation-research and development 12,880 11,412 10,954 10,731 9,234 Share-based compensation-sales and marketing 10,305 9,187 8,770 8,755 8,424 Share-based compensation-general and administrative 10,079 10,274 9,377 8,468 9,468 Significant asset impairments and restructuring costs 4,971 7,209 4,174 8,153 4,298 Amortization of intangible assets 7,252 10,578 9,487 9,845 7,441 Acquisition and integration costs — — 59 857 2,558 Legal Settlement — 8,750 — — — Total adjustments related to operating expense 45,487 57,410 42,821 46,809 41,423 Adjusted (non-GAAP) operating expense $336,846 $337,569 $327,906 $338,061 $329,307 Q1 FY 2024 Q4 FY 2023 Q3 FY 2023 Q2 FY 2023 Q1 FY 2023 GAAP income from operations $84,629 $91,302 $78,214 $102,813 $85,216 Total adjustments related to gross profit 7,102 6,784 6,992 7,245 6,231 Total adjustments related to operating expense 45,487 57,410 42,821 46,809 41,423 Total adjustments related to income from operations 52,589 64,194 49,813 54,054 47,654 Adjusted (non-GAAP) income from operations $137,218 $155,496 $128,027 $156,867 $132,870 Adjusted (non-GAAP) operating margin percentage 13.2 % 13.8 % 12.0 % 13.8 % 12.6 % Operating Expense Reconciliation (Amounts in thousands) Income from Operations Reconciliation (Amounts in thousands)
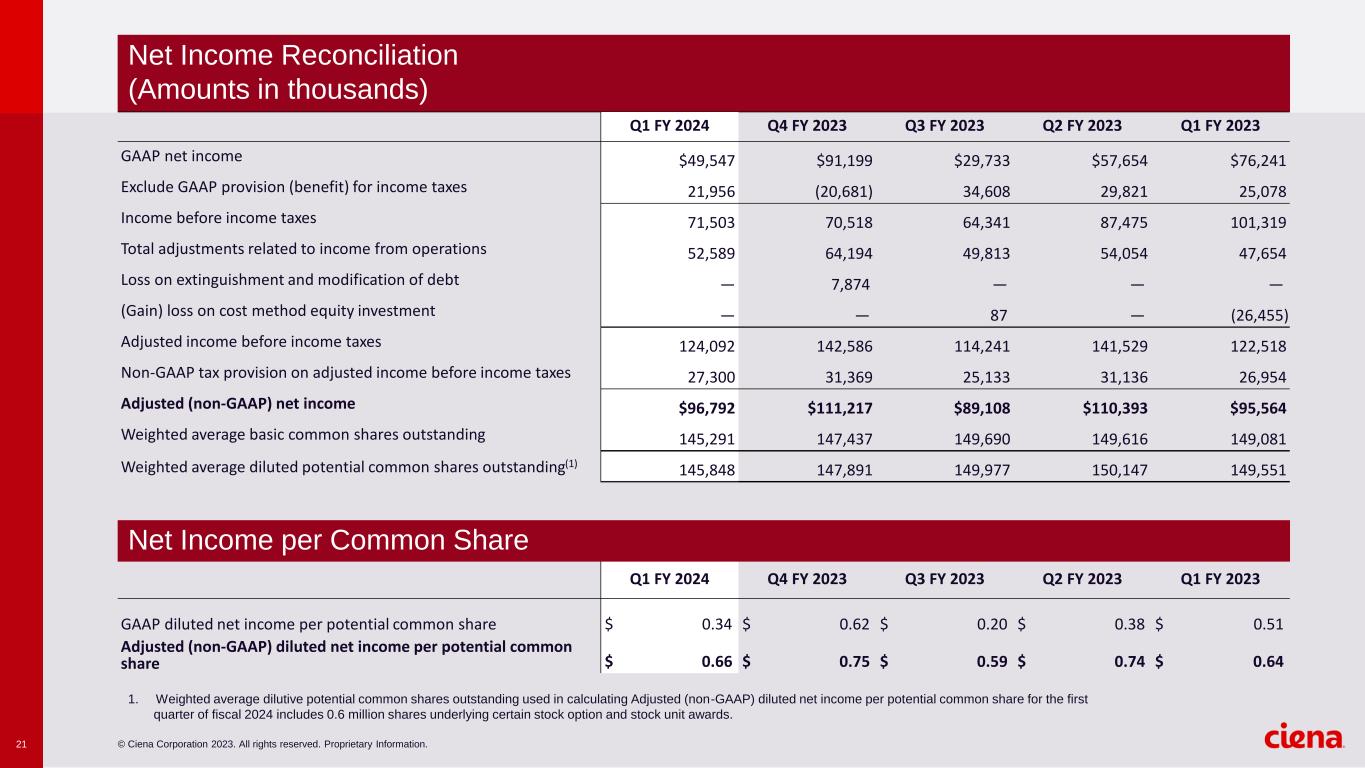
© Ciena Corporation 2023. All rights reserved. Proprietary Information.21 Q1 FY 2024 Q4 FY 2023 Q3 FY 2023 Q2 FY 2023 Q1 FY 2023 GAAP net income $49,547 $91,199 $29,733 $57,654 $76,241 Exclude GAAP provision (benefit) for income taxes 21,956 (20,681) 34,608 29,821 25,078 Income before income taxes 71,503 70,518 64,341 87,475 101,319 Total adjustments related to income from operations 52,589 64,194 49,813 54,054 47,654 Loss on extinguishment and modification of debt — 7,874 — — — (Gain) loss on cost method equity investment — — 87 — (26,455) Adjusted income before income taxes 124,092 142,586 114,241 141,529 122,518 Non-GAAP tax provision on adjusted income before income taxes 27,300 31,369 25,133 31,136 26,954 Adjusted (non-GAAP) net income $96,792 $111,217 $89,108 $110,393 $95,564 Weighted average basic common shares outstanding 145,291 147,437 149,690 149,616 149,081 Weighted average diluted potential common shares outstanding(1) 145,848 147,891 149,977 150,147 149,551 Q1 FY 2024 Q4 FY 2023 Q3 FY 2023 Q2 FY 2023 Q1 FY 2023 GAAP diluted net income per potential common share $ 0.34 $ 0.62 $ 0.20 $ 0.38 $ 0.51 Adjusted (non-GAAP) diluted net income per potential common share $ 0.66 $ 0.75 $ 0.59 $ 0.74 $ 0.64 1. Weighted average dilutive potential common shares outstanding used in calculating Adjusted (non-GAAP) diluted net income per potential common share for the first quarter of fiscal 2024 includes 0.6 million shares underlying certain stock option and stock unit awards. Net Income Reconciliation (Amounts in thousands) Net Income per Common Share
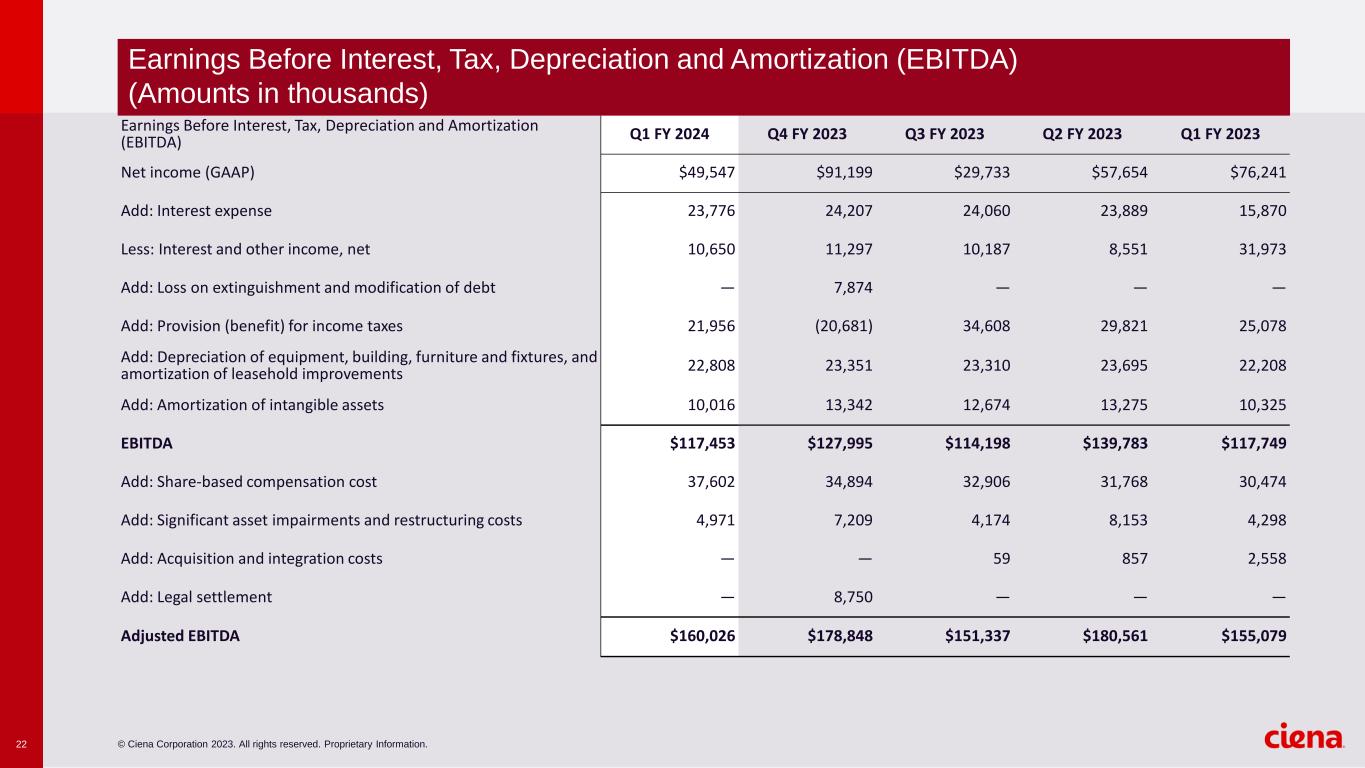
© Ciena Corporation 2023. All rights reserved. Proprietary Information.22 Earnings Before Interest, Tax, Depreciation and Amortization (EBITDA) Q1 FY 2024 Q4 FY 2023 Q3 FY 2023 Q2 FY 2023 Q1 FY 2023 Net income (GAAP) $49,547 $91,199 $29,733 $57,654 $76,241 Add: Interest expense 23,776 24,207 24,060 23,889 15,870 Less: Interest and other income, net 10,650 11,297 10,187 8,551 31,973 Add: Loss on extinguishment and modification of debt — 7,874 — — — Add: Provision (benefit) for income taxes 21,956 (20,681) 34,608 29,821 25,078 Add: Depreciation of equipment, building, furniture and fixtures, and amortization of leasehold improvements 22,808 23,351 23,310 23,695 22,208 Add: Amortization of intangible assets 10,016 13,342 12,674 13,275 10,325 EBITDA $117,453 $127,995 $114,198 $139,783 $117,749 Add: Share-based compensation cost 37,602 34,894 32,906 31,768 30,474 Add: Significant asset impairments and restructuring costs 4,971 7,209 4,174 8,153 4,298 Add: Acquisition and integration costs — — 59 857 2,558 Add: Legal settlement — 8,750 — — — Adjusted EBITDA $160,026 $178,848 $151,337 $180,561 $155,079 Earnings Before Interest, Tax, Depreciation and Amortization (EBITDA) (Amounts in thousands)