PRESS RELEASE
NYSE: CIM
CHIMERA INVESTMENT CORPORATION
520 Madison Avenue
New York, New York 10022
_________________________________________________________________________________________________
Investor Relations
888-895-6557
www.chimerareit.com
FOR IMMEDIATE RELEASE
CHIMERA INVESTMENT CORPORATION REPORTS 1ST QUARTER 2021 EARNINGS
•1ST QUARTER GAAP NET INCOME OF $0.54 PER COMMON SHARE
•1ST QUARTER CORE EARNINGS(1) OF $0.36 PER COMMON SHARE
•GAAP BOOK VALUE OF $11.44 PER COMMON SHARE
•BOARD INCREASED SECOND QUARTER DIVIDEND BY 10% TO $0.33 PER SHARE OF COMMON STOCK
NEW YORK - (BUSINESS WIRE) - Chimera Investment Corporation (NYSE:CIM) today announced its financial results for the first quarter ended March 31, 2021. The Company’s GAAP net income for the first quarter was $139 million, or $0.54 per common share. Core earnings(1) for the first quarter ended March 31, 2021 was $87 million, or $0.36 per common share.
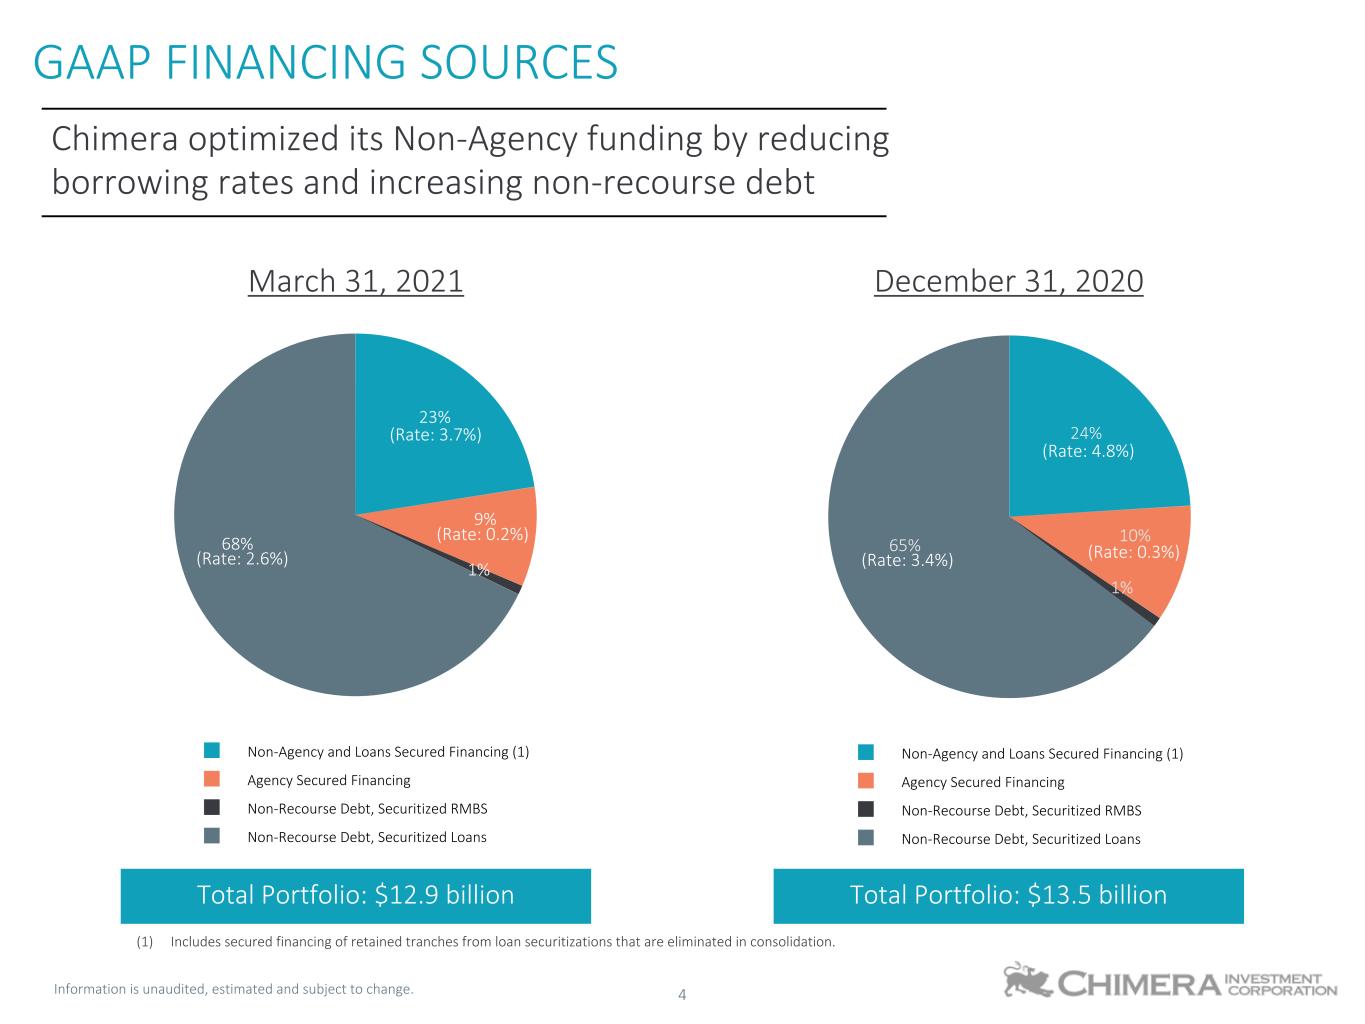
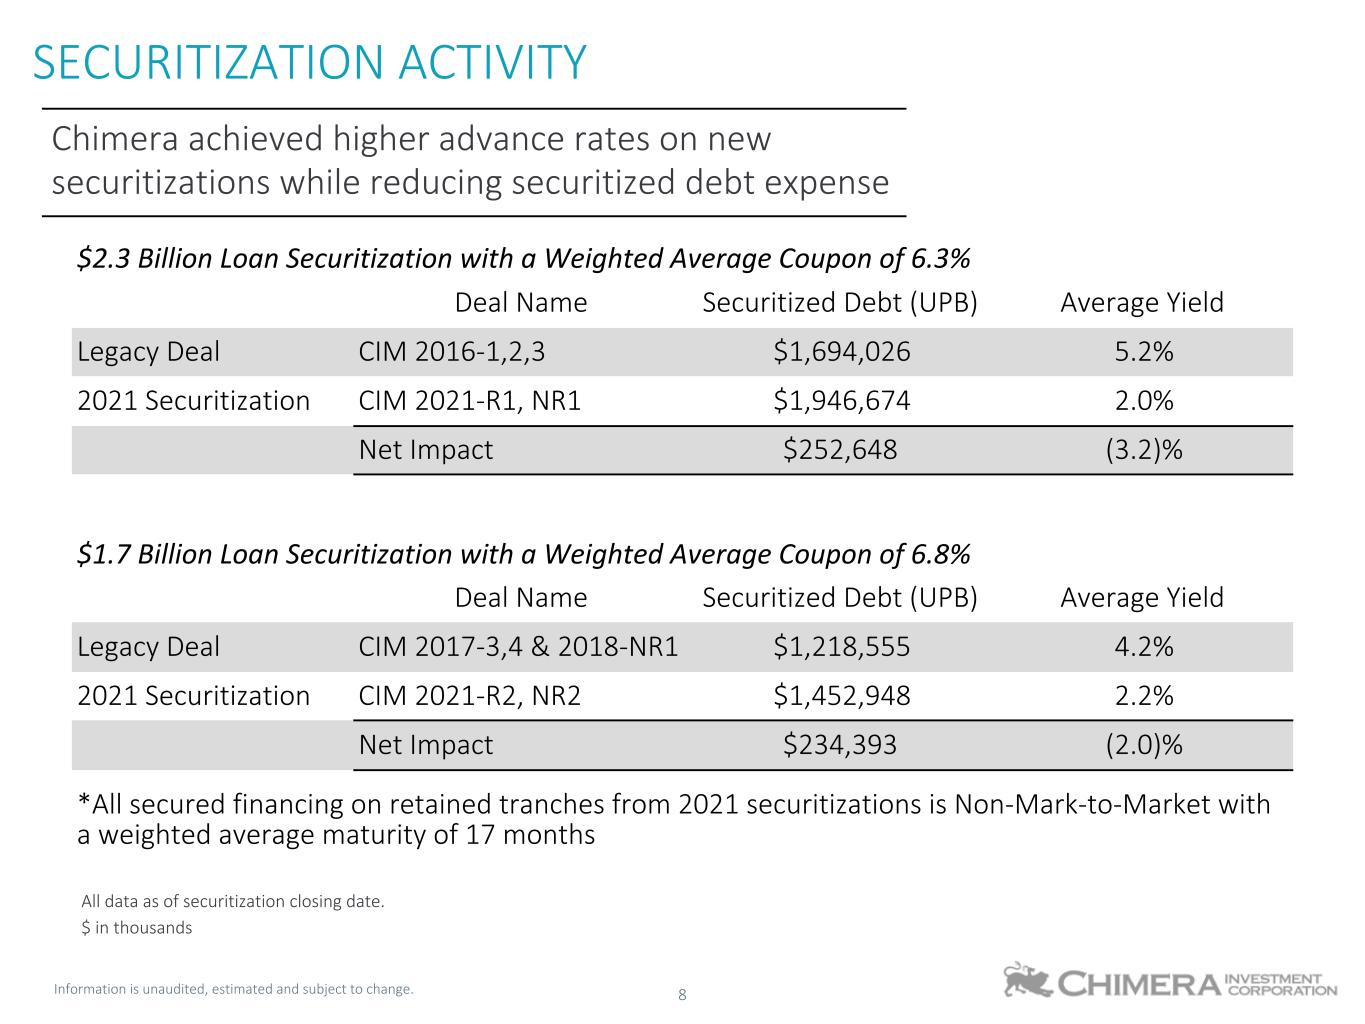
“This quarter we took many proactive steps towards portfolio optimization and the expansion of Chimera’s core earnings. Through re-securitization activity, we lowered the financing cost and freed up capital for future accretive investments”, said Mohit Marria, Chimera’s CEO and Chief Investment Officer. “Securitization of our mortgage assets provides Chimera with low-cost, long-term, non-recourse financing. We expect the re-securitizations from this quarter to benefit our portfolio for a long period of time.”
(1) Core earnings per adjusted diluted common share is a non-GAAP measure. See additional discussion on page 5.
1
Other Information
Chimera Investment Corporation is a publicly traded real estate investment trust, or REIT, that is primarily engaged in the business of investing directly or indirectly through our subsidiaries, on a leveraged basis, in a diversified portfolio of mortgage assets, including residential mortgage loans, Non-Agency RMBS, Agency CMBS, Agency RMBS, and other real estate related securities.
| CHIMERA INVESTMENT CORPORATION | ||||||||
| CONSOLIDATED STATEMENTS OF FINANCIAL CONDITION | ||||||||
| (dollars in thousands, except share and per share data) | ||||||||
| (Unaudited) | ||||||||
| March 31, 2021 | December 31, 2020 | |||||||
| Cash and cash equivalents | $ | 317,489 | $ | 269,090 | ||||
| Non-Agency RMBS, at fair value (net of allowance for credit losses of $54 thousand and $180 thousand, respectively) | 2,013,478 | 2,150,714 | ||||||
| Agency RMBS, at fair value | 86,354 | 90,738 | ||||||
| Agency CMBS, at fair value | 1,355,289 | 1,740,368 | ||||||
| Loans held for investment, at fair value | 12,808,012 | 13,112,129 | ||||||
| Accrued interest receivable | 77,562 | 81,158 | ||||||
| Other assets | 41,078 | 78,822 | ||||||
Total assets (1) | $ | 16,699,262 | $ | 17,523,019 | ||||
| Liabilities: | ||||||||
| Secured financing agreements ($5.7 billion and $6.7 billion pledged as collateral, respectively) | $ | 4,045,912 | $ | 4,636,847 | ||||
| Securitized debt, collateralized by Non-Agency RMBS ($479 million and $505 million pledged as collateral, respectively) | 107,367 | 113,433 | ||||||
| Securitized debt at fair value, collateralized by loans held for investment ($12.1 billion and $12.4 billion pledged as collateral, respectively) | 8,734,372 | 8,711,677 | ||||||
| Long term debt | 51,772 | 51,623 | ||||||
| Payable for investments purchased | 76,534 | 106,169 | ||||||
| Accrued interest payable | 24,855 | 40,950 | ||||||
| Dividends payable | 77,355 | 77,213 | ||||||
| Accounts payable and other liabilities | 14,597 | 5,721 | ||||||
Total liabilities (1) | $ | 13,132,764 | $ | 13,743,633 | ||||
| Stockholders' Equity: | ||||||||
| Preferred Stock, par value of $0.01 per share, 100,000,000 shares authorized: | ||||||||
| 8.00% Series A cumulative redeemable: 5,800,000 shares issued and outstanding, respectively ($145,000 liquidation preference) | $ | 58 | $ | 58 | ||||
| 8.00% Series B cumulative redeemable: 13,000,000 shares issued and outstanding, respectively ($325,000 liquidation preference) | 130 | 130 | ||||||
| 7.75% Series C cumulative redeemable: 10,400,000 shares issued and outstanding, respectively ($260,000 liquidation preference) | 104 | 104 | ||||||
| 8.00% Series D cumulative redeemable: 8,000,000 shares issued and outstanding, respectively ($200,000 liquidation preference) | 80 | 80 | ||||||
| Common stock: par value $0.01 per share; 500,000,000 shares authorized, 230,553,340 and 230,556,760 shares issued and outstanding, respectively | 2,306 | 2,306 | ||||||
| Additional paid-in-capital | 4,320,419 | 4,538,029 | ||||||
| Accumulated other comprehensive income | 493,651 | 558,096 | ||||||
| Cumulative earnings | 4,039,485 | 3,881,894 | ||||||
| Cumulative distributions to stockholders | (5,289,735) | (5,201,311) | ||||||
| Total stockholders' equity | $ | 3,566,498 | $ | 3,779,386 | ||||
| Total liabilities and stockholders' equity | $ | 16,699,262 | $ | 17,523,019 | ||||
(1) The Company's consolidated statements of financial condition include assets of consolidated variable interest entities (“VIEs”) that can only be used to settle obligations and liabilities of the VIE for which creditors do not have recourse to the primary beneficiary (Chimera Investment Corporation). As of March 31, 2021, and December 31, 2020, total assets of consolidated VIEs were $11,736,522 and $12,165,017, respectively, and total liabilities of consolidated VIEs were $8,113,248 and $8,063,110, respectively.
2
| CHIMERA INVESTMENT CORPORATION | ||||||||
| CONSOLIDATED STATEMENTS OF OPERATIONS | ||||||||
| (dollars in thousands, except share and per share data) | ||||||||
| (Unaudited) | ||||||||
| For the Quarters Ended | ||||||||
| March 31, 2021 | March 31, 2020 | |||||||
| Net interest income: | ||||||||
Interest income (1) | $ | 243,127 | $ | 300,266 | ||||
Interest expense (2) | 108,066 | 142,083 | ||||||
| Net interest income | 135,061 | 158,183 | ||||||
| Increase/(decrease) in provision for credit losses | (126) | 6,314 | ||||||
| Other investment gains (losses): | ||||||||
| Net unrealized gains (losses) on derivatives | — | 201,000 | ||||||
| Realized gains (losses) on terminations of interest rate swaps | — | (463,966) | ||||||
| Net realized gains (losses) on derivatives | — | (41,086) | ||||||
| Net gains (losses) on derivatives | — | (304,052) | ||||||
| Net unrealized gains (losses) on financial instruments at fair value | 270,012 | (260,887) | ||||||
| Net realized gains (losses) on sales of investments | 37,796 | 75,854 | ||||||
| Gains (losses) on extinguishment of debt | (237,137) | — | ||||||
| Total other gains (losses) | 70,671 | (489,085) | ||||||
| Other expenses: | ||||||||
| Compensation and benefits | 13,439 | 12,934 | ||||||
| General and administrative expenses | 5,198 | 5,137 | ||||||
| Servicing and asset manager fees | 9,281 | 10,530 | ||||||
| Transaction expenses | 16,437 | 4,906 | ||||||
| Total other expenses | 44,355 | 33,507 | ||||||
| Income (loss) before income taxes | 161,503 | (370,723) | ||||||
| Income taxes | 3,912 | 32 | ||||||
| Net income (loss) | $ | 157,591 | $ | (370,755) | ||||
| Dividends on preferred stock | 18,438 | 18,438 | ||||||
| Net income (loss) available to common shareholders | $ | 139,153 | $ | (389,193) | ||||
| Net income (loss) per share available to common shareholders: | ||||||||
| Basic | $ | 0.60 | $ | (2.08) | ||||
| Diluted | $ | 0.54 | $ | (2.08) | ||||
| Weighted average number of common shares outstanding: | ||||||||
| Basic | 230,567,231 | 187,018,602 | ||||||
| Diluted | 261,435,081 | 187,018,602 | ||||||
(1) Includes interest income of consolidated VIEs of $158,100 and $174,681 for the quarters ended March 31, 2021 and 2020, respectively.
(2) Includes interest expense of consolidated VIEs of $65,205 and $64,629 for the quarters ended March 31, 2021 and 2020, respectively.
3
| CHIMERA INVESTMENT CORPORATION | ||||||||
| CONSOLIDATED STATEMENTS OF COMPREHENSIVE INCOME (LOSS) | ||||||||
| (dollars in thousands, except share and per share data) | ||||||||
| (Unaudited) | ||||||||
| For the Quarters Ended | ||||||||
| March 31, 2021 | March 31, 2020 | |||||||
| Comprehensive income (loss): | ||||||||
| Net income (loss) | $ | 157,591 | $ | (370,755) | ||||
| Other comprehensive income: | ||||||||
| Unrealized gains (losses) on available-for-sale securities, net | (38,652) | (199,204) | ||||||
| Reclassification adjustment for net realized losses (gains) included in net income | (25,793) | (6,641) | ||||||
| Other comprehensive income (loss) | (64,445) | (205,845) | ||||||
| Comprehensive income (loss) before preferred stock dividends | $ | 93,146 | $ | (576,600) | ||||
| Dividends on preferred stock | $ | 18,438 | $ | 18,438 | ||||
| Comprehensive income (loss) available to common stock shareholders | $ | 74,708 | $ | (595,038) | ||||
4
Core earnings
Core earnings is a non-GAAP measure and is defined as GAAP net income excluding unrealized gains on the aggregate portfolio, provision for credit losses, interest expense on long term debt, impairment losses, realized gains on sales of investments, realized gains or losses on futures, realized gains or losses on swap terminations, gain on deconsolidation, extinguishment of debt and expenses incurred in relation to securitizations. In addition, stock compensation expense charges incurred on awards to retirement eligible employees is reflected as an expense over a vesting period (36 months) rather than reported as an immediate expense.
As defined, core earnings include interest income and expense, as well as periodic cash settlements on interest rate swaps used to hedge interest rate risk and other expenses. Core earnings is inclusive of preferred dividend charges, compensation and benefits (adjusted for awards to retirement eligible employees), general and administrative expenses, servicing fees, as well as income tax expenses incurred during the period. Management believes that the presentation of core earnings provides investors with a useful measure but has important limitations. We believe core earnings as described above helps us evaluate our financial performance period over period without the impact of certain transactions but is of limited usefulness as an analytical tool. Therefore, core earnings should not be viewed in isolation and is not a substitute for net income or net income per basic share computed in accordance with GAAP. In addition, our methodology for calculating core earnings may differ from the methodologies employed by other REITs to calculate the same or similar supplemental performance measures, and accordingly, our reported core earnings may not be comparable to the core earnings reported by other REITs.
The following table provides GAAP measures of net income and net income per diluted share available to common stockholders for the periods presented and details with respect to reconciling the line items to core earnings and related per average diluted common share amounts. Core earnings is presented on an adjusted dilutive shares basis. The adjusted dilutive shares used for core earnings is a non-GAAP measure which includes the GAAP dilutive shares of 261 million, adjusted for the dilutive effect of approximately 20 million shares on warrants issued in second quarter of 2020. We exclude the dilutive effect of the warrants as the warrant holders do not participate in dividends. Certain prior period amounts have been reclassified to conform to the current period's presentation.
| For the Quarters Ended | |||||||||||||||||
| March 31, 2021 | December 31, 2020 | September 30, 2020 | June 30, 2020 | March 31, 2020 | |||||||||||||
| (dollars in thousands, except per share data) | |||||||||||||||||
| GAAP Net income available to common stockholders | $ | 139,153 | $ | 128,797 | $ | 348,891 | $ | (73,393) | $ | (389,193) | |||||||
| Adjustments: | |||||||||||||||||
| Interest expense on long term debt | 1,076 | 1,197 | 1,495 | 4,391 | — | ||||||||||||
| Increase (decrease) in provision for credit losses | (126) | 13 | (1,650) | (4,497) | 6,314 | ||||||||||||
| Net unrealized (gains) losses on derivatives | — | — | — | — | (201,000) | ||||||||||||
| Net unrealized (gains) losses on financial instruments at fair value | (270,012) | (61,379) | (260,766) | 171,921 | 260,887 | ||||||||||||
| Net realized (gains) losses on sales of investments | (37,796) | 329 | (65,041) | (26,380) | (75,854) | ||||||||||||
| (Gains) losses on extinguishment of debt | 237,137 | (919) | 55,794 | (459) | — | ||||||||||||
| Realized (gains) losses on terminations of interest rate swaps | — | — | — | — | 463,966 | ||||||||||||
Net realized (gains) losses on Futures (1) | — | — | — | — | 34,700 | ||||||||||||
| Transaction expenses | 16,437 | 3,827 | 1,624 | 4,710 | 4,906 | ||||||||||||
| Stock Compensation expense for retirement eligible awards | 661 | (225) | (275) | (273) | 1,189 | ||||||||||||
| Core Earnings | $ | 86,530 | $ | 71,640 | $ | 80,072 | $ | 76,020 | $ | 105,915 | |||||||
| GAAP net income per diluted common share | $ | 0.54 | $ | 0.49 | $ | 1.32 | $ | (0.37) | $ | (2.08) | |||||||
Core earnings per adjusted diluted common share (2) | $ | 0.36 | $ | 0.29 | $ | 0.33 | $ | 0.32 | $ | 0.56 | |||||||
| (1) Included in net realized gains (losses) on derivatives in the Consolidated Statements of Operations. | |||||||||||||||||
| (2) We note that core and taxable earnings will typically differ, and may materially differ, due to differences on realized gains and losses on investments and related hedges, credit loss recognition, | |||||||||||||||||
| timing differences in premium amortization, accretion of discounts, equity compensation and other items. | |||||||||||||||||
5
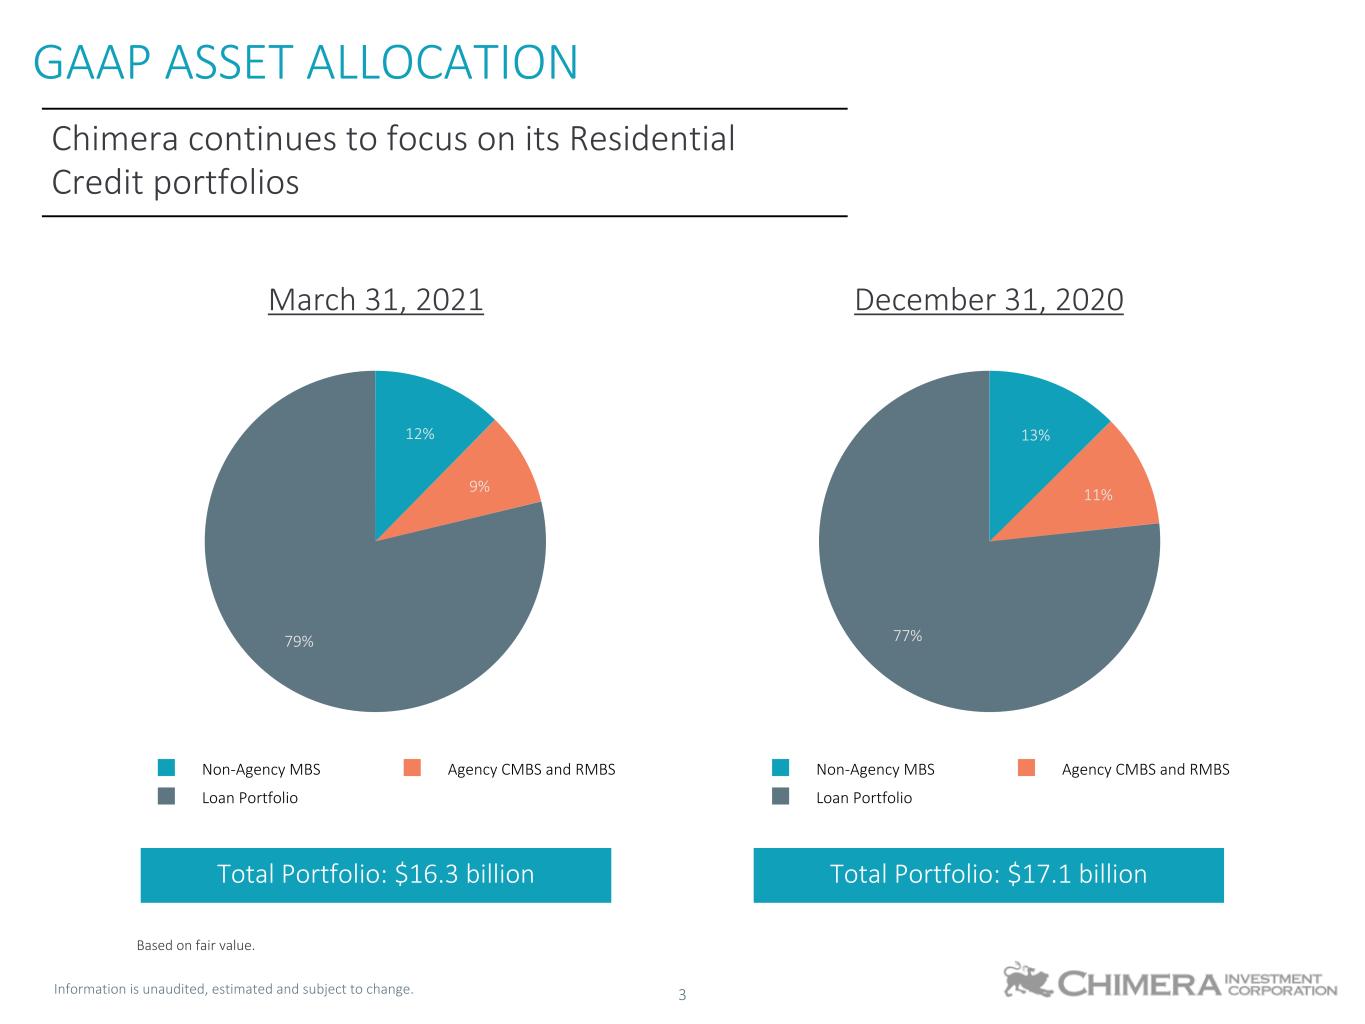
The following tables provide a summary of the Company’s MBS portfolio at March 31, 2021 and December 31, 2020.
| March 31, 2021 | |||||||||||||||||
| Principal or Notional Value at Period-End (dollars in thousands) | Weighted Average Amortized Cost Basis | Weighted Average Fair Value | Weighted Average Coupon | Weighted Average Yield at Period-End (1) | |||||||||||||
| Non-Agency RMBS | |||||||||||||||||
Senior | $ | 1,498,212 | $ | 50.29 | 80.26 | 4.5 | % | 17.1 | % | ||||||||
Subordinated | 857,925 | 65.62 | 69.26 | 3.8 | % | 6.5 | % | ||||||||||
Interest-only | 4,850,934 | 4.74 | 4.47 | 1.6 | % | 14.7 | % | ||||||||||
| Agency RMBS | |||||||||||||||||
| Interest-only | 1,199,688 | 9.52 | 7.20 | 1.6 | % | 1.1 | % | ||||||||||
| Agency CMBS | |||||||||||||||||
Project loans | 1,196,682 | 101.72 | 111.40 | 4.2 | % | 4.1 | % | ||||||||||
Interest-only | 1,114,212 | 1.79 | 1.99 | 0.6 | % | 7.8 | % | ||||||||||
(1) Bond Equivalent Yield at period end.
| December 31, 2020 | |||||||||||||||||
| Principal or Notional Value at Period-End (dollars in thousands) | Weighted Average Amortized Cost Basis | Weighted Average Fair Value | Weighted Average Coupon | Weighted Average Yield at Period-End (1) | |||||||||||||
| Non-Agency RMBS | |||||||||||||||||
Senior | $ | 1,560,135 | $ | 50.65 | $ | 81.90 | 4.5 | % | 16.9 | % | |||||||
Subordinated | 905,674 | 62.46 | 67.43 | 3.8 | % | 6.3 | % | ||||||||||
Interest-only | 5,628,240 | 4.43 | 4.66 | 1.5 | % | 16.2 | % | ||||||||||
| Agency RMBS | |||||||||||||||||
Interest-only | 1,262,963 | 9.41 | 7.18 | 1.7 | % | 1.6 | % | ||||||||||
| Agency CMBS | |||||||||||||||||
Project loans | 1,527,621 | 101.81 | 112.23 | 4.1 | % | 3.8 | % | ||||||||||
Interest-only | 1,326,665 | 1.78 | 1.95 | 0.6 | % | 8.4 | % | ||||||||||
(1) Bond Equivalent Yield at period end.
6
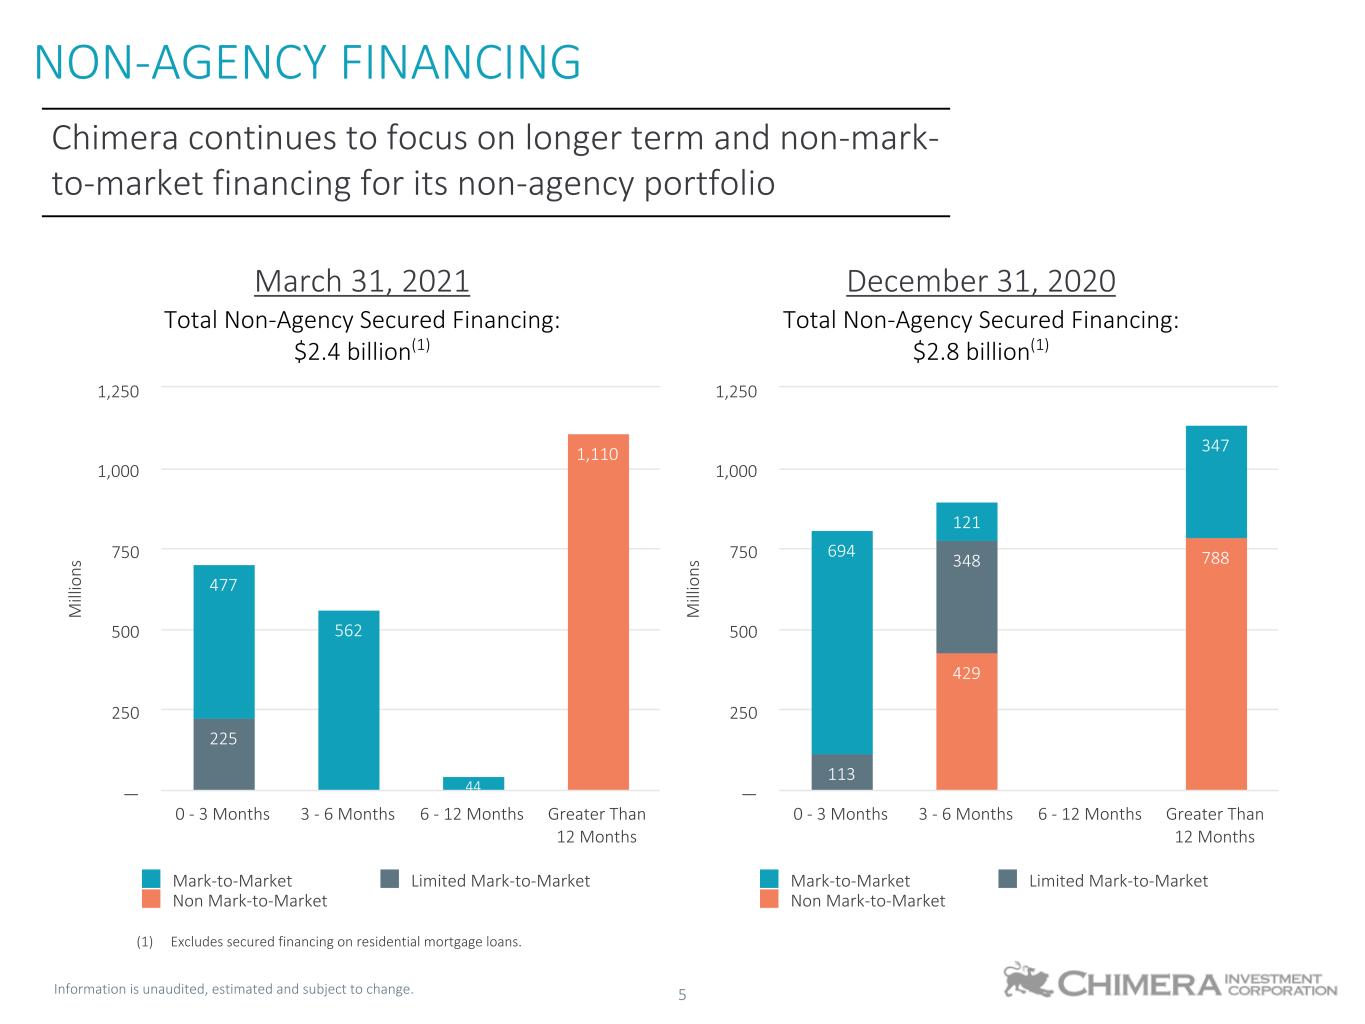
At March 31, 2021 and December 31, 2020, the secured financing agreements collateralized by MBS and Loans held for investment had the following remaining maturities and borrowing rates.
| March 31, 2021 | December 31, 2020 | ||||||||||||||||||||||
| (dollars in thousands) | |||||||||||||||||||||||
Principal (1) | Weighted Average Borrowing Rates | Range of Borrowing Rates | Principal (1) | Weighted Average Borrowing Rates | Range of Borrowing Rates | ||||||||||||||||||
| Overnight | $ | — | NA | NA | $ | — | NA | NA | |||||||||||||||
| 1 to 29 days | 1,460,163 | 1.46% | 0.10% - 7.97% | 1,521,134 | 0.38% | 0.20% - 2.72% | |||||||||||||||||
| 30 to 59 days | 315,543 | 2.03% | 1.95% - 2.44% | 481,257 | 4.35% | 2.42% - 6.61% | |||||||||||||||||
| 60 to 89 days | 314,203 | 2.37% | 1.15% - 2.61% | 352,684 | 2.78% | 1.34% - 6.30% | |||||||||||||||||
| 90 to 119 days | 431,222 | 3.28% | 1.76% - 4.50% | 301,994 | 7.97% | 7.97% - 7.97% | |||||||||||||||||
| 120 to 180 days | 370,538 | 2.06% | 1.60% - 2.40% | 595,900 | 5.29% | 2.40% - 6.26% | |||||||||||||||||
| 180 days to 1 year | 44,344 | 2.36% | 2.36% - 2.36% | 345,204 | 3.60% | 3.25% - 4.50% | |||||||||||||||||
| 1 to 2 years | 746,478 | 4.11% | 2.86% - 4.38% | — | NA | NA | |||||||||||||||||
| 2 to 3 years | — | NA | NA | 642,696 | 4.91% | 1.65% - 7.00% | |||||||||||||||||
| Greater than 3 years | 363,421 | 5.56% | 5.56% - 5.56% | 395,978 | 5.56% | 5.56% - 5.56% | |||||||||||||||||
| Total | $ | 4,045,912 | 2.69% | $ | 4,636,847 | 3.41% | |||||||||||||||||
(1) The values for secured financing agreements in the table above is net of $4 million and $8 million of deferred financing cost as of March 31, 2021 and December 31, 2020, respectively.
The following table summarizes certain characteristics of our portfolio at March 31, 2021 and December 31, 2020.
| March 31, 2021 | December 31, 2020 | |||||||
| GAAP Leverage at period-end | 3.6:1 | 3.6:1 | ||||||
| GAAP Leverage at period-end (recourse) | 1.1:1 | 1.2:1 | ||||||
| March 31, 2021 | December 31, 2020 | March 31, 2021 | December 31, 2020 | ||||||||||||||
| Portfolio Composition | Amortized Cost | Fair Value | |||||||||||||||
Non-Agency RMBS | 10.3 | % | 10.2 | % | 12.4 | % | 12.6 | % | |||||||||
Senior | 5.0 | % | 5.0 | % | 7.4 | % | 7.5 | % | |||||||||
Subordinated | 3.8 | % | 3.6 | % | 3.7 | % | 3.6 | % | |||||||||
Interest-only | 1.5 | % | 1.6 | % | 1.3 | % | 1.5 | % | |||||||||
Agency RMBS | 0.8 | % | 0.7 | % | 0.5 | % | 0.5 | % | |||||||||
Pass-through | — | % | — | % | — | % | — | % | |||||||||
Interest-only | 0.8 | % | 0.7 | % | 0.5 | % | 0.5 | % | |||||||||
Agency CMBS | 8.2 | % | 10.0 | % | 8.3 | % | 10.2 | % | |||||||||
Project loans | 8.1 | % | 9.9 | % | 8.2 | % | 10.0 | % | |||||||||
Interest-only | 0.1 | % | 0.1 | % | 0.1 | % | 0.2 | % | |||||||||
| Loans held for investment | 80.7 | % | 79.1 | % | 78.8 | % | 76.7 | % | |||||||||
Fixed-rate percentage of portfolio | 95.0 | % | 94.9 | % | 93.6 | % | 93.2 | % | |||||||||
Adjustable-rate percentage of portfolio | 5.0 | % | 5.1 | % | 6.4 | % | 6.8 | % | |||||||||
7
Economic Net Interest Income
Our “Economic net interest income” is a non-GAAP financial measure, that equals interest income, less interest expense and realized losses on our interest rate swaps. Realized losses on our interest rate swaps are the periodic net settlement payments made or received. For the purpose of computing economic net interest income and ratios relating to cost of funds measures throughout this section, interest expense includes net payments on our interest rate swaps, which is presented as a part of Realized gains (losses) on derivatives in our Consolidated Statements of Operations and Comprehensive Income. Interest rate swaps are used to manage the increase in interest paid on repurchase agreements in a rising rate environment. Presenting the net contractual interest payments on interest rate swaps with the interest paid on interest-bearing liabilities reflects our total contractual interest payments. We believe this presentation is useful to investors because it depicts the economic value of our investment strategy by showing actual interest expense and net interest income. Where indicated, interest expense, including interest payments on interest rate swaps, is referred to as economic interest expense. Where indicated, net interest income reflecting interest payments on interest rate swaps, is referred to as economic net interest income.
The following table reconciles the GAAP and non-GAAP measurements reflected in the Management’s Discussion and Analysis of Financial Condition and Results of Operations.
| GAAP Interest Income | GAAP Interest Expense | Net Realized (Gains) Losses on Interest Rate Swaps | Interest Expense on Long Term Debt | Economic Interest Expense | GAAP Net Interest Income | Net Realized Gains (Losses) on Interest Rate Swaps | Other (1) | Economic Net Interest Income | |||||||||||||||||||||||||||
| For the Quarter Ended March 31, 2021 | $ | 243,127 | $ | 108,066 | $ | — | $ | (1,076) | $ | 106,990 | $ | 135,061 | $ | — | $ | 1,065 | $ | 136,126 | |||||||||||||||||
| For the Quarter Ended December 31, 2020 | $ | 236,156 | $ | 120,285 | $ | — | $ | (1,197) | $ | 119,088 | $ | 115,871 | $ | — | $ | 1,177 | $ | 117,048 | |||||||||||||||||
| For the Quarter Ended September 30, 2020 | $ | 247,905 | $ | 124,557 | $ | — | $ | (1,495) | $ | 123,062 | $ | 123,348 | $ | — | $ | 1,487 | $ | 124,835 | |||||||||||||||||
| For the Quarter Ended June 30, 2020 | $ | 245,922 | $ | 129,256 | $ | — | $ | (4,391) | $ | 124,865 | $ | 116,666 | $ | — | $ | 4,358 | $ | 121,024 | |||||||||||||||||
| For the Quarter Ended March 31, 2020 | $ | 300,266 | $ | 142,083 | $ | 6,385 | $ | — | $ | 148,468 | $ | 158,183 | $ | (6,385) | $ | (1,266) | $ | 150,532 | |||||||||||||||||
(1) Primarily interest expense on Long term debt and interest income on cash and cash equivalents.
8
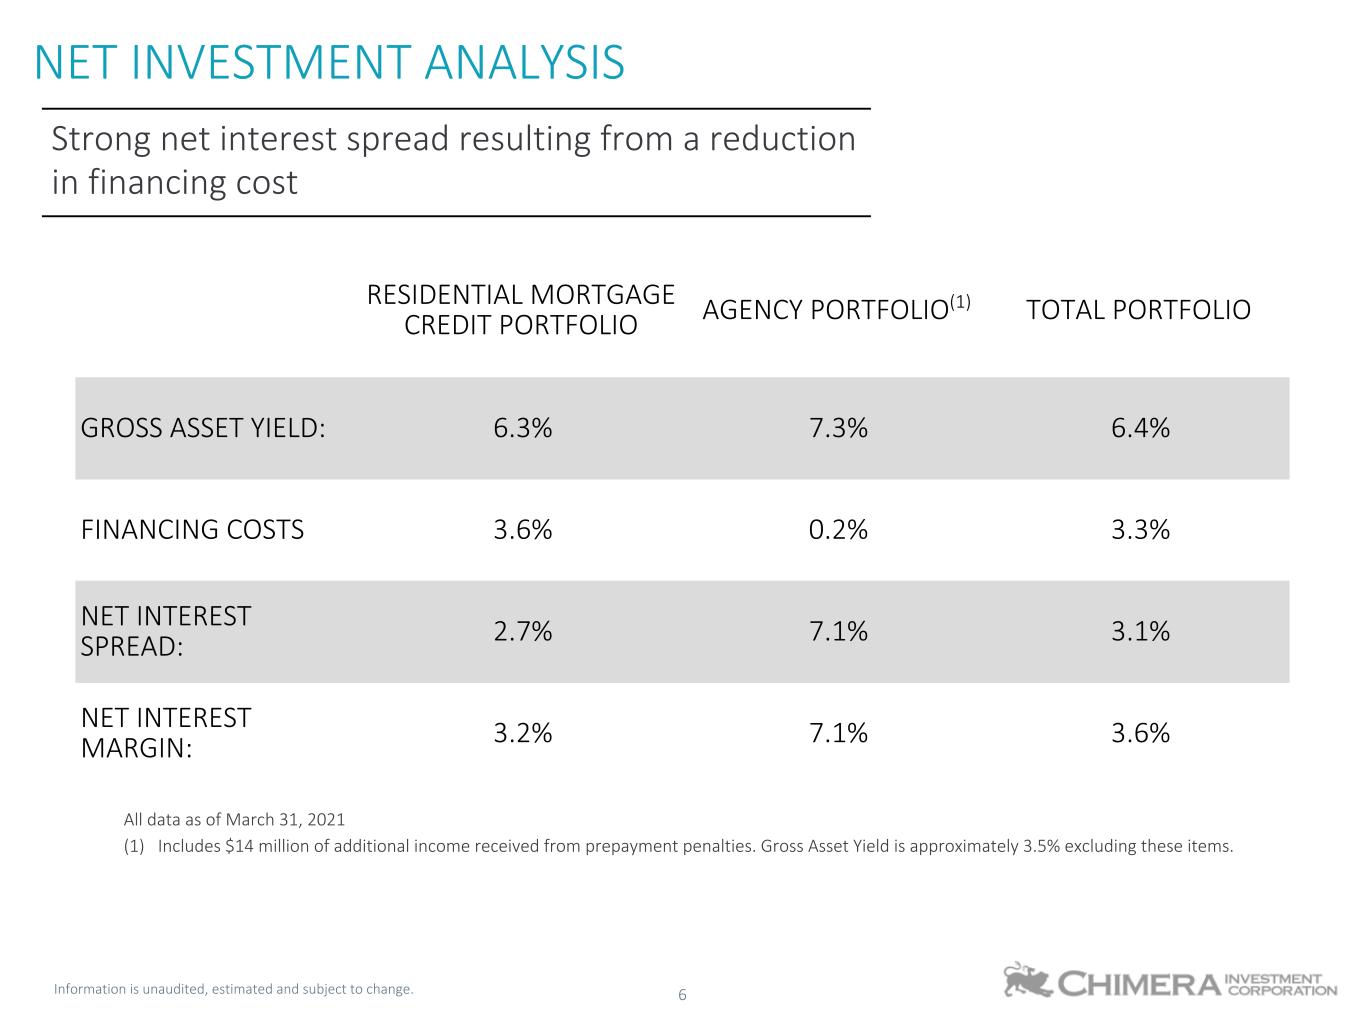
The table below shows our average earning assets held, interest earned on assets, yield on average interest earning assets, average debt balance, economic interest expense, economic average cost of funds, economic net interest income, and net interest rate spread for the periods presented.
| For the Quarter Ended | |||||||||||||||||||||||
| March 31, 2021 | March 31, 2020 | ||||||||||||||||||||||
| (dollars in thousands) | (dollars in thousands) | ||||||||||||||||||||||
| Average Balance | Interest | Average Yield/Cost | Average Balance | Interest | Average Yield/Cost | ||||||||||||||||||
| Assets: | |||||||||||||||||||||||
Interest-earning assets (1): | |||||||||||||||||||||||
| Agency RMBS | $ | 116,517 | $ | 317 | 1.1 | % | $ | 4,652,843 | $ | 42,663 | 3.7 | % | |||||||||||
| Agency CMBS | 1,360,895 | 26,607 | 7.8 | % | 2,204,435 | 20,698 | 3.8 | % | |||||||||||||||
| Non-Agency RMBS | 1,577,137 | 55,800 | 14.2 | % | 1,883,781 | 61,014 | 13.0 | % | |||||||||||||||
| Loans held for investment | 12,253,034 | 160,392 | 5.2 | % | 13,716,833 | 174,625 | 5.1 | % | |||||||||||||||
| Total | $ | 15,307,583 | $ | 243,116 | 6.4 | % | $ | 22,457,892 | $ | 299,000 | 5.3 | % | |||||||||||
| Liabilities and stockholders' equity: | |||||||||||||||||||||||
| Interest-bearing liabilities: | |||||||||||||||||||||||
| Secured financing agreements collateralized by: | |||||||||||||||||||||||
| Agency RMBS | $ | 66,951 | $ | 149 | 0.9 | % | $ | 4,406,106 | $ | 27,114 | 2.5 | % | |||||||||||
| Agency CMBS | 1,236,361 | 580 | 0.2 | % | 2,112,244 | 12,361 | 2.3 | % | |||||||||||||||
| Non-Agency RMBS | 1,002,935 | 12,479 | 5.0 | % | 1,384,095 | 9,666 | 2.8 | % | |||||||||||||||
| Loans held for investment | 2,253,811 | 24,216 | 4.3 | % | 3,852,347 | 32,890 | 3.4 | % | |||||||||||||||
| Securitized debt | 8,588,423 | 69,566 | 3.2 | % | 8,079,597 | 66,437 | 3.3 | % | |||||||||||||||
| Total | $ | 13,148,481 | $ | 106,990 | 3.3 | % | $ | 19,834,389 | $ | 148,468 | 3.0 | % | |||||||||||
| Economic net interest income/net interest rate spread | $ | 136,126 | 3.1 | % | $ | 150,532 | 2.3 | % | |||||||||||||||
| Net interest-earning assets/net interest margin | $ | 2,159,102 | 3.6 | % | $ | 2,623,503 | 2.7 | % | |||||||||||||||
| Ratio of interest-earning assets to interest bearing liabilities | 1.16 | 1.13 | |||||||||||||||||||||
| (1) Interest-earning assets at amortized cost | |||||||||||||||||||||||
| (2) Interest includes net cash paid/received on swaps | |||||||||||||||||||||||
The table below shows our Net Income and Economic Net Interest Income as a percentage of average stockholders' equity and Core Earnings as a percentage of average common stockholders' equity. Return on average equity is defined as our GAAP net income (loss) as a percentage of average equity. Average equity is defined as the average of our beginning and ending stockholders' equity balance for the period reported. Economic Net Interest Income and Core Earnings are non-GAAP measures as defined in previous sections
| Return on Average Equity | Economic Net Interest Income/Average Equity * | Core Earnings/Average Common Equity | |||||||||
| (Ratios have been annualized) | |||||||||||
| For the Quarter Ended March 31, 2021 | 17.16 | % | 14.82 | % | 12.62 | % | |||||
| For the Quarter Ended December 31, 2020 | 15.76 | % | 12.53 | % | 10.21 | % | |||||
| For the Quarter Ended September 30, 2020 | 41.43 | % | 14.08 | % | 12.24 | % | |||||
| For the Quarter Ended June 30, 2020 | (6.62) | % | 14.58 | % | 12.72 | % | |||||
| For the Quarter Ended March 31, 2020 | (41.21) | % | 16.73 | % | 15.88 | % | |||||
* Includes effect of realized losses on interest rate swaps and excludes long term debt expense.
9
The following table presents changes to Accretable Discount (net of premiums) as it pertains to our Non-Agency RMBS portfolio, excluding premiums on IOs, during the previous five quarters.
| For the Quarters Ended | |||||||||||||||||
| (dollars in thousands) | |||||||||||||||||
| Accretable Discount (Net of Premiums) | March 31, 2021 | December 31, 2020 | September 30, 2020 | June 30, 2020 | March 31, 2020 | ||||||||||||
| Balance, beginning of period | $ | 409,690 | $ | 422,981 | $ | 410,447 | $ | 438,232 | $ | 494,255 | |||||||
| Accretion of discount | (24,023) | (21,281) | (20,045) | (22,508) | (24,784) | ||||||||||||
| Purchases | — | 758 | 2,096 | — | (4,336) | ||||||||||||
| Sales and deconsolidation | (41,651) | 98 | — | (23,425) | 438 | ||||||||||||
| Transfers from/(to) credit reserve, net | 14,546 | 7,134 | 30,483 | 18,148 | (27,341) | ||||||||||||
| Balance, end of period | $ | 358,562 | $ | 409,690 | $ | 422,981 | $ | 410,447 | $ | 438,232 | |||||||
Disclaimer
This press release includes “forward-looking statements” within the meaning of the safe harbor provisions of the United States Private Securities Litigation Reform Act of 1995. Actual results may differ from expectations, estimates and projections and, consequently, readers should not rely on these forward-looking statements as predictions of future events. Words such as “expect,” “target,” “assume,” “estimate,” “project,” “budget,” “forecast,” “anticipate,” “intend,” “plan,” “may,” “will,” “could,” “should,” “believe,” “predicts,” “potential,” “continue,” and similar expressions are intended to identify such forward-looking statements. These forward-looking statements involve significant risks and uncertainties that could cause actual results to differ materially from expected results, including, among other things, those described in our most recent Annual Report on Form 10-K, and any subsequent Quarterly Reports on Form 10-Q and Current Reports on Form 8-K, under the caption “Risk Factors.” Factors that could cause actual results to differ include, but are not limited to: our business and investment strategy; our ability to accurately forecast the payment of future dividends on our common and preferred stock, and the amount of such dividends; our ability to determine accurately the fair market value of our assets; availability of investment opportunities in real estate-related and other securities, including our valuation of potential opportunities that may arise as a result of current and future market dislocations; effect of the novel coronavirus (or COVID-19) pandemic on real estate market, financial markets and our Company, including the impact on the value, availability, financing and liquidity of mortgage assets; how COVID-19 may affect us, our operations and our personnel; our expected investments; changes in the value of our investments, including negative changes resulting in margin calls related to the financing of our assets; changes in interest rates and mortgage prepayment rates; prepayments of the mortgage and other loans underlying our mortgage-backed securities, or RMBS, or other asset-backed securities, or ABS; rates of default, delinquencies or decreased recovery rates on our investments; general volatility of the securities markets in which we invest; our ability to maintain existing financing arrangements and our ability to obtain future financing arrangements; our ability to effect our strategy to securitize residential mortgage loans; interest rate mismatches between our investments and our borrowings used to finance such purchases; effects of interest rate caps on our adjustable-rate investments; the degree to which our hedging strategies may or may not protect us from interest rate volatility; the impact of and changes to various government programs, including in response to COVID-19; impact of and changes in governmental regulations, tax law and rates, accounting guidance, and similar matters; market trends in our industry, interest rates, the debt securities markets or the general economy; estimates relating to our ability to make distributions to our stockholders in the future; our understanding of our competition; availability of qualified personnel; our ability to maintain our classification as a real estate investment trust, or, REIT, for U.S. federal income tax purposes; our ability to maintain our exemption from registration under the Investment Company Act of 1940, as amended, or 1940 Act; our expectations regarding materiality or significance; and the effectiveness of our disclosure controls and procedures.
Readers are cautioned not to place undue reliance upon any forward-looking statements, which speak only as of the date made. Chimera does not undertake or accept any obligation to release publicly any updates or revisions to any forward-looking statement to reflect any change in its expectations or any change in events, conditions or circumstances on which any such statement is based. Additional information concerning these and other risk factors is contained in Chimera’s most recent filings with the Securities and Exchange Commission (SEC). All subsequent written and oral forward-looking statements concerning Chimera or matters attributable to Chimera or any person acting on its behalf are expressly qualified in their entirety by the cautionary statements above.
10
Readers are advised that the financial information in this press release is based on company data available at the time of this presentation and, in certain circumstances, may not have been audited by the Company’s independent auditors.
11