UNITED STATES
SECURITIES AND EXCHANGE COMMISSION
WASHINGTON, D.C. 20549
FORM
CURRENT REPORT
Pursuant to Section 13 or 15(d) of the
Securities Exchange Act of 1934
Date of Report (Date of earliest event
reported): May 7, 2026 (
(Exact Name of Registrant as Specified in Charter)
| (State or Other Jurisdiction of Incorporation) | (Commission File Number) | (I.R.S. Employer Identification No.) |
| (Address of Principal Executive Offices) |
Registrant’s telephone number, including
area code: (
Check the appropriate box below if the Form 8-K filing is intended to simultaneously satisfy the filing obligation of the registrant under any of the following provisions:
Securities registered pursuant to Section 12(b) of the Act:
| Title of each class | Trading symbol(s) | Name of each exchange on which registered | ||
Indicate by check mark whether the registrant is an emerging growth company as defined in Rule 405 of the Securities Act of 1933 (§230.405 of this chapter) or Rule 12b-2 of the Securities Exchange Act of 1934 (§240.12b-2 of this chapter).
Emerging growth company
If an emerging growth company, indicate by check mark if the registrant has elected not to use the extended transition period for complying with any new or revised financial accounting standards provided pursuant to Section 13(a) of the Exchange Act. ¨
Item 2.02. Results of Operations and Financial Condition.
Monthly Base Distributions for Q3 2026
The board of directors (the “Board”) of CĪON Investment Corporation (“CION”) has delegated to CION’s executive officers the authority to determine the amount, record dates, payment dates and other terms of distributions to shareholders, which will be ratified by the Board on a quarterly basis.
On May 4, 2026, CION’s co-chief executive officers declared base distributions of $0.10 per share for each of July, August, and September 2026, which will be payable to shareholders as follows:
| Declaration Date | Record Date | Payment Date | Amount Per Share |
| 5/4/2026 | 7/17/2026 | 7/31/2026 | $0.10 |
| 5/4/2026 | 8/14/2026 | 8/28/2026 | $0.10 |
| 5/4/2026 | 9/11/2026 | 9/25/2026 | $0.10 |
| Total Q3 2026: | $0.30 |
A copy of a press release announcing the foregoing is attached hereto as Exhibit 99.1 and is incorporated by reference herein.
Q1 2026 Financial Results
On May 7, 2026, CION issued a press release announcing its financial results for the first quarter ended March 31, 2026. A copy of the press release is attached hereto as Exhibit 99.1 and incorporated by reference herein.
In connection with its conference call to be held on May 7, 2026 to discuss its financial results for the first quarter ended March 31, 2026, CION has provided an accompanying slide presentation in the Investor Resources section of its website at www.cionbdc.com. A copy of the presentation is also attached hereto as Exhibit 99.2 and incorporated by reference herein.
The information disclosed under this Item 2.02, including Exhibits 99.1 and 99.2 hereto, is being “furnished” and shall not be deemed “filed” by CION for purposes of Section 18 of the Securities Exchange Act of 1934, as amended (the “Exchange Act”), or otherwise subject to the liabilities of that section, and shall not be deemed incorporated by reference into any filing under the Securities Act of 1933, as amended, or the Exchange Act, except as shall be expressly set forth by specific reference in such filing.
Item 7.01. Regulation FD Disclosure.
The information in Item 2.02 of this Current Report on Form 8-K is incorporated by reference into this Item 7.01.
Item 9.01. Financial Statements and Exhibits.
(d) Exhibits.
| Exhibit Number |
Description | |
| 99.1 | Press Release dated May 7, 2026. | |
| 99.2 | CĪON Investment Corporation First Quarter 2026 Earnings Presentation. | |
| 104 | Cover Page Interactive Data File (embedded within the Inline XBRL document). |
SIGNATURES
Pursuant to the requirements of the Securities Exchange Act of 1934, as amended, the Registrant has duly caused this report to be signed on its behalf by the undersigned hereunto duly authorized.
| Date: May 7, 2026 | CĪON INVESTMENT CORPORATION | |
| By: | /s/ Michael A. Reisner | |
| Michael A. Reisner | ||
| Co-Chief Executive Officer | ||
Exhibit 99.1
CION INVESTMENT CORPORATION REPORTS FIRST QUARTER 2026 FINANCIAL RESULTS
For Immediate Release
NEW YORK, NY, May 7, 2026 — CION Investment Corporation (NYSE: CION) (“CION” or the “Company”) today reported financial results for the first quarter ended March 31, 2026 and filed its Form 10-Q with the U.S. Securities and Exchange Commission (the "SEC").
CION also announced that, on May 4, 2026 its co-chief executive officers declared base distributions of $0.10 per share for each of July, August and September 2026, which will be payable to shareholders on July 31, August 28, and September 25, 2026, respectively, to shareholders of record as of July 17, August 14, and September 11, 2026, respectively.
FIRST QUARTER AND OTHER HIGHLIGHTS
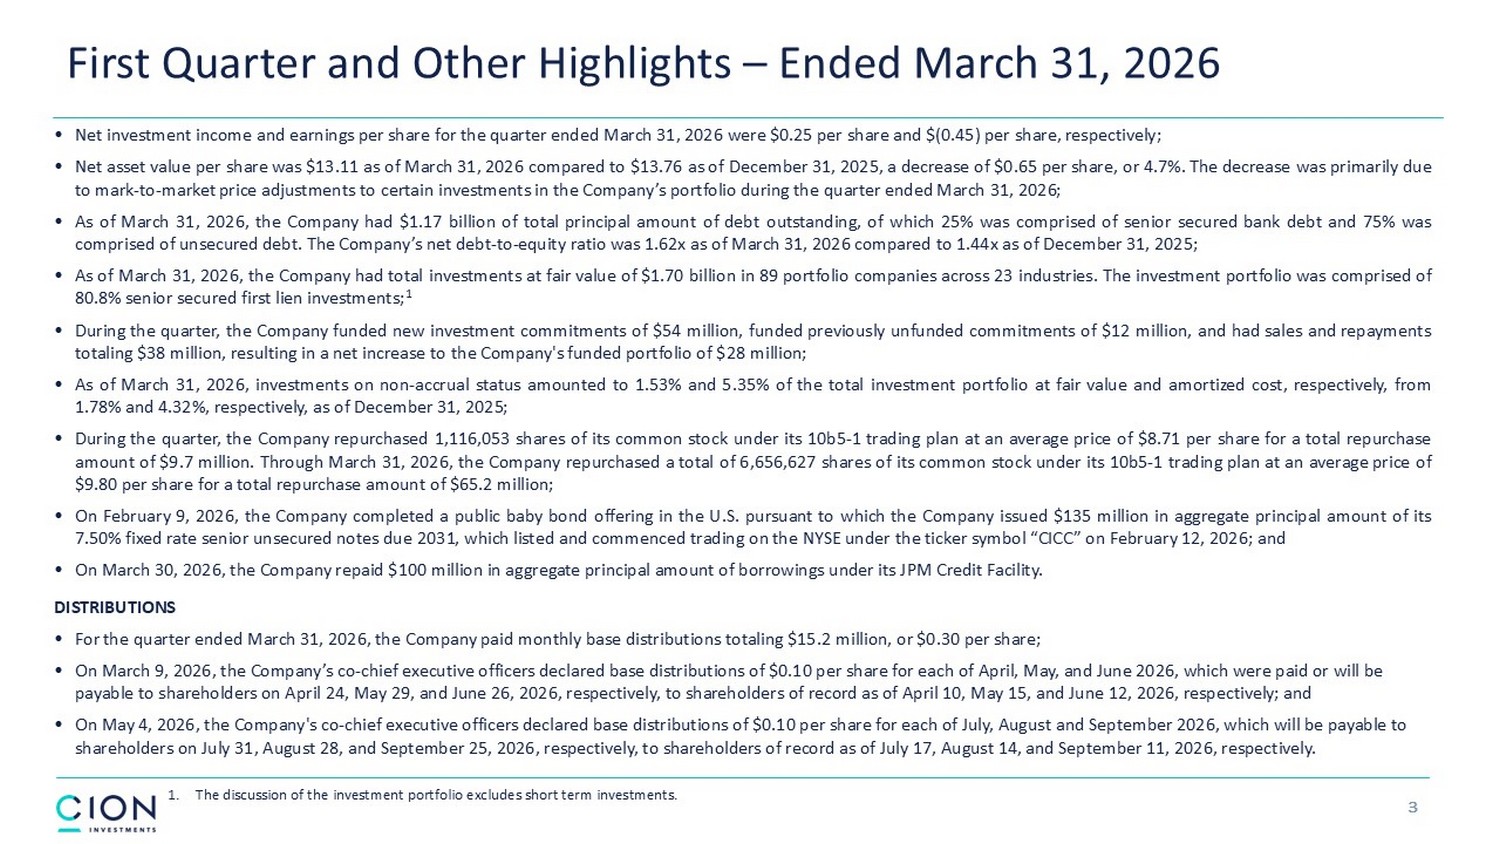
| • | Net investment income and earnings per share for the quarter ended March 31, 2026 were $0.25 per share and $(0.45) per share, respectively; |
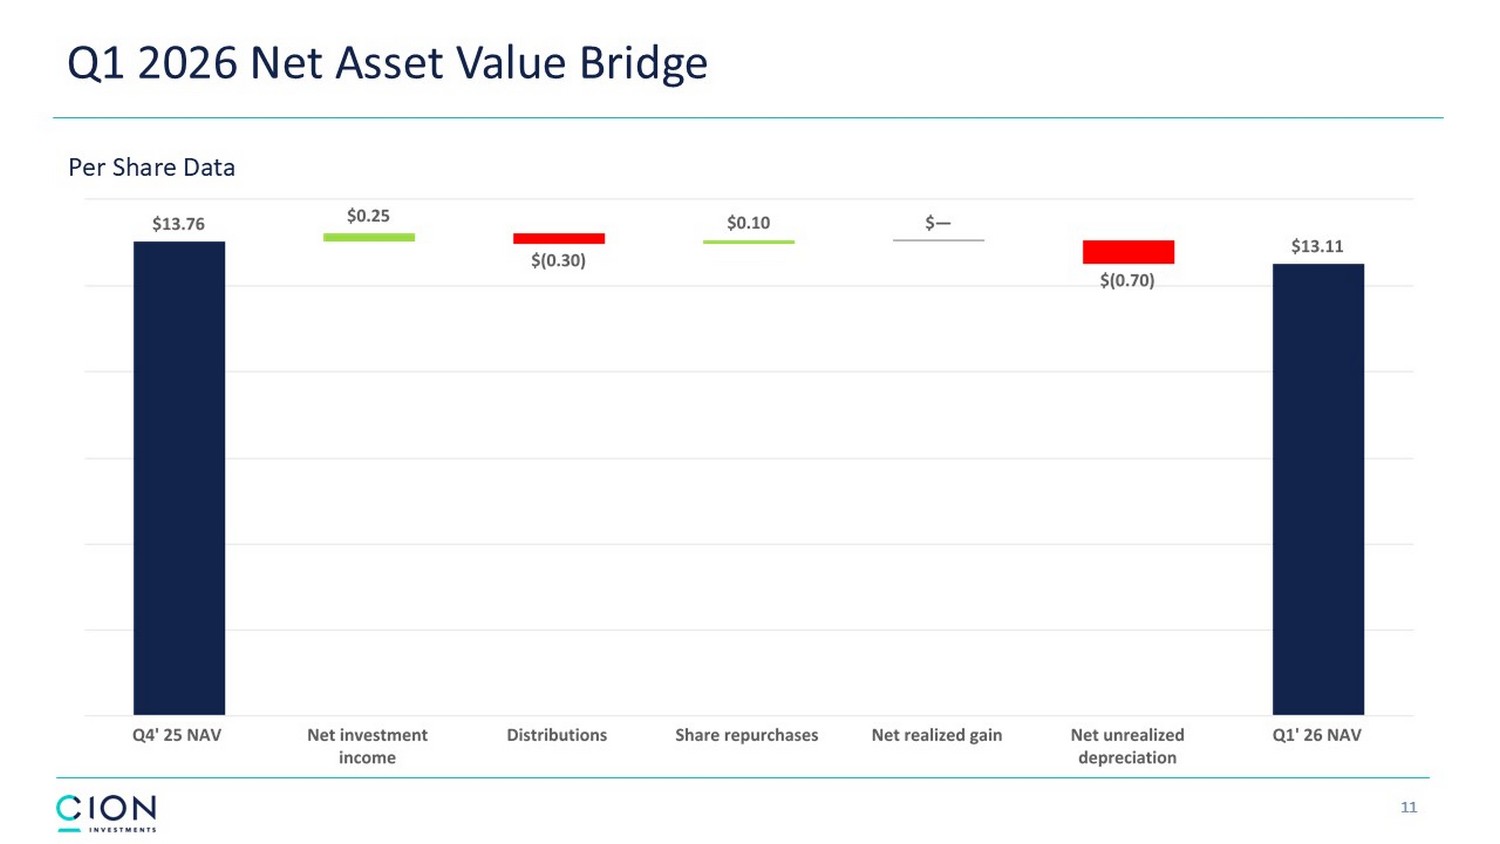
| • | Net asset value per share was $13.11 as of March 31, 2026 compared to $13.76 as of December 31, 2025, a decrease of $0.65 per share, or 4.7%. The decrease was primarily due to mark-to-market price adjustments to certain investments in the Company’s portfolio during the quarter ended March 31, 2026; |
| • | As of March 31, 2026, the Company had $1.17 billion of total principal amount of debt outstanding, of which 25% was comprised of senior secured bank debt and 75% was comprised of unsecured debt. The Company’s net debt-to-equity ratio was 1.62x as of March 31, 2026 compared to 1.44x as of December 31, 2025; |
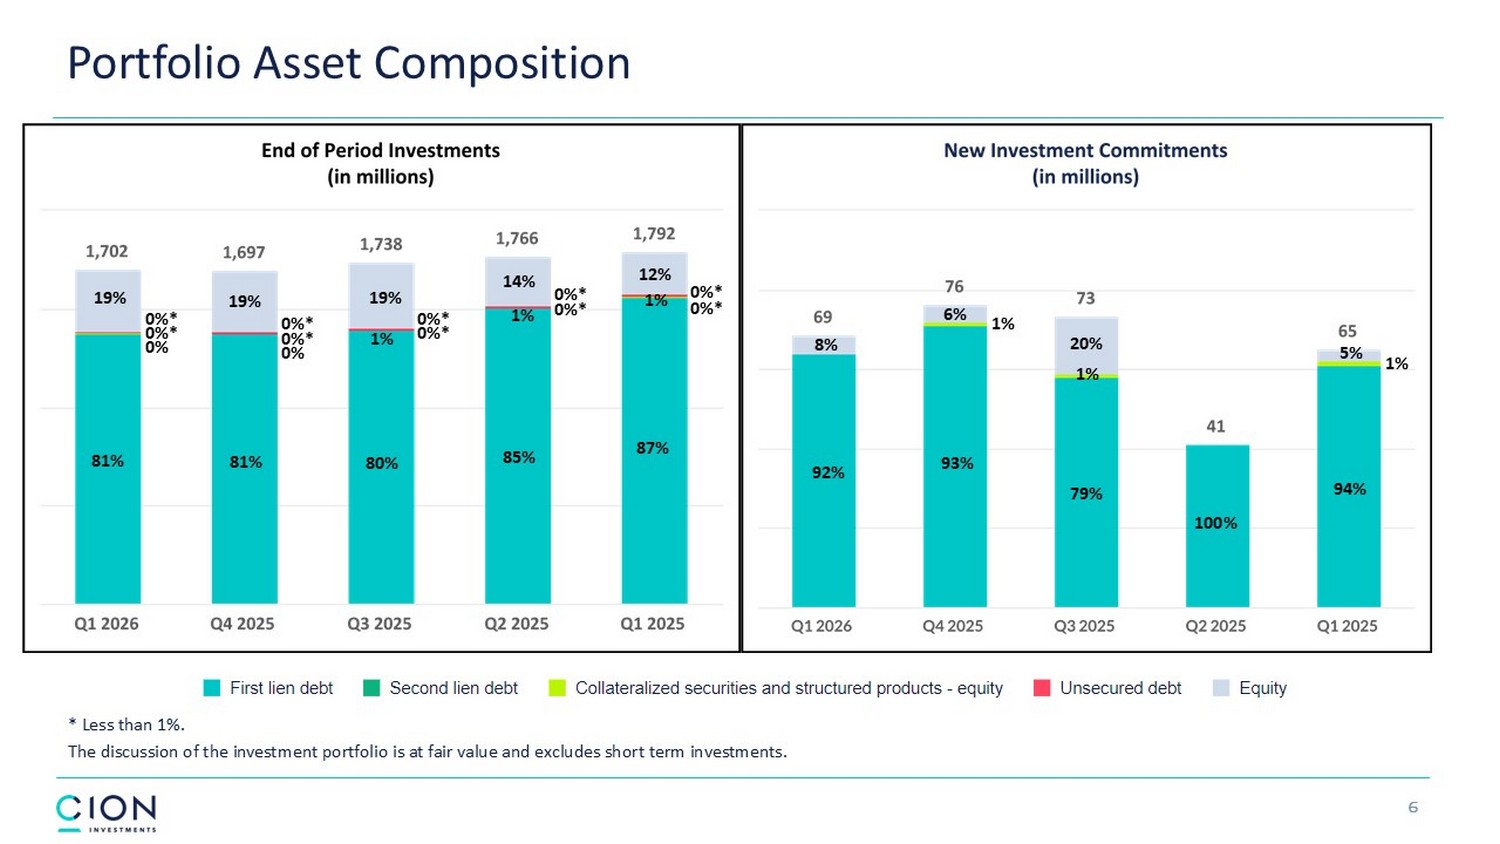
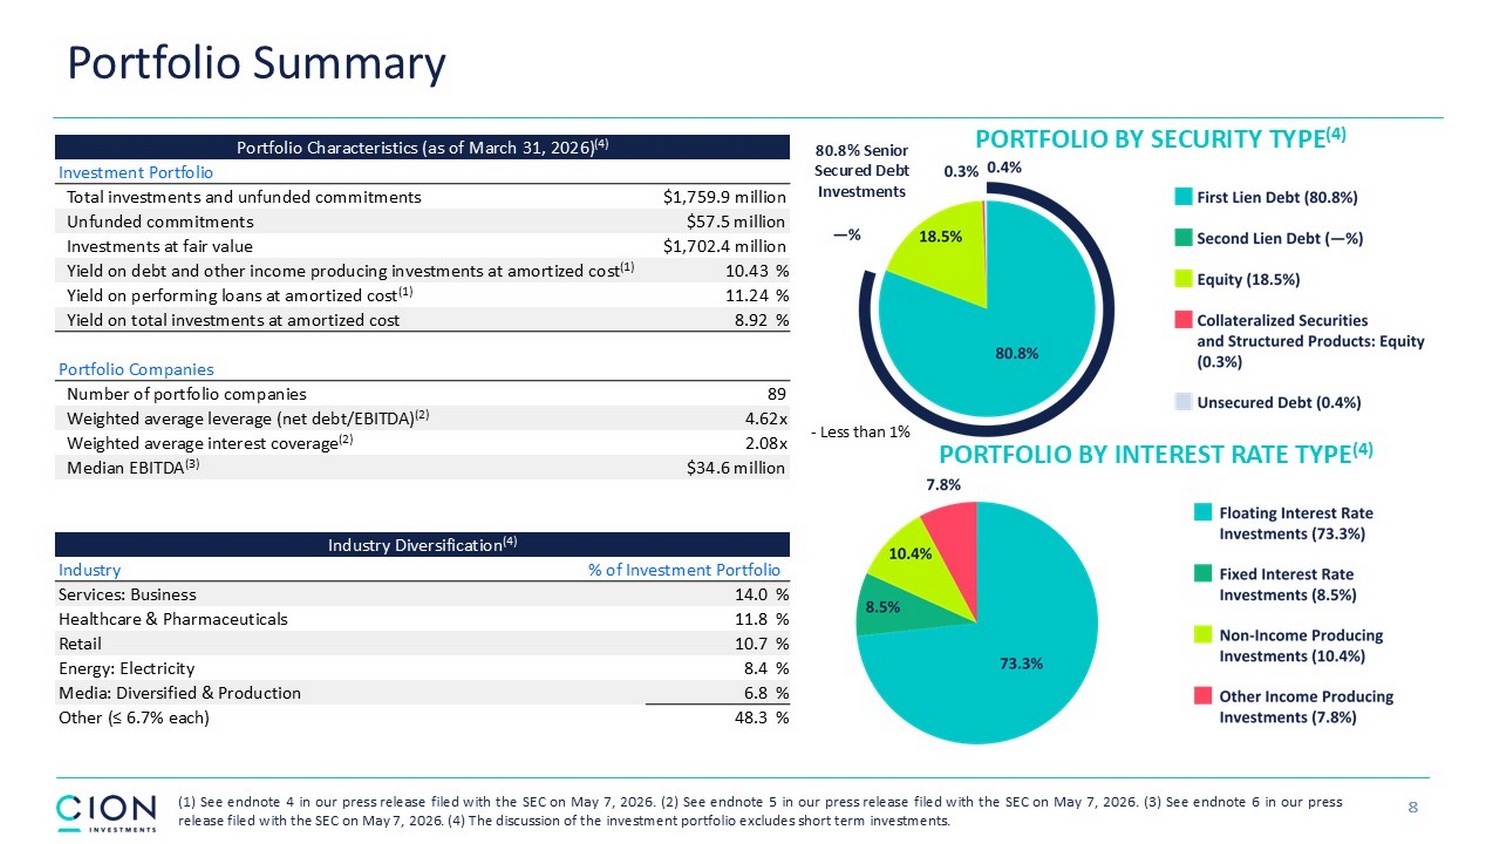
| • | As of March 31, 2026, the Company had total investments at fair value of $1.70 billion in 89 portfolio companies across 23 industries. The investment portfolio was comprised of 80.8% senior secured first lien investments;1 |
| • | During the quarter, the Company funded new investment commitments of $54 million, funded previously unfunded commitments of $12 million, and had sales and repayments totaling $38 million, resulting in a net increase to the Company's funded portfolio of $28 million; |
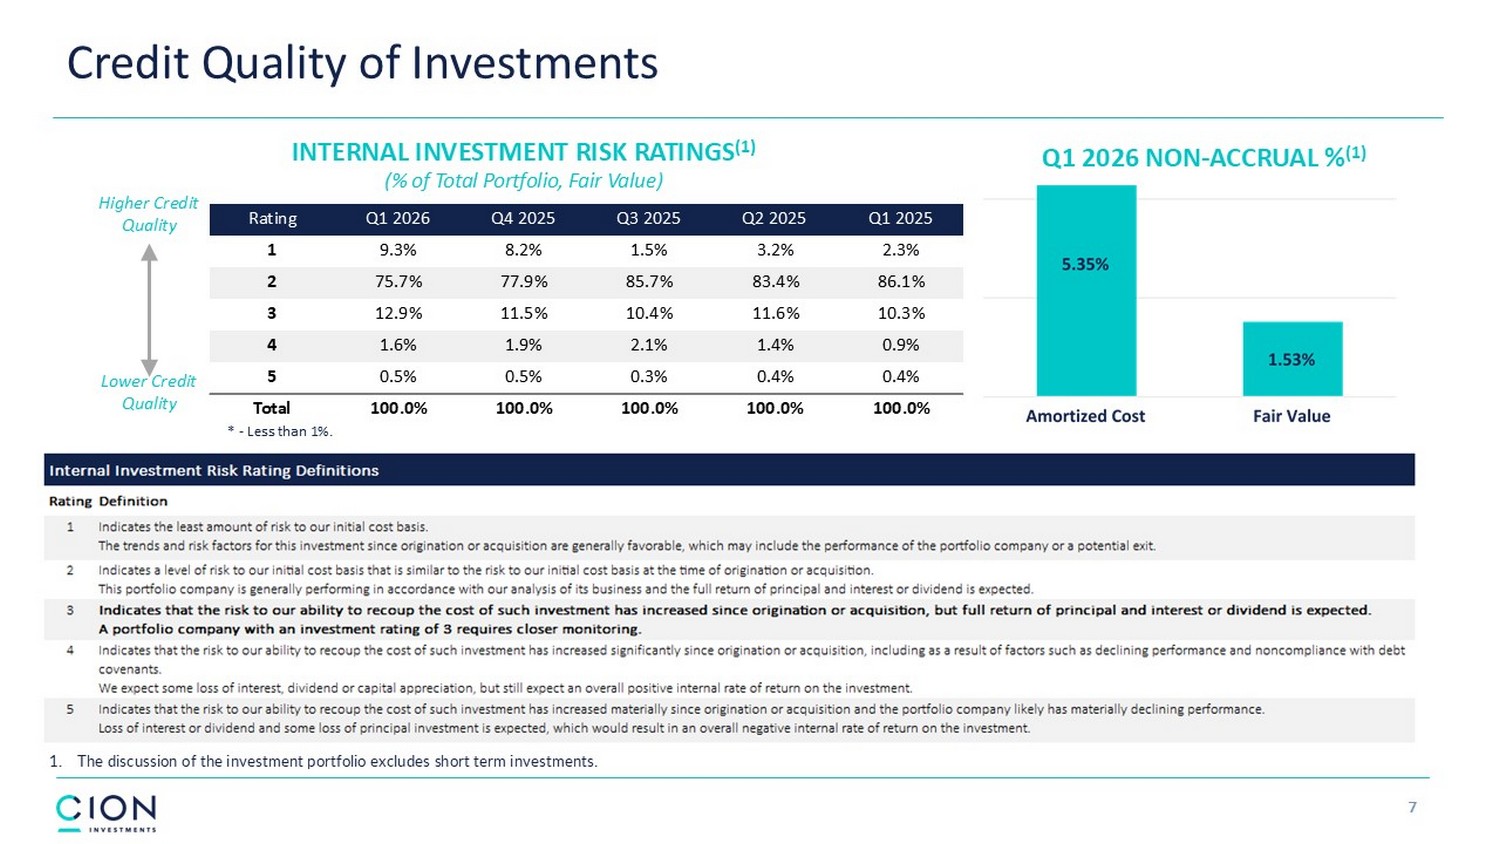
| • | As of March 31, 2026, investments on non-accrual status amounted to 1.53% and 5.35% of the total investment portfolio at fair value and amortized cost, respectively, from 1.78% and 4.32%, respectively, as of December 31, 2025; |
| • | During the quarter, the Company repurchased 1,116,053 shares of its common stock under its 10b5-1 trading plan at an average price of $8.71 per share for a total repurchase amount of $9.7 million. Through March 31, 2026, the Company repurchased a total of 6,656,627 shares of its common stock under its 10b5-1 trading plan at an average price of $9.80 per share for a total repurchase amount of $65.2 million; |
| • | On February 9, 2026, the Company completed a public baby bond offering in the U.S. pursuant to which the Company issued $135 million in aggregate principal amount of its 7.50% fixed rate senior unsecured notes due 2031, which listed and commenced trading on the NYSE under the ticker symbol “CICC” on February 12, 2026; and |
| • | On March 30, 2026, the Company repaid $100 million in aggregate principal amount of borrowings under its JPM Credit Facility. |
DISTRIBUTIONS
| • | For the quarter ended March 31, 2026, the Company paid monthly base distributions totaling $15.2 million, or $0.30 per share; and |
| • | On March 9, 2026, the Company’s co-chief executive officers declared base distributions of $0.10 per share for each of April, May, and June 2026, which were paid or will be payable to shareholders on April 24, May 29, and June 26, 2026, respectively, to shareholders of record as of April 10, May 15, and June 12, 2026, respectively. |
Mark Gatto, co-Chief Executive Officer of CION, commented:
“We believe that our core first lien portfolio, which represents approximately 81% of our investments, continues to perform well — weighted average interest coverage and weighted average leverage remained relatively steady from the prior quarter. We also believe that our intentionally low software exposure of 1.8% reflects the defensive construction of our book. While first quarter NAV was impacted by unrealized mark-to-market adjustments, we remain confident in the durability of our first lien focused strategy continuing into 2026.”
SELECTED FINANCIAL HIGHLIGHTS
| As of | ||||||||
| (in thousands, except per share data and ratios) | March 31, 2026 | December 31, 2025 | ||||||
| Investment portfolio, at fair value1 | $ | 1,702,420 | $ | 1,696,980 | ||||
| Total debt outstanding2 | $ | 1,174,844 | $ | 1,139,844 | ||||
| Net assets | $ | 659,636 | $ | 707,628 | ||||
| Net asset value per share | $ | 13.11 | $ | 13.76 | ||||
| Debt-to-equity | 1.78 | x | 1.61 | x | ||||
| Net debt-to-equity | 1.62 | x | 1.44 | x | ||||
| Three Months Ended | ||||||||
| (in thousands, except share and per share data) | March 31, 2026 | December 31, 2025 | ||||||
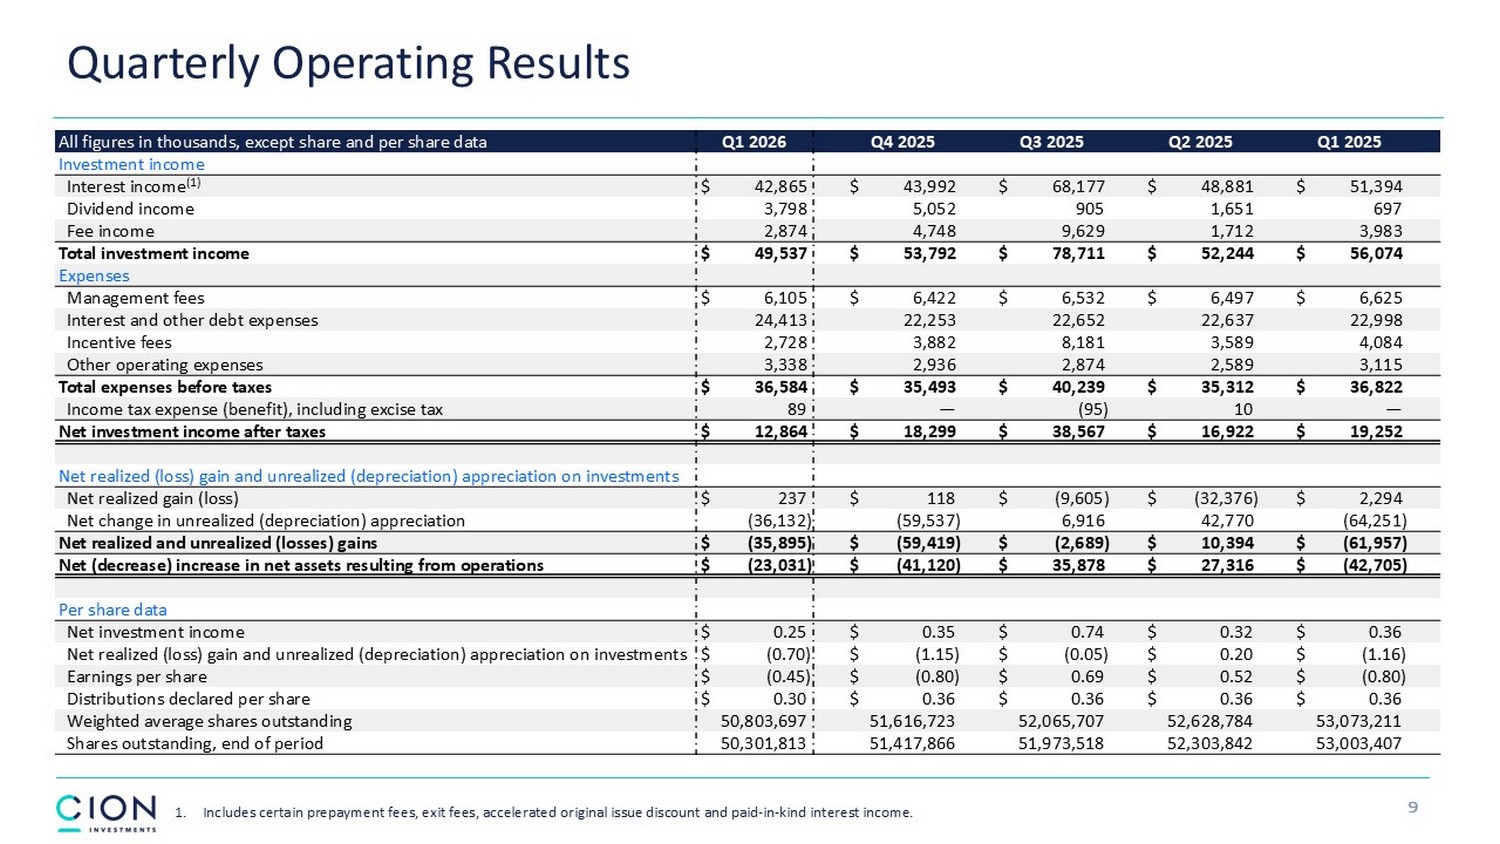
| Total investment income | $ | 49,537 | $ | 53,792 | ||||
| Total operating expenses and income tax expense | $ | 36,673 | $ | 35,493 | ||||
| Net investment income after taxes | $ | 12,864 | $ | 18,299 | ||||
| Net realized gains | $ | 237 | $ | 118 | ||||
| Net unrealized losses | $ | (36,132 | ) | $ | (59,537 | ) | ||
| Net decrease in net assets resulting from operations | $ | (23,031 | ) | $ | (41,120 | ) | ||
| Net investment income per share | $ | 0.25 | $ | 0.35 | ||||
| Net realized and unrealized losses per share | $ | (0.70 | ) | $ | (1.15 | ) | ||
| Earnings per share | $ | (0.45 | ) | $ | (0.80 | ) | ||
| Weighted average shares outstanding | 50,803,697 | 51,616,723 | ||||||
| Distributions declared per share | $ | 0.30 | $ | 0.36 | ||||
Total investment income for the three months ended March 31, 2026 and December 31, 2025 was $49.5 million and $53.8 million, respectively. The decrease in total investment income was primarily driven by lower transaction fees recorded during the first quarter due to lower repayment and investment activity and lower dividend income earned on the Company's investments during the quarter ended March 31, 2026 compared to the quarter ended December 31, 2025.
Operating expenses for the three months ended March 31, 2026 and December 31, 2025 were $36.7 million and $35.5 million, respectively. The increase in operating expenses was primarily attributable to higher interest expense, which resulted from both an increase in the Company's average debt outstanding and a higher weighted average cost of debt capital during the quarter. These changes were primarily driven by the refinancing of lower-yielding fixed rate notes and the repayment of a portion of lower-yielding senior secured debt using proceeds from newly issued, higher-yielding fixed rate notes. The increase in operating expenses was partially offset by lower advisory fees earned by our advisor during the quarter due to lower investment income earned on our investments.
PORTFOLIO AND INVESTMENT ACTIVITY1
A summary of the Company's investment activity for the three months ended March 31, 2026 is as follows:
| New Investment Commitments | Sales and Repayments | |||||||||||||||
| Investment Type (in thousands) | $ | % | $ | % | ||||||||||||
| Senior secured first lien debt | $ | 63,953 | 93 | % | $ | (34,436 | ) | 92 | % | |||||||
| Equity | 4,787 | 7 | % | (3,000 | ) | 8 | % | |||||||||
| Total | $ | 68,740 | 100 | % | $ | (37,436 | ) | 100 | % | |||||||
During the three months ended March 31, 2026, new investment commitments were made across 2 new and 9 existing portfolio companies. During the same period, the Company received full repayment of investments in 2 portfolio companies. As a result, the number of portfolio companies remained at 89 as of March 31, 2026.
PORTFOLIO SUMMARY1
As of March 31, 2026, the Company’s investments consisted of the following:
| Investments at Fair Value | ||||||||
| Investment Type (in thousands) | $ | % | ||||||
| Senior secured first lien debt | $ | 1,375,487 | 80.8 | % | ||||
| Senior secured second lien debt | — | — | ||||||
| Collateralized securities and structured products - equity | 5,033 | 0.3 | % | |||||
| Unsecured debt | 6,786 | 0.4 | % | |||||
| Equity | 315,114 | 18.5 | % | |||||
| Total | $ | 1,702,420 | 100.0 | % | ||||
The following table presents certain selected information regarding the Company’s investments:
| As of | ||||||||
| March 31, 2026 | December 31, 2025 | |||||||
| Number of portfolio companies | 89 | 89 | ||||||
| Percentage of performing loans bearing a floating rate3 | 88.6 | % | 88.7 | % | ||||
| Percentage of performing loans bearing a fixed rate3 | 11.4 | % | 11.3 | % | ||||
| Yield on debt and other income producing investments at amortized cost4 | 10.43 | % | 10.72 | % | ||||
| Yield on performing loans at amortized cost4 | 11.24 | % | 11.29 | % | ||||
| Yield on total investments at amortized cost | 8.92 | % | 9.15 | % | ||||
| Weighted average leverage (net debt/EBITDA)5 | 4.62 | x | 4.70 | x | ||||
| Weighted average interest coverage5 | 2.08 | x | 2.26 | x | ||||
| Median EBITDA6 | $34.6 million | $35.9 million | ||||||
As of March 31, 2026, investments on non-accrual status represented 1.53% and 5.35% of the total investment portfolio at fair value and amortized cost, respectively. As of December 31, 2025, investments on non-accrual status represented 1.78% and 4.32% of the total investment portfolio at fair value and amortized cost, respectively.
LIQUIDITY AND CAPITAL RESOURCES
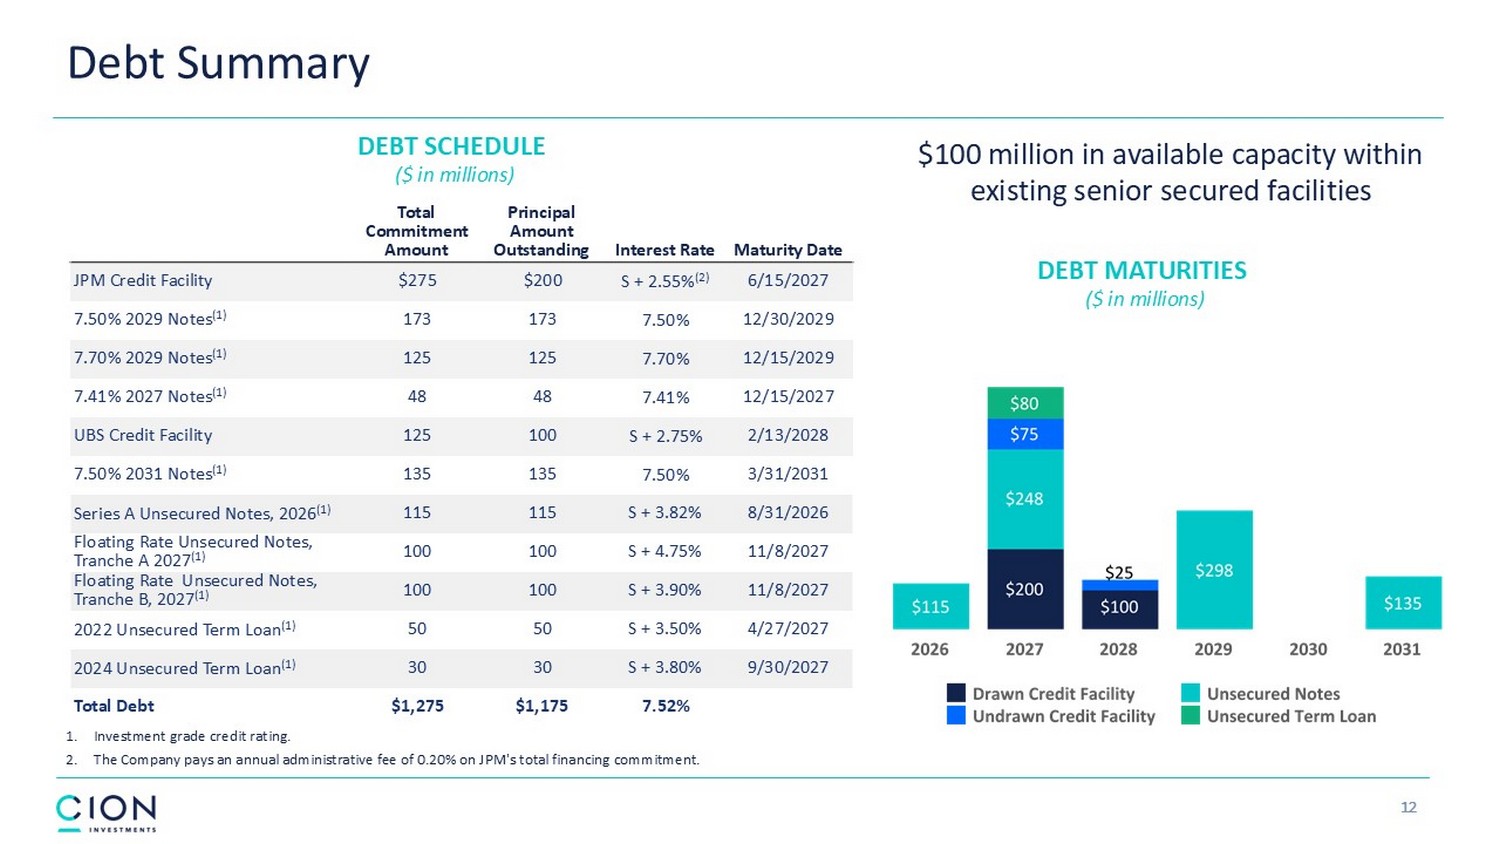
As of March 31, 2026, the Company had $1.17 billion of total principal amount of debt outstanding, comprised of $300 million of outstanding borrowings under its senior secured credit facilities and $875 million of unsecured notes and term loans. The combined weighted average interest rate on debt outstanding was 7.5% for the quarter ended March 31, 2026. As of March 31, 2026, the Company had $106 million in cash and short-term investments and $100 million available under its financing arrangements.2
EARNINGS CONFERENCE CALL
CION will host an earnings conference call on Thursday, May 7, 2026 at 11:00 am Eastern Time to discuss its financial results for the first quarter ended March 31, 2026. Please visit the Investor Resources - Earnings Presentation section of the Company’s website at www.cionbdc.com for a slide presentation that complements the earnings conference call.
All interested parties are invited to participate via telephone or listen via the live webcast, which can be accessed by clicking the following link: CION Investment Corporation First Quarter Conference Call. Domestic callers can access the conference call by dialing (877) 484-6065. International callers can access the conference call by dialing +1 (201) 689-8846. All callers are asked to dial in approximately 10 minutes prior to the call. An archived replay will be available on a webcast link located in the Investor Resources - Earnings Call section of CION’s website.
ENDNOTES
| 1) | The discussion of the investment portfolio excludes short-term investments. |
| 2) | Total debt outstanding excludes netting of debt issuance costs of $16.7 million and $14.3 million as of March 31, 2026 and December 31, 2025, respectively. |
| 3) | The fixed versus floating rate composition has been calculated as a percentage of performing debt investments measured on a fair value basis, including income producing preferred stock investments and excludes investments, if any, on non-accrual status. |
| 4) | Computed based on the (a) annual actual interest rate or yield earned plus amortization of fees and discounts on the performing debt and other income producing investments as of the reporting date, divided by (b) the total performing debt and other income producing investments (excluding investments on non-accrual status) at amortized cost. This calculation excludes exit fees that are receivable upon repayment of the investment. |
| 5) | For a particular portfolio company, the Company calculates the level of contractual indebtedness net of cash (“net debt”) owed by the portfolio company and compares that amount to measures of cash flow available to service the net debt. To calculate net debt, the Company includes debt that is both senior and pari passu to the tranche of debt owned by it but excludes debt that is legally and contractually subordinated in ranking to the debt owned by the Company. The Company believes this calculation method assists in describing the risk of its portfolio investments, as it takes into consideration contractual rights of repayment of the tranche of debt owned by the Company relative to other senior and junior creditors of a portfolio company. The Company typically calculates cash flow available for debt service at a portfolio company by taking EBITDA for the trailing twelve-month period. Weighted average net debt to EBITDA is weighted based on the fair value of the Company's performing debt investments and excluding investments where net debt to EBITDA may not be the appropriate measure of credit risk, such as cash collateralized loans and investments that are underwritten and covenanted based on recurring revenue. |
For a particular portfolio company, the Company also calculates the level of contractual interest expense owed by the portfolio company and compares that amount to EBITDA (“interest coverage ratio”). The Company believes this calculation method assists in describing the risk of its portfolio investments, as it takes into consideration contractual interest obligations of the portfolio company. Weighted average interest coverage is weighted based on the fair value of the Company's performing debt investments, and excludes investments where interest coverage may not be the appropriate measure of credit risk, such as cash collateralized loans and investments that are underwritten and covenanted based on recurring revenue.
Portfolio company statistics, including EBITDA, are derived from the financial statements most recently provided to the Company for each portfolio company as of the reported end date. Statistics of the portfolio companies have not been independently verified by the Company and may reflect a normalized or adjusted amount.
| 6) | Median EBITDA is calculated based on the portfolio company's EBITDA as of the Company's initial investment. |
CĪON Investment Corporation
Consolidated Balance Sheets
(in thousands, except share and per share amounts)
| March 31, 2026 | December 31, 2025 | |||||||
| (unaudited) | ||||||||
| Assets | ||||||||
| Investments, at fair value: | ||||||||
| Non-controlled,non-affiliated investments (amortized cost of $1,247,546 and $1,238,358, respectively) | $ | 1,147,711 | $ | 1,158,985 | ||||
| Non-controlled,affiliated investments (amortized cost of $369,689 and $360,895, respectively) | 372,821 | 364,335 | ||||||
| Controlled investments (amortized cost of $347,478 and $342,843, respectively) | 278,942 | 289,670 | ||||||
| Total investments, at fair value(amortized cost of $1,964,713 and $1,942,096 respectively) | 1,799,474 | 1,812,990 | ||||||
| Cash | 9,248 | 8,159 | ||||||
| Interest receivable on investments | 33,062 | 27,979 | ||||||
| Receivable due on investments sold and repaid | 227 | 3,699 | ||||||
| Prepaid expenses and other assets | 1,950 | 1,973 | ||||||
| Total assets | $ | 1,843,961 | $ | 1,854,800 | ||||
| Liabilities and Shareholders' Equity | ||||||||
| Liabilities | ||||||||
| Financing arrangements (net of unamortized debt issuance costs of $16,661 and $14,263, respectively) | $ | 1,158,183 | $ | 1,125,580 | ||||
| Payable for investments purchased | 6,636 | 2,529 | ||||||
| Accounts payable and accrued expenses | 813 | 785 | ||||||
| Interest payable | 8,489 | 5,764 | ||||||
| Accrued management fees | 6,104 | 6,423 | ||||||
| Accrued subordinated incentive fee on income | 2,728 | 3,882 | ||||||
| Accrued administrative services expense | 1,372 | 2,182 | ||||||
| Share repurchases payable | — | 27 | ||||||
| Total liabilities | 1,184,325 | 1,147,172 | ||||||
| Shareholders' Equity | ||||||||
| Common stock, $0.001 par value; 500,000,000 shares authorized; 50,301,813 and 51,420,629 shares issued, and 50,301,813 and 51,417,866 shares outstanding, respectively | 50 | 51 | ||||||
| Capital in excess of par value | 994,778 | 1,004,496 | ||||||
| Accumulated distributable losses | (335,192 | ) | (296,919 | ) | ||||
| Total shareholders' equity | 659,636 | 707,628 | ||||||
| Total liabilities and shareholders' equity | $ | 1,843,961 | $ | 1,854,800 | ||||
| Net asset value per share of common stock at end of period | $ | 13.11 | $ | 13.76 | ||||
CĪON Investment Corporation
Consolidated Statements of Operations
(in thousands, except share and per share amounts)
| Three Months Ended | ||||||||
| March 31, 2026 | December 31, 2025 | |||||||
| (unaudited) | (unaudited) | |||||||
| Investment income | ||||||||
| Non-controlled, non-affiliated investments | ||||||||
| Interest income | $ | 23,686 | $ | 26,919 | ||||
| Paid-in-kind interest income | 5,488 | 4,525 | ||||||
| Fee income | 2,874 | 4,159 | ||||||
| Dividend income | 453 | 407 | ||||||
| Non-controlled, affiliated investments | ||||||||
| Interest income | 2,060 | 3,225 | ||||||
| Paid-in-kind interest income | 4,986 | 3,018 | ||||||
| Fee income | — | 275 | ||||||
| Dividend income | 3,345 | 4,645 | ||||||
| Controlled investments | ||||||||
| Interest income | 6,378 | 2,920 | ||||||
| Paid-in-kind interest income | 267 | 3,385 | ||||||
| Fee income | — | 314 | ||||||
| Total investment income | 49,537 | 53,792 | ||||||
| Operating expenses | ||||||||
| Management fees | 6,105 | 6,422 | ||||||
| Administrative services expense | 1,376 | 1,480 | ||||||
| Subordinated incentive fee on income | 2,728 | 3,882 | ||||||
| General and administrative | 1,962 | 1,456 | ||||||
| Interest expense | 24,413 | 22,253 | ||||||
| Total operating expenses | 36,584 | 35,493 | ||||||
| Net investment income before taxes | 12,953 | 18,299 | ||||||
| Income tax expense, including excise tax | 89 | — | ||||||
| Net investment income after taxes | 12,864 | 18,299 | ||||||
| Realized and unrealized gains (losses) | ||||||||
| Net realized gains on: | ||||||||
| Non-controlled, non-affiliated investments | 78 | 118 | ||||||
| Non-controlled, affiliated investments | 159 | — | ||||||
| Net realized gains | 237 | 118 | ||||||
| Net change in unrealized (depreciation) appreciation on: | ||||||||
| Non-controlled, non-affiliated investments | (25,511 | ) | (13,489 | ) | ||||
| Non-controlled, affiliated investments | 4,740 | (17,202 | ) | |||||
| Controlled investments | (15,361 | ) | (28,846 | ) | ||||
| Net change in unrealized depreciation | (36,132 | ) | (59,537 | ) | ||||
| Net realized and unrealized losses | (35,895 | ) | (59,419 | ) | ||||
| Net decrease in net assets resulting from operations | $ | (23,031 | ) | $ | (41,120 | ) | ||
| Per share information—basic and diluted | ||||||||
| Net decrease in net assets per share resulting from operations | $ | (0.45 | ) | $ | (0.80 | ) | ||
| Net investment income per share | $ | 0.25 | $ | 0.35 | ||||
| Weighted average shares of common stock outstanding | 50,803,697 | 51,616,723 | ||||||
ABOUT CION INVESTMENT CORPORATION
CION Investment Corporation is a leading publicly listed business development company that had approximately $1.8 billion in total assets as of March 31, 2026. CION seeks to generate current income and, to a lesser extent, capital appreciation for investors by focusing primarily on senior secured loans to U.S. middle-market companies. CION is advised by CION Investment Management, LLC, a registered investment adviser and an affiliate of CION. For more information, please visit www.cionbdc.com.
FORWARD-LOOKING STATEMENTS
This press release may contain forward-looking statements that involve substantial risks and uncertainties. You can identify these statements by the use of forward-looking terminology such as “may,” “will,” “should,” “expect,” “anticipate,” “project,” “target,” “estimate,” “intend,” “continue,” or “believe” or the negatives thereof or other variations thereon or comparable terminology. You should read statements that contain these words carefully because they discuss CION’s plans, strategies, prospects and expectations concerning its business, operating results, financial condition and other similar matters. These statements represent CION’s belief regarding future events that, by their nature, are uncertain and outside of CION’s control. There are likely to be events in the future, however, that CION is not able to predict accurately or control. Any forward-looking statement made by CION in this press release speaks only as of the date on which it is made. Factors or events that could cause CION’s actual results to differ, possibly materially from its expectations, include, but are not limited to, the risks, uncertainties and other factors CION identifies in the sections entitled “Risk Factors” and “Forward-Looking Statements” in filings CION makes with the SEC, and it is not possible for CION to predict or identify all of them. CION undertakes no obligation to update or revise publicly any forward-looking statements, whether as a result of new information, future events or otherwise, except as required by law.
OTHER INFORMATION
The information in this press release is summary information only and should be read in conjunction with CION’s Quarterly Report on Form 10-Q, which CION filed with the SEC on May 7, 2026, as well as CION’s other reports filed with the SEC. A copy of CION’s Quarterly Report on Form 10-Q and CION’s other reports filed with the SEC can be found on CION’s website at www.cionbdc.com and the SEC’s website at www.sec.gov.
CONTACTS
Media and Investor Relations

Exhibit 99.2

CION Investment Corporation First Quarter 2026 Earnings Presentation

Disclosures and Forward - Looking Statements 2 The information contained in this earnings presentation should be viewed in conjunction with the earnings conference call of CION Investment Corporation (NYSE : CION) (“CION” or the “Company”) held on Thursday, May 7 , 2026 as well as the Company’s Quarterly Report on Form 10 - Q for the quarter ended March 31 , 2026 that was filed with the Securities and Exchange Commission (the “SEC”) on May 7 , 2026 . The information contained herein may not be used, reproduced or distributed to others, in whole or in part, for any other purpose without the prior written consent of the Company . This earnings presentation may contain forward - looking statements that involve substantial risks and uncertainties, including the impact of tariffs and trade disputes with other countries, changes in inflation, high interest rates and the risk of recession on the business, future operating results, access to capital and liquidity of the Company and its portfolio companies . You can identify these statements by the use of forward - looking terminology such as “may,” “will,” “should,” “expect,” “anticipate,” “project,” “target,” “estimate,” “intend,” “continue,” or “believe” or the negatives thereof or other variations thereon or comparable terminology, including references to assumptions, forecasts of future results, shareholder diversification, institutional research coverage and availability and access to capital . You should read statements that contain these words carefully because they discuss the Company’s plans, strategies, prospects and expectations concerning its business, operating results, financial condition and other similar matters . These statements represent the Company’s belief regarding future events that, by their nature, are uncertain and outside of the Company’s control, such as the price at which the Company’s shares of common stock and other securities will trade on the NYSE . Any forward - looking statement made by the Company in this earnings presentation speaks only as of the date on which the Company makes it . Factors or events that could cause the Company’s actual results to differ, possibly materially from its expectations, include, but are not limited to, the risks, uncertainties and other factors the Company identifies in the sections entitled “Risk Factors” and “Forward - Looking Statements” in filings the Company makes with the SEC, and it is not possible for the Company to predict or identify all of them . The Company undertakes no obligation to update or revise publicly any forward - looking statements, whether as a result of new information, future events or otherwise, except as required by law . This earnings presentation does not constitute a prospectus and should under no circumstances be understood as an offer to sell or the solicitation of an offer to buy the Company’s common stock or any other securities nor will there be any sale of common stock or any other securities referred to in this earnings presentation in any state or jurisdiction in which such offer, solicitation or sale would be unlawful prior to the registration or qualification under the securities laws of such state or jurisdiction . Nothing in these materials should be construed as a recommendation to invest in any securities that may be issued by the Company or as legal, accounting or tax advice . An investment in securities of the type described herein presents certain risks . The Company is managed by CION Investment Management, LLC, an affiliate of the Company . Nothing contained herein shall be relied upon as a promise or representation whether as to past or future performance . The information contained in this earnings presentation is summary information that is intended to be considered in the context of other public announcements that the Company may make, by press release or otherwise, from time to time . The Company undertakes no duty or obligation to publicly update or revise the information contained in this earnings presentation, except as required by law . These materials contain information about the Company, certain of its personnel and affiliates and its historical performance . You should not view information related to past performance of the Company as indicative of its future results, the achievement of which cannot be assured . Past performance does not guarantee future results, which may vary . The value of investments and the income derived from investments will fluctuate and can go down as well as up . A loss of principal may occur .

3 1. The discussion of the investment portfolio excludes short term investments. First Quarter and Other Highlights – Ended March 31, 2026 • Net investment income and earnings per share for the quarter ended March 31 , 2026 were $ 0 . 25 per share and $ ( 0 . 45 ) per share, respectively ; • Net asset value per share was $ 13 . 11 as of March 31 , 2026 compared to $ 13 . 76 as of December 31 , 2025 , a decrease of $ 0 . 65 per share, or 4 . 7 % . The decrease was primarily due to mark - to - market price adjustments to certain investments in the Company’s portfolio during the quarter ended March 31 , 2026 ; • As of March 31 , 2026 , the Company had $ 1 . 17 billion of total principal amount of debt outstanding, of which 25 % was comprised of senior secured bank debt and 75 % was comprised of unsecured debt . The Company’s net debt - to - equity ratio was 1 . 62 x as of March 31 , 2026 compared to 1 . 44 x as of December 31 , 2025 ; • As of March 31 , 2026 , the Company had total investments at fair value of $ 1 . 70 billion in 89 portfolio companies across 23 industries . The investment portfolio was comprised of 80 . 8 % senior secured first lien investments ; 1 • During the quarter, the Company funded new investment commitments of $ 54 million, funded previously unfunded commitments of $ 12 million, and had sales and repayments totaling $ 38 million, resulting in a net increase to the Company's funded portfolio of $ 28 million ; • As of March 31 , 2026 , investments on non - accrual status amounted to 1 . 53 % and 5 . 35 % of the total investment portfolio at fair value and amortized cost, respectively, from 1 . 78 % and 4 . 32 % , respectively, as of December 31 , 2025 ; • During the quarter, the Company repurchased 1 , 116 , 053 shares of its common stock under its 10 b 5 - 1 trading plan at an average price of $ 8 . 71 per share for a total repurchase amount of $ 9 . 7 million . Through March 31 , 2026 , the Company repurchased a total of 6 , 656 , 627 shares of its common stock under its 10 b 5 - 1 trading plan at an average price of $ 9 . 80 per share for a total repurchase amount of $ 65 . 2 million ; • On February 9 , 2026 , the Company completed a public baby bond offering in the U . S . pursuant to which the Company issued $ 135 million in aggregate principal amount of its 7 . 50 % fixed rate senior unsecured notes due 2031 , which listed and commenced trading on the NYSE under the ticker symbol “CICC” on February 12 , 2026 ; and • On March 30, 2026, the Company repaid $100 million in aggregate principal amount of borrowings under its JPM Credit Facility. DISTRIBUTIONS • For the quarter ended March 31 , 2026 , the Company paid monthly base distributions totaling $ 15 . 2 million, or $ 0 . 30 per share ; • On March 9, 2026, the Company’s co - chief executive officers declared base distributions of $0.10 per share for each of April, Ma y, and June 2026, which were paid or will be payable to shareholders on April 24, May 29, and June 26, 2026, respectively, to shareholders of record as of April 10, May 1 5, and June 12, 2026, respectively; and • On May 4, 2026, the Company's co - chief executive officers declared base distributions of $0.10 per share for each of July, Augus t and September 2026, which will be payable to shareholders on July 31, August 28, and September 25, 2026, respectively, to shareholders of record as of July 17, August 14, an d September 11, 2026, respectively.

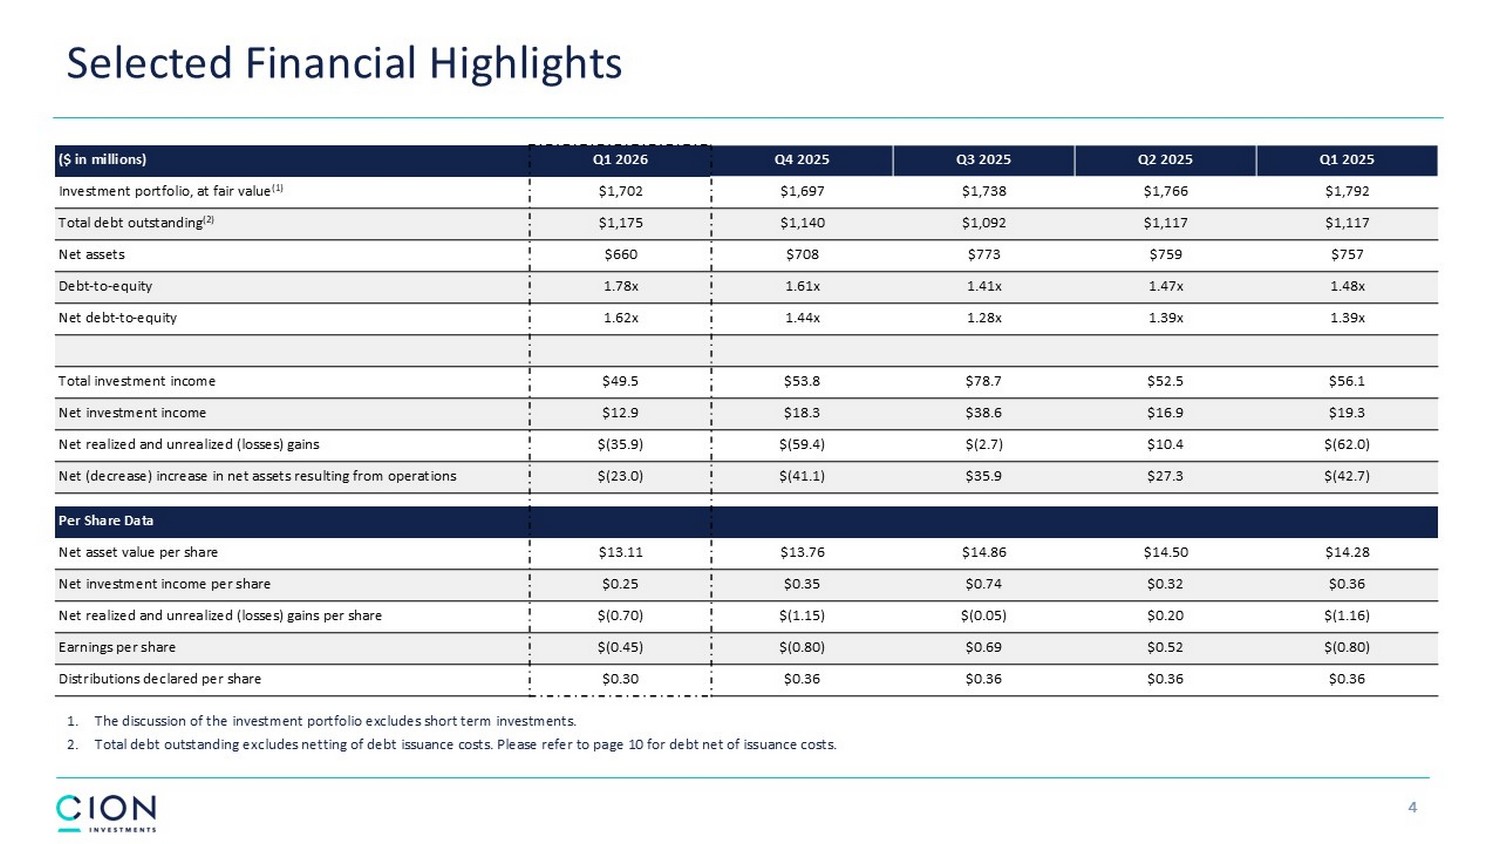
4 Selected Financial Highlights 1. The discussion of the investment portfolio excludes short term investments. 2. Total debt outstanding excludes netting of debt issuance costs. Please refer to page 10 for debt net of issuance costs. Q1 2025 Q2 2025 Q3 2025 Q4 2025 Q1 2026 ($ in millions) $1,792 $1,766 $1,738 $1,697 $1,702 Investment portfolio, at fair value (1) $1,117 $1,117 $1,092 $1,140 $1,175 Total debt outstanding (2) $757 $759 $773 $708 $660 Net assets 1.48x 1.47x 1.41x 1.61x 1.78x Debt - to - equity 1.39x 1.39x 1.28x 1.44x 1.62x Net debt - to - equity $56.1 $52.5 $78.7 $53.8 $49.5 Total investment income $19.3 $16.9 $38.6 $18.3 $12.9 Net investment income $(62.0) $10.4 $(2.7) $(59.4) $(35.9) Net realized and unrealized (losses) gains $(42.7) $27.3 $35.9 $(41.1) $(23.0) Net (decrease) increase in net assets resulting from operations Per Share Data $14.28 $14.50 $14.86 $13.76 $13.11 Net asset value per share $0.36 $0.32 $0.74 $0.35 $0.25 Net investment income per share $(1.16) $0.20 $(0.05) $(1.15) $(0.70) Net realized and unrealized (losses) gains per share $(0.80) $0.52 $0.69 $(0.80) $(0.45) Earnings per share $0.36 $0.36 $0.36 $0.36 $0.30 Distributions declared per share

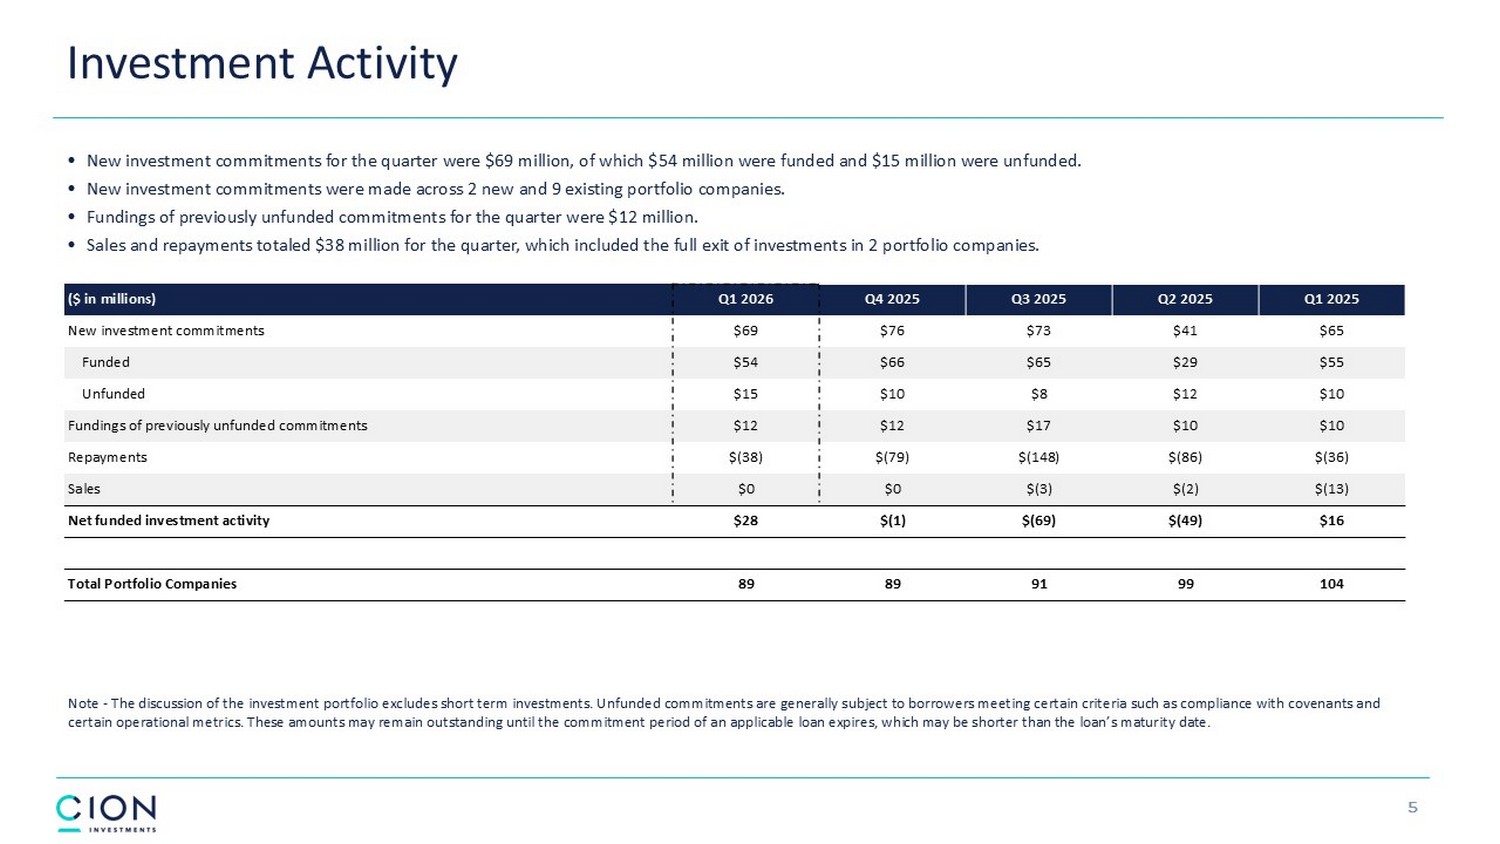
Investment Activity • New investment commitments for the quarter were $69 million, of which $54 million were funded and $15 million were unfunded. • New investment commitments were made across 2 new and 9 existing portfolio companies. • Fundings of previously unfunded commitments for the quarter were $12 million. • Sales and repayments totaled $38 million for the quarter, which included the full exit of investments in 2 portfolio companie s. Note - The discussion of the investment portfolio excludes short term investments. Unfunded commitments are generally subject to borrowers meeting certain criteria such as compliance with covenants and certain operational metrics. These amounts may remain outstanding until the commitment period of an applicable loan expires, whi ch may be shorter than the loan’s maturity date. 5 Q1 2025 Q2 2025 Q3 2025 Q4 2025 Q1 2026 ($ in millions) $65 $41 $73 $76 $69 New investment commitments $55 $29 $65 $66 $54 Funded $10 $12 $8 $10 $15 Unfunded $10 $10 $17 $12 $12 Fundings of previously unfunded commitments $(36) $(86) $(148) $(79) $(38) Repayments $(13) $(2) $(3) $0 $0 Sales $16 $(49) $(69) $(1) $28 Net funded investment activity 104 99 91 89 89 Total Portfolio Companies

6 Portfolio Asset Composition * Less than 1%. The discussion of the investment portfolio is at fair value and excludes short term investments. 93% 79% 100% 94% 5% 81% 19% 0%* 1% 0%* 0%* 0%* 1% 0%* 80% 0%* 19% 85% 14% 0%* 87% 81% 1% 12% 19% 0% 92% 1% 0%* 0%* 8% 0% 1% 20% 6% 1% 0%*

7 INTERNAL INVESTMENT RISK RATINGS (1) (% of Total Portfolio, Fair Value) Q1 2026 NON - ACCRUAL % (1) Higher Credit Quality Lower Credit Quality Credit Quality of Investments 1. The discussion of the investment portfolio excludes short term investments. * - Less than 1%. Q1 2025 Q2 2025 Q3 2025 Q4 2025 Q1 2026 Rating 2.3% 3.2% 1.5% 8.2% 9.3% 1 86.1% 83.4% 85.7% 77.9% 75.7% 2 10.3% 11.6% 10.4% 11.5% 12.9% 3 0.9% 1.4% 2.1% 1.9% 1.6% 4 0.4% 0.4% 0.3% 0.5% 0.5% 5 100.0% 100.0% 100.0% 100.0% 100.0% Total

PORTFOLIO BY SECURITY TYPE (4) PORTFOLIO BY INTEREST RATE TYPE (4) Portfolio Summary 8 ( 1 ) See endnote 4 in our press release filed with the SEC on May 7 , 2026 . ( 2 ) See endnote 5 in our press release filed with the SEC on May 7 , 2026 . ( 3 ) See endnote 6 in our press release filed with the SEC on May 7 , 2026 . ( 4 ) The discussion of the investment portfolio excludes short term investments . Portfolio Characteristics (as of March 31, 2026) (4) Investment Portfolio $1,759.9 million Total investments and unfunded commitments $57.5 million Unfunded commitments $1,702.4 million Investments at fair value 10.43 % Yield on debt and other income producing investments at amortized cost (1) 11.24 % Yield on performing loans at amortized cost (1) 8.92 % Yield on total investments at amortized cost Portfolio Companies 89 Number of portfolio companies 4.62x Weighted average leverage (net debt/EBITDA) (2) 2.08x Weighted average interest coverage (2) $34.6 million Median EBITDA (3) Industry Diversification (4) % of Investment Portfolio Industry 14.0 % Services: Business 11.8 % Healthcare & Pharmaceuticals 10.7 % Retail 8.4 % Energy: Electricity 6.8 % Media: Diversified & Production 48.3 % Other (≤ 6.7% each) 80.8% Senior Secured Debt Investments - Less than 1%

Quarterly Operating Results 9 Q1 2025 Q2 2025 Q3 2025 Q4 2025 Q1 2026 All figures in thousands, except share and per share data Investment income $ 51,394 $ 48,881 $ 68,177 $ 43,992 $ 42,865 Interest income (1) 697 1,651 905 5,052 3,798 Dividend income 3,983 1,712 9,629 4,748 2,874 Fee income $ 56,074 $ 52,244 $ 78,711 $ 53,792 $ 49,537 Total investment income Expenses $ 6,625 $ 6,497 $ 6,532 $ 6,422 $ 6,105 Management fees 22,998 22,637 22,652 22,253 24,413 Interest and other debt expenses 4,084 3,589 8,181 3,882 2,728 Incentive fees 3,115 2,589 2,874 2,936 3,338 Other operating expenses $ 36,822 $ 35,312 $ 40,239 $ 35,493 $ 36,584 Total expenses before taxes — 10 (95) — 89 Income tax expense (benefit), including excise tax $ 19,252 $ 16,922 $ 38,567 $ 18,299 $ 12,864 Net investment income after taxes Net realized (loss) gain and unrealized (depreciation) appreciation on investments $ 2,294 $ (32,376) $ (9,605) $ 118 $ 237 Net realized gain (loss) (64,251) 42,770 6,916 (59,537) (36,132) Net change in unrealized (depreciation) appreciation $ (61,957) $ 10,394 $ (2,689) $ (59,419) $ (35,895) Net realized and unrealized (losses) gains $ (42,705) $ 27,316 $ 35,878 $ (41,120) $ (23,031) Net (decrease) increase in net assets resulting from operations Per share data $ 0.36 $ 0.32 $ 0.74 $ 0.35 $ 0.25 Net investment income $ (1.16) $ 0.20 $ (0.05) $ (1.15) $ (0.70) Net realized (loss) gain and unrealized (depreciation) appreciation on investments $ (0.80) $ 0.52 $ 0.69 $ (0.80) $ (0.45) Earnings per share $ 0.36 $ 0.36 $ 0.36 $ 0.36 $ 0.30 Distributions declared per share 53,073,211 52,628,784 52,065,707 51,616,723 50,803,697 Weighted average shares outstanding 53,003,407 52,303,842 51,973,518 51,417,866 50,301,813 Shares outstanding, end of period 1. Includes certain prepayment fees, exit fees, accelerated original issue discount and paid - in - kind interest income.

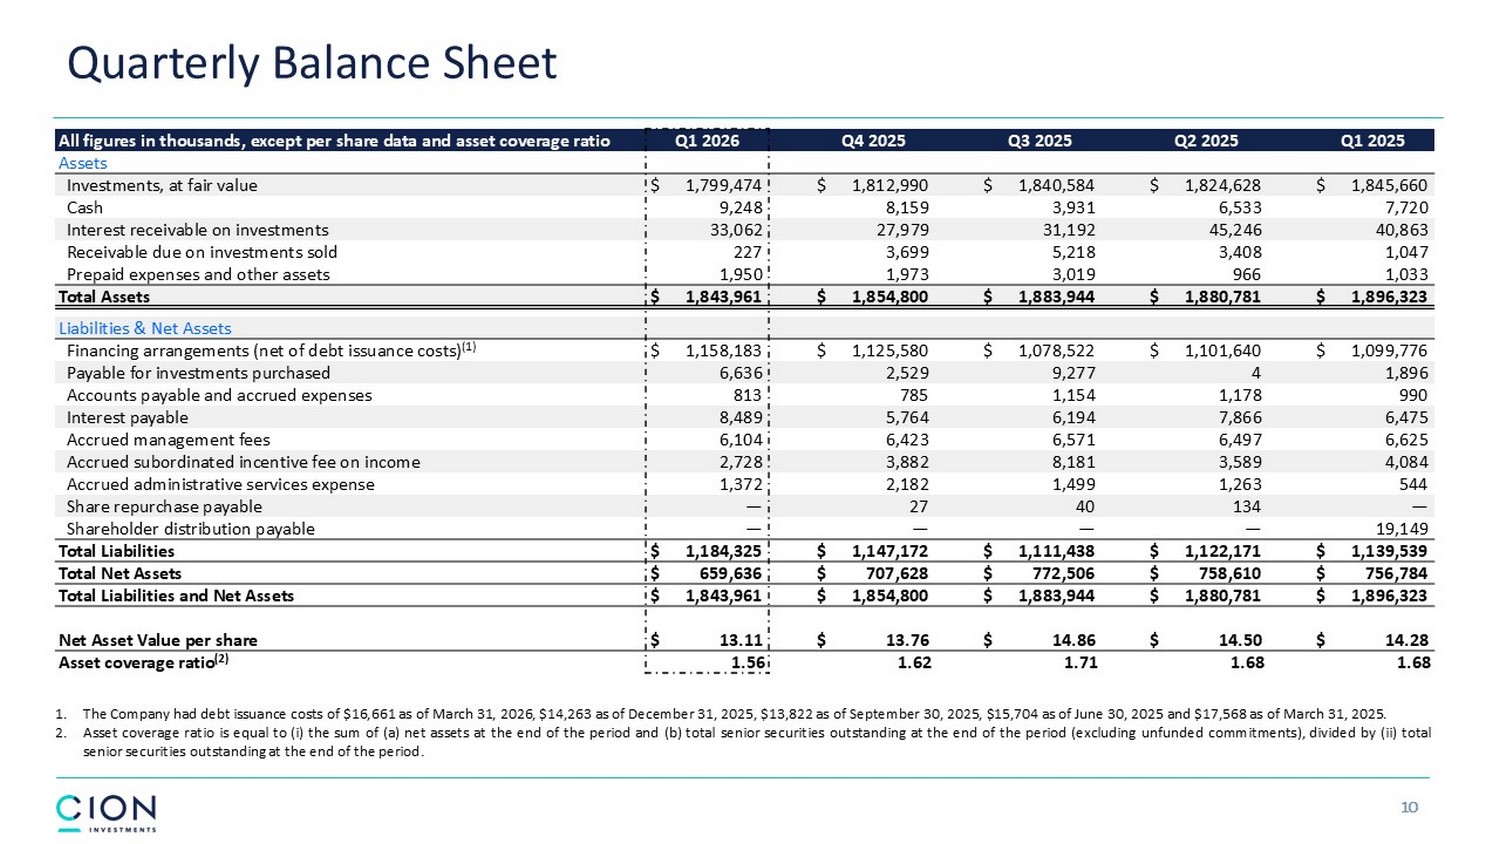
Quarterly Balance Sheet 10 Q1 2025 Q2 2025 Q3 2025 Q4 2025 Q1 2026 All figures in thousands, except per share data and asset coverage ratio Assets $ 1,845,660 $ 1,824,628 $ 1,840,584 $ 1,812,990 $ 1,799,474 Investments, at fair value 7,720 6,533 3,931 8,159 9,248 Cash 40,863 45,246 31,192 27,979 33,062 Interest receivable on investments 1,047 3,408 5,218 3,699 227 Receivable due on investments sold 1,033 966 3,019 1,973 1,950 Prepaid expenses and other assets $ 1,896,323 $ 1,880,781 $ 1,883,944 $ 1,854,800 $ 1,843,961 Total Assets Liabilities & Net Assets $ 1,099,776 $ 1,101,640 $ 1,078,522 $ 1,125,580 $ 1,158,183 Financing arrangements (net of debt issuance costs) (1) 1,896 4 9,277 2,529 6,636 Payable for investments purchased 990 1,178 1,154 785 813 Accounts payable and accrued expenses 6,475 7,866 6,194 5,764 8,489 Interest payable 6,625 6,497 6,571 6,423 6,104 Accrued management fees 4,084 3,589 8,181 3,882 2,728 Accrued subordinated incentive fee on income 544 1,263 1,499 2,182 1,372 Accrued administrative services expense — 134 40 27 — Share repurchase payable 19,149 — — — — Shareholder distribution payable $ 1,139,539 $ 1,122,171 $ 1,111,438 $ 1,147,172 $ 1,184,325 Total Liabilities $ 756,784 $ 758,610 $ 772,506 $ 707,628 $ 659,636 Total Net Assets $ 1,896,323 $ 1,880,781 $ 1,883,944 $ 1,854,800 $ 1,843,961 Total Liabilities and Net Assets $ 14.28 $ 14.50 $ 14.86 $ 13.76 $ 13.11 Net Asset Value per share 1.68 1.68 1.71 1.62 1.56 Asset coverage ratio (2) 1. The Company had debt issuance costs of $ 16 , 661 as of March 31 , 2026 , $ 14 , 263 as of December 31 , 2025 , $ 13 , 822 as of September 30 , 2025 , $ 15 , 704 as of June 30 , 2025 and $ 17 , 568 as of March 31 , 2025 . 2. Asset coverage ratio is equal to (i) the sum of (a) net assets at the end of the period and (b) total senior securities outstanding at the end of the period (excluding unfunded commitments), divided by (ii) total senior securities outstanding at the end of the period .

11 Q1 2026 Net Asset Value Bridge Per Share Data

12 Maturity Date Interest Rate Principal Amount Outstanding Total Commitment Amount 6/15/2027 S + 2.55% (2) $200 $275 JPM Credit Facility 12/30/2029 7.50% 173 173 7.50% 2029 Notes (1) 12/15/2029 7.70% 125 125 7.70% 2029 Notes (1) 12/15/2027 7.41% 48 48 7.41% 2027 Notes (1) 2/13/2028 S + 2.75% 100 125 UBS Credit Facility 3/31/2031 7.50% 135 135 7.50% 2031 Notes (1) 8/31/2026 S + 3.82% 115 115 Series A Unsecured Notes, 2026 (1) 11/8/2027 S + 4.75% 100 100 Floating Rate Unsecured Notes, Tranche A 2027 (1) 11/8/2027 S + 3.90% 100 100 Floating Rate Unsecured Notes, Tranche B, 2027 (1) 4/27/2027 S + 3.50% 50 50 2022 Unsecured Term Loan (1) 9/30/2027 S + 3.80% 30 30 2024 Unsecured Term Loan (1) 7.52% $1,175 $1,275 Total Debt Debt Summary DEBT MATURITIES ($ in millions) DEBT SCHEDULE ($ in millions) $100 million in available capacity within existing senior secured facilities 1. Investment grade credit rating. 2. The Company pays an annual administrative fee of 0.20% on JPM's total financing commitment.

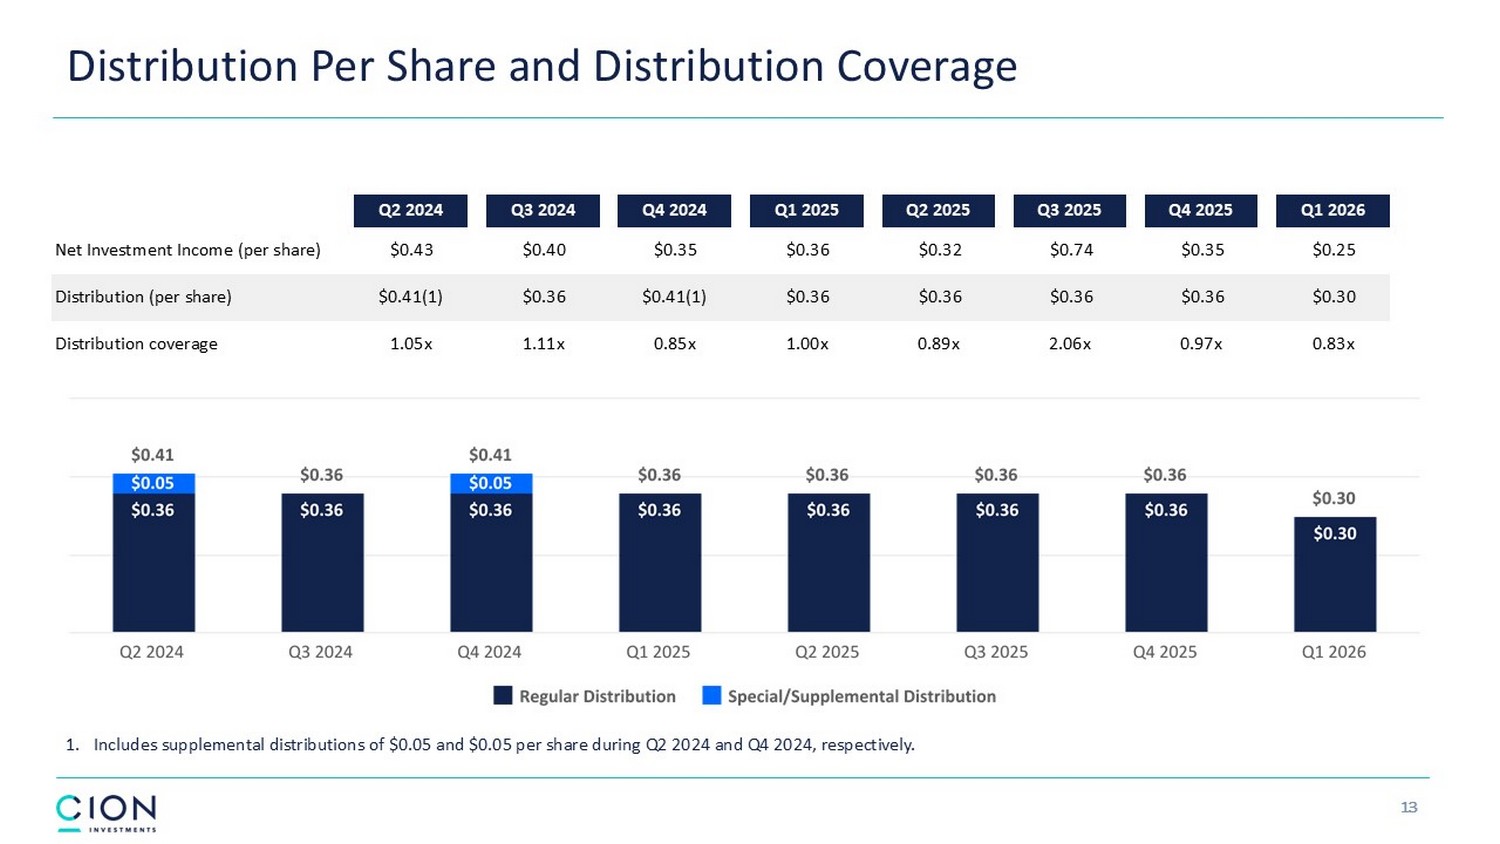
13 Distribution Per Share and Distribution Coverage 1 1. Includes supplemental distributions of $0.05 and $0.05 per share during Q2 2024 and Q4 2024, respectively. Q1 2026 Q4 2025 Q3 2025 Q2 2025 Q1 2025 Q4 2024 Q3 2024 Q2 2024 $0.25 $0.35 $0.74 $0.32 $0.36 $0.35 $0.40 $0.43 Net Investment Income (per share) $0.30 $0.36 $0.36 $0.36 $0.36 $0.41(1) $0.36 $0.41(1) Distribution (per share) 0.83x 0.97x 2.06x 0.89x 1.00x 0.85x 1.11x 1.05x Distribution coverage