EXHIBIT 99.1
Clearfield Reports Fiscal Fourth Quarter and Full Year 2020 Results
- Company Achieves Record Annual Revenue of $93.1 Million, Driven by 48% Growth in MSO (Multiple System Operators) Revenue, 18% Growth in National Carrier Revenue and 10% Growth in Community Broadband Revenue.
- Continued Execution on Operational Effectiveness Initiatives and Favorable Product Mix Produces 41.2% Quarterly Gross Profit Margin and Quarterly Record Gross Profit Dollars.
- Company Backlog Increased 153% to $10.7 Million at Year End compared to End of Fiscal 2019.
- Net Income Totaled $7.3 Million, or $0.53 per diluted share, an Improvement from $4.6 Million, or $0.34 per diluted share, in Fiscal 2019.
MINNEAPOLIS, Nov. 04, 2020 (GLOBE NEWSWIRE) -- Clearfield, Inc. (NASDAQ: CLFD), the specialist in fiber management and connectivity platforms for communication service providers, reported results for the fiscal fourth quarter and fiscal year ended September 30, 2020.
| Fiscal Q4 2020 Financial Summary | |
| (in millions except per share data and percentages) | Q4 2020 | vs. Q4 2019 | Change | Change (%) |
| Revenue | $ | 27.3 | | $ | 24.0 | | $ | 3.3 | | 14 | % |
| | | | | |
| Gross Profit ($) | $ | 11.2 | | $ | 9.3 | | $ | 1.9 | | 21 | % |
| Gross Profit (%) | | 41.2 | % | | 38.8 | % | | 2.4 | % | 6 | % |
| | | | | |
| Income from Operations | $ | 3.7 | | $ | 2.2 | | $ | 1.5 | | 69 | % |
| Income Tax Expense | $ | 0.8 | | $ | 0.5 | | $ | 0.3 | | 54 | % |
| | | | | |
| Net Income | $ | 3.0 | | $ | 1.9 | | $ | 1.2 | | 62 | % |
| Net Income per Diluted Share | $ | 0.22 | | $ | 0.14 | | $ | 0.08 | | 57 | % |
| | | | | |
| Fiscal 2020 Financial Summary | |
| (in millions except per share data and percentages) | 2020 YTD | vs. 2019 YTD | Change | Change (%) |
| Revenue | $ | 93.1 | | $ | 85.0 | | $ | 8.0 | | 9 | % |
| | | | | |
| Gross Profit ($) | $ | 37.9 | | $ | 32.7 | | $ | 5.2 | | 16 | % |
| Gross Profit (%) | | 40.7 | % | | 38.4 | % | | 2.3 | % | 6 | % |
| | | | | |
| Income from Operations | $ | 8.4 | | $ | 5.2 | | $ | 3.2 | | 62 | % |
| Income Tax Expense | $ | 1.9 | | $ | 1.4 | | $ | 0.5 | | 37 | % |
| | | | | |
| Net Income | $ | 7.3 | | $ | 4.6 | | $ | 2.7 | | 60 | % |
| Net Income per Diluted Share | $ | 0.53 | | $ | 0.34 | | $ | 0.19 | | 56 | % |
| | | | | |
Management Commentary
“The fourth quarter of fiscal 2020 capped off a record year for Clearfield,” said Company President and CEO Cheri Beranek. “The fourth quarter marked the highest quarterly revenue level in our company’s history, bringing our total revenue for the fiscal year 2020 to a record $93.1 million. Our record topline results were driven by solid contributions across our core markets, including 48% growth in our MSO (Multiple System Operators) revenue, 18% growth in our National Carrier revenue and 10% growth in our Community Broadband revenue.
“As our overall performance in fiscal Q4 and fiscal 2020 indicate, we are realizing demonstrable results from our execution of our ‘Coming of Age’ Plan, which is designed to strengthen our core business and position our company for disruptive growth opportunities, and from our ability to take advantage of the shifts in demand driven by COVID-19. Fiscal Q4 represented a continuation of our Community Broadband customers accelerating their purchasing decisions and deployments in response to COVID-19. This trend is carrying into fiscal 2021, supported by continued demand for broadband and the government programs such as The CARES Act are helping to fund and accelerate these deployments. Our track record and reputation in the Community Broadband market has positioned us extremely well to take share and further capitalize on the expansion that’s currently underway which we believe will accelerate due to pending programs including the Rural Digital Opportunity Fund, or RDOF initiative, which will finance up to $20.4 billion of gigabit speed broadband over the next ten years.
“Our successful execution on our operational effectiveness initiatives over the last several quarters are most evident by our increasing gross profit in fiscal Q4. One of the underlying drivers for this improvement is leveraging our core nucleus of U.S.-based operations for value-added integration while we’ve capitalized on the investments we’ve made in our operations in Mexico. These investments are starting to yield beneficial results both in improved efficiencies and cost effectiveness.
“An integral part of our success has been our employees’ unwavering commitment to providing best-in-class products and customer support, and none of this could have been accomplished without their dedication to our mission.
“Our strong financial and operational performance in fiscal 2020 speaks to the resiliency of our business as well as our strategic positioning within our customer base and industry. Our success in fiscal Q4 specifically has given us significant momentum starting our fiscal year Q1, giving us a bullish outlook for fiscal 2021. The business case for optical fiber markets for 5G and Access Networks deployment couldn’t be more evident. Based on our strong backlog, ongoing robust bookings and pipeline of business, we currently anticipate a strong first quarter of fiscal 2021 compared to the same year-ago period. Longer term, the traction we are getting with our ‘Coming of Age’ Plan and the success of our operational improvements positions Clearfield for even greater success in the years ahead.”
Financial Results for the Year Ended September 30, 2020
Revenues increased 9% to $93.1 million for the year ended September 30, 2020 from $85.0 million in fiscal 2019. The increase in revenues was primarily due to higher sales in the Company’s National Carrier, MSO and Community Broadband markets, partially offset by lower sales in the Company’s international and contract manufacturing markets. We anticipate the momentum will continue into FY 2021 Q1 in that order backlog (defined as purchase orders received but not yet fulfilled) as of September 30, 2020 increased 26% to $10.7 million from $8.5 million at June 30, 2020 and increased 153% to $10.7 million from $4.2 million as of September 30, 2019.
Gross profit was $37.9 million, or 40.7% of revenue, for the year ended September 30, 2020, an increase of 16% from $32.7 million, or 38.4% of revenue, in fiscal 2019. The increase in gross profit dollars was due to increased sales volume. The increase in gross profit percent was due to a favorable product mix and cost reduction efforts across the Company’s product lines, including increased production at its Mexico manufacturing plants and efficiencies realized from supply chain programs, and lower tariff costs.
Operating expenses increased 7% to $29.5 million for the year ended September 30, 2020 from $27.5 million during the same period in fiscal 2019. The increase in operating expenses was primarily due to the higher compensation and performance incentive expenses and external sales commissions and agent fees, offset by lower stock-based compensation expense and travel, entertainment and marketing costs due to COVID-19 restrictions.
Income from operations totaled $8.4 million for the year ended September 30, 2020 compared to $5.2 million in fiscal 2019.
Income tax expense was $1.9 million for the year ended September 30, 2020 as compared to $1.4 million during the same period in fiscal 2019 due to higher taxable income. Net income totaled $7.3 million, or $0.53 per diluted share, for the year ended September 30, 2020, an improvement from $4.6 million, or $0.34 per diluted share, in fiscal 2019.
As of September 30, 2020, cash, cash equivalents and investments totaled $52.2 million, which compares to $47.5 million as of September 30, 2019.
Financial Results for the Quarter Ended September 30, 2020
Revenue for the fourth quarter of fiscal 2020 increased 14% to $27.3 million from $24.0 million in the same year-ago quarter. The increase in revenues was primarily due to higher sales in the Company’s Community Broadband and MSO markets, partially offset by decreases in national carrier revenue due to ordering cycles and our international market.
Gross profit for the fourth quarter of fiscal 2020 increased 21% to $11.2 million, or 41.2% of revenue, from $9.3 million, or 38.8% of revenue, in the fourth quarter of fiscal 2019. The increase in gross profit dollars was due to increased sales volume. The increase in gross profit percent was due to a favorable product mix and cost reduction efforts across the Company’s product lines, including increased production at its Mexico manufacturing plants, and efficiencies realized from supply chain programs and lower tariff costs.
Operating expenses for the fourth quarter of fiscal 2020 totaled $7.6 million, which compares to $7.1 million in the same year-ago quarter. The increase in operating expenses consisted primarily of higher compensation costs related to performance compensation accruals.
Income from operations increased 69% to $3.7 million for the fourth quarter of fiscal 2020 from $2.2 million in the same year-ago quarter.
Income tax expense increased 54% to $786,000 for the fourth quarter of fiscal 2020 from $511,000 in the same year-ago quarter due to higher taxable income. Net income was $3.0 million for the fourth quarter of fiscal 2020, or $0.22 per diluted share, from $1.9 million, or $0.14 per diluted share in the same year-ago quarter.
Conference Call
Clearfield management will hold a conference call today, November 4, 2020 at 5:00 p.m. Eastern Standard Time (4:00 p.m. Central Standard Time) to discuss these results and provide an update on business conditions.
Clearfield’s President and CEO Cheri Beranek and CFO Dan Herzog will host the presentation, followed by a question and answer period.
U.S. dial-in: 1-800-771-6883
International dial-in: 1-212-231-2915
Conference ID: 21971085
The conference call will be webcast live and available for replay here: http://public.viavid.com/index.php?id=142048.
Please call the conference telephone number 10 minutes prior to the start time. An operator will register your name and organization. If you have any difficulty connecting with the conference call, please contact Gateway Investor Relations at 1-949-574-3860.
A replay of the call will be available after 8:00 p.m. Eastern time on the same day through November 18, 2020.
U.S. replay dial-in: 1-844-512-2921
International replay dial-in: 1-412-317-6671
Replay ID: 21971085
About Clearfield, Inc.
Clearfield, Inc. (NASDAQ: CLFD) designs, manufactures and distributes fiber optic management, protection and delivery products for communications networks. Our “fiber to anywhere” platform serves the unique requirements of leading incumbent local exchange carriers (traditional carriers), competitive local exchange carriers (alternative carriers), and MSO/cable TV companies, while also catering to the broadband needs of the utility/municipality, enterprise, data center and military markets. Headquartered in Minneapolis, MN, Clearfield deploys more than a million fiber ports each year. For more information, visit www.SeeClearfield.com.
Cautionary Statement Regarding Forward-Looking Information
Forward-looking statements contained herein and in any related presentation or in the related FieldReport are made pursuant to the safe harbor provisions of the Private Litigation Reform Act of 1995. Words such as “may,” “will,” “expect,” “believe,” “anticipate,” “estimate,” “outlook,” or “continue” or comparable terminology are intended to identify forward-looking statements. Such forward looking statements include, for example, statements about the expected impact of COVID-19 and related economic uncertainty, the Company’s future revenue and operating performance, the impact of the CARES Act or other government programs on the demand for the Company’s products or timing of customer orders, and trends in and growth of the FTTx markets, market segments or customer purchases and other statements that are not historical facts. These statements are based upon the Company's current expectations and judgments about future developments in the Company's business. Certain important factors could have a material impact on the Company's performance, including, without limitation: the as yet-unknown impact of COVID-19 and related economic uncertainty; to compete effectively, we must continually improve existing products and introduce new products that achieve market acceptance; our expected growth is based upon the expansion of the telecommunications market; our operating results may fluctuate significantly from quarter to quarter, which may make budgeting for expenses difficult and may negatively affect the market price of our common stock; our success depends upon adequate protection of our patent and intellectual property rights; intense competition in our industry may result in price reductions, lower gross profits and loss of market share; we rely on single-source suppliers, which could cause delays, increases in costs or prevent us from completing customer orders, all of which could materially harm our business; a significant percentage of our sales in the last three fiscal years have been made to a small number of customers, and the loss of these major customers or significant decline in business with these major customers would adversely affect us; further consolidation among our customers may result in the loss of some customers and may reduce sales during the pendency of business combinations and related integration activities; we may be subject to risks associated with acquisitions that could adversely affect future operating results; product defects or the failure of our products to meet specifications could cause us to lose customers and sales or to incur unexpected expenses; we are dependent upon key personnel; we face risks associated with expanding our sales outside of the United States; our business is dependent on effective management information systems and information technology infrastructure; our results of operations could be adversely affected by economic conditions and the effects of these conditions on our customers’ businesses; changes in government funding programs may cause our customers and prospective customers to delay or reduce purchases; and other factors set forth in Part I, Item IA. Risk Factors of Clearfield's Annual Report on Form 10-K for the year ended September 30, 2020 as well as other filings with the Securities and Exchange Commission. The Company undertakes no obligation to update these statements to reflect actual events unless required by law.
Investor Relations Contact:
Matt Glover and Tom Colton
Gateway Investor Relations
1-949-574-3860
[email protected]
| CLEARFIELD, INC. | | | | | | | | | | | | |
| STATEMENTS OF EARNINGS | | | | | | | | | | | |
| | | | | | | | | | | | | |
| | (Unaudited) | | | |
| | Three Months Ended | | Year Ended | |
| | September 30, | | September 30, | |
| | | | 2020 | | | | 2019 | | | | 2020 | | | | 2019 |
| | | | | | | | | | | | | |
| Revenues | $ | | 27,317,969 | | $ | | 23,968,423 | | $ | | 93,074,514 | | $ | | 85,034,182 | |
| | | | | | | | | | | | | |
| Cost of sales | | | 16,072,909 | | | | 14,663,868 | | | | 55,160,316 | | | | 52,345,059 | |
| | | | | | | | | | | | | |
| Gross profit | | | 11,245,060 | | | | 9,304,555 | | | | 37,914,198 | | | | 32,689,123 | |
| | | | | | | | | | | | | |
| Operating expenses | | | | | | | | | | | | |
| Selling, general and | | | | | | | | | | | | |
| administrative | | | 7,565,160 | | | | 7,126,376 | | | | 29,530,198 | | | | 27,500,989 | |
| Income from operations | | | 3,679,900 | | | | 2,178,179 | | | | 8,384,000 | | | | 5,188,134 | |
| | | | | | | | | | | | | |
| Interest income | | | 155,427 | | | | 220,985 | | | | 770,950 | | | | 738,459 | |
| Income before income taxes | | 3,835,327 | | | | 2,399,164 | | | | 9,154,950 | | | | 5,926,593 | |
| | | | | | | | | | | | | |
| Income tax expense | | | 785,884 | | | | 511,437 | | | | 1,861,884 | | | | 1,360,437 | |
| | | | | | | | | | | | | |
| Net income | $ | | 3,049,443 | | $ | | 1,887,727 | | $ | | 7,293,066 | | $ | | 4,566,156 | |
| | | | | | | | | | | | | |
| Net income per share: | | | | | | | | | | | | |
| Basic | $ | | 0.22 | | $ | | 0.14 | | $ | | 0.53 | | $ | | 0.34 | |
| Diluted | $ | | 0.22 | | $ | | 0.14 | | $ | | 0.53 | | $ | | 0.34 | |
| | | | | | | | | | | | | |
| Weighted average shares outstanding: | | | | | | | | | | |
| Basic | | | 13,650,316 | | | | 13,502,178 | | | | 13,643,355 | | | | 13,442,871 | |
| Diluted | | | 13,650,316 | | | | 13,502,178 | | | | 13,643,355 | | | | 13,451,214 | |
| | | | | | | | | | | | | |
| | | | | | |
| CLEARFIELD, INC. | | | | | |
| BALANCE SHEETS | | | | | |
| | | September 30, | | | September 30, |
| | | 2020 | | | 2019 |
| Assets | | | | | |
| Current Assets | | | | | |
| Cash and cash equivalents | $ | 16,449,636 | | $ | 10,081,721 |
| Short-term investments | | 10,582,527 | | | 13,524,270 |
| Accounts receivable, net | | 10,496,672 | | | 9,118,639 |
| Inventories, net | | 14,408,538 | | | 9,012,980 |
| Other current assets | | 585,436 | | | 769,161 |
| Total current assets | | 52,522,809 | | | 42,506,771 |
| | | | | | |
| Property, plant and equipment, net | | 5,109,988 | | | 5,413,241 |
| | | | | | |
| Other Assets | | | | | |
| Long-term investments | | 25,143,000 | | | 23,902,000 |
| Goodwill | | 4,708,511 | | | 4,708,511 |
| Intangible assets, net | | 4,829,047 | | | 5,147,135 |
| Right of use lease assets | | 2,539,100 | | | - |
| Deferred tax asset | | 178,118 | | | - |
| Other | | 266,857 | | | 210,905 |
| Total other assets | | 37,664,633 | | | 33,968,551 |
| Total Assets | $ | 95,297,430 | | $ | 81,888,563 |
| | | | | | |
| Liabilities and Shareholders' Equity | | | | | |
| Current Liabilities | | | | | |
| Current portion of lease liability | $ | 665,584 | | $ | - |
| Accounts payable | | 3,689,587 | | | 3,173,599 |
| Accrued compensation | | 4,856,885 | | | 3,224,860 |
| Accrued expenses | | 1,202,753 | | | 208,603 |
| Total current liabilities | | 10,414,809 | | | 6,607,062 |
| | | | | | |
| Other Liabilities | | | | | |
| Long-term portion of lease liability | | 2,129,343 | | | - |
| Deferred tax liability | | - | | | 101,690 |
| Deferred rent | | - | | | 246,424 |
| Total other liabilities | | 2,129,343 | | | 348,114 |
| Total Liabilities | | 12,544,152 | | | 6,955,176 |
| | | | | | |
| Shareholders' Equity | | | | | |
| Common stock | | 136,500 | | | 136,418 |
| Additional paid-in capital | | 57,502,905 | | | 56,976,162 |
| Retained earnings | | 25,113,873 | | | 17,820,807 |
| Total Shareholders' Equity | | 82,753,278 | | | 74,933,387 |
| Total Liabilities and Shareholders' Equity | $ | 95,297,430 | | $ | 81,888,563 |
| | | | | | |
| | | | | Year Ended | | | Year Ended |
| | | | | September 30, | | | September 30, |
| | | | | 2020 | | | 2019 |
| Cash flows from operating activities: | | | | | | | |
| Net income | | | $ | 7,293,066 | | | $ | 4,566,156 | |
| Adjustments to reconcile net income to cash provided | | | | | | | |
| by (used in) operating activities: | | | | | | | |
| Depreciation and amortization | | | | 2,421,754 | | | | 2,178,409 | |
| Change in allowance for doubtful accounts | | | | - | | | | 210,000 | |
| Amortization of discount on investments | | | | (64,327 | ) | | | (71,652 | ) |
| Deferred income taxes | | | | (279,808 | ) | | | (3,245 | ) |
| Loss on disposal of assets | | | | 5,785 | | | | - | |
| Stock-based compensation expense | | | | 773,555 | | | | 1,729,025 | |
| Changes in operating assets and liabilities; | | | | | | | |
| Accounts receivable | | | | (1,378,033 | ) | | | 3,492,619 | |
| Inventories | | | | (5,395,558 | ) | | | 1,037,155 | |
| Other current assets | | | | 127,773 | | | | (10,469 | ) |
| Accounts payable, accrued expenses and | | | | | | | |
| deferred rent | | | | 3,151,566 | | | | 1,604,655 | |
| Net cash provided by operating activities | | | | 6,655,773 | | | | 14,732,653 | |
| | | | | | | | |
| Cash flows from investing activities: | | | | | | | |
| Purchases of property, plant and equipment and | | | | | | | |
| intangible assets | | | | (1,806,198 | ) | | | (2,511,646 | ) |
| Purchase of investments | | | | (34,056,930 | ) | | | (20,311,393 | ) |
| Proceeds from maturities of investments | | | | 35,822,000 | | | | 9,861,000 | |
| Net cash used in investing activities | | | | (41,128 | ) | | | (12,962,039 | ) |
| | | | | | | | |
| Cash flows from financing activities: | | | | | | | |
| Repurchases of common stock | | | | (428,654 | ) | | | - | |
| Proceeds from issuance of common stock under | | | | 348,776 | | | | 313,891 | |
| employee stock purchase plan | | | | | | | |
| Proceeds from issuance of common stock | | | | 9,564 | | | | 2,604 | |
| employee stock purchase plan | | | | | | | |
| Tax withholding related to vesting of restricted stock | | | | | | | |
| grants and exercise of stock options | | | | (176,416 | ) | | | (553,165 | ) |
| Net cash used in financing activities | | | | (246,730 | ) | | | (236,670 | ) |
| Increase in cash and cash equivalents | | | | 6,367,915 | | | | 1,533,944 | |
| Cash and cash equivalents at beginning of year | | | | 10,081,721 | | | | 8,547,777 | |
| Cash and cash equivalents at end of year | | | $ | 16,449,636 | | | $ | 10,081,721 | |
| | | | | | | | |
| Supplemental disclosures for cash flow information | | | | | | | |
| Cash paid during the year for income taxes | | | $ | 1,442,079 | | | $ | 1,683,113 | |
| | | | | | | | |
| Non-cash financing activities | | | | | | | |
| Cashless exercise of stock options | | | $ | 97,811 | | | $ | 17,390 | |
Exhibit 99.2

FieldReport / Fiscal Q4 2020 Earnings Call / November 4, 2020 NASDAQ:CLFD The Industry Leader in Craft Friendly Fiber Optic Management and Connectivity Solutions Fiscal Q4 and FY 2020 Earnings Call FieldReport

FieldReport / Fiscal Q4 2020 Earnings Call / November 4, 2020 NASDAQ:CLFD Important Cautions Regarding Forward - Looking Statements Forward - looking statements contained herein and in any related presentation or in the related FieldReport are made pursuant to the safe harbor provisions of the Private Litigation Reform Act of 1995. Words such as “may,” “will,” “expect,” “believe,” “anticipate,” “est ima te,” “outlook,” or “continue” or comparable terminology are intended to identify forward - looking statements. Such forward looking statements includ e, for example, statements about the expected impact of COVID - 19 and related economic uncertainty, the Company’s future revenue and operating pe rformance, the impact of the CARES Act or other government programs on the demand for the Company’s products or timing of customer orders , and trends in and growth of the FTTx markets, market segments or customer purchases and other statements that are not historical facts. These statements are based upon the Company's current expectations and judgments about future developments in the Company's business. Certain important fac tors could have a material impact on the Company's performance, including, without limitation: the as yet - unknown impact of COVID - 19 and related economic uncertainty; to compete effectively, we must continually improve existing products and introduce new products that achieve ma rke t acceptance; our expected growth is based upon the expansion of the telecommunications market; our operating results may fluctuate significant ly from quarter to quarter, which may make budgeting for expenses difficult and may negatively affect the market price of our common stock; our suc cess depends upon adequate protection of our patent and intellectual property rights; intense competition in our industry may result in price r edu ctions, lower gross profits and loss of market share; we rely on single - source suppliers, which could cause delays, increases in costs or prevent us from co mpleting customer orders, all of which could materially harm our business; a significant percentage of our sales in the last three fiscal years ha ve been made to a small number of customers, and the loss of these major customers or significant decline in business with these major customers woul d a dversely affect us; further consolidation among our customers may result in the loss of some customers and may reduce sales during the pendency o f b usiness combinations and related integration activities; we may be subject to risks associated with acquisitions that could adversely af fect future operating results; product defects or the failure of our products to meet specifications could cause us to lose customers and sales or to incur unexpected expenses; we are dependent upon key personnel; we face risks associated with expanding our sales outside of the United States; our busi nes s is dependent on effective management information systems and information technology infrastructure; our results of operations could be advers ely affected by economic conditions and the effects of these conditions on our customers’ businesses; changes in government funding programs may cause our customers and prospective customers to delay or reduce purchases; and other factors set forth in Part I, Item IA. Risk Factor s o f Clearfield's Annual Report on Form 10 - K for the year ended September 30, 2019 as well as other filings with the Securities and Exchange Commission. The Company undertakes no obligation to update these statements to reflect actual events unless required by law. © Copyright 2020 Clearfield, Inc. All Rights Reserved. NASDAQ:CLFD 2

FieldReport / Fiscal Q4 2020 Earnings Call / November 4, 2020 NASDAQ:CLFD Welcome Cheri Beranek PRESIDENT & CEO NASDAQ:CLFD 3

FieldReport / Fiscal Q4 2020 Earnings Call / November 4, 2020 NASDAQ:CLFD FQ4 & 2020 Highlights NASDAQ:CLFD 4 Fourth Quarter: • Record revenue of $27.3M, up 14% y/o/y • Gross profit up 21% to record $11.2M (41.2% of revenue) • Net income of $3.0M or $0.22 per diluted share • Order backlog increased 153% to $10.7M FY2020: • Record revenue of $93.1M, up 9% y/o/y • Gross profit up 16% to $37.9M (40.7% of revenue) • Net income of $7.3M or $0.53 per diluted share $24.0M $19.4M $20.4M $26.0M $27.3M Q4-19 Q1-20 Q2-20 Q3-20 Q4-20 Quarterly Revenue $77.7M $85.0M $93.1M 2018 2019 2020 Annual Revenue
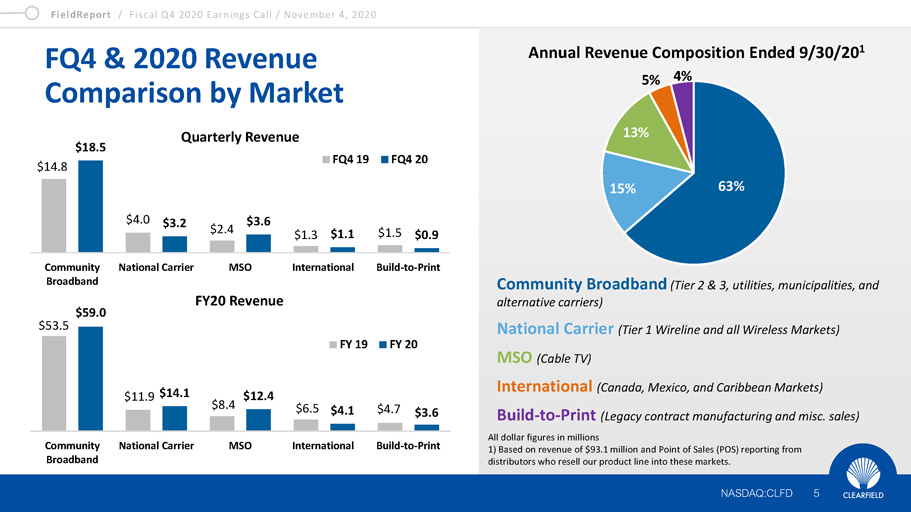
FieldReport / Fiscal Q4 2020 Earnings Call / November 4, 2020 NASDAQ:CLFD FQ4 & 2020 Revenue Comparison by Market NASDAQ:CLFD 5 All dollar figures in millions 1) Based on revenue of $93.1 million and Point of Sales (POS) reporting from distributors who resell our product line into these markets. Annual Revenue Composition Ended 9/30/20 1 Community Broadband (Tier 2 & 3, utilities, municipalities, and alternative carriers) National Carrier (Tier 1 Wireline and all Wireless Markets) MSO (Cable TV) International (Canada, Mexico, and Caribbean Markets) Build - to - Print (Legacy contract manufacturing and misc. sales) 63% 15% 13% 5% 4% $53.5 $11.9 $8.4 $6.5 $4.7 $14.1 $12.4 $4.1 $3.6 Community Broadband National Carrier MSO International Build-to-Print FY 19 FY 20 Quarterly Revenue FY20 Revenue $14.8 $4.0 $2.4 $1.3 $1.5 $18.5 $3.2 $3.6 $1.1 $0.9 Community Broadband National Carrier MSO International Build-to-Print FQ4 19 FQ4 20 $59.0

FieldReport / Fiscal Q4 2020 Earnings Call / November 4, 2020 NASDAQ:CLFD Financial Update Dan Herzog CHIEF FINANCIAL OFFICER NASDAQ:CLFD 6

FieldReport / Fiscal Q4 2020 Earnings Call / November 4, 2020 NASDAQ:CLFD Quarterly Financial Performance 7 NASDAQ:CLFD Note: Dollar figures in millions $24.0 $19.4 $20.4 $26.0 $27.3 Q4-19 Q1-20 Q2-20 Q3-20 Q4-20 Revenue +7% - 4% +7% +19% +14% Year - over - Year Growth Rate

FieldReport / Fiscal Q4 2020 Earnings Call / November 4, 2020 NASDAQ:CLFD Quarterly Financial Performance 8 NASDAQ:CLFD Note: Dollar figures in millions $24.0 $19.4 $20.4 $26.0 $27.3 Q4-19 Q1-20 Q2-20 Q3-20 Q4-20 Revenue +7% - 4% +7% +19% +14% Year - over - Year Growth Rate $9.3 $7.7 $8.2 $10.8 $11.2 Q4-19 Q1-20 Q2-20 Q3-20 Q4-20 Gross Profit 38.8% 39.9% 39.9% 41.5% 41.2% Gross Profit (%)

FieldReport / Fiscal Q4 2020 Earnings Call / November 4, 2020 NASDAQ:CLFD Quarterly Financial Performance 9 NASDAQ:CLFD Note: Dollar figures in millions $24.0 $19.4 $20.4 $26.0 $27.3 Q4-19 Q1-20 Q2-20 Q3-20 Q4-20 Revenue +7% - 4% +7% +19% +14% Year - over - Year Growth Rate $9.3 $7.7 $8.2 $10.8 $11.2 Q4-19 Q1-20 Q2-20 Q3-20 Q4-20 Gross Profit 38.8% 39.9% 39.9% 41.5% 41.2% Gross Profit (%) 29.7% 37.8% 36.4% 27.8% 27.7% OPEX as % of Revenue $7.1 $7.3 $7.4 $7.2 $7.6 Q4-19 Q1-20 Q2-20 Q3-20 Q4-20 Operating Expenses

FieldReport / Fiscal Q4 2020 Earnings Call / November 4, 2020 NASDAQ:CLFD Quarterly Financial Performance 10 NASDAQ:CLFD Note: Dollar figures in millions $24.0 $19.4 $20.4 $26.0 $27.3 Q4-19 Q1-20 Q2-20 Q3-20 Q4-20 Revenue +7% - 4% +7% +19% +14% Year - over - Year Growth Rate $9.3 $7.7 $8.2 $10.8 $11.2 Q4-19 Q1-20 Q2-20 Q3-20 Q4-20 Gross Profit 38.8% 39.9% 39.9% 41.5% 41.2% Gross Profit (%) 29.7% 37.8% 36.4% 27.8% 27.7% OPEX as % of Revenue $7.1 $7.3 $7.5 $7.2 $7.6 Q4-19 Q1-20 Q2-20 Q3-20 Q4-20 Operating Expenses 7.9% 2.6% 3.7% 11.5% 10.9% Net Margin $1.9 $0.5 $0.7 $3.0 $3.0 Q4-19 Q1-20 Q2-20 Q3-20 Q4-20 Net Income

FieldReport / Fiscal Q4 2020 Earnings Call / November 4, 2020 NASDAQ:CLFD Annual Financial Performance 11 NASDAQ:CLFD Note: Dollar figures in millions $77.7 $85.0 $93.1 2018 2019 2020 Revenue +5% +10% +9% Year - over - Year Growth Rate

FieldReport / Fiscal Q4 2020 Earnings Call / November 4, 2020 NASDAQ:CLFD Annual Financial Performance 12 NASDAQ:CLFD Note: Dollar figures in millions $77.7 $85.0 $93.1 2018 2019 2020 Revenue $31.0 $32.7 $37.9 2018 2019 2020 Gross Profit 39.9% 38.4% 40.7% Gross Profit (%) $37.9 +5% +10% +9% Year - over - Year Growth Rate

FieldReport / Fiscal Q4 2020 Earnings Call / November 4, 2020 NASDAQ:CLFD Annual Financial Performance 13 NASDAQ:CLFD Note: Dollar figures in millions $77.7 $85.0 $93.1 2018 2019 2020 Revenue $31.0 $32.7 $37.9 2018 2019 2020 Gross Profit $37.9 $25.9 $27.5 $29.5 2018 2019 2020 Operating Expenses 33.4% 32.3% 31.7% OPEX as % of Revenue +5% +10% +9% Year - over - Year Growth Rate 39.9% 38.4% 40.7% Gross Profit (%)

FieldReport / Fiscal Q4 2020 Earnings Call / November 4, 2020 NASDAQ:CLFD Annual Financial Performance 14 NASDAQ:CLFD Note: Dollar figures in millions $37.9 $4.3 $4.6 $7.3 2018 2019 2020 Net Income 5.5% 5.4% 7.8% Net Margin $77.7 $85.0 $93.1 2018 2019 2020 Revenue $31.0 $32.7 $37.9 2018 2019 2020 Gross Profit $37.9 $25.9 $27.5 $29.5 2018 2019 2020 Operating Expenses +5% +10% +9% Year - over - Year Growth Rate 39.9% 38.4% 40.7% Gross Profit (%) 33.4% 32.3% 31.7% OPEX as % of Revenue

FieldReport / Fiscal Q4 2020 Earnings Call / November 4, 2020 NASDAQ:CLFD Strong Balance Sheet Supports Profitable Growth • $52.2 million in cash and cash investment balances NASDAQ:CLFD 15 $ in Millions as of September 30 Cash and Investment Balances $35.5 $47.5 $52.2 2018 2019 2020

FieldReport / Fiscal Q4 2020 Earnings Call / November 4, 2020 NASDAQ:CLFD COVID - 19 Operational Update • Critical manufacturer status • Operating at normal capacity while adhering to state and federal government social distancing guidelines • Majority of supply chain remains operational • Established higher minimum stocking levels on component level inventory to ensure customer needs are met NASDAQ:CLFD 16

FieldReport / Fiscal Q4 2020 Earnings Call / November 4, 2020 NASDAQ:CLFD COVID - 19 Accelerating Broadband Demand Wireline Broadband Access (PON, p2P, xDSL, Gfast) Equipment Revenue (July 2020 vs. Feb. 2020)

FieldReport / Fiscal Q4 2020 Earnings Call / November 4, 2020 NASDAQ:CLFD Clearfield’s ‘Coming of Age’ Plan NASDAQ:CLFD 18 Expanding Core Community Broadband Business Attracting utilities, co - ops and CLECs as they enter underserved communities, maintaining a steady growth rate

FieldReport / Fiscal Q4 2020 Earnings Call / November 4, 2020 NASDAQ:CLFD Clearfield’s ‘Coming of Age’ Plan NASDAQ:CLFD 19 Expanding Core Community Broadband Business Attracting utilities, co - ops and CLECs as they enter underserved communities, maintaining a steady growth rate Enhancing Competitive Position and Operational Effectiveness Investing in products, manufacturing and supply chain to increase competitiveness and maintain and reduce costs
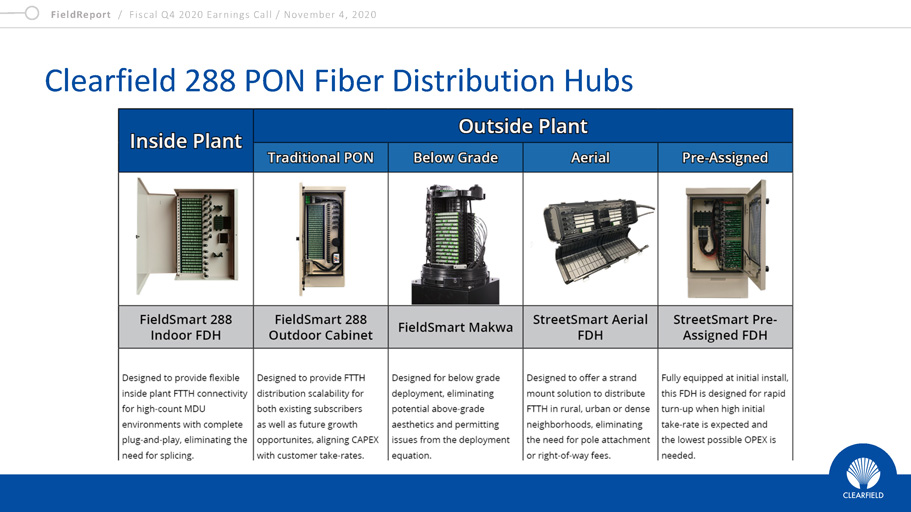
FieldReport / Fiscal Q4 2020 Earnings Call / November 4, 2020 NASDAQ:CLFD Clearfield 288 PON Fiber Distribution Hubs

FieldReport / Fiscal Q4 2020 Earnings Call / November 4, 2020 NASDAQ:CLFD Clearfield’s ‘Coming of Age’ Plan NASDAQ:CLFD 21 Expanding Core Community Broadband Business Attracting utilities, co - ops and CLECs as they enter underserved communities, maintaining a steady growth rate Enhancing Competitive Position and Operational Effectiveness Investing in products, manufacturing and supply chain to increase competitiveness and maintain and reduce costs Capitalizing on Disruptive Growth Opportunities Within National Wireline and Wireless Markets Leveraging customer relationships and application knowledge to capture opportunities related to 5G, NG - PON, and edge computing initiatives
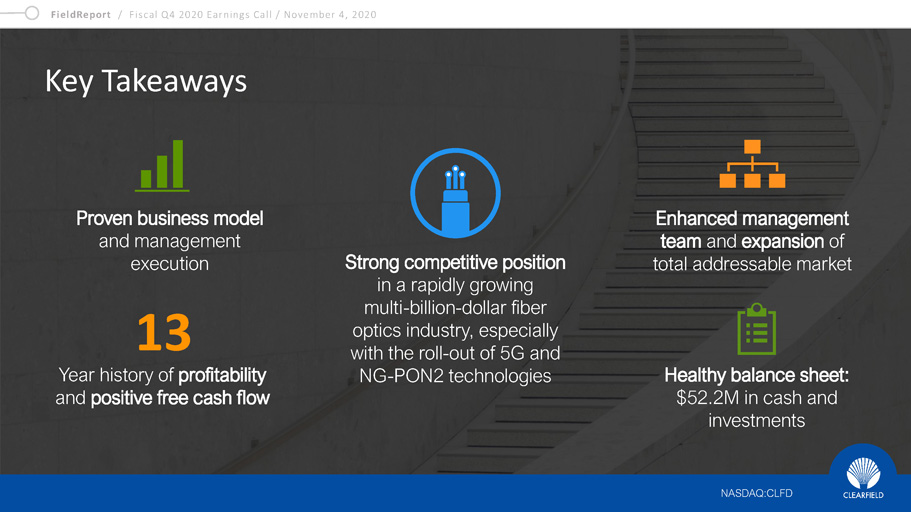
FieldReport / Fiscal Q4 2020 Earnings Call / November 4, 2020 NASDAQ:CLFD Key Takeaways Proven business model and management execution Enhanced management team and expansion of total addressable market Strong competitive position in a rapidly growing multi - billion - dollar fiber optics industry, especially with the roll - out of 5G and NG - PON2 technologies Healthy balance sheet: $52.2M in cash and investments Year history of profitability and positive free cash flow 13 NASDAQ:CLFD

FieldReport / Fiscal Q4 2020 Earnings Call / November 4, 2020 NASDAQ:CLFD Q&A Cheri Beranek PRESIDENT & CEO NASDAQ:CLFD 23 Dan Herzog CHIEF FINANCIAL OFFICER

FieldReport / Fiscal Q4 2020 Earnings Call / November 4, 2020 NASDAQ:CLFD

FieldReport / Fiscal Q4 2020 Earnings Call / November 4, 2020 NASDAQ:CLFD Contact Us NASDAQ:CLFD 25 COMPANY CONTACT: Cheri Beranek President & CEO Clearfield, Inc. [email protected] INVESTOR RELATIONS: Matt Glover and Tom Colton Gateway Investor Relations (949) 574 - 3860 [email protected]