
ccc-20201029
0001764046false00017640462020-10-292020-10-29

UNITED STATES
SECURITIES AND EXCHANGE COMMISSION
Washington, D.C. 20549
FORM 8-K
CURRENT REPORT
Pursuant to Section 13 OR 15(d) of The Securities Exchange Act of 1934

October 29, 2020
Date of Report (date of earliest event reported)

CLARIVATE PLC
(Exact name of registrant as specified in its charter)
Jersey, Channel Islands
(State or other jurisdiction of incorporation or organization)
001-38911
(Commission File Number)
N/A
(I.R.S. Employer Identification No.)
Friars House
160 Blackfriars Road
London
SE1 8EZ
United Kingdom
(Address of Principal Executive Offices)
(44) 207-433-4000
Registrant's telephone number, including area code

Check the appropriate box below if the Form 8-K filing is intended to simultaneously satisfy the filing obligation of the registrant under any of the following provisions (see General Instruction A.2. below):

Written communications pursuant to Rule 425 under the Securities Act (17 CFR 230.425)
Soliciting material pursuant to Rule 14a-12 under the Exchange Act (17 CFR 240.14a-12)
Pre-commencement communications pursuant to Rule 14d-2(b) under the Exchange Act (17 CFR 240.14d-2(b))
Pre-commencement communications pursuant to Rule 13e-4(c) under the Exchange Act (17 CFR 240.13e-4(c))

Securities registered pursuant to Section 12(b) of the Act:
Title of each classTrading Symbol(s)Name of each exchange on which registered
Ordinary sharesCCCNew York Stock Exchange

Indicate by check mark whether the registrant is an emerging growth company as defined in Rule 405 of the Securities Act of 1933 (§230.405 of this chapter) or Rule 12b-2 of the Securities Exchange Act of 1934 (§240.12b-2 of this chapter).
Emerging growth company

If an emerging growth company, indicate by check mark if the registrant has elected not to use the extended transition period for complying with any new or revised financial accounting standards provided pursuant to Section 13(a) of the Exchange Act.


Item 2.02.  Results of Operations and Financial Condition.

On October 29, 2020, Clarivate Plc (the “Company”) issued a press release announcing earnings for the third quarter ended September 30, 2020. In addition, the Company posted to its website supplemental information related to revenue, earnings and guidance. The press release and supplemental information have been furnished with this Form 8-K as exhibits and are posted on the investor relations section of the Company’s website (http://ir.clarivate.com/).

The information in this Item 2.02, including Exhibit 99.1 and Exhibit 99.2 furnished herewith, is being furnished and shall not be deemed “filed” for the purposes of Section 18 of the Securities Exchange Act of 1934, as amended (the “Exchange Act”), or otherwise subject to the liabilities of that Section and shall not be incorporated by reference into any filing pursuant to the Securities Act of 1933, as amended, or the Exchange Act, except as otherwise expressly stated in such filing.
Item 9.01.    Financial Statements and Exhibits
(d) Exhibits.
No.Description
99.1
99.2
104The cover page from the Company's Current Report on Form 8-K dated October 29, 2020, formatted in Inline XBRL


SIGNATURE
 
Pursuant to the requirements of the Securities Exchange Act of 1934, the registrant has duly caused this report to be signed on its behalf by the undersigned, thereunto duly authorized.
 
 CLARIVATE ANALYTICS PLC
 
Date: October 29, 2020By: /s/ Richard Hanks
 Name: Richard Hanks
 Chief Financial Officer


Clarivate Reports Third Quarter 2020 Results
— Provides Updated 2020 Outlook —
London, UK -- October 29, 2020 - Clarivate Plc (NYSE: CCC) (the “Company” or “Clarivate”), a global leader in providing trusted information and insights to accelerate the pace of innovation, today reported results for the third quarter ended September 30, 2020.
Third Quarter 2020 Financial Highlights
Revenues of $284.4 million increased 17.0% on a reported basis and up 15.2% at constant currency(1)
Adjusted revenues(1) of $286.5 million increased 17.9% on a reported basis and excluding divested businesses increased 21.6% at constant currency(1)
Net loss of $37.2 million or $(0.10) per diluted share and adjusted net income(1) of $58.5 million or $0.14 per diluted share
Adjusted EBITDA(1) of $108.2 million increased 40.5%
Total cash and cash equivalents of $601.1 million increased $524.9 million
Selected Financial Information
The results for the three and nine months ended September 30, 2020 includes contribution from the acquisition of Decision Resources Group ("DRG"), which was completed at the end of February 2020, and Darts-ip, which was completed in November 2019, for which there were no comparable amounts in the prior year period. The current year periods exclude the results of the MarkMonitor Brand Protection, Antipiracy, and Antifraud products, which were divested on January 1, 2020.
 Three Months Ended September 30,ChangeNine Months Ended September 30,Change
(in millions, except percentages and per share data)
20202019 $%20202019$%
Revenues, net284.4 243.0 41.4 17.0 %798.5 719.3 79.2 11.0 %
Adjusted revenues, net(1)
286.5 243.1 43.4 17.9 %805.9 719.7 86.2 12.0 %
Annual Contract Value (ACV)860.9  788.7 72.2 9.2 %860.9 788.7 72.2 9.2 %
Net income (loss)(37.2)10.8 (48.0)(444.4)%(112.7)(126.2)13.5 10.7 %
Net income (loss) per share
(0.10)0.04 (0.14)(350.0)%(0.31)(0.48)0.17 35.4 %
Weighted-average shares outstanding (diluted)387.8 328.9 — 17.9 %369.0 262.9 — 40.4 %
Adjusted EBITDA(1)

108.2 77.0 31.2 40.5 %286.6 209.5 77.1 36.8 %
Adjusted net income(1)
58.5 47.5 11.0 23.2 %153.5 100.6 52.9 52.6 %
Adjusted diluted EPS(1)
0.14 0.14 — — %0.39 0.37 0.02 5.4 %
Weighted average ordinary shares (diluted)(2)
407.6 328.9 — 23.9 %390.5 274.4 — 42.3 %
Net cash provided by operating activitiesN/AN/A— — %128.0 112.5 15.5 13.8 %
Free cash flow(1)
N/AN/A— — %49.4 68.8 (19.4)28.2 %
Adjusted free cash flow(1)
N/AN/A— — %128.5 66.9 61.6 92.1 %
(Amounts in tables may not sum due to rounding)
(1)Non-GAAP measure. Please see “Reconciliation to Certain Non-GAAP measures” in this earnings release for important disclosures and reconciliations of these financial measures to the most directly comparable GAAP measure. These terms are defined elsewhere in this earnings press release.
(2)Calculated assuming a net income position compared to a net loss position on the statement of operations for calculating Adjusted net income and Adjusted diluted EPS.
“I am pleased with our improved third quarter results including organic subscription revenue growth as demand for our products remains strong," said Jerre Stead, Executive Chairman and CEO of Clarivate. "With the


acquisition of CPA Global now completed, we have swiftly shifted to integration activities and will begin to realize the many strategic and financial benefits of this transaction. My colleagues have done an exceptional job working through the current global pandemic and we look forward to updating you at our upcoming Virtual Investor Day on November 10th."

Third Quarter 2020 Operating Results
Revenues, net, for the third quarter of 2020 increased $41.4 million, or 17.0%, to $284.4 million, compared to the prior-year period. Adjusted revenues, net, which excludes the impact of deferred revenues resulting from purchase accounting adjustments primarily related to acquisitions, increased $43.4 million or 17.9%, to $286.5 million, compared to the third quarter of 2019.
Subscription revenues for the third quarter of 2020 increased $21.3 million, or 10.6%, to $222.1 million, compared to the prior-year period, primarily driven by the acquisitions of Darts-ip and DRG in February 2020, partially offset by the MarkMonitor divested products. Excluding the impact of acquisitions and divestitures, organic subscription revenues increased $7.1 million, or 3.5% on a constant currency basis, compared to the third quarter of 2019, primarily due to new business and price increases.
Transactional revenues for the third quarter of 2020 increased $22.1 million, or 52.4%, to $64.4 million, compared to the prior-year period, primarily driven by acquisitions. Excluding the impact of acquisitions and divestitures, organic transactional revenues decreased $6.8 million, or 16.2% on a constant currency basis, compared to the third quarter of 2019, due to an overall decrease in demand primarily driven by economic conditions resulting from the COVID-19 pandemic.
Net loss for the third quarter of 2020 was $37.2 million, or ($0.10) per share, compared to Net Income of $10.8 million, or $0.04 per share, in the prior-year period. The year-over-year decline is primarily due to higher amortization and transaction related expenses as a result of acquisitions in the current year period. Additionally, the third quarter of 2019 included proceeds of $39.4 million from a legal settlement, for which there was no comparable amount in the current year period.
Adjusted EBITDA for the third quarter of 2020 increased by 40.5% to $108.2 million, compared to the prior-year period, driven by higher revenues and ongoing cost savings initiatives.
Adjusted net income for the third quarter of 2020 increased by 23.2% to $58.5 million, compared to the prior year period, driven by higher revenues and ongoing cost savings initiatives. Adjusted diluted earnings per share was $0.14 for the third quarter of 2020, compared to $0.14 in the prior-year period. The third quarter of 2020 diluted earnings per share was negatively impacted by an increase of 78.7 million or 23.9%, in the diluted weighted average ordinary shares outstanding, primarily due to the issuance of ordinary shares in conjunction with the acquisition of DRG and the exercise of public warrants during the first quarter of 2020.
Balance Sheet and Cash Flow
At September 30, 2020 cash and cash equivalents of $601.1 million increased $524.9 million, compared to December 31, 2019. The increase was primarily due to proceeds of $304.0 million from the sale of ordinary shares of Clarivate in June 2020 and $277.5 million received from the voluntary exercise of 24.1 million warrants in exchange for ordinary shares of Clarivate during the first quarter of 2020, as well as contributions from operational cash flows.
The Company's total debt outstanding at September 30, 2020 was $1,950.6 million, an increase of $285.6 million compared to December 31, 2019 due to a term loan of $360.0 million incurred during the first quarter of 2020 with net proceeds used to fund a portion of the DRG acquisition, offset by a $65.0 million repayment of the revolver in full. Net debt, or debt minus unrestricted cash and cash equivalents, at September 30, 2020 was $1,349.5 million, compared to $1,588.9 million as of December 31, 2019.
2


Net cash provided by operating activities was $128.0 million for the nine months ended September 30, 2020, compared to net cash provided by operating activities of $112.5 million for the prior year period. Adjusted free cash flow for the nine months ended September 30, 2020 was $128.5 million, an increase of $61.6 million, compared to the prior year period, as a result of growth in revenues and operational efficiencies, partially offset by higher capital expenditures resulting from an acceleration of product development and the addition of DRG. Additionally, the third quarter of 2019 included the adjustment for proceeds of $45.3 million from a legal settlement, for which there was no comparable amount in the current year period.

Updated Outlook for 2020 (forward-looking statement)
The full year 2020 outlook presented below includes the fourth quarter of 2020 outlook for the acquisition of CPA Global, which was completed on October 1, 2020, and assumes no further currency movements, acquisitions, divestitures, or unanticipated events. Clarivate will provide its full year 2021 outlook reflecting the acquisition of CPA Global at its Investor Day, which will be held on November 10, 2020.

The below outlook includes Non-GAAP measures. Please see "Reconciliation to Certain Non-GAAP measures" presented below for important disclosure and reconciliations of these financial measures to the most directly comparable GAAP measure. These terms are defined elsewhere in this earnings press release.
2020 outlook including fourth quarter of CPA Global
Adjusted Revenues$1.28B to $1.295B
Adjusted EBITDA$480M to $495M
Adjusted EBITDA margin37% to 38%
Adjusted diluted EPS$0.55 to $0.61
Adjusted Free Cash Flow$240M to $260M

Adjusted diluted EPS for 2020 is calculated based on approximately 453.3 million fully diluted weighted average shares outstanding. In connection with the closing of the CPA Global transaction, former CPA Global shareholders received approximately 218 million Clarivate ordinary shares on October 1. The 453.3 million fully diluted weighted average shares outstanding includes the fourth quarter weighted average of the approximately 218 million shares issued in the full year share calculation.

Conference Call and Webcast
Clarivate will host a conference call and webcast today to review the results for the second quarter at 8:00 a.m. Eastern Time. The conference call will be simultaneously webcast on the Investor Relations section of the company’s website.
Interested parties may access the live audio broadcast by dialing 1-888-317-6003 in the United States, 1-412-317-6061 for international, and 1-866-284-3684 in Canada. The conference ID number is 9584356. An audio replay will be available approximately two hours after the completion of the call at 1-877-344-7529 in the United States, 1-412-317-0088 for international, and 1-855-669-9658 in Canada. The Replay Conference ID number is 10139889. The recording will be available for replay through November 10, 2020. The webcast can be accessed at https://services.choruscall.com/links/ccc201105.html and will be available for replay.

Investor Day Conference on November 10, 2020
3


Clarivate will host a Virtual Investor Day Conference on Tuesday, November 10, 2020. Management will provide an update on the business, with presentations starting at 10:00 AM Eastern Time and concluding at approximately 1:00 PM Eastern Time.
All are invited to listen to the event and view the presentation via webcast on the Clarivate Investor Relations website at http://ir.clarivate.com/. To join the webcast please visit http://bit.ly/ClarivateInvestorDay2020. A replay will also be available as a webcast on the investor relations section of the Company’s website.

Use of Non-GAAP Financial Measures
Non-GAAP results are not presentations made in accordance with U.S. generally accepted accounting principles ("GAAP") and are presented only as a supplement to our financial statements based on GAAP. Non-GAAP financial information is provided to enhance the reader’s understanding of our financial performance, but none of these non-GAAP financial measures are recognized terms under GAAP. They are not measures of financial condition or liquidity, and should not be considered as an alternative to profit or loss for the period determined in accordance with GAAP or operating cash flows determined in accordance with GAAP. As a result, you should not consider such measures in isolation from, or as a substitute for, financial measures or results of operations calculated or determined in accordance with GAAP.
We use non-GAAP measures in our operational and financial decision-making. We believe that such measures allow us to focus on what we deem to be a more reliable indicator of ongoing operating performance and our ability to generate cash flow from operations and we also believe that investors may find these non-GAAP financial measures useful for the same reasons. Non-GAAP measures are frequently used by securities analysts, investors, and other interested parties in their evaluation of companies comparable to us, many of which present non-GAAP measures when reporting their results. These measures can be useful in evaluating our performance against our peer companies because we believe the measures provide users with valuable insight into key components of GAAP financial disclosures. However, non-GAAP measures have limitations as analytical tools and because not all companies use identical calculations, our presentation of non-GAAP financial measures may not be comparable to other similarly titled measures of other companies.
Definitions and reconciliations of non-GAAP measures, such as Adjusted Revenues, EBITDA, Adjusted EBITDA, Adjusted Net Income, Adjusted Diluted EPS, Free Cash Flow, Adjusted Free Cash Flow, and Standalone Adjusted EBITDA and net debt to the most directly comparable GAAP measures are provided within the schedules attached to this release. Our presentation of non-GAAP measures should not be construed as an inference that our future results will be unaffected by any of the adjusted items, or that any projections and estimates will be realized in their entirety or at all.

Forward-Looking Statements
This communication contains “forward-looking statements” as defined in the Private Securities Litigation Reform Act of 1995. These statements, which express management’s current views concerning future business, events, trends, contingencies, financial performance, or financial condition, appear at various places in this communication and may use words like “aim,” “anticipate,” “assume,” “believe,” “continue,” “could,” “estimate,” “expect,” “forecast,” “future,” “goal,” “intend,” “likely,” “may,” “might,” “plan,” “potential,” “predict,” “project,” “see,” “seek,” “should,” “strategy,” “strive,” “target,” “will,” and “would” and similar expressions, and variations or negatives of these words. Examples of forward-looking statements include, among others, statements we make regarding: guidance outlook and predictions relating to expected operating results, such as revenue growth and earnings; strategic actions such as acquisitions, joint ventures, and dispositions, including our acquisition of CPA Global, the anticipated benefits therefrom, and our success in integrating acquired businesses; anticipated levels of capital expenditures in future periods; our ability to successfully realize cost savings initiatives and transition services expenses; our belief that we have sufficiently
4


liquidity to fund our ongoing business operations; expectations of the effect on our financial condition of claims, litigation, environmental costs, the COVID-19 pandemic and governmental responses thereto, contingent liabilities, and governmental and regulatory investigations and proceedings; and our strategy for customer retention, growth, product development, market position, financial results, and reserves. Forward-looking statements are neither historical facts nor assurances of future performance. Instead, they are based only on management’s current beliefs, expectations, and assumptions regarding the future of our business, future plans and strategies, projections, anticipated events and trends, the economy, and other future conditions. Because forward-looking statements relate to the future, they are difficult to predict and many of which are outside of our control. Important factors that could cause our actual results and financial condition to differ materially from those indicated in the forward-looking statements are more fully discussed under the caption “Risk Factors” in our 2019 Annual Report on Form 10-K, in Part II, Item 1A of our quarterly reports on Form 10-Q for the periods ended March 31, 2020 and June 30, 2020, and in our current report on Form 8-K filed on June 19, 2020, along with our other filings with the U.S. Securities and Exchange Commission (“SEC”). However, those factors should not be considered to be a complete statement of all potential risks and uncertainties. Additional risks and uncertainties not known to us or that we currently deem immaterial may also impair our business operations. Forward-looking statements are based only on information currently available to our management and speak only as of the date of this communication. We do not assume any obligation to publicly provide revisions or updates to any forward-looking statements, whether as a result of new information, future developments or otherwise, should circumstances change, except as otherwise required by securities and other applicable laws. Please consult our public filings with the SEC or on our website at www.clarivate.com.

About Clarivate
Clarivate™ is a global leader in providing solutions to accelerate the lifecycle of innovation. Our bold mission is to help customers solve some of the world’s most complex problems by providing actionable information and insights that reduce the time from new ideas to life-changing inventions. Covering scientific and academic research, pharmaceutical, biotech and healthcare intelligence and intellectual property services, we help customers discover, protect and commercialize their inventions using our trusted subscription and technology-based solutions coupled with deep domain expertise. For more information, please visit clarivate.com.

5


Condensed Consolidated Balance Sheets (unaudited)
(in thousands)
September 30,
2020
December 31,
2019
Assets
Current assets:
Cash and cash equivalents $601,075 $76,130 
Restricted cash 567 
Accounts receivable, net of allowance for doubtful accounts of $9,744 and $16,511 at September 30, 2020 and December 31, 2019, respectively238,638 333,858 
Prepaid expenses49,240 40,710 
Other current assets 18,672 11,750 
Assets held for sale36,059 30,619 
Total current assets
944,251 493,076 
Computer hardware and other property, net 23,618 18,042 
Other intangible assets, net 2,217,227 1,828,640 
Goodwill 1,818,354 1,328,045 
Other non-current assets 21,836 18,632 
Deferred income taxes 25,520 19,488 
Operating lease right-of-use assets99,908 85,448 
Total Assets$5,150,714 $3,791,371 
Liabilities and Shareholders’ Equity
Current liabilities:
Accounts payable $19,898 $26,458 
Accrued expenses and other current liabilities 253,341 159,217 
Current portion of deferred revenues 326,098 407,325 
Current portion of operating lease liabilities25,691 22,130 
Current portion of long-term debt 12,600 9,000 
Liabilities held for sale25,048 26,868 
Total current liabilities
662,676 650,998 
Long-term debt 1,910,993 1,628,611 
Non-current portion of deferred revenues 24,080 19,723 
Other non-current liabilities 19,990 18,891 
Deferred income taxes 95,527 48,547 
Operating lease liabilities79,147 64,189 
Total liabilities
2,792,413 2,430,959 
Commitments and Contingencies
Shareholders’ equity:
Ordinary Shares, no par value; unlimited shares authorized at September 30, 2020 and December 31, 2019; 389,220,967 and 306,874,115 shares issued and outstanding at September 30, 2020 and December 31, 2019, respectively3,328,776 2,208,529 
Accumulated other comprehensive loss(5,193)(4,879)
Accumulated deficit (965,282)(843,238)
Total shareholders’ equity2,358,301 1,360,412 
Total Liabilities and Shareholders’ Equity$5,150,714 $3,791,371 

6


Condensed Consolidated Statement of Operations (unaudited)
(in thousands, except share and per share data)
Three Months Ended September 30,
20202019
Revenues, net $284,360 $242,998 
Operating costs and expenses:
Cost of revenues, excluding depreciation and amortization(91,805)(87,117)
Selling, general and administrative costs, excluding depreciation and amortization(91,319)(96,017)
Share-based compensation expense (6,796)(9,567)
Depreciation (2,918)(2,281)
Amortization (65,696)(41,656)
Transaction expenses(34,938)(8,645)
Transition, integration and other related expenses (222)(3,327)
Restructuring and impairment(3,192)— 
Legal settlement— 39,399 
Other operating income (expense), net(138)2,057 
Total operating expenses(297,024)(207,154)
Income (loss) from operations(12,664)35,844 
Interest expense (20,244)(23,369)
Income (loss) before income tax(32,908)12,475 
Provision for income taxes(4,325)(1,644)
Net income (loss)$(37,233)$10,831 
Per Share
Basic$(0.10)$0.04 
Diluted$(0.10)$0.03 
Weighted-average shares outstanding
Basic387,845,438 305,428,062 
Diluted387,845,438 328,854,063 


7


Condensed Consolidated Statement of Operations (unaudited)
(in thousands, except share and per share data)
Nine Months Ended September 30,
20202019
Revenues, net $798,452 $719,332 
Operating costs and expenses:
Cost of revenues, excluding depreciation and amortization(265,063)(264,013)
Selling, general and administrative costs, excluding depreciation and amortization(266,749)(280,766)
Share-based compensation expense (31,121)(46,675)
Depreciation (8,151)(6,463)
Amortization (168,049)(138,694)
Transaction expenses(70,154)(42,073)
Transition, integration and other related expenses (3,774)(9,750)
Restructuring and impairment(26,792)— 
Legal settlement— 39,399 
Other operating income, net14,675 3,047 
Total operating expenses(825,178)(745,988)
Loss from operations(26,726)(26,656)
Interest expense (72,306)(93,938)
Loss before income tax(99,032)(120,594)
Provision for income taxes(13,693)(5,596)
Net loss$(112,725)$(126,190)
Per Share:
Basic and diluted$(0.31)$(0.48)
Weighted-average shares outstanding
Basic and diluted369,019,802 262,894,388 

8


Consolidated Statements of Cash Flows (unaudited)
(in thousands)
Nine Months Ended September 30,
20202019
CASH FLOWS FROM OPERATING ACTIVITIES
Net loss$(112,725)$(126,190)
Adjustments to reconcile net loss to net cash provided by operating activities:
Depreciation and amortization176,200 145,157 
Allowance for doubtful accounts and credit losses expense1,830 1,869 
Gain on disposal of business(1,052)— 
Deferred income tax benefit(7,420)(8,222)
Share-based compensation 26,344 46,675 
Restructuring and impairment 4,880 — 
Gain on foreign currency forward contracts(2,903)— 
Mark to market loss on DRG contingent shares30,839 — 
Deferred finance charges3,140 14,678 
Other operating activities (3,902)(1,708)
Changes in operating assets and liabilities:
Accounts receivable 129,398 99,470 
Prepaid expenses (13,335)(3,010)
Other assets 62,818 7,977 
Accounts payable (8,394)(9,662)
Accrued expenses and other current liabilities (65,062)3,388 
Deferred revenue (93,926)(51,100)
Operating lease right of use assets5,826 9,438 
Operating lease liabilities(6,611)(9,934)
Other liabilities 2,077 (6,338)
Net cash provided by operating activities128,022 112,488 
CASH FLOWS FROM INVESTING ACTIVITIES
Capital expenditures(78,597)(43,681)
Acquisitions, net of cash acquired(885,323)— 
Proceeds from sale of product line, net of restricted cash3,751 — 
Acquisition of intangible assets(5,982)(2,625)
Net cash used in investing activities(966,151)(46,306)
CASH FLOWS FROM FINANCING ACTIVITIES
Repayment of principal on long-term debt(9,450)(641,508)
Repayments of revolving credit facility(65,000)(50,000)
Proceeds from revolving credit facility— 5,000 
Proceeds from reverse recapitalization— 682,087 
Contingent purchase price payment(4,115)— 
Payment of debt issuance costs(5,267)— 
Proceeds from issuance of debt360,000 — 
Proceeds from issuance of ordinary shares843,752 — 
Proceeds from warrant exercises277,526 — 
Proceeds from stock options exercised1,307 278 
Payments related to tax withholding for stock-based compensation(28,674)— 
Net cash provided by (used in) financing activities1,370,079 (4,143)
Effect of exchange rate changes on cash and cash equivalents, and restricted cash(6,447)1,198 
Net increase in cash and cash equivalents, and restricted cash525,503 63,237 
9


Consolidated Statements of Cash Flows (unaudited)
(in thousands)
Beginning of period:
Cash and cash equivalents76,130 25,575 
Restricted cash
Total cash and cash equivalents, and restricted cash, beginning of period76,139 25,584 
Cash and cash equivalents, and restricted cash, end of period 601,642 88,821 
Cash and cash equivalents601,075 88,812 
Restricted cash567 
Total cash and cash equivalents, and restricted cash, end of period$601,642 $88,821 
SUPPLEMENTAL CASH FLOW INFORMATION
Cash paid for interest $61,796 $69,711 
Cash paid for income tax $20,147 $21,128 
Capital expenditures included in accounts payable$922 $9,759 
Tax receivable agreement included in liabilities$— $264,600 
Assets received as reverse recapitalization capital$— $1,877 
Liabilities assumed as reduction of reverse recapitalization capital$— $5,910 

Reconciliation to Certain Non-GAAP Measures
(Amounts in tables may not sum due to rounding)
Adjusted Revenues
Adjusted Revenues excludes the impact of the deferred revenues purchase accounting adjustment (primarily recorded in connection with recent acquisitions).
The following table presents our calculation of Adjusted Revenues for the three and nine months ended September 30, 2020 and 2019 and a reconciliation of this measure to our Revenues, net for the same periods:
 Three Months Ended September 30,Variance
(in millions, except percentages)20202019 $%
Revenues, net$284.4 $243.0  $41.4  17.0 %
Deferred revenues adjustment(1)
2.1  0.1  2.0  NM
Adjusted revenues, net$286.5  $243.1  $43.4  17.9 %
(1)Reflects the deferred revenues adjustment made as a result of purchase accounting.
Nine Months Ended September 30,Variance
(in millions, except percentages)20202019$%
Revenues, net$798.5 $719.3 $79.2 11.0 %
Deferred revenues adjustment(1)
7.4 0.4 7.0 NM
Adjusted revenues, net$805.9 $719.7 $86.2 12.0 %
(1)Reflects the deferred revenues adjustment made as a result of purchase accounting.


10


Adjusted EBITDA
Adjusted EBITDA is calculated using net (loss) income before provision for income taxes, depreciation and amortization and interest income and expense adjusted to exclude acquisition or disposal-related transaction costs (such costs include net income from continuing operations before provision for income taxes, depreciation and amortization and interest income), share-based compensation, unrealized foreign currency gains/(losses), transition services agreement costs entered into with Thomson Reuters in 2016 ("Transition Services Agreement"), separation and integration costs, transformational and restructuring expenses, acquisition-related adjustments to deferred revenues, non-cash income/(loss) on equity and cost method investments, non-operating income or expense, the impact of certain non-cash and other items that are included in net income for the period that the Company does not consider indicative of its ongoing operating performance, and certain unusual items impacting results in a particular period.
The following table presents our calculation of Adjusted EBITDA for the three and nine months ended September 30, 2020 and 2019 and reconciles these measures to our Net loss for the same periods:

 Three Months Ended September 30,Nine Months Ended September 30,
(in millions)2020 20192020 2019
Net income (loss)$(37.2) $10.8 $(112.7) $(126.2)
Provision for income taxes4.3  1.6 13.7  5.6 
Depreciation and amortization68.6  43.9 176.2  145.2 
Interest, net20.3  23.4 72.3  93.9 
Transition services agreement costs(1)
(0.1) 2.7 0.6  10.5 
Transition, transformation and integration expense(2)
0.2  11.5 3.8  25.3 
Deferred revenues adjustment(3)
2.1  0.1 7.4  0.4 
Transaction related costs(4)
34.9  8.6 70.2  42.1 
Share-based compensation expense6.8  9.6 31.1  46.7 
Restructuring(5)
3.2 — 26.8 — 
Legal settlement— (39.4)— (39.4)
Other (6)
5.1  4.2 (2.8) 5.5 
Adjusted EBITDA$108.2 $77.0 $286.6 $209.6 
Adjusted EBITDA Margin37.8 %31.7 %35.6 %29.1 %

(1)In 2020, this is related to a new transition services agreement and offset by the reverse transition services agreement from the sale of MarkMonitor assets. In 2019, this includes payments to Thomson Reuters under the Transition Services Agreement.
(2)Includes costs incurred in connection with and after our separation from Thomson Reuters in 2016 relating to the implementation of our standalone company infrastructure and related cost-savings initiatives. These costs include mainly transition consulting, technology infrastructure, personnel and severance expenses relating to our standalone company infrastructure, which are recorded in Transition, integration, and other related expenses line-item of our income statement, as well as expenses related to the restructuring and transformation of our business following our separation from Thomson Reuters in 2016, mainly related to the integration of separate business units into one functional organization and enhancements in our technology.
(3)Reflects the deferred revenues adjustment as a result of purchase accounting.
(4)Includes costs incurred to complete business combination transactions, including acquisitions, dispositions and capital market activities and include advisory, legal, and other professional and consulting costs.
(5)Reflects costs incurred in connection with the initiative, following our merger with Churchill Capital Corp in 2019, to streamline our operations by simplifying our organization and focusing on two product groups. This also includes restructuring related costs following the acquisition of DRG in 2020.
(6)Includes primarily the net impact of foreign exchange gains and losses related to the re-measurement of balances and other items that do not reflect our ongoing operating performance.
11


Adjusted Net Income and Adjusted Diluted EPS
Adjusted Net Income is calculated using net income (loss), adjusted to exclude acquisition or disposal-related transaction costs (such costs include net income from continuing operations before provision for income taxes, depreciation and amortization and interest income and expense from the divested business), amortization related to acquired intangible assets, share-based compensation, unrealized foreign currency gains/(losses), Transition Services Agreement costs, separation and integration costs, transformational and restructuring expenses, acquisition-related adjustments to deferred revenues, debt extinguishment costs and refinancing related costs, non-cash income (loss) on equity and cost method investments, non-operating income or expense, the impact of certain non-cash and other items that are included in net income for the period that the Company does not consider indicative of its ongoing operating performance, certain unusual items impacting results in a particular period, and the income tax impact of any adjustments. We calculate Adjusted Diluted EPS by using Adjusted Net Income divided by diluted weighted average shares for the period.
The following table presents our calculation of Adjusted Net Income and Adjusted Diluted EPS for the three and nine months ended September 30, 2020 and reconciles these measures to our Net loss and EPS for the same periods:
Three Months Ended September 30,Three Months Ended September 30,

20202019
(in millions, except per share amounts)AmountPer ShareAmountPer Share
Net income (loss)$(37.2)$(0.10)$10.8 $0.04 
Dilutive impact of potential common shares — 0.01 — (0.01)
Net income (loss)(37.2)(0.09)10.8 0.03 
Transition services agreement costs(1)
(0.1)— 2.7 0.01 
Transition, transformation and integration expense(2)
0.2 — 11.5 0.03 
Deferred revenues adjustment(3)
2.1 0.01 0.1 — 
Transaction related costs(4)
34.9 0.08 8.6 0.03 
Share-based compensation expense6.8 0.01 9.6 0.03 
Legal settlement— — (39.4)(0.12)
Amortization related to acquired intangible assets49.0 0.12 37.4 0.11 
Restructuring(5)
3.2 0.01 — — 
Debt extinguishment costs and refinancing related costs— — — — 
Other(6)
5.1 0.01 4.2 0.01 
Income tax impact of related adjustments(5.5)(0.01)2.0 0.01 
Adjusted net income and Adjusted Diluted EPS
$58.5 $0.14 $47.5 $0.14 
Weighted average ordinary shares (Diluted)407,577,327328,854,063

12


Nine Months Ended September 30,Nine Months Ended September 30,

20202019
(in millions, except per share amounts)AmountPer ShareAmountPer Share
Net loss$(112.7)(0.31)(126.2)$(0.48)
Dilutive impact of potential common shares — 0.02 — 0.02 
Net loss(112.7)(0.29)(126.2)(0.46)
Transition services agreement costs(1)
0.6 — 10.5 0.04 
Transition, transformation and integration expense(2)
3.8 0.01 25.3 0.09 
Deferred revenues adjustment(3)
7.4 0.02 0.4 — 
Transaction related costs(4)
70.2 0.18 42.1 0.15 
Share-based compensation expense31.1 0.08 46.7 0.17 
Legal settlement— — (39.4)(0.14)
Amortization related to acquired intangible assets136.7 0.35 128.4 0.47 
Restructuring(5)
26.8 0.07 — — 
Debt extinguishment costs and refinancing related costs8.6 0.02 — — 
Other(6)
(2.8)(0.01)5.5 0.02 
Income tax impact of related adjustments(16.2)(0.04)7.3 0.03 
Adjusted net income and Adjusted Diluted EPS
$153.5 $0.39 100.6 $0.37 
Weighted average ordinary shares (Diluted)390,533,995274,448,829

(1)In 2020, this is related to a new transition services agreement and offset by the reverse transition services agreement from the sale of MarkMonitor assets. In 2019, this includes payments to Thomson Reuters under the Transition Services Agreement.
(2)Includes cash payments in connection with and after our separation from Thomson Reuters in 2016 relating to the implementation of our standalone company infrastructure and related cost-savings initiatives. These cash payments include mainly transition consulting, technology infrastructure, personnel and severance expenses relating to our standalone company infrastructure, which are recorded in Transition, integration, and other related expenses line-item of our income statement, as well as cash payments related to the restructuring and transformation of our business following our separation from Thomson Reuters in 2016 mainly related to the integration of separate business units into one functional organization and enhancements in our technology. This also includes cash payments following our merger with Churchill Capital Corp in 2019, to streamline our operations by simplifying our organization and focusing on two product groups.
(3)Reflects the deferred revenues adjustment as a result of purchase accounting.
(4)Includes costs incurred to complete business combination transactions, including acquisitions, dispositions and capital market activities and include advisory, legal, and other professional and consulting costs.
(5)Reflects costs incurred in connection with the initiative, following our merger with Churchill Capital Corp in 2019, to streamline our operations by simplifying our organization and focusing on two product groups. This also includes restructuring related costs following the acquisition of DRG in 2020.
(6)Includes primarily the net impact of foreign exchange gains and losses related to the re-measurement of balances and other items that do not reflect our ongoing operating performance.
Free Cash Flow and Adjusted Free Cash Flow
Free cash flow is calculated using net cash provided by operating activities less capital expenditures. Adjusted free cash flow is calculated as free cash flow, less cash paid for transition services agreement, transition, transformation and integration expenses, transaction related costs and debt issuance costs offset by cash received for hedge accounting transactions. The following table reconciles our non-GAAP free cash flow measure to net cash provided by operating activities:
13


Nine Months Ended September 30,
(in millions)20202019
Net cash provided by operating activities$128.0 $112.5 
Capital expenditures
(78.6)(43.7)
Free cash flow
49.4 
 
68.8 
Cash paid for transition services agreement(1)
(2.2)6.9
Cash paid for transition, transformation and integration expense(2)
35.9 24.4
Cash paid for transaction related costs(3)
39.4 12.1
Cash paid for debt issuance costs
7.7 0
Cash received for hedge accounting transactions
(1.7)0
Cash received for legal settlement— (45.3)
Adjusted free cash flow
$128.5 $66.9 

(1)Includes cash payments to Thomson Reuters under the Transition Services Agreement. These costs decreased substantially in 2019, as we were in the final stages of implementing our standalone company infrastructure. In 2019, the Transition Services Agreement cash paid is offset by cash receipts from the IPM Product Line divestiture.
(2)Includes cash payments in connection with and after our separation from Thomson Reuters in 2016 relating to the implementation of our standalone company infrastructure and related cost-savings initiatives. These cash payments include mainly transition consulting, technology infrastructure, personnel and severance expenses relating to our standalone company infrastructure, which are recorded in Transition, integration, and other related expenses line-item of our income statement, as well as cash payments related to the restructuring and transformation of our business following our separation from Thomson Reuters in 2016 mainly related to the integration of separate business units into one functional organization and enhancements in our technology. This also includes cash payments following our merger with Churchill Capital Corp in 2019, to streamline our operations by simplifying our organization and focusing on two product groups.
(3)Includes costs incurred to complete business combination transactions, including acquisitions, dispositions and capital market activities and include advisory, legal, and other professional and consulting costs.
Required Reported Data
Standalone Adjusted EBITDA
We are required to report Standalone Adjusted EBITDA, which is identical to Consolidated EBITDA and EBITDA as such terms are defined under our credit facilities, dated as of October 31, 2019 and the indenture governing our secured notes due 2026 issued by Camelot Finance S.A. and guaranteed by certain of our subsidiaries, respectively. In addition, the credit facilities and the indenture contain certain restrictive covenants that govern debt incurrence and the making of restricted payments, among other matters. These restrictive covenants utilize Standalone Adjusted EBITDA as a primary component of the compliance metric governing our ability to undertake certain actions otherwise proscribed by such covenants. Standalone Adjusted EBITDA reflects further adjustments to Adjusted EBITDA for cost savings already implemented and excess standalone costs.
Because Standalone Adjusted EBITDA is required pursuant to the terms of the reporting covenants under the credit facilities and the indenture and because this metric is relevant to lenders and noteholders, management considers Standalone Adjusted EBITDA to be relevant to the operation of its business. It is also utilized by management and the compensation committee of the Board as an input for determining incentive payments to employees.
Excess standalone costs are the difference between our actual standalone company infrastructure costs, and our estimated steady state standalone infrastructure costs. We make an adjustment for the difference because we have had to incur costs under the transition services agreement, with Thomson Reuters after we had implemented the infrastructure to replace the services provided pursuant to the transition services agreement, thereby incurring dual running costs. Furthermore, there has been a ramp up period for establishing and
14


optimizing the necessary standalone infrastructure. Since our separation from Thomson Reuters, we have had to transition quickly to replace services provided under the transition services agreement, with optimization of the relevant standalone functions typically following thereafter. Cost savings reflect the annualized “run rate” expected cost savings, net of actual cost savings realized, related to restructuring and other cost savings initiatives undertaken during the relevant period.
Standalone Adjusted EBITDA is calculated under the credit facilities and the indenture by using our Consolidated Net Loss for the trailing 12-month period (defined in the credit facilities and the indenture as our U.S. GAAP net income adjusted for certain items specified in the credit facilities and the indenture) adjusted for items including: taxes, interest expense, depreciation and amortization, non-cash charges, expenses related to capital markets transactions, acquisitions and dispositions, restructuring and business optimization charges and expenses, consulting and advisory fees, run-rate cost savings to be realized as a result of actions taken or to be taken in connection with an acquisition, disposition, restructuring or cost savings or similar initiatives, “run rate” expected cost savings, operating expense reductions, restructuring charges and expenses and synergies related to the transition projected by us, costs related to any management or equity stock plan, other adjustments that were presented in the offering memorandum used in connection with the issuance of the secured notes due 2026 and earnout obligations incurred in connection with an acquisition or investment.
The following table bridges Net Loss to Adjusted EBITDA to Standalone Adjusted EBITDA, as Adjusted EBITDA reflects all but three of the adjustments that comprise Standalone Adjusted EBITDA for the periods presented:
Twelve Months Ended September 30,
(in millions)2020
Net loss$(197.5)
(Benefit) provision for income taxes18.3 
Depreciation and amortization231.6 
Interest, net136.1 
Transition Services Agreement costs(1)
0.6 
Transition, transformation and integration expense(2)
2.9 
Deferred revenues adjustment(3)
7.5 
Transaction related costs(4)
74.3 
Share-based compensation expense35.8 
Restructuring(5)
42.5 
Legal settlement— 
Impairment on assets held for sale18.4 
Other(6)
0.6 
Adjusted EBITDA371.1 
Realized foreign exchange gain(5.7)
DRG Adjusted EBITDA Impact(7)
26.6 
Cost savings(8)
36.3 
Excess standalone costs(9)
30.0 
Standalone Adjusted EBITDA$458.3 
(1)In 2020, this is related to a new transition services agreement and offset by the reverse transition services agreement from the sale of MarkMonitor assets. In 2019, this includes payments to Thomson Reuters under the Transition Services Agreement.
(2)Includes cash payments in connection with and after our separation from Thomson Reuters in 2016 relating to the implementation of our standalone company infrastructure and related cost-savings initiatives. These cash payments include mainly transition consulting, technology infrastructure, personnel and severance expenses relating to our standalone company infrastructure, which
15


are recorded in Transition, integration, and other related expenses line-item of our income statement, as well as cash payments related to the restructuring and transformation of our business following our separation from Thomson Reuters in 2016 mainly related to the integration of separate business units into one functional organization and enhancements in our technology. This also includes cash payments following our merger with Churchill Capital Corp in 2019, to streamline our operations by simplifying our organization and focusing on two product groups.
(3)Reflects the deferred revenues adjustment as a result of purchase accounting.
(4)Includes costs incurred to complete business combination transactions, including acquisitions, dispositions and capital market activities and include advisory, legal, and other professional and consulting costs.
(5)Reflects costs incurred in connection with the initiative, following our merger with Churchill Capital Corp in 2019, to streamline our operations by simplifying our organization and focusing on two product groups. This also includes restructuring related costs following the acquisition of DRG in 2020.
(6)Includes primarily the net impact of foreign exchange gains and losses related to the re-measurement of balances and other items that do not reflect our ongoing operating performance.
(7)Represents DRG Adjusted EBITDA for the period beginning July 1, 2019 until the acquisition date of February 28, 2020 to reflect the company's Standalone EBITDA as though material acquisitions occurred at the beginning of the presented period
(8)Reflects the estimated annualized run-rate cost savings, net of actual cost savings realized, related to restructuring and other cost savings initiatives undertaken during the period (exclusive of any cost reductions in our estimated standalone operating costs), including synergies related to acquisitions.
(9)Reflects the difference between our actual standalone company infrastructure costs, and our estimated steady state standalone operating costs, which were as follows:
 
Twelve Months Ended September 30,
(in millions)2020
Actual standalone company infrastructure costs$164.9 
Steady state standalone cost estimate(134.9)
Excess standalone costs$30.0 
The foregoing adjustments (8) and (9) are estimates and are not intended to represent pro forma adjustments presented within the guidance of Article 11 of Regulation S-X. Although we believe these estimates are reasonable, actual results may differ from these estimates, and any difference may be material. See “Cautionary Note Regarding Forward-Looking Statements” in the annual report.
The following tables present the amounts of our subscription and transactional revenues, including as a percentage of our total revenues, for the periods indicated, as well the drivers of the variances between periods.
Variance Increase/(Decrease)
Percentage of Factors Increase/(Decrease)
Three Months Ended September 30,
Total Variance
(Dollars)
Total Variance
(Percentage)
Acquisitive
Disposal
FX Impact
Organic
(in millions, except percentages)20202019
Subscription revenues$222.1 $200.8 $21.3 10.6 %11.7 %(6.5)%1.9 %3.5 %
Transactional revenues64.4 42.3 22.1 52.4 %67.8 %(0.5)%1.3 %(16.2)%
Deferred revenues adjustment(1)
(2.1)(0.1)(2.0)NMNM— %— %61.0 %
Revenues, net$284.4 $243.0 $41.4 17.0 %20.6 %(5.5)%1.8 %0.2 %
Deferred revenues adjustment(1)
2.1 0.1 2.0 NMNM— %— %(61.0)%
Adjusted revenues, net$286.5 $243.1 $43.4 17.9 %21.5 %(5.5)%1.8 %0.1 %

(1)Reflects the deferred revenues adjustment made as a result of purchase accounting.
16


Variance Increase/(Decrease)
Percentage of Factors Increase/(Decrease)
Nine Months Ended September 30,
Total Variance
(Dollars)
Total Variance
(Percentage)
Acquisitive
Disposal
FX Impact
Organic
(in millions, except percentages)20202019
Subscription revenues$631.9 $596.1 $35.8 6.0 %9.5 %(6.9)%(0.1)%3.5 %
Transactional revenues174.0 123.6 50.4 40.7 %52.1 %(0.9)%(0.1)%(10.4)%
Deferred revenues adjustment(1)
(7.4)(0.4)(7.0)NMNM— %— %69.4 %
Revenues, net$798.5 $719.3 $79.2 11.0 %15.8 %(5.9)%(0.1)%1.2 %
Deferred revenues adjustment(1)
7.4 0.4 7.0 NMNM— %— %(69.4)%
Adjusted revenues, net$805.9 $719.7 $86.2 12.0 %16.8 %(5.9)%(0.1)%1.2 %

(1)Reflects the deferred revenues adjustment made as a result of purchase accounting.
The following tables, and the discussion that follows, presents our revenues by Product Group for the periods indicated, as well as the drivers of the variances between periods, including as a percentage of such revenues.
Variance Increase/(Decrease)
Percentage of Factors Increase/(Decrease)
Revenues by Product Group
Three Months Ended September 30,
Total Variance (Dollars)
Total Variance (Percentage)
Acquisitive
Disposal
FX Impact
Organic
(in millions, except percentages)
20202019
Science Product Group
$190.7 $136.1 $54.6 40.2 %36.4 %— %2.3 %1.5 %
IP Product Group
95.8 107.0 (11.2)(10.5)%2.5 %(12.4)%1.1 %(1.7)%
Deferred revenues adjustment (1)
(2.1)(0.1)(2.0)NMNM— %— %61.0 %
Revenues, net$284.4 $243.0 $41.4 17.0 %20.6 %(5.5)%1.8 %0.2 %
Deferred revenues adjustment(1)
2.1 0.1 2.0 NMNM— %— %(61.0)%
Adjusted revenues, net$286.5 $243.1 $43.4 17.9 %21.5 %(5.5)%1.8 %0.1 %
(1)Reflects the deferred revenues adjustment made as a result of purchase accounting.
Variance Increase/(Decrease)
Percentage of Factors Increase/(Decrease)
Revenues by Product Group
Nine Months Ended September 30,
Total Variance (Dollars)
Total Variance (Percentage)
Acquisitive
Disposal
FX Impact
Organic
(in millions, except percentages)
20202019
Science Product Group
$521.7 $401.4 $120.3 30.0 %28.2 %— %(0.1)%1.9 %
IP Product Group
284.2 318.3 (34.1)(10.7)%2.4 %(13.3)%— %— %
Deferred revenues adjustment (1)
(7.4)(0.4)(7.0)NMNM— %— %69.4 %
Revenues, net$798.5 $719.3 $79.2 11.0 %15.8 %(5.9)%(0.1)%1.2 %
Deferred revenues adjustment(1)
7.4 0.4 7.0 NMNM— %— %(69.4)%
Adjusted revenues, net$805.9 $719.7 $86.2 12.0 %16.8 %(5.9)%(0.1)%1.2 %
(1)Reflects the deferred revenues adjustment made as a result of purchase accounting.
17


The following table presents our calculation of Adjusted Revenues for the Outlook for 2020 and a reconciliation of this measure to our Revenues, net for the same period:
Year Ending December 31, 2020
(Forecasted)
(in millions)Low High
Revenues, net$1,280.0 $1,295.0 
Adjusted revenues, net(1)
$1,280.0 $1,295.0 

(1)The Company is evaluating the purchase accounting impact, including the deferred revenue adjustment, related to the DRG acquisition.
The following table presents our calculation of Adjusted EBITDA for the Outlook for 2020 and reconciles this measure to our Net loss for the same period:
Year Ending December 31, 2020
(Forecasted)
(in millions)Low High
Net loss$(165.1)$(150.1)
Provision for income taxes22.7 22.7 
Depreciation and amortization312.5 312.5 
Interest, net111.4 111.4 
Transition, transition services agreement, and integration expense(1)
37.7 37.7 
Transaction related costs(2)
118.1 118.1 
Share-based compensation expense37.6 37.6 
Deferred revenue adjustment7.7 7.7 
Other(2.6)(2.6)
Adjusted EBITDA$480.0 $495.0 
Adjusted EBITDA margin37 %38 %

(1)Includes restructuring costs, other cost optimization activities, and payments and receipts under transition service agreements.
(2)Includes cost associated with merger and acquisition related activities.

18


The following table presents our calculation of Adjusted Diluted EPS for the Outlook for 2020 and reconciles these measures to our Net loss for the same period:
Year Ending December 31, 2020
(Forecasted)

LowHigh
Per SharePer Share
Net loss$(0.19)$(0.13)
Transition, transition services agreement, and integration expense(1)
0.11 0.11 
Transaction related costs(2)
0.13 0.13 
Share-based compensation expense0.07 0.07 
Amortization related to acquired intangible assets0.48 0.48 
Income tax impact of related adjustments(0.05)(0.05)
Adjusted Diluted EPS$0.55 $0.61 
Weighted average ordinary shares (Diluted)453,258,347 

(1)Includes restructuring costs, other cost optimization activities, and payments and receipts under transition service agreements.
(2)Includes cost associated with merger and acquisition related activities.

The following table presents our calculation of Free Cash Flow and Adjusted Free Cash Flow for the Outlook for 2020 and reconciles this measure to our Net cash provided by operating activities for the same period:
Year Ending December 31, 2020
(Forecasted)
(in millions)LowHigh
Net cash provided by operating activities$213.0 $223.0 
        Capital expenditures(105.0)(100.0)
Free Cash Flow108.0 123.0 
Transition, transition services agreement, and integration expense(1)
52.0 55.0 
Transaction related costs(2)
80.0 82.0 
Adjusted Free Cash Flow$240.0 $260.0 

(1)Includes cash payments related to restructuring and other cost optimization activities.
(2)Includes cash payments related to merger and acquisition related activities.

Media Contact:
Tabita Seagrave, Head of Global Corporate Communications
[email protected]
Investor Relations Contact:
Mark Donohue, Head of Global Investor Relations
[email protected]
215-243-2202
19
Q3 2020 Earnings Supplemental Materials October 29, 2020

 
Forward-Looking Statements These materials contain “forward-looking statements” as defined in the Private Securities Litigation Reform Act of 1995. Forward-looking statements are neither historical facts nor assurances of future performance. Instead, they are based only on management’s current beliefs, expectations, and assumptions regarding the future of our business, future plans and strategies, projections, outlook, anticipated cost savings, anticipated events and trends, the economy, and other future conditions. Because forward-looking statements relate to the future, they are difficult to predict, and many are outside of our control. Important factors that could cause our actual results and financial condition to differ materially from those indicated in the forward-looking statements include those factors discussed under the caption “Risk Factors” in our 2019 annual report on Form 10-K, our current report on Form 8-K filed on June 19, 2020, and our quarterly report on Form 10-Q for the quarters ended March 31 and June 30, 2020, along with our other filings with the U.S. Securities and Exchange Commission (“SEC”). However, those factors should not be considered to be a complete statement of all potential risks and uncertainties. Forward-looking statements are based only on information currently available to our management and speak only as of the date of this press release. We do not assume any obligation to publicly provide revisions or updates to any forward-looking statements, whether as a result of new information, future developments or otherwise, should circumstances change, except as otherwise required by securities and other applicable laws. Please consult our public filings with the SEC or on our website at www.clarivate.com. Non-GAAP Financial Measures This presentation contains financial measures which have not been calculated in accordance with United States generally accepted accounting principles (“GAAP”), including Adjusted Revenues, Adjusted EBITDA, Adjusted EBITDA Margin, Adjusted Net Income, Adjusted Diluted EPS, Free Cash Flow, Adjusted Free Cash Flow, Standalone Adjusted EBITDA, and net debt because they are a basis upon which our management assesses our performance and we believe they reflect the underlying trends and indicators of our business. Although we believe these measures may be useful for investors for the same reasons, these financial measures should not be considered as an alternative to GAAP financial measures as a measure of the Company’s financial condition, profitability and performance or liquidity. In addition, these financial measures may not be comparable to similar measures used by other companies. At the Appendix to this presentation, we provide further descriptions of these non-GAAP measures and reconciliations of these non-GAAP measures to the corresponding most closely related GAAP measures. Results excluding divestitures in this presentation exclude the previously announced November 2019 agreement to sell the MarkMonitor brand protection, antipiracy and antifraud products, and completed such divestiture on January 1, 2020. Clarivate retained the MarkMonitor Domain Management business. Required Reported Data We are required to report Standalone Adjusted EBITDA, which is identical to Consolidated EBITDA and EBITDA as such terms are defined under our credit agreement, and the indenture governing our senior secured notes due 2026, respectively, pursuant to the reporting covenants contained in such agreements. In addition, management of the Company uses Standalone Adjusted EBITDA to assess compliance with various incurrence-based covenants in these agreements. 2
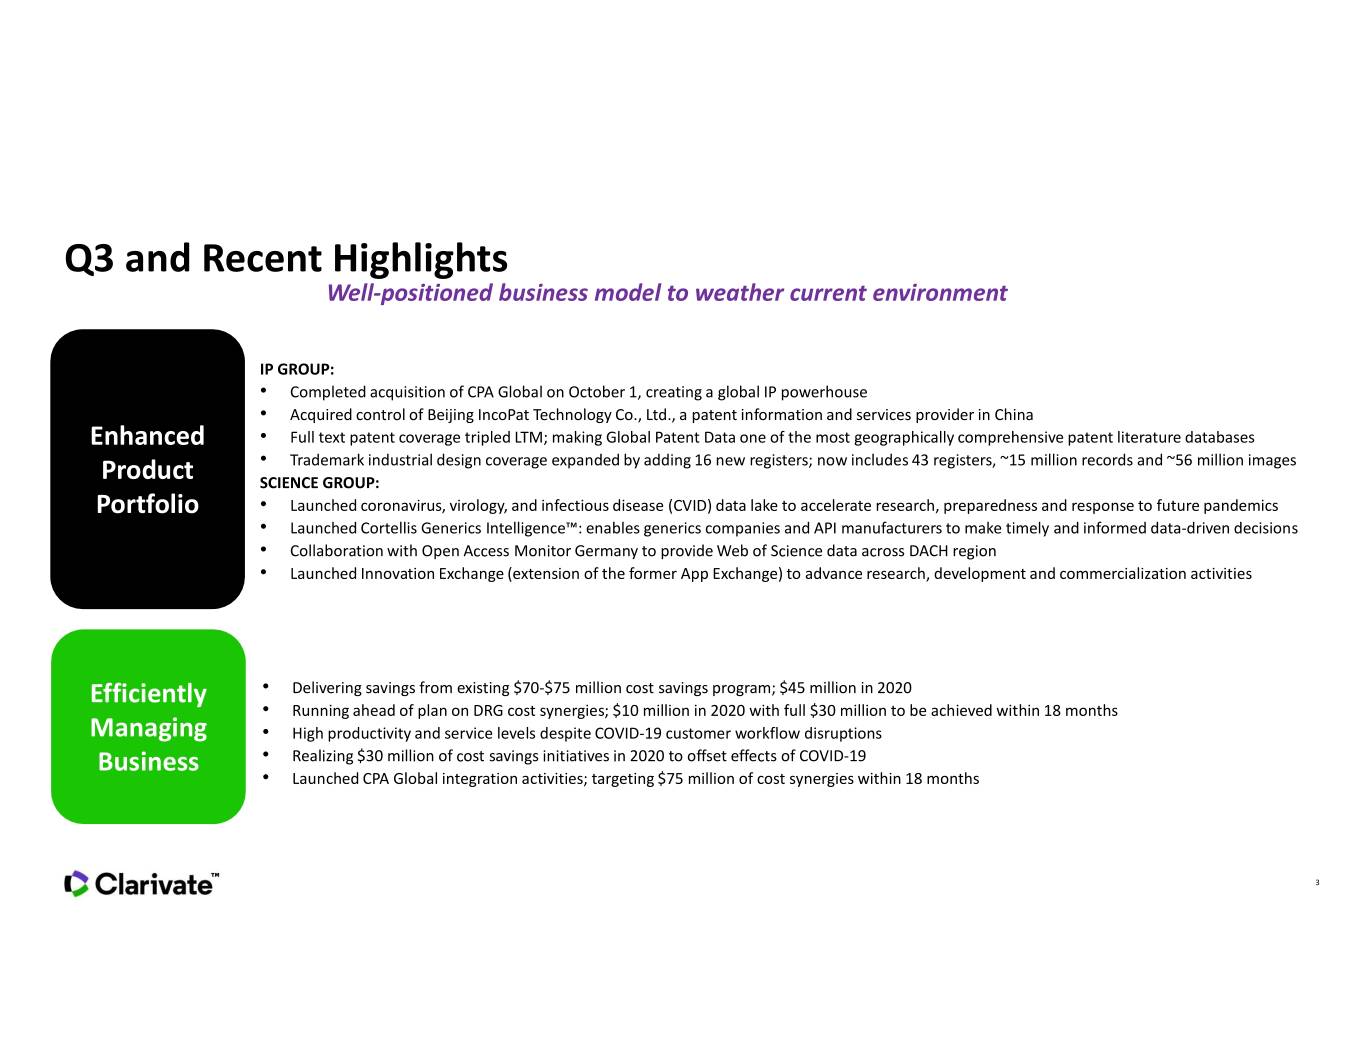

 
Q3 and Recent Highlights Well-positioned business model to weather current environment IP GROUP: • Completed acquisition of CPA Global on October 1, creating a global IP powerhouse • Acquired control of Beijing IncoPat Technology Co., Ltd., a patent information and services provider in China Enhanced • Full text patent coverage tripled LTM; making Global Patent Data one of the most geographically comprehensive patent literature databases • Trademark industrial design coverage expanded by adding 16 new registers; now includes 43 registers, ~15 million records and ~56 million images Product SCIENCE GROUP: Portfolio • Launched coronavirus, virology, and infectious disease (CVID) data lake to accelerate research, preparedness and response to future pandemics • Launched Cortellis Generics Intelligence™: enables generics companies and API manufacturers to make timely and informed data-driven decisions • Collaboration with Open Access Monitor Germany to provide Web of Science data across DACH region • Launched Innovation Exchange (extension of the former App Exchange) to advance research, development and commercialization activities Efficiently • Delivering savings from existing $70-$75 million cost savings program; $45 million in 2020 • Running ahead of plan on DRG cost synergies; $10 million in 2020 with full $30 million to be achieved within 18 months Managing • High productivity and service levels despite COVID-19 customer workflow disruptions Business • Realizing $30 million of cost savings initiatives in 2020 to offset effects of COVID-19 • Launched CPA Global integration activities; targeting $75 million of cost synergies within 18 months 3
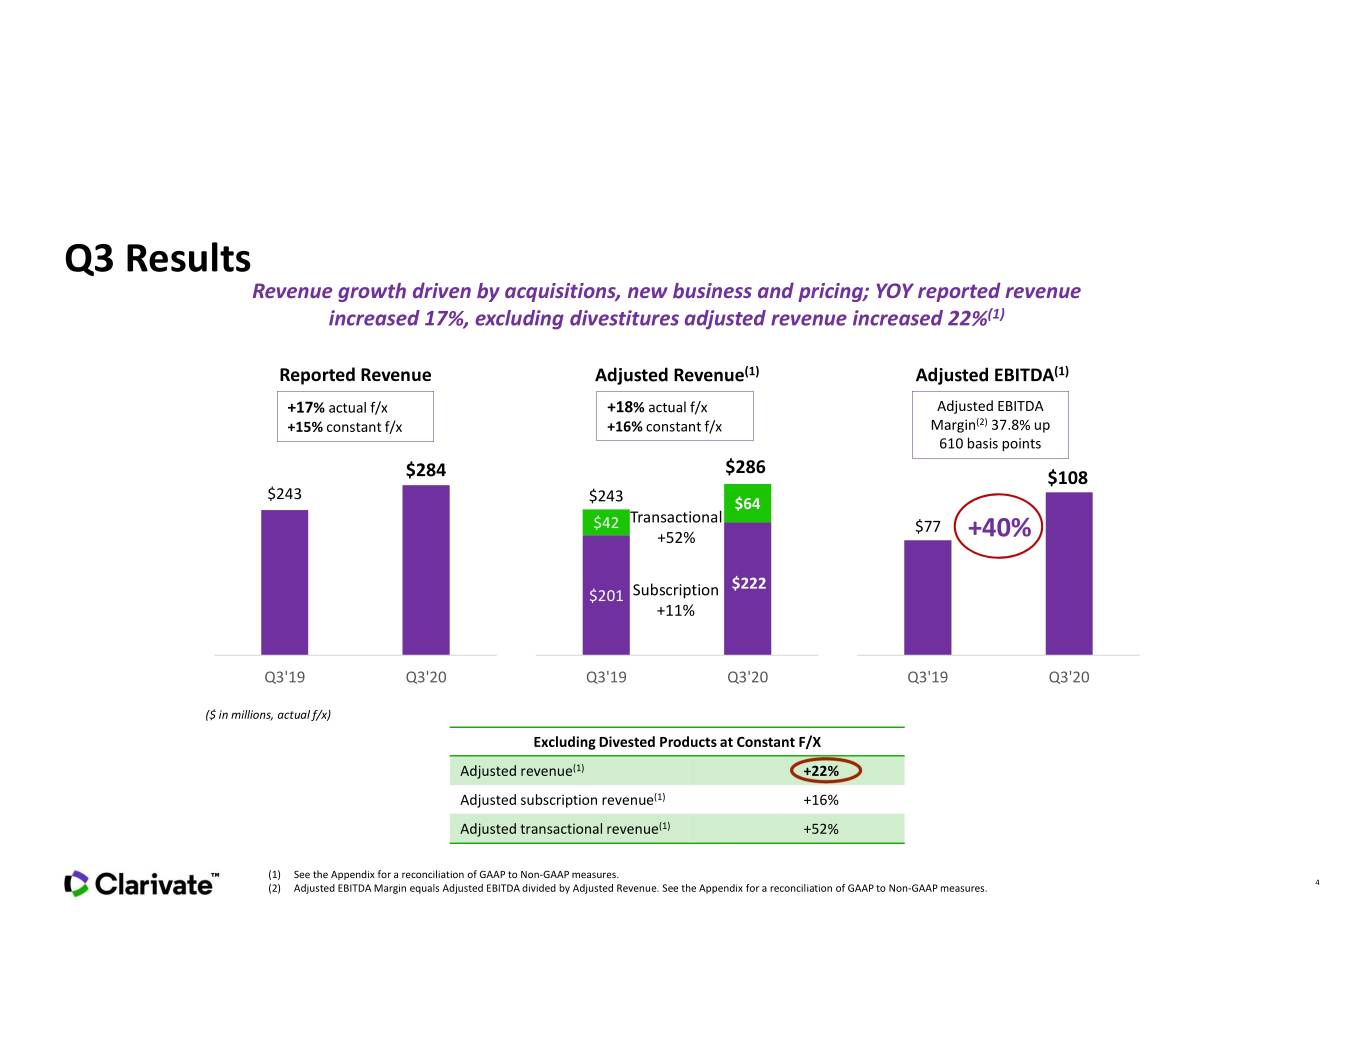

 
Q3 Results Revenue growth driven by acquisitions, new business and pricing; YOY reported revenue increased 17%, excluding divestitures adjusted revenue increased 22%(1) Reported Revenue Adjusted Revenue(1) Adjusted EBITDA(1) +17% actual f/x +18% actual f/x Adjusted EBITDA +15% constant f/x +16% constant f/x Margin(2) 37.8% up 610 basis points $286 $284 $108 $243 $243 $64 Transactional $42 $77 +52% +40% $222 $201 Subscription +11% Q3'19 Q3'20 Q3'19 Q3'20 Q3'19 Q3'20 ($ in millions, actual f/x) Excluding Divested Products at Constant F/X Adjusted revenue(1) +22% Adjusted subscription revenue(1) +16% Adjusted transactional revenue(1) +52% (1) See the Appendix for a reconciliation of GAAP to Non-GAAP measures. 4 (2) Adjusted EBITDA Margin equals Adjusted EBITDA divided by Adjusted Revenue. See the Appendix for a reconciliation of GAAP to Non-GAAP measures.


Q3 Financial Highlights… Solid topline growth and cost efficiencies drove double-digit Adjusted EBITDA(1) growth and significant margin expansion September 30, Excluding ($ in millions except per share data) 2020 2019 % Change Organic(2) Commentary Divestitures(2) Recent acquisitions, new business and price increases within both the Science and Subscription revenue(1) $222 $201 11% 16% 4% or $7M IP Product Groups, partially offset by the MarkMonitor divested products Recent acquisitions, partially offset by divested businesses, a decrease in backfile Transactional revenue(1) 64 42 52% 52% (16% or $7M) sales and lower CompuMarkTM search volumes primarily due to an overall decrease in demand driven by economic conditions resulting from COVID-19 pandemic Adjusted total revenues, net(1) 286 243 18% 22% 0% Annual Contract Value (“ACV”) 861 789 9% 16% 4% Addition of DRG , organic growth and annual price increases Revenue growth, acquisitions, portfolio rationalization and benefit of cost savings Adjusted EBITDA(1) 108 77 40% --- --- initiatives Adjusted EBITDA margin(1) 38% 32% 610bps --- --- Strong revenue flow-through and benefit of cost savings Other income, net 0 2 (100%) --- --- Not a material change Provision for income taxes (4) (2) 280% --- --- Not a material change Due to the COVID-19 pandemic, US Fed estimated tax payments were deferred Cash taxes 12 7 71% --- --- until July 15th. Also includes the acquisition of DRG GAAP income (loss) (37) 11 (436%) Adjusted net income(1) 59 48 23% --- --- GAAP Basic income (loss) per share (0.10) 0.04 (350%) Current period adversely impacted by an increase of 78.7 million or 23.9% in the diluted weighted average ordinary shares outstanding primarily due to the Adjusted diluted EPS(1) $0.14 $0.14 --- --- --- issuance of ordinary shares in conjunction with the acquisition of DRG and the exercise of public warrants during Q1 ‘20 5 (1) See the Appendix for a reconciliation of GAAP to Non-GAAP measures. (2) At constant currency.
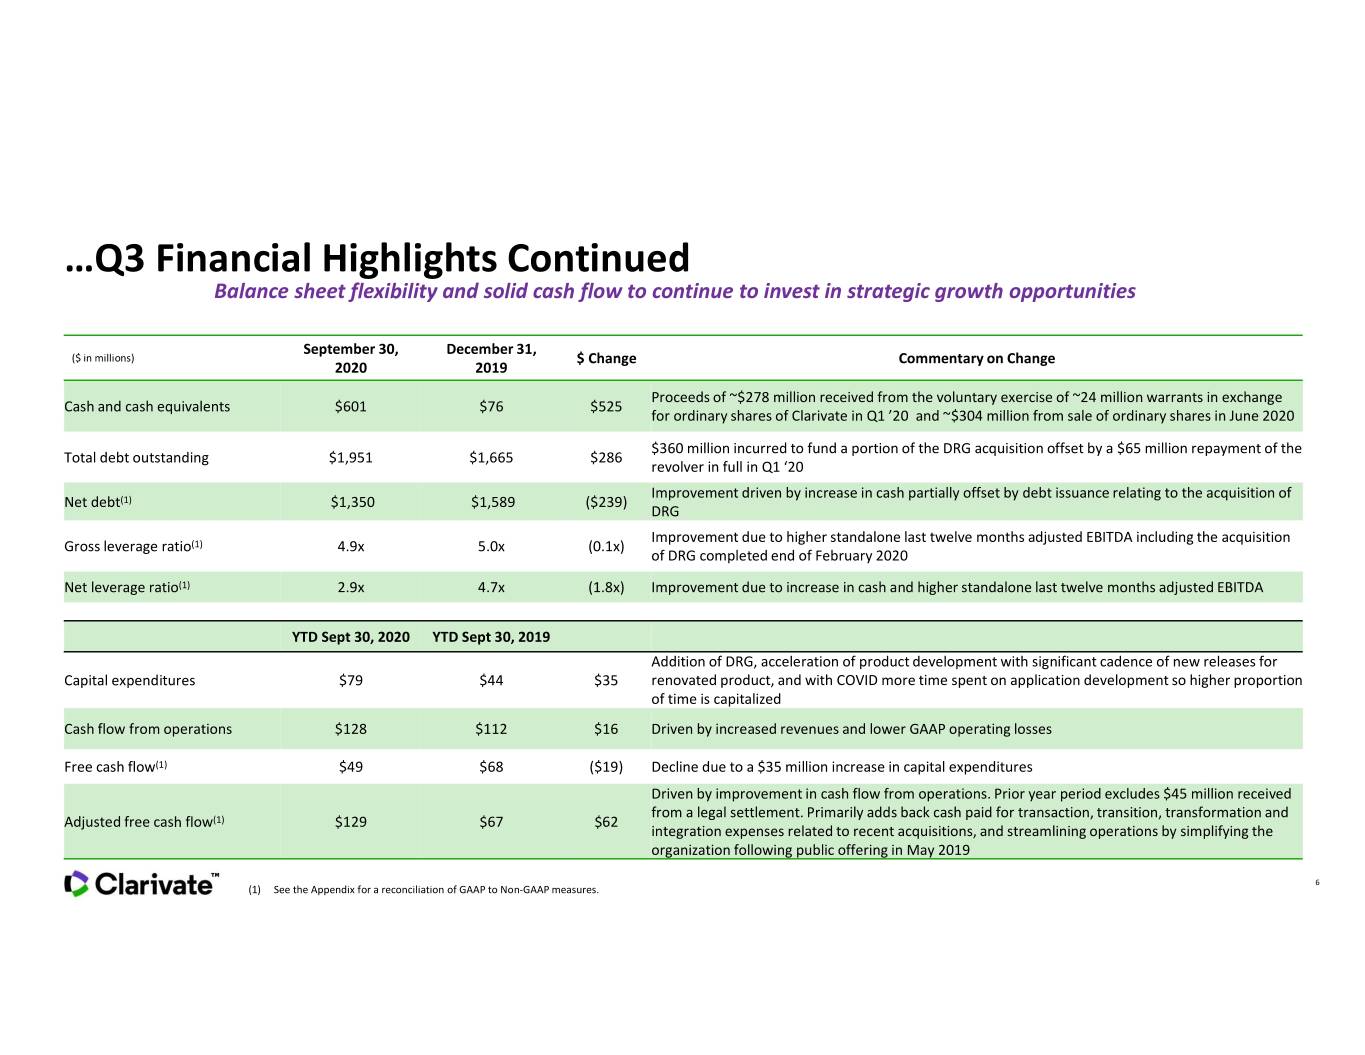

 
…Q3 Financial Highlights Continued Balance sheet flexibility and solid cash flow to continue to invest in strategic growth opportunities September 30, December 31, ($ in millions) $ Change Commentary on Change 2020 2019 Proceeds of ~$278 million received from the voluntary exercise of ~24 million warrants in exchange Cash and cash equivalents $601 $76 $525 for ordinary shares of Clarivate in Q1 ’20 and ~$304 million from sale of ordinary shares in June 2020 $360 million incurred to fund a portion of the DRG acquisition offset by a $65 million repayment of the Total debt outstanding $1,951 $1,665 $286 revolver in full in Q1 ‘20 Improvement driven by increase in cash partially offset by debt issuance relating to the acquisition of Net debt(1) $1,350 $1,589 ($239) DRG Improvement due to higher standalone last twelve months adjusted EBITDA including the acquisition Gross leverage ratio(1) 4.9x 5.0x (0.1x) of DRG completed end of February 2020 Net leverage ratio(1) 2.9x 4.7x (1.8x) Improvement due to increase in cash and higher standalone last twelve months adjusted EBITDA YTD Sept 30, 2020 YTD Sept 30, 2019 Addition of DRG, acceleration of product development with significant cadence of new releases for Capital expenditures $79 $44 $35 renovated product, and with COVID more time spent on application development so higher proportion of time is capitalized Cash flow from operations $128 $112 $16 Driven by increased revenues and lower GAAP operating losses Free cash flow(1) $49 $68 ($19) Decline due to a $35 million increase in capital expenditures Driven by improvement in cash flow from operations. Prior year period excludes $45 million received from a legal settlement. Primarily adds back cash paid for transaction, transition, transformation and Adjusted free cash flow(1) $129 $67 $62 integration expenses related to recent acquisitions, and streamlining operations by simplifying the organization following public offering in May 2019 6 (1) See the Appendix for a reconciliation of GAAP to Non-GAAP measures.
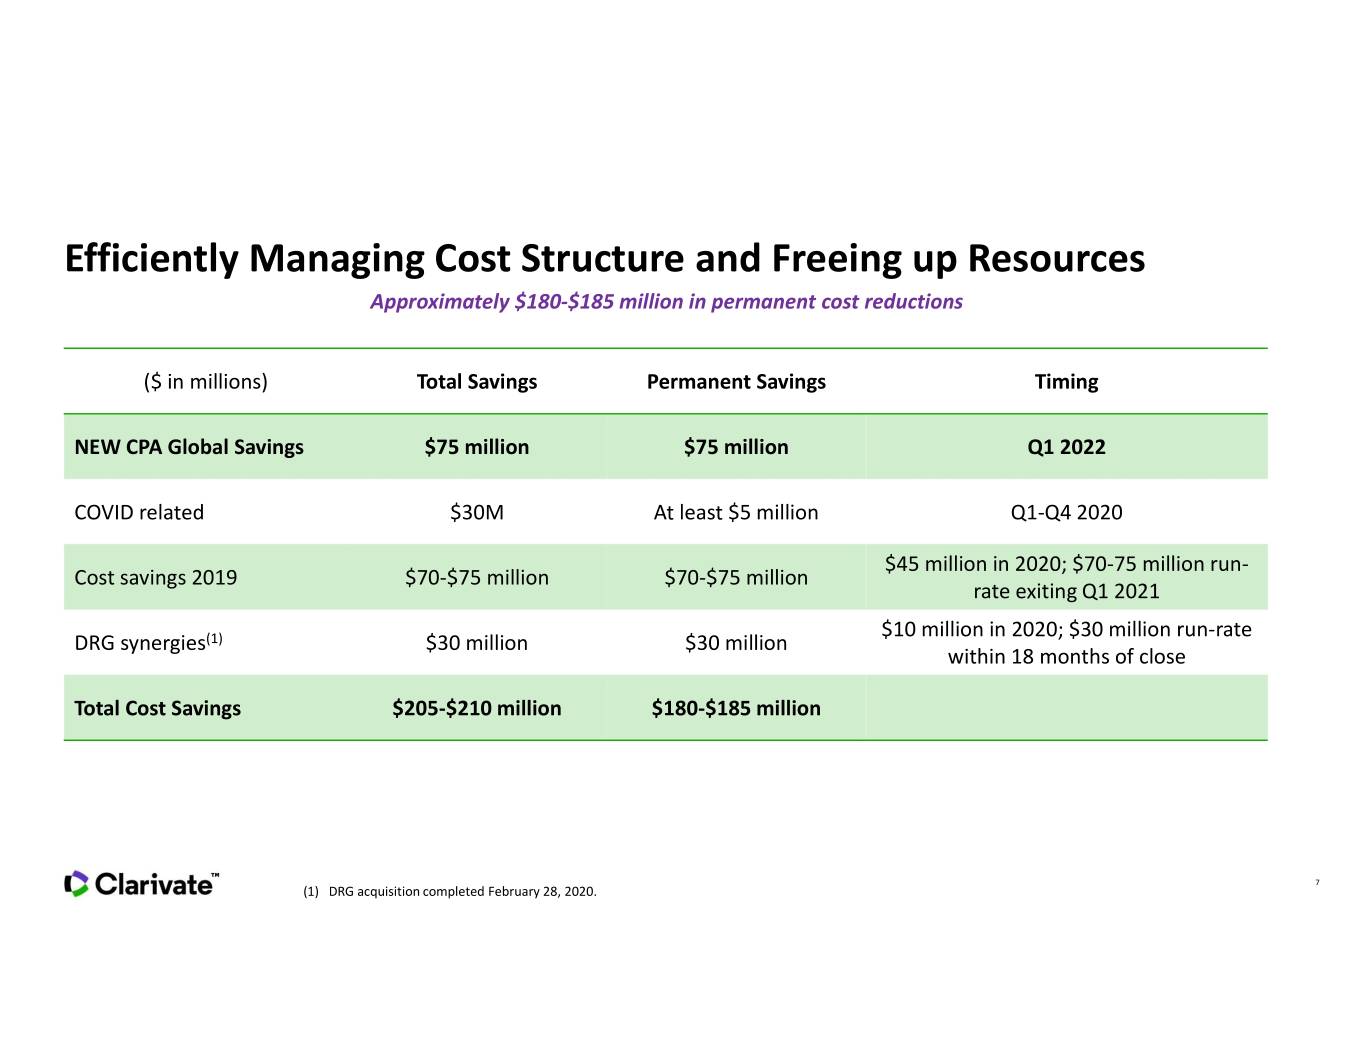

 
Efficiently Managing Cost Structure and Freeing up Resources Approximately $180-$185 million in permanent cost reductions ($ in millions) Total Savings Permanent Savings Timing NEW CPA Global Savings $75 million $75 million Q1 2022 COVID related $30M At least $5 million Q1-Q4 2020 $45 million in 2020; $70-75 million run- Cost savings 2019 $70-$75 million $70-$75 million rate exiting Q1 2021 $10 million in 2020; $30 million run-rate DRG synergies(1) $30 million $30 million within 18 months of close Total Cost Savings $205-$210 million $180-$185 million 7 (1) DRG acquisition completed February 28, 2020.
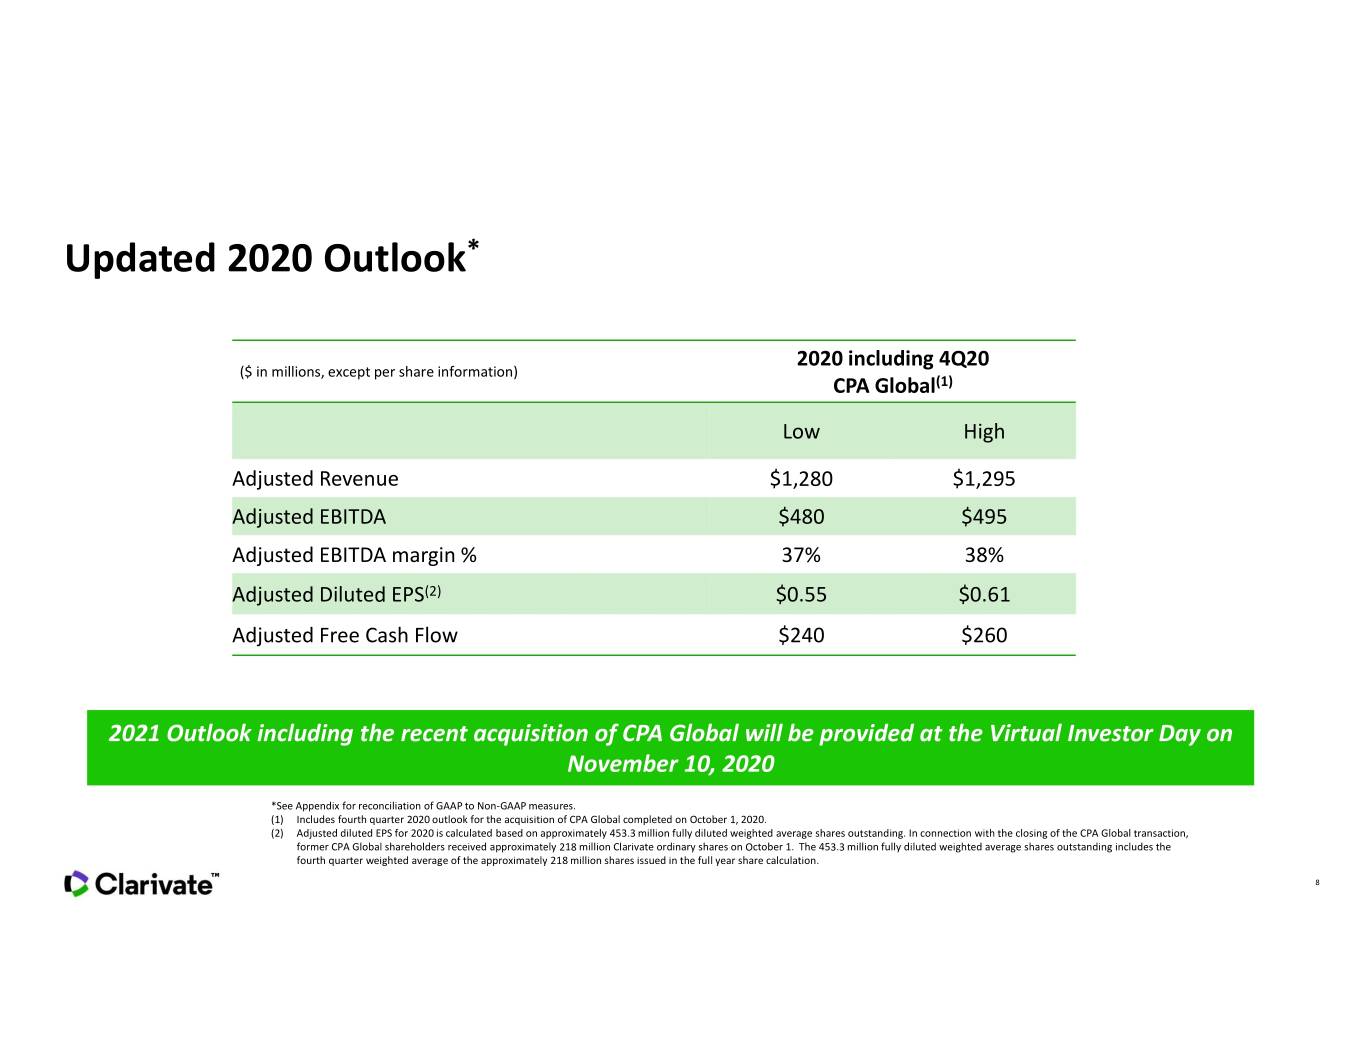

 
Updated 2020 Outlook* 2020 including 4Q20 ($ in millions, except per share information) CPA Global(1) Low High Adjusted Revenue $1,280 $1,295 Adjusted EBITDA $480 $495 Adjusted EBITDA margin % 37% 38% Adjusted Diluted EPS(2) $0.55 $0.61 Adjusted Free Cash Flow $240 $260 2021 Outlook including the recent acquisition of CPA Global will be provided at the Virtual Investor Day on November 10, 2020 *See Appendix for reconciliation of GAAP to Non-GAAP measures. (1) Includes fourth quarter 2020 outlook for the acquisition of CPA Global completed on October 1, 2020. (2) Adjusted diluted EPS for 2020 is calculated based on approximately 453.3 million fully diluted weighted average shares outstanding. In connection with the closing of the CPA Global transaction, former CPA Global shareholders received approximately 218 million Clarivate ordinary shares on October 1. The 453.3 million fully diluted weighted average shares outstanding includes the fourth quarter weighted average of the approximately 218 million shares issued in the full year share calculation. 8
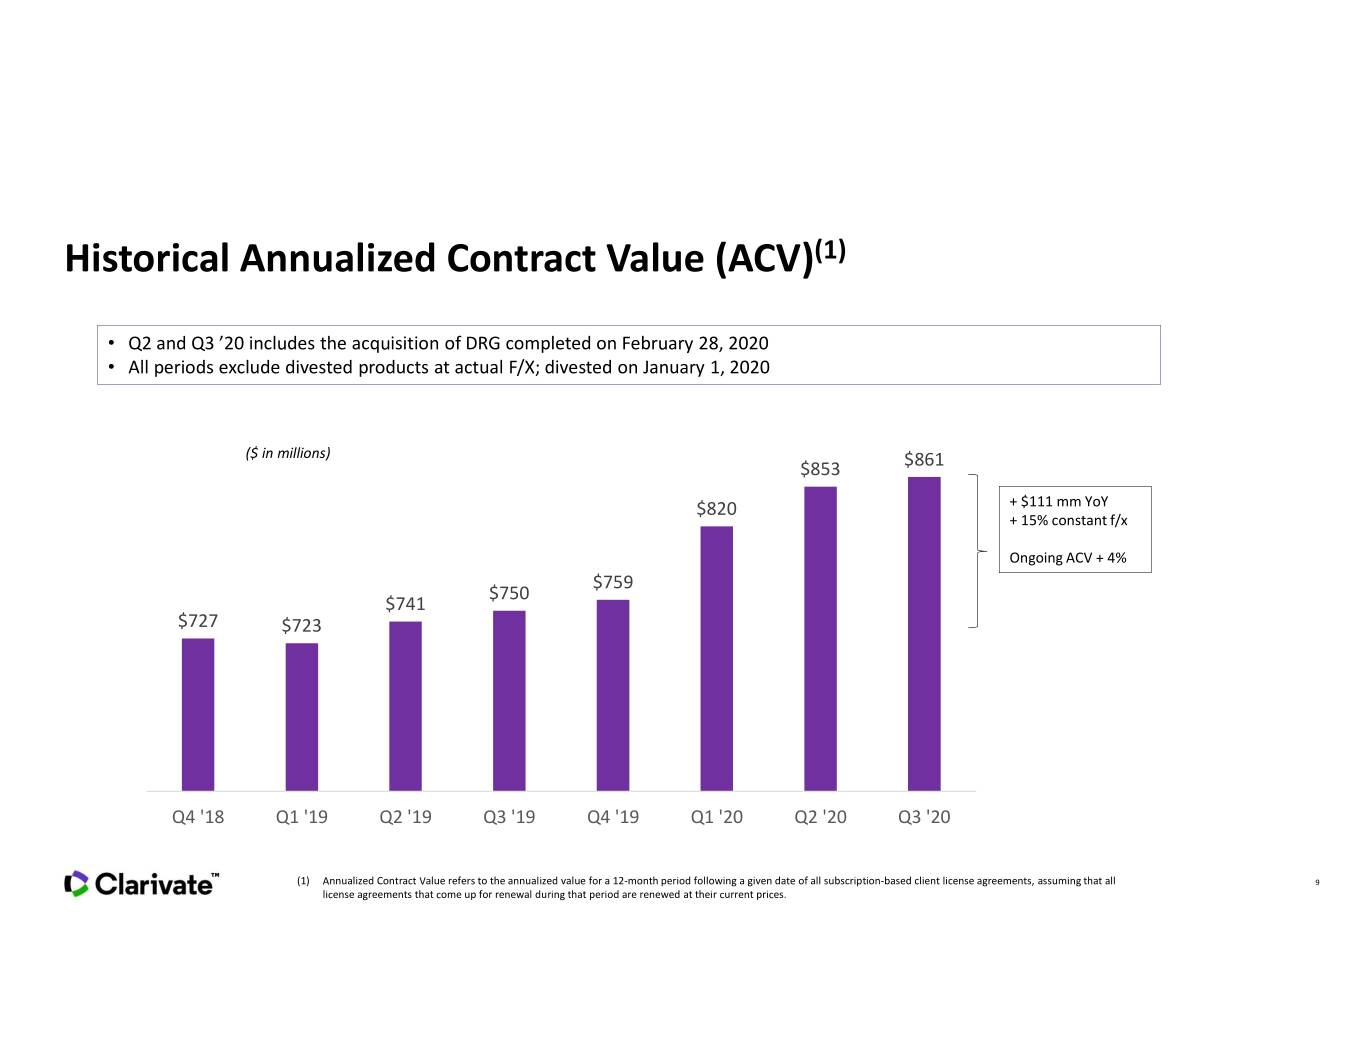

 
Historical Annualized Contract Value (ACV)(1) • Q2 and Q3 ’20 includes the acquisition of DRG completed on February 28, 2020 • All periods exclude divested products at actual F/X; divested on January 1, 2020 ($ in millions) $853 $861 $820 + $111 mm YoY + 15% constant f/x Ongoing ACV + 4% $759 $750 $741 $727 $723 Q4 '18 Q1 '19 Q2 '19 Q3 '19 Q4 '19 Q1 '20 Q2 '20 Q3 '20 (1) Annualized Contract Value refers to the annualized value for a 12-month period following a given date of all subscription-based client license agreements, assuming that all 9 license agreements that come up for renewal during that period are renewed at their current prices.

 
APPENDIX
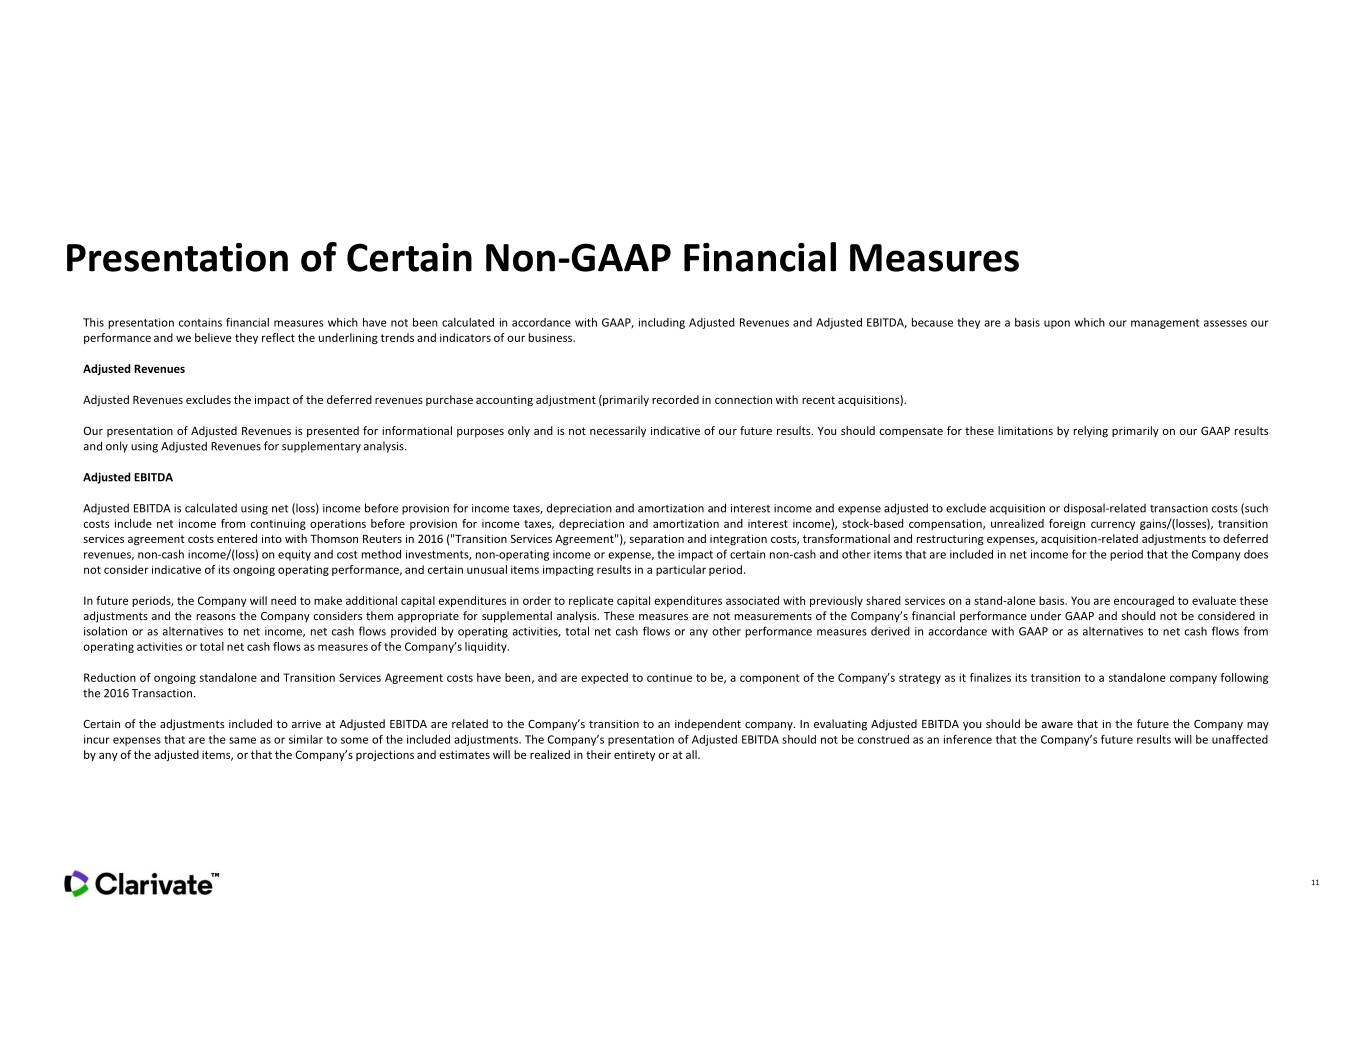

 
Presentation of Certain Non-GAAP Financial Measures This presentation contains financial measures which have not been calculated in accordance with GAAP, including Adjusted Revenues and Adjusted EBITDA, because they are a basis upon which our management assesses our performanceand we believe they reflect the underlining trends and indicators of our business. Adjusted Revenues Adjusted Revenues excludes the impact of the deferred revenues purchase accounting adjustment (primarily recorded in connection with recent acquisitions). Our presentation of Adjusted Revenues is presented for informational purposes only and is not necessarily indicative of our future results. You should compensate for these limitations by relying primarily on our GAAP results and only using Adjusted Revenues for supplementary analysis. Adjusted EBITDA Adjusted EBITDA is calculated using net (loss) income before provision for income taxes, depreciation and amortization and interest income and expense adjusted to exclude acquisition or disposal-related transaction costs (such costs include net income from continuing operations before provision for income taxes, depreciation and amortization and interest income), stock-based compensation, unrealized foreign currency gains/(losses), transition services agreement costs entered into with Thomson Reuters in 2016 ("Transition Services Agreement"), separation and integration costs, transformational and restructuring expenses, acquisition-related adjustments to deferred revenues, non-cash income/(loss) on equity and cost method investments, non-operating income or expense, the impact of certain non-cash and other items that are included in net income for the period that the Company does not consider indicative of its ongoing operating performance, and certain unusual items impacting results in a particular period. In future periods, the Company will need to make additional capital expenditures in order to replicate capital expenditures associated with previously shared services on a stand-alone basis. You are encouraged to evaluate these adjustments and the reasons the Company considers them appropriate for supplemental analysis. These measures are not measurements of the Company’s financial performance under GAAP and should not be considered in isolation or as alternatives to net income, net cash flows provided by operating activities, total net cash flows or any other performance measures derived in accordance with GAAP or as alternatives to net cash flows from operating activities or total net cash flows as measures of the Company’s liquidity. Reduction of ongoing standalone and Transition Services Agreement costs have been, and are expected to continue to be, a component of the Company’s strategy as it finalizes its transition to a standalone company following the 2016 Transaction. Certain of the adjustments included to arrive at Adjusted EBITDA are related to the Company’s transition to an independent company. In evaluating Adjusted EBITDA you should be aware that in the future the Company may incur expenses that are the same as or similar to some of the included adjustments. The Company’s presentation of Adjusted EBITDA should not be construed as an inference that the Company’s future results will be unaffected by any of the adjusted items, or that the Company’s projectionsand estimates will be realized in their entirety or at all. 11
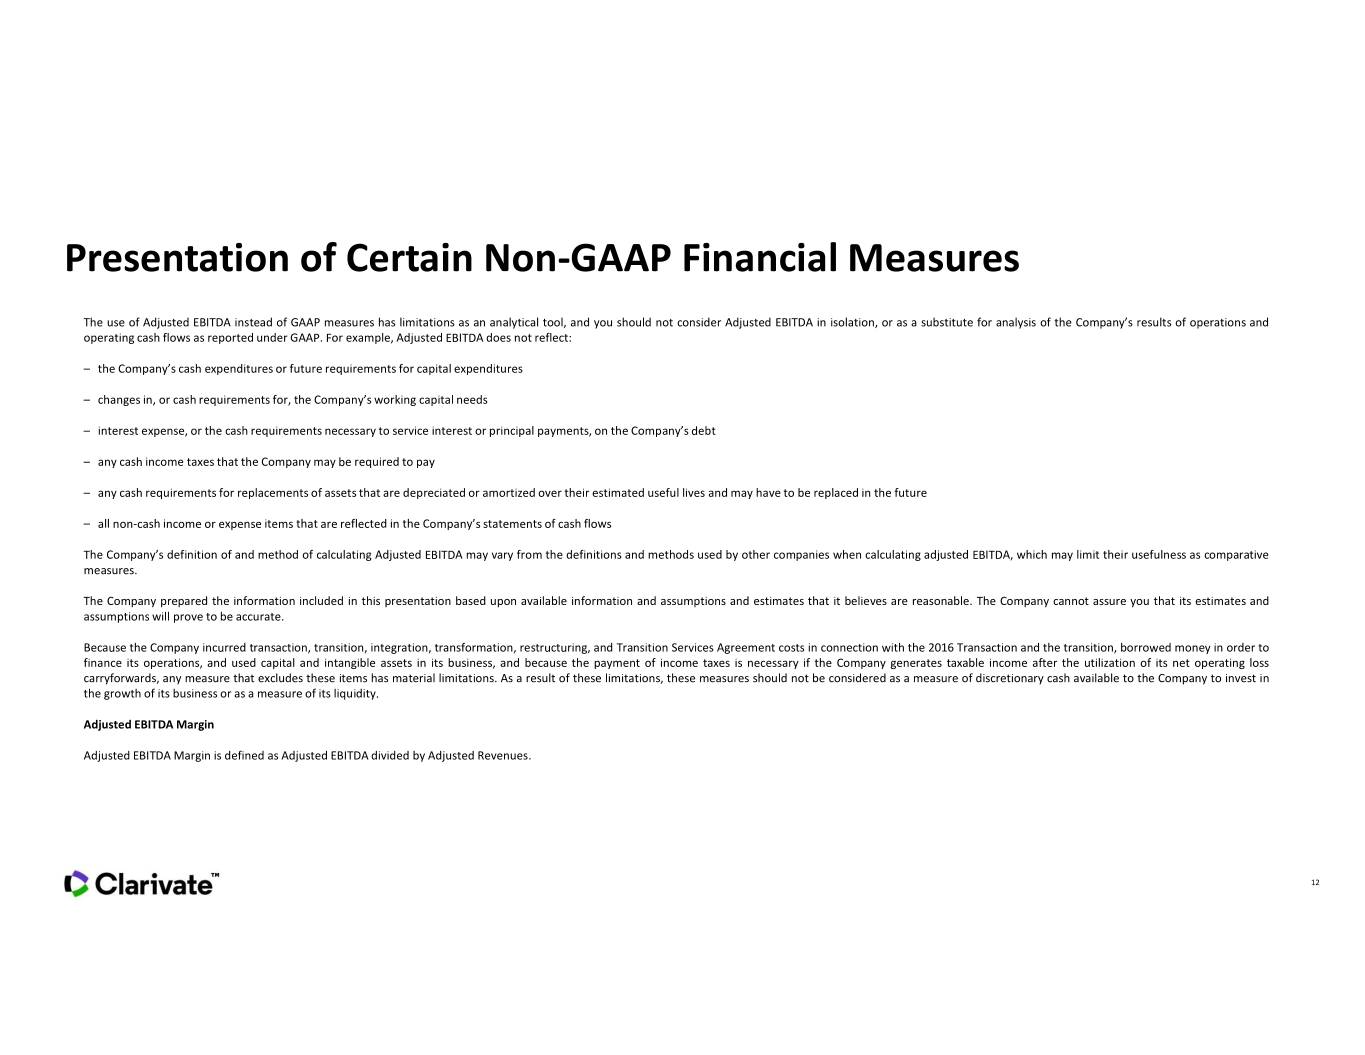

 
Presentation of Certain Non-GAAP Financial Measures The use of Adjusted EBITDA instead of GAAP measures has limitations as an analytical tool, and you should not consider Adjusted EBITDA in isolation, or as a substitute for analysis of the Company’s results of operations and operating cash flows as reported under GAAP. For example, Adjusted EBITDA does not reflect: – the Company’s cash expenditures or future requirements for capital expenditures – changes in, or cash requirements for, the Company’s working capitalneeds – interest expense, or the cash requirements necessary to service interest or principal payments, on the Company’s debt – any cash income taxesthatthe Companymay be required to pay – any cash requirements for replacementsof assets that are depreciated or amortized over their estimated useful lives and may have to be replaced in the future – all non-cash income or expense items that are reflected in the Company’s statements of cash flows The Company’s definition of and method of calculating Adjusted EBITDA may vary from the definitions and methods used by other companies when calculating adjusted EBITDA, which may limit their usefulness as comparative measures. The Company prepared the information included in this presentation based upon available information and assumptions and estimates that it believes are reasonable. The Company cannot assure you that its estimates and assumptions will prove to be accurate. Because the Company incurred transaction, transition, integration, transformation, restructuring, and Transition Services Agreement costs in connection with the 2016 Transaction and the transition, borrowed money in order to finance its operations, and used capital and intangible assets in its business, and because the payment of income taxes is necessary if the Company generates taxable income after the utilization of its net operating loss carryforwards, any measure that excludes these items has material limitations. As a result of these limitations, these measures should not be considered as a measure of discretionary cash available to the Company to invest in the growth of its business or as a measure of its liquidity. Adjusted EBITDA Margin Adjusted EBITDA Margin is defined as Adjusted EBITDA divided by Adjusted Revenues. 12
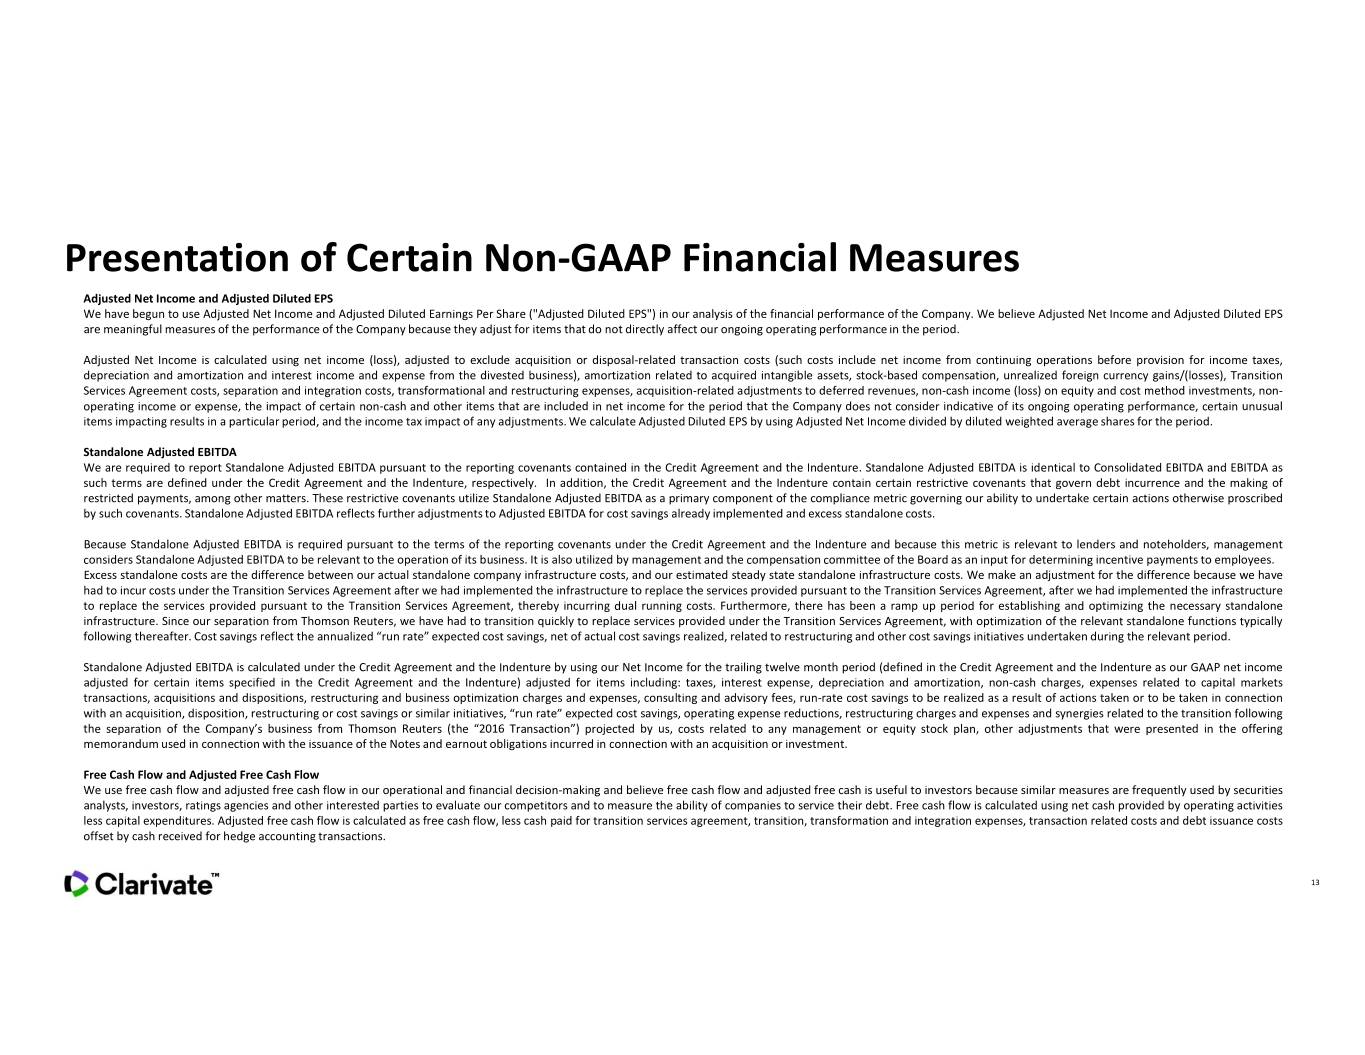

 
Presentation of Certain Non-GAAP Financial Measures Adjusted Net Income and Adjusted Diluted EPS We have begun to use Adjusted Net Income and Adjusted Diluted Earnings Per Share ("Adjusted Diluted EPS") in our analysis of the financial performance of the Company. We believe Adjusted Net Income and Adjusted Diluted EPS are meaningful measures of the performance of the Company because they adjust for items that do not directly affect our ongoing operating performancein the period. Adjusted Net Income is calculated using net income (loss), adjusted to exclude acquisition or disposal-related transaction costs (such costs include net income from continuing operations before provision for income taxes, depreciation and amortization and interest income and expense from the divested business), amortization related to acquired intangible assets, stock-based compensation, unrealized foreign currency gains/(losses), Transition Services Agreement costs, separation and integration costs, transformational and restructuring expenses, acquisition-related adjustments to deferred revenues, non-cash income (loss) on equity and cost method investments, non- operating income or expense, the impact of certain non-cash and other items that are included in net income for the period that the Company does not consider indicative of its ongoing operating performance, certain unusual items impacting results in a particular period, and the income tax impact of any adjustments.We calculate Adjusted Diluted EPS by using Adjusted Net Income divided by diluted weighted average shares for the period. Standalone Adjusted EBITDA We are required to report Standalone Adjusted EBITDA pursuant to the reporting covenants contained in the Credit Agreement and the Indenture. Standalone Adjusted EBITDA is identical to Consolidated EBITDA and EBITDA as such terms are defined under the Credit Agreement and the Indenture, respectively. In addition, the Credit Agreement and the Indenture contain certain restrictive covenants that govern debt incurrence and the making of restricted payments, among other matters. These restrictive covenants utilize Standalone Adjusted EBITDA as a primary component of the compliance metric governing our ability to undertake certain actions otherwise proscribed by such covenants. Standalone Adjusted EBITDA reflects further adjustmentsto Adjusted EBITDA for cost savings already implemented and excess standalone costs. Because Standalone Adjusted EBITDA is required pursuant to the terms of the reporting covenants under the Credit Agreement and the Indenture and because this metric is relevant to lenders and noteholders, management considers Standalone Adjusted EBITDA to be relevant to the operation of its business. It is also utilized by management and the compensation committee of the Board as an input for determining incentive payments to employees. Excess standalone costs are the difference between our actual standalone company infrastructure costs, and our estimated steady state standalone infrastructure costs. We make an adjustment for the difference because we have had to incur costs under the Transition Services Agreement after we had implemented the infrastructure to replace the services provided pursuant to the Transition Services Agreement, after we had implemented the infrastructure to replace the services provided pursuant to the Transition Services Agreement, thereby incurring dual running costs. Furthermore, there has been a ramp up period for establishing and optimizing the necessary standalone infrastructure. Since our separation from Thomson Reuters, we have had to transition quickly to replace services provided under the Transition Services Agreement, with optimization of the relevant standalone functions typically following thereafter. Cost savings reflect the annualized “run rate” expected cost savings, net of actual cost savings realized, related to restructuring and other cost savings initiatives undertaken during the relevant period. Standalone Adjusted EBITDA is calculated under the Credit Agreement and the Indenture by using our Net Income for the trailing twelve month period (defined in the Credit Agreement and the Indenture as our GAAP net income adjusted for certain items specified in the Credit Agreement and the Indenture) adjusted for items including: taxes, interest expense, depreciation and amortization, non-cash charges, expenses related to capital markets transactions, acquisitions and dispositions, restructuring and business optimization charges and expenses, consulting and advisory fees, run-rate cost savings to be realized as a result of actions taken or to be taken in connection with an acquisition, disposition, restructuring or cost savings or similar initiatives, “run rate” expected cost savings, operating expense reductions, restructuring charges and expenses and synergies related to the transition following the separation of the Company’s business from Thomson Reuters (the “2016 Transaction”) projected by us, costs related to any management or equity stock plan, other adjustments that were presented in the offering memorandum used in connection with the issuance of the Notes and earnout obligations incurred in connection with an acquisition or investment. Free Cash Flow and Adjusted Free Cash Flow We use free cash flow and adjusted free cash flow in our operational and financial decision-making and believe free cash flow and adjusted free cash is useful to investors because similar measures are frequently used by securities analysts, investors, ratings agencies and other interested parties to evaluate our competitors and to measure the ability of companies to service their debt. Free cash flow is calculated using net cash provided by operating activities less capital expenditures. Adjusted free cash flow is calculated as free cash flow, less cash paid for transition services agreement, transition, transformation and integration expenses, transaction related costs and debt issuance costs offset by cash received for hedge accounting transactions. 13
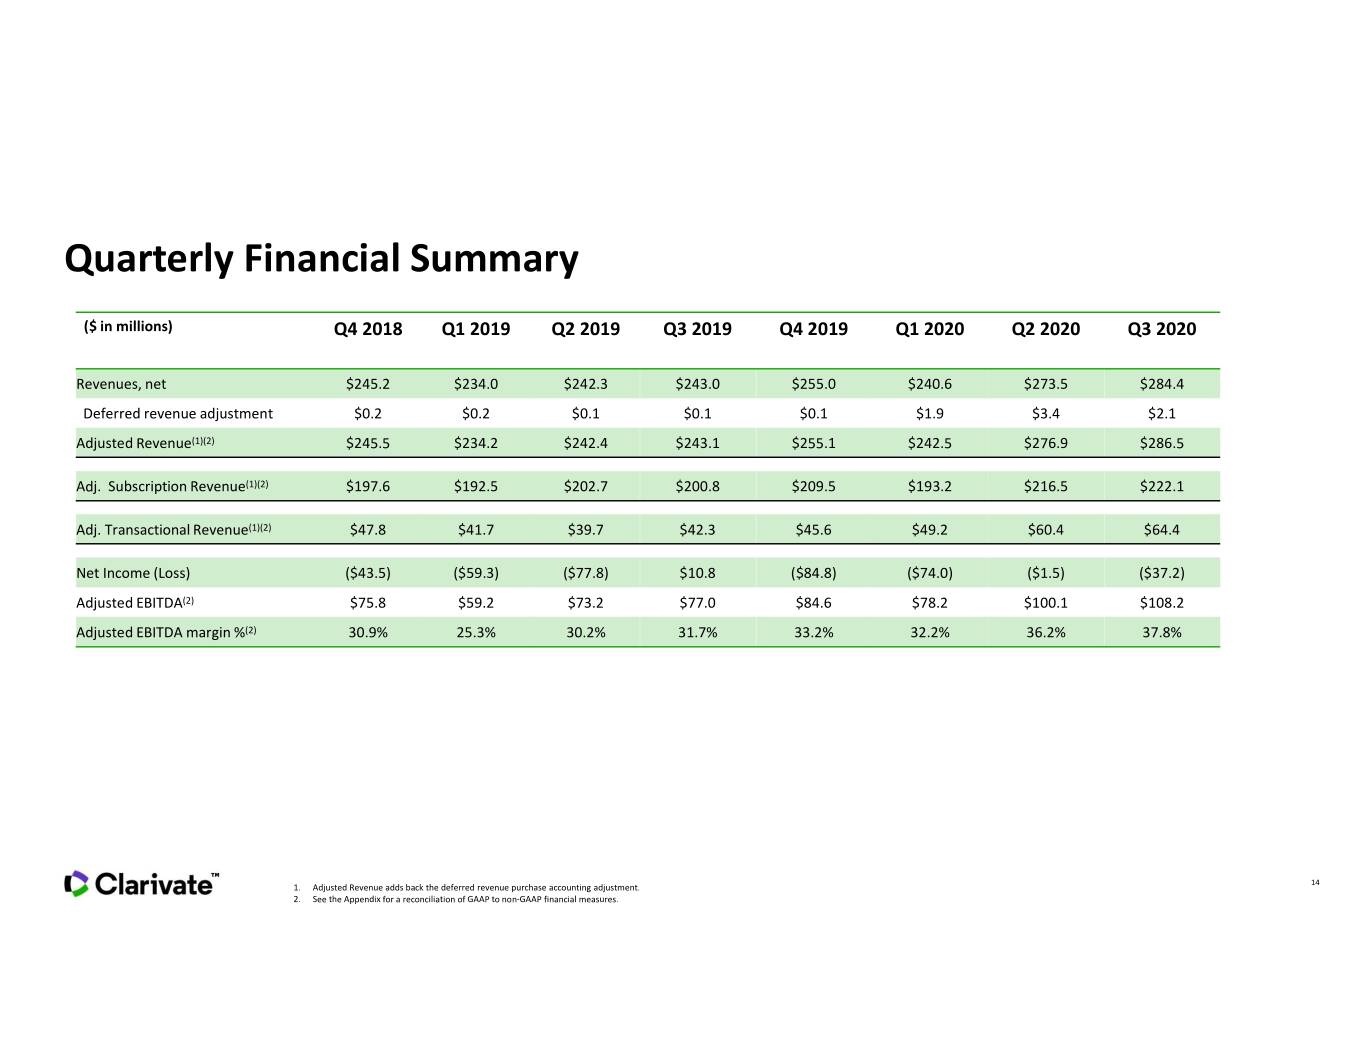

 
Quarterly Financial Summary ($ in millions) Q4 2018 Q1 2019 Q2 2019 Q3 2019 Q4 2019 Q1 2020 Q2 2020 Q3 2020 Revenues, net $245.2 $234.0 $242.3 $243.0 $255.0 $240.6 $273.5 $284.4 Deferred revenue adjustment $0.2 $0.2 $0.1 $0.1 $0.1 $1.9 $3.4 $2.1 Adjusted Revenue(1)(2) $245.5 $234.2 $242.4 $243.1 $255.1 $242.5 $276.9 $286.5 Adj. Subscription Revenue(1)(2) $197.6 $192.5 $202.7 $200.8 $209.5 $193.2 $216.5 $222.1 Adj. Transactional Revenue(1)(2) $47.8 $41.7 $39.7 $42.3 $45.6 $49.2 $60.4 $64.4 Net Income (Loss) ($43.5) ($59.3) ($77.8) $10.8 ($84.8) ($74.0) ($1.5) ($37.2) Adjusted EBITDA(2) $75.8 $59.2 $73.2 $77.0 $84.6 $78.2 $100.1 $108.2 Adjusted EBITDA margin %(2) 30.9% 25.3% 30.2% 31.7% 33.2% 32.2% 36.2% 37.8% 14 1. Adjusted Revenue adds back the deferred revenue purchase accounting adjustment. 2. See the Appendix for a reconciliation of GAAP to non-GAAP financial measures.
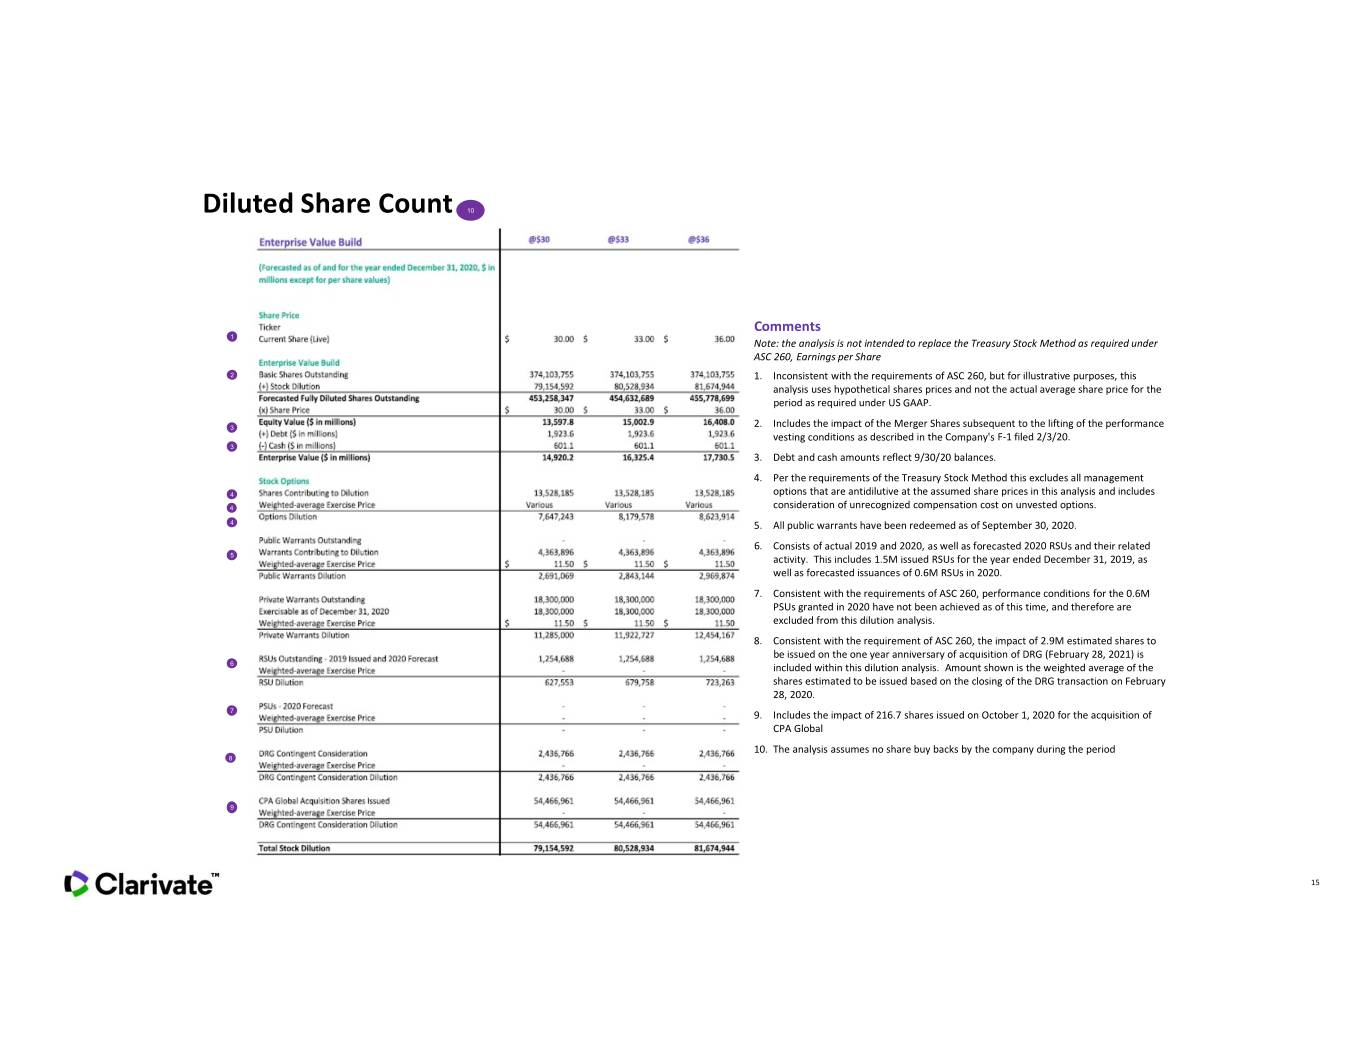

 
Diluted Share Count 10 Comments 1 Note: the analysis is not intended to replace the Treasury Stock Method as required under ASC 260, Earnings per Share 2 1. Inconsistent with the requirements of ASC 260, but for illustrative purposes, this analysis uses hypothetical shares prices and not the actual average share price for the period as required under US GAAP. 3 2. Includes the impact of the Merger Shares subsequent to the lifting of the performance vesting conditions as described in the Company's F-1 filed 2/3/20. 3 3. Debt and cash amounts reflect 9/30/20 balances. 4. Per the requirements of the Treasury Stock Method this excludes all management 4 options that are antidilutive at the assumed share prices in this analysis and includes 4 consideration of unrecognized compensation cost on unvested options. 4 5. All public warrants have been redeemed as of September 30, 2020. 6. Consists of actual 2019 and 2020, as well as forecasted 2020 RSUs and their related 5 activity. This includes 1.5M issued RSUs for the year ended December 31, 2019, as well as forecasted issuances of 0.6M RSUs in 2020. 7. Consistent with the requirements of ASC 260, performance conditions for the 0.6M PSUs granted in 2020 have not been achieved as of this time, and therefore are excluded from this dilution analysis. 8. Consistent with the requirement of ASC 260, the impact of 2.9M estimated shares to be issued on the one year anniversary of acquisition of DRG (February 28, 2021) is 6 included within this dilution analysis. Amount shown is the weighted average of the shares estimated to be issued based on the closing of the DRG transaction on February 28, 2020. 7 9. Includes the impact of 216.7 shares issued on October 1, 2020 for the acquisition of CPA Global 10. The analysis assumes no share buy backs by the company during the period 8 9 15
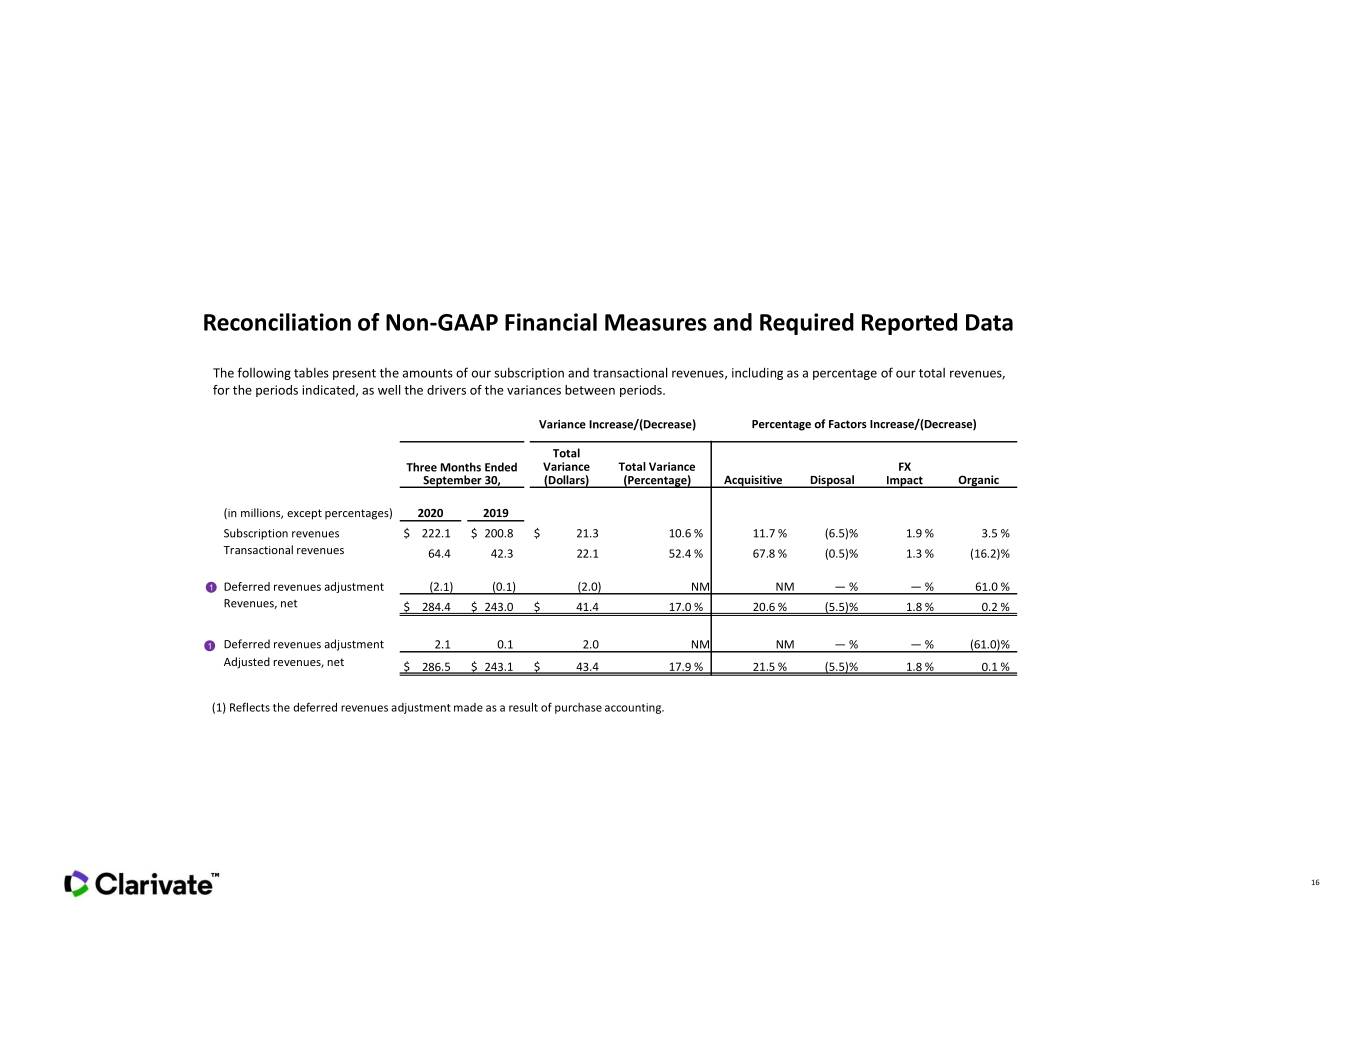

 
Reconciliation of Non-GAAP Financial Measures and Required Reported Data The following tables present the amounts of our subscription and transactional revenues, including as a percentage of our total revenues, for the periods indicated, as well the drivers of the variances between periods. Variance Increase/(Decrease) Percentage of Factors Increase/(Decrease) Total Three Months Ended Variance Total Variance FX September 30, (Dollars) (Percentage) Acquisitive Disposal Impact Organic (in millions, except percentages) 2020 2019 Subscription revenues $ 222.1 $ 200.8 $ 21.3 10.6 % 11.7 % (6.5)% 1.9 % 3.5 % Transactional revenues 64.4 42.3 22.1 52.4 % 67.8 % (0.5)% 1.3 % (16.2)% 1 Deferred revenues adjustment (2.1) (0.1) (2.0) NM NM —% —% 61.0% Revenues, net $ 284.4 $ 243.0 $ 41.4 17.0 % 20.6 % (5.5)% 1.8 % 0.2 % 1 Deferred revenues adjustment 2.1 0.1 2.0 NM NM —% —% (61.0)% Adjusted revenues, net $ 286.5 $ 243.1 $ 43.4 17.9 % 21.5 % (5.5)% 1.8 % 0.1 % (1) Reflects the deferred revenues adjustment made as a result of purchase accounting. 16
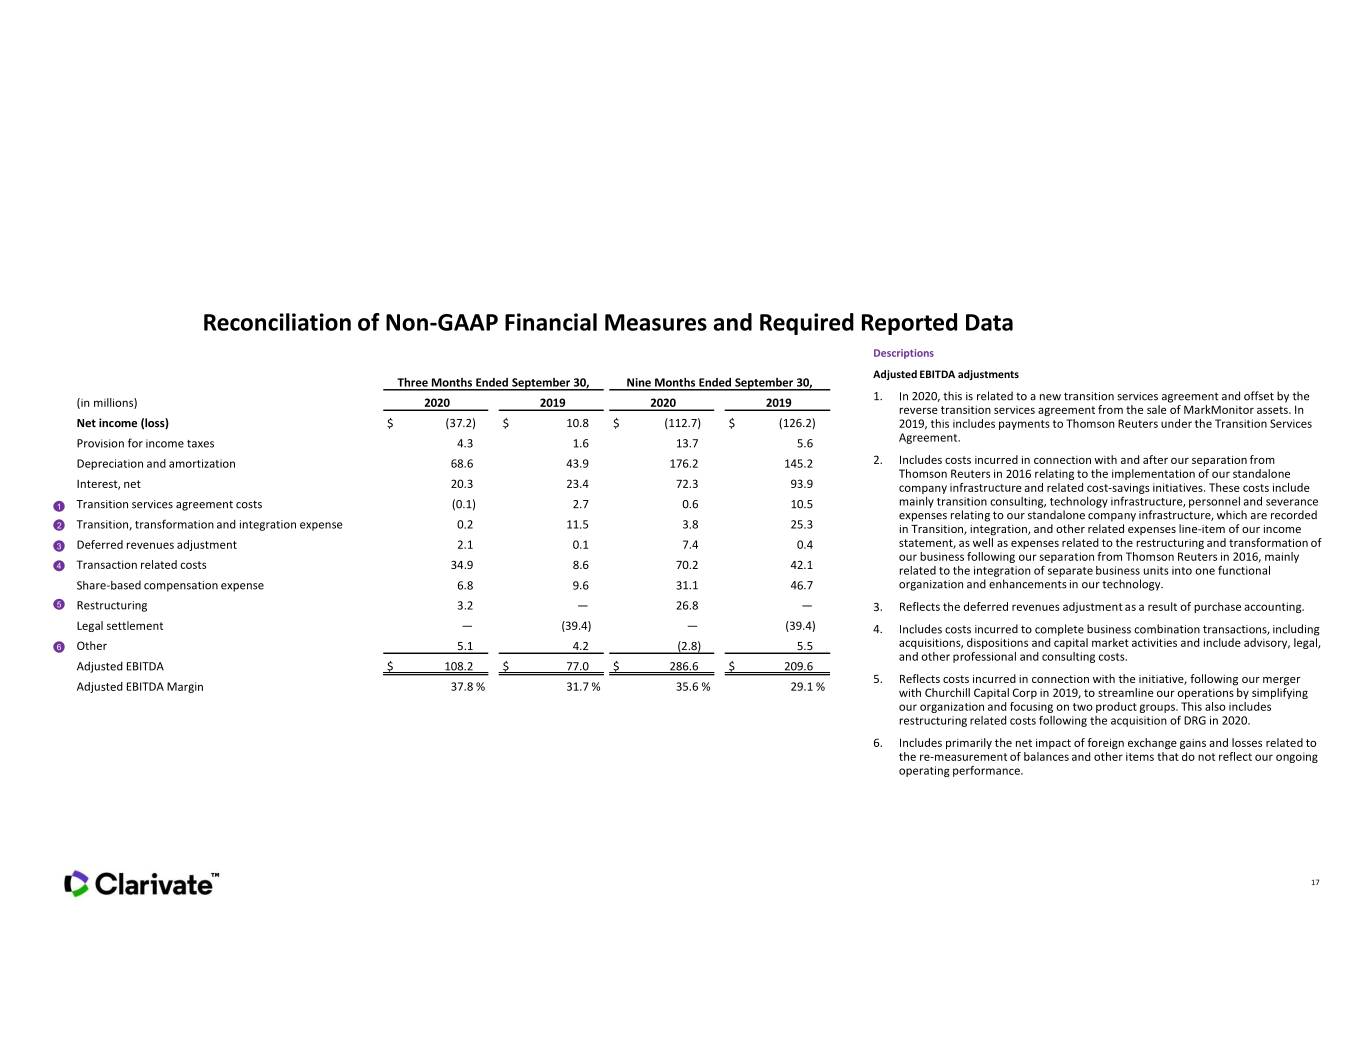

 
Reconciliation of Non-GAAP Financial Measures and Required Reported Data Descriptions Adjusted EBITDA adjustments Three Months Ended September 30, Nine Months Ended September 30, 1. In 2020, this is related to a new transition services agreement and offset by the (in millions) 2020 2019 2020 2019 reverse transition services agreement from the sale of MarkMonitor assets. In Net income (loss) $ (37.2) $ 10.8 $ (112.7) $ (126.2) 2019, this includes payments to Thomson Reuters under the Transition Services Provision for income taxes 4.3 1.6 13.7 5.6 Agreement. Depreciation and amortization 68.6 43.9 176.2 145.2 2. Includes costs incurred in connection with and after our separation from Thomson Reuters in 2016 relating to the implementation of our standalone Interest, net 20.3 23.4 72.3 93.9 company infrastructure and related cost-savings initiatives. These costs include 1 Transition services agreement costs (0.1) 2.7 0.6 10.5 mainly transition consulting, technology infrastructure, personnel and severance expenses relating to our standalone company infrastructure, which are recorded 2 Transition, transformation and integration expense 0.2 11.5 3.8 25.3 in Transition, integration, and other related expenses line-item of our income 3 Deferred revenues adjustment 2.1 0.1 7.4 0.4 statement, as well as expenses related to the restructuring and transformation of our business following our separation from Thomson Reuters in 2016, mainly 4 Transaction related costs 34.9 8.6 70.2 42.1 related to the integration of separate business units into one functional Share-based compensation expense 6.8 9.6 31.1 46.7 organization and enhancements in our technology. 5 Restructuring 3.2 — 26.8 — 3. Reflects the deferred revenues adjustment as a result of purchase accounting. Legal settlement — (39.4) — (39.4) 4. Includes costs incurred to complete business combination transactions, including 6 Other 5.1 4.2 (2.8) 5.5 acquisitions, dispositions and capital market activities and include advisory, legal, and other professional and consulting costs. Adjusted EBITDA $ 108.2 $ 77.0 $ 286.6 $ 209.6 5. Reflects costs incurred in connection with the initiative, following our merger Adjusted EBITDA Margin 37.8 % 31.7 % 35.6 % 29.1 % with Churchill Capital Corp in 2019, to streamline our operations by simplifying our organization and focusing on two product groups. This also includes restructuring related costs following the acquisition of DRG in 2020. 6. Includes primarily the net impact of foreign exchange gains and losses related to the re-measurement of balances and other items that do not reflect our ongoing operating performance. 17
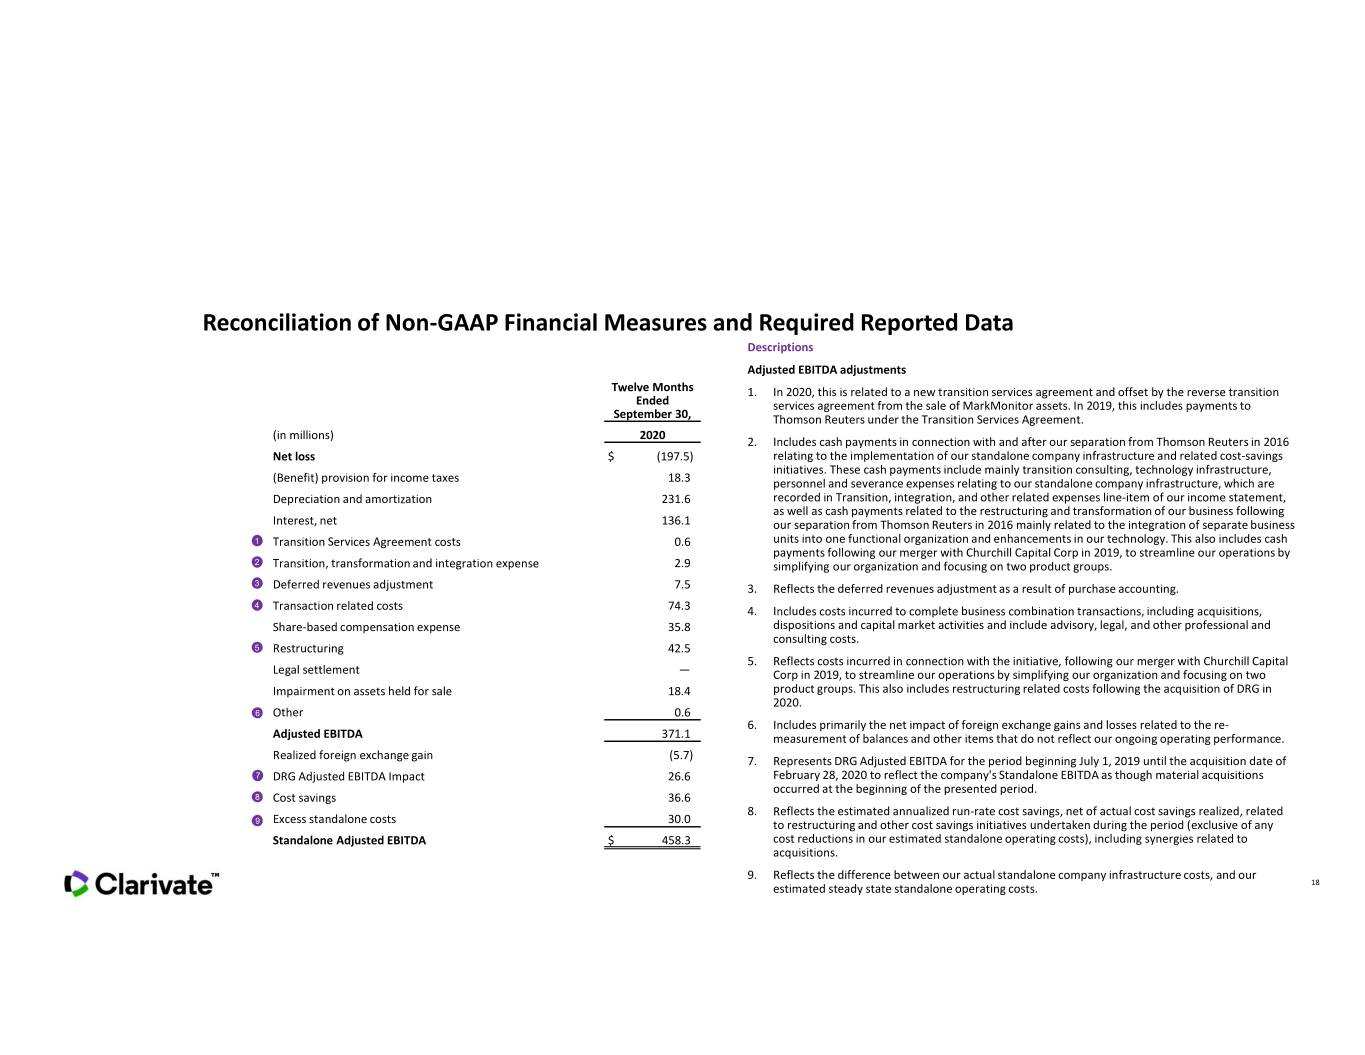

 
Reconciliation of Non-GAAP Financial Measures and Required Reported Data Descriptions Adjusted EBITDA adjustments Twelve Months 1. In 2020, this is related to a new transition services agreement and offset by the reverse transition Ended services agreement from the sale of MarkMonitor assets. In 2019, this includes payments to September 30, Thomson Reuters under the Transition Services Agreement. (in millions) 2020 2. Includes cash payments in connection with and after our separation from Thomson Reuters in 2016 Net loss $ (197.5) relating to the implementation of our standalone company infrastructure and related cost-savings initiatives. These cash payments include mainly transition consulting, technology infrastructure, (Benefit) provision for income taxes 18.3 personnel and severance expenses relating to our standalone company infrastructure, which are Depreciation and amortization 231.6 recorded in Transition, integration, and other related expenses line-item of our income statement, as well as cash payments related to the restructuring and transformation of our business following Interest, net 136.1 our separation from Thomson Reuters in 2016 mainly related to the integration of separate business 1 Transition Services Agreement costs 0.6 units into one functional organization and enhancements in our technology. This also includes cash payments following our merger with Churchill Capital Corp in 2019, to streamline our operations by 2 Transition, transformation and integration expense 2.9 simplifying our organization and focusing on two product groups. 3 Deferred revenues adjustment 7.5 3. Reflects the deferred revenues adjustment as a result of purchase accounting. 4 Transaction related costs 74.3 4. Includes costs incurred to complete business combination transactions, including acquisitions, Share-based compensation expense 35.8 dispositions and capital market activities and include advisory, legal, and other professional and consulting costs. 5 Restructuring 42.5 5. Reflects costs incurred in connection with the initiative, following our merger with Churchill Capital Legal settlement — Corp in 2019, to streamline our operations by simplifying our organization and focusing on two Impairment on assets held for sale 18.4 product groups. This also includes restructuring related costs following the acquisition of DRG in 2020. 6 Other 0.6 6. Includes primarily the net impact of foreign exchange gains and losses related to the re- Adjusted EBITDA 371.1 measurement of balances and other items that do not reflect our ongoing operating performance. Realized foreign exchange gain (5.7) 7. Represents DRG Adjusted EBITDA for the period beginning July 1, 2019 until the acquisition date of 7 DRG Adjusted EBITDA Impact 26.6 February 28, 2020 to reflect the company's Standalone EBITDA as though material acquisitions occurred at the beginning of the presented period. 8 Cost savings 36.6 8. Reflects the estimated annualized run-rate cost savings, net of actual cost savings realized, related 9 Excess standalone costs 30.0 to restructuring and other cost savings initiatives undertaken during the period (exclusive of any Standalone Adjusted EBITDA $ 458.3 cost reductions in our estimated standalone operating costs), including synergies related to acquisitions. 9. Reflects the difference between our actual standalone company infrastructure costs, and our 18 estimated steady state standalone operating costs.
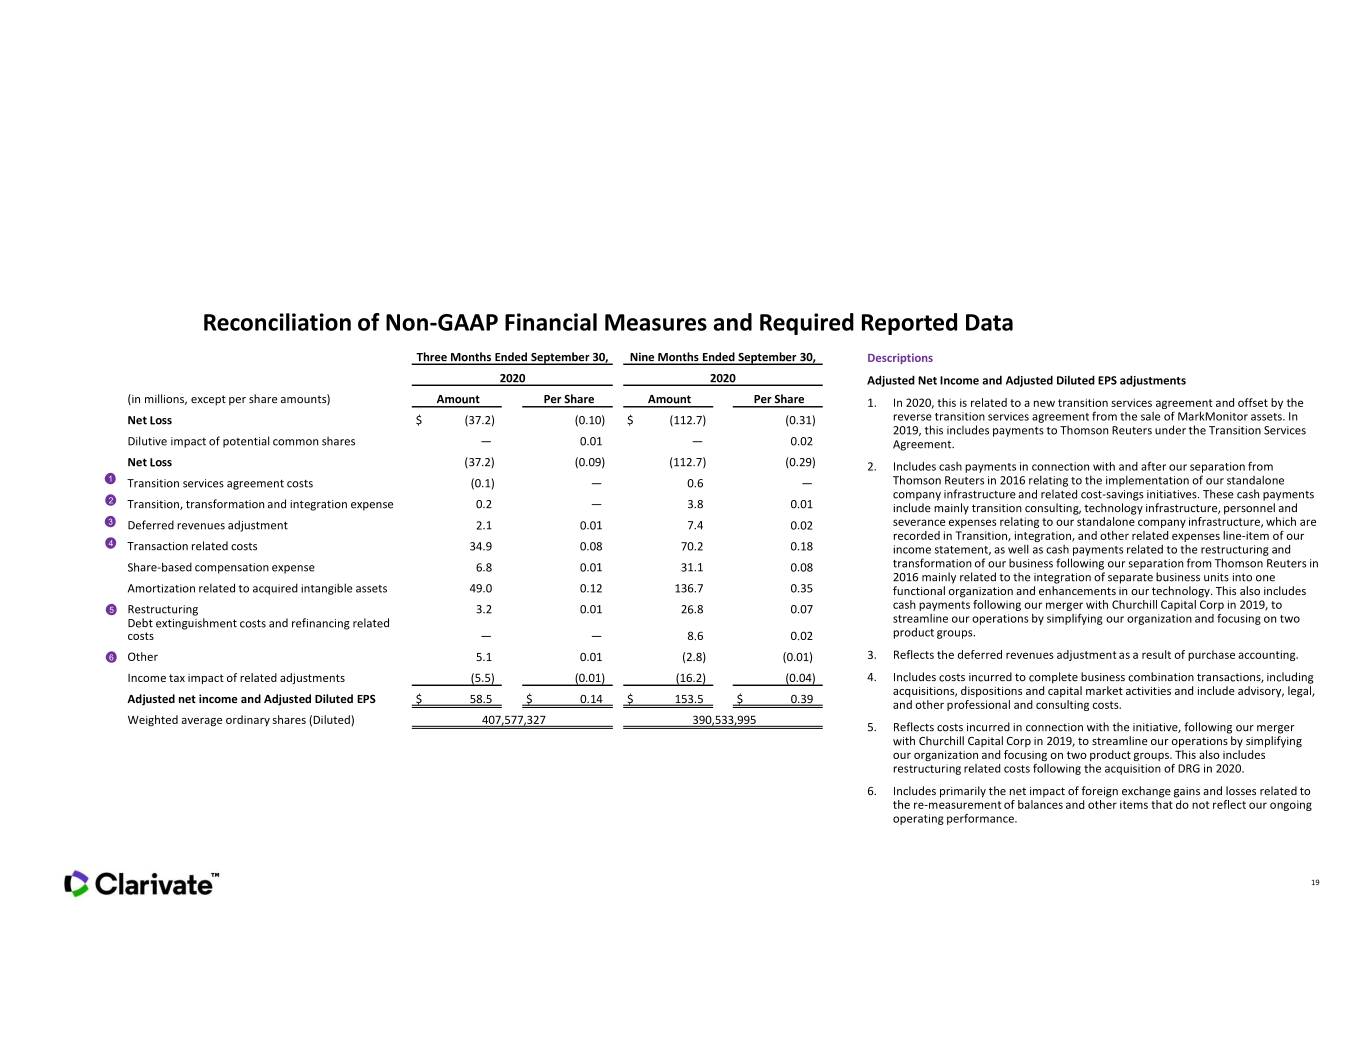

 
Reconciliation of Non-GAAP Financial Measures and Required Reported Data Three Months Ended September 30, Nine Months Ended September 30, Descriptions 2020 2020 Adjusted Net Income and Adjusted Diluted EPS adjustments (in millions, except per share amounts) Amount Per Share Amount Per Share 1. In 2020, this is related to a new transition services agreement and offset by the Net Loss $ (37.2) (0.10) $ (112.7) (0.31) reverse transition services agreement from the sale of MarkMonitor assets. In 2019, this includes payments to Thomson Reuters under the Transition Services Dilutive impact of potential common shares — 0.01 — 0.02 Agreement. Net Loss (37.2) (0.09) (112.7) (0.29) 2. Includes cash payments in connection with and after our separation from 1 Transition services agreement costs (0.1) — 0.6 — Thomson Reuters in 2016 relating to the implementation of our standalone 2 company infrastructure and related cost-savings initiatives. These cash payments Transition, transformation and integration expense 0.2 — 3.8 0.01 include mainly transition consulting, technology infrastructure, personnel and 3 Deferred revenues adjustment 2.1 0.01 7.4 0.02 severance expenses relating to our standalone company infrastructure, which are recorded in Transition, integration, and other related expenses line-item of our 4 Transaction related costs 34.9 0.08 70.2 0.18 income statement, as well as cash payments related to the restructuring and Share-based compensation expense 6.8 0.01 31.1 0.08 transformation of our business following our separation from Thomson Reuters in 2016 mainly related to the integration of separate business units into one Amortization related to acquired intangible assets 49.0 0.12 136.7 0.35 functional organization and enhancements in our technology. This also includes 5 Restructuring 3.2 0.01 26.8 0.07 cash payments following our merger with Churchill Capital Corp in 2019, to Debt extinguishment costs and refinancing related streamline our operations by simplifying our organization and focusing on two costs — — 8.6 0.02 product groups. 6 Other 5.1 0.01 (2.8) (0.01) 3. Reflects the deferred revenues adjustment as a result of purchase accounting. Income tax impact of related adjustments (5.5) (0.01) (16.2) (0.04) 4. Includes costs incurred to complete business combination transactions, including acquisitions, dispositions and capital market activities and include advisory, legal, Adjusted net income and Adjusted Diluted EPS $ 58.5 $ 0.14 $ 153.5 $ 0.39 and other professional and consulting costs. Weighted average ordinary shares (Diluted) 407,577,327 390,533,995 5. Reflects costs incurred in connection with the initiative, following our merger with Churchill Capital Corp in 2019, to streamline our operations by simplifying our organization and focusing on two product groups. This also includes restructuring related costs following the acquisition of DRG in 2020. 6. Includes primarily the net impact of foreign exchange gains and losses related to the re-measurement of balances and other items that do not reflect our ongoing operating performance. 19
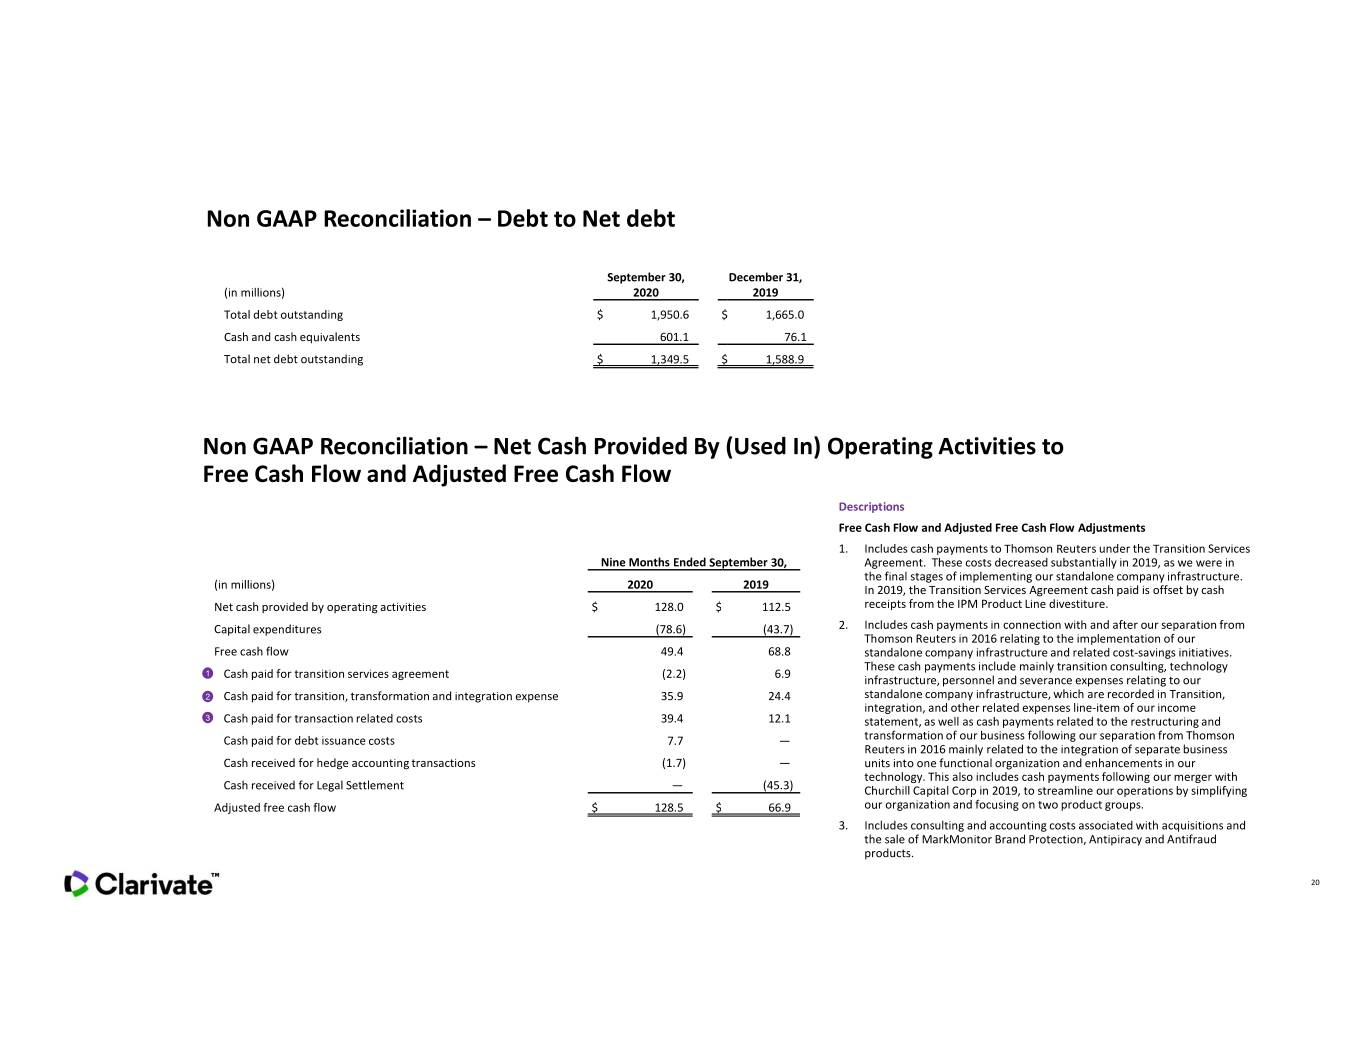

 
Non GAAP Reconciliation – Debt to Net debt September 30, December 31, (in millions) 2020 2019 Total debt outstanding $ 1,950.6 $ 1,665.0 Cash and cash equivalents 601.1 76.1 Total net debt outstanding $ 1,349.5 $ 1,588.9 Non GAAP Reconciliation – Net Cash Provided By (Used In) Operating Activities to Free Cash Flow and Adjusted Free Cash Flow Descriptions Free Cash Flow and Adjusted Free Cash Flow Adjustments 1. Includes cash payments to Thomson Reuters under the Transition Services Nine Months Ended September 30, Agreement. These costs decreased substantially in 2019, as we were in the final stages of implementing our standalone company infrastructure. (in millions) 2020 2019 In 2019, the Transition Services Agreement cash paid is offset by cash Net cash provided by operating activities $ 128.0 $ 112.5 receipts from the IPM Product Line divestiture. Capital expenditures (78.6) (43.7) 2. Includes cash payments in connection with and after our separation from Thomson Reuters in 2016 relating to the implementation of our Free cash flow 49.4 68.8 standalone company infrastructure and related cost-savings initiatives. These cash payments include mainly transition consulting, technology 1 Cash paid for transition services agreement (2.2) 6.9 infrastructure, personnel and severance expenses relating to our 2 Cash paid for transition, transformation and integration expense 35.9 24.4 standalone company infrastructure, which are recorded in Transition, integration, and other related expenses line-item of our income 3 Cash paid for transaction related costs 39.4 12.1 statement, as well as cash payments related to the restructuring and Cash paid for debt issuance costs 7.7 — transformation of our business following our separation from Thomson Reuters in 2016 mainly related to the integration of separate business Cash received for hedge accounting transactions (1.7) — units into one functional organization and enhancements in our technology. This also includes cash payments following our merger with Cash received for Legal Settlement — (45.3) Churchill Capital Corp in 2019, to streamline our operations by simplifying Adjusted free cash flow $ 128.5 $ 66.9 our organization and focusing on two product groups. 3. Includes consulting and accounting costs associated with acquisitions and the sale of MarkMonitor Brand Protection, Antipiracy and Antifraud products. 20
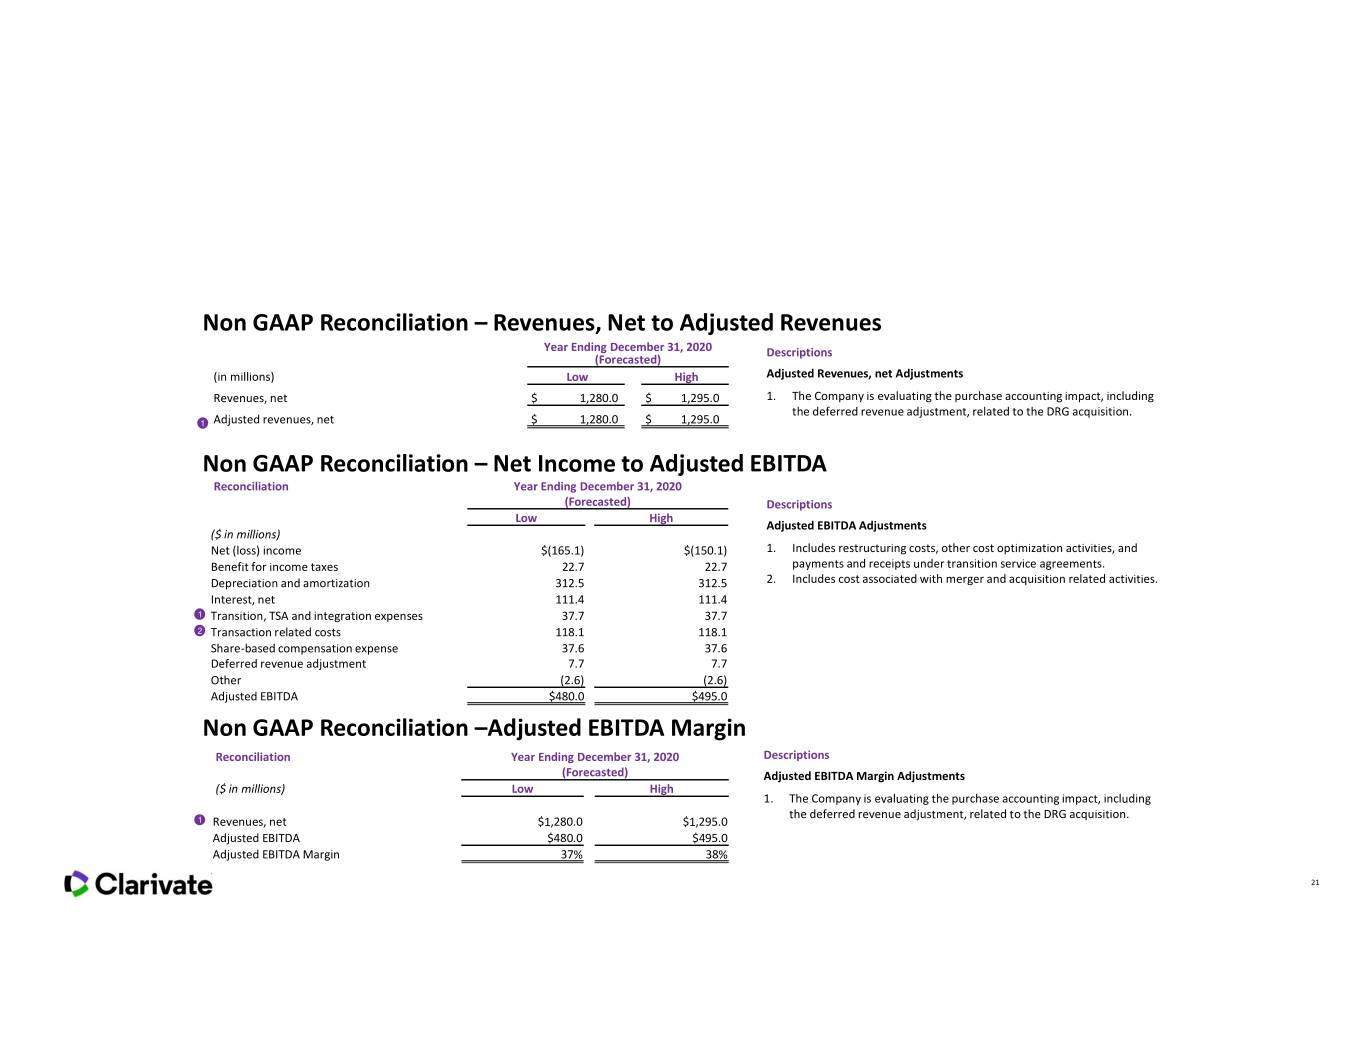

 
Non GAAP Reconciliation – Revenues, Net to Adjusted Revenues Year Ending December 31, 2020 Descriptions (Forecasted) (in millions) Low High Adjusted Revenues, net Adjustments Revenues, net $ 1,280.0 $ 1,295.0 1. The Company is evaluating the purchase accounting impact, including the deferred revenue adjustment, related to the DRG acquisition. 1 Adjusted revenues, net $ 1,280.0 $ 1,295.0 Non GAAP Reconciliation – Net Income to Adjusted EBITDA Reconciliation Year Ending December 31, 2020 (Forecasted) Descriptions Low High Adjusted EBITDA Adjustments ($ in millions) Net (loss) income $(165.1) $(150.1) 1. Includes restructuring costs, other cost optimization activities, and Benefit for income taxes 22.7 22.7 payments and receipts under transition service agreements. Depreciation and amortization 312.5 312.5 2. Includes cost associated with merger and acquisition related activities. Interest, net 111.4 111.4 1 Transition, TSA and integration expenses 37.7 37.7 2 Transaction related costs 118.1 118.1 Share-based compensation expense 37.6 37.6 Deferred revenue adjustment 7.7 7.7 Other (2.6) (2.6) Adjusted EBITDA $480.0 $495.0 Non GAAP Reconciliation –Adjusted EBITDA Margin Reconciliation Year Ending December 31, 2020 Descriptions (Forecasted) Adjusted EBITDA Margin Adjustments ($ in millions) Low High 1. The Company is evaluating the purchase accounting impact, including the deferred revenue adjustment, related to the DRG acquisition. 1 Revenues, net $1,280.0 $1,295.0 Adjusted EBITDA $480.0 $495.0 Adjusted EBITDA Margin 37% 38% 21
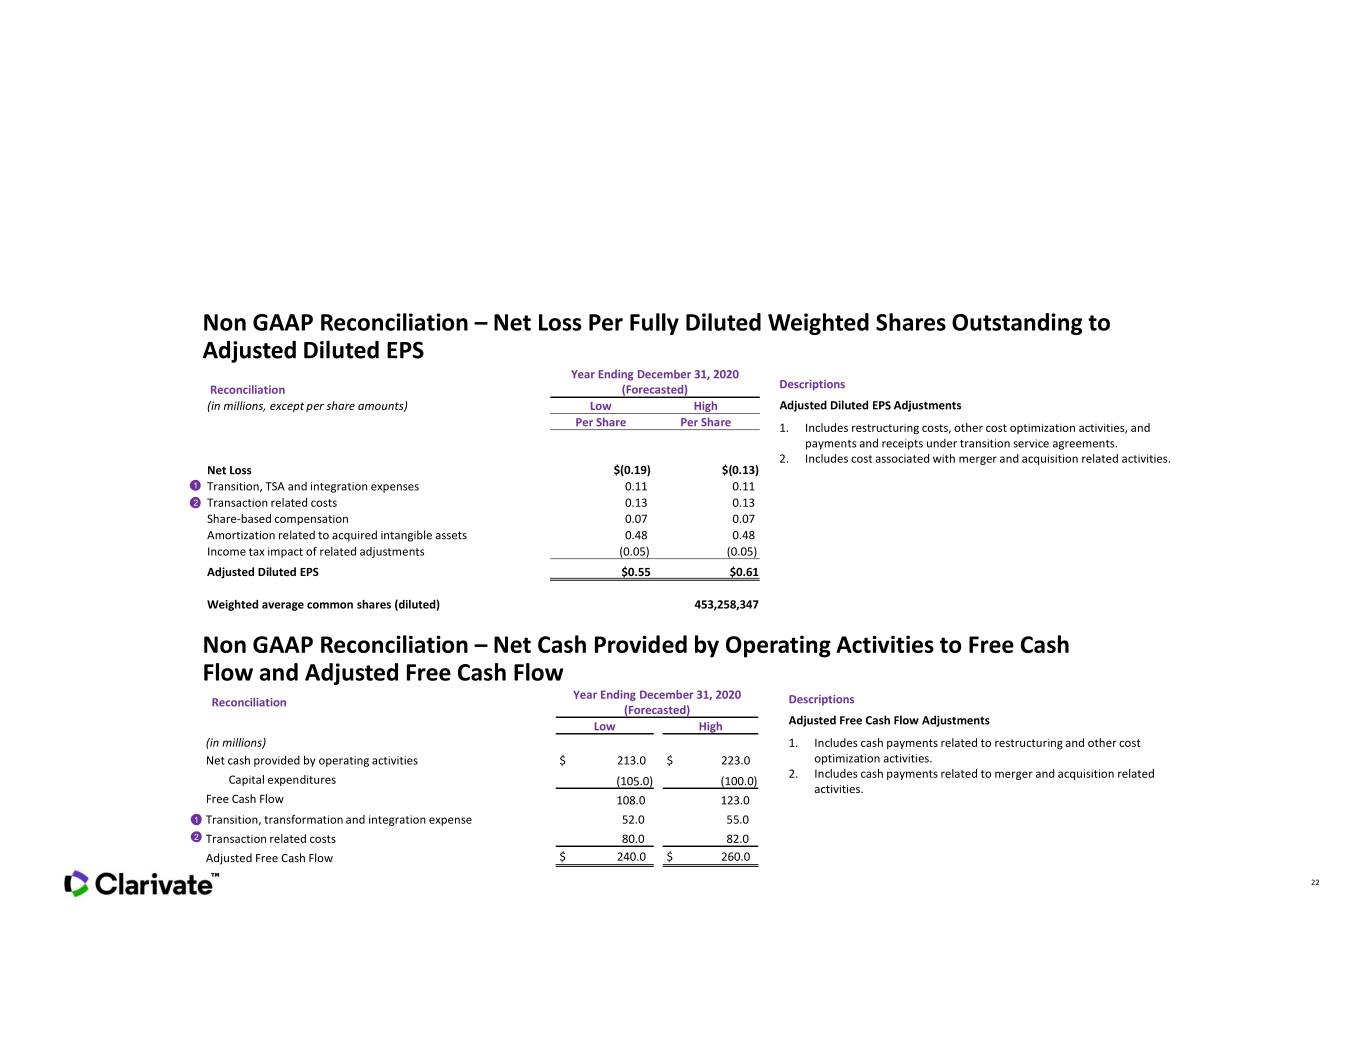

 
Non GAAP Reconciliation – Net Loss Per Fully Diluted Weighted Shares Outstanding to Adjusted Diluted EPS Year Ending December 31, 2020 Reconciliation (Forecasted) Descriptions (in millions, except per share amounts) Low High Adjusted Diluted EPS Adjustments Per Share Per Share 1. Includes restructuring costs, other cost optimization activities, and payments and receipts under transition service agreements. 2. Includes cost associated with merger and acquisition related activities. Net Loss $(0.19) $(0.13) 1 Transition, TSA and integration expenses 0.11 0.11 2 Transaction related costs 0.13 0.13 Share-based compensation 0.07 0.07 Amortization related to acquired intangible assets 0.48 0.48 Income tax impact of related adjustments (0.05) (0.05) Adjusted Diluted EPS $0.55 $0.61 Weighted average common shares (diluted) 453,258,347 Non GAAP Reconciliation – Net Cash Provided by Operating Activities to Free Cash Flow and Adjusted Free Cash Flow Year Ending December 31, 2020 Reconciliation Descriptions (Forecasted) Low High Adjusted Free Cash Flow Adjustments (in millions) 1. Includes cash payments related to restructuring and other cost Net cash provided by operating activities $ 213.0 $ 223.0 optimization activities. 2. Includes cash payments related to merger and acquisition related Capital expenditures (105.0) (100.0) activities. Free Cash Flow 108.0 123.0 1 Transition, transformation and integration expense 52.0 55.0 2 Transaction related costs 80.0 82.0 Adjusted Free Cash Flow $ 240.0 $ 260.0 22