clw-20210225FALSE000144123600014412362020-01-012020-09-30
UNITED STATES
SECURITIES AND EXCHANGE COMMISSION
Washington, D.C. 20549
FORM 8-K
CURRENT REPORT
Pursuant to Section 13 or 15(d) of the
Securities Exchange Act of 1934
Date of Report (Date of earliest event reported): February 25, 2021
CLEARWATER PAPER CORPORATION
(Exact name of registrant as specified in its charter)
| | | | | | | | |
| Delaware | 001-34146 | 20-3594554 |
(State or other jurisdiction of incorporation) | (Commission File Number) | (IRS Employer Identification No.) |
| | | | | | | | | | | |
| 601 West Riverside, | Suite 1100 | | 99201 |
| Spokane, | WA | |
| (Address of principal executive offices) | | (Zip Code) |
(509) 344-5900
(Registrant’s telephone number, including area code)
Not Applicable
(Former name of former address, if changed since last report)
Check the appropriate box below if the Form 8-K filing is intended to simultaneously satisfy the filing obligation of the registrant under any of the following provisions (see General Instructions A.2. below):
☐ Written communications pursuant to Rule 425 under the Securities Act (17 CFR 230.425)
☐ Soliciting material pursuant to Rule 14a-12 under the Exchange Act (17 CFR 240.14a-12)
☐ Pre-commencement communications pursuant to Rule 14d-2(b) under the Exchange Act (17 CFR 240.14d-2(b))
☐ Pre-commencement communications pursuant to Rule 13e-4(c) under the Exchange Act (17 CFR 240.13e-4(c))
Securities registered pursuant to Section 12(b) of the Act:
| | | | | | | | |
| Title of each class | Trading Symbol(s) | Name of each exchanged on which registered |
| Common Stock, par value $0.0001 per share | CLW | New York Stock Exchange |
Indicate by check mark whether the registrant is an emerging growth company as defined in Rule 405 of the Securities Act of 1933 (§ 230.405 of this chapter) or Rule 12b-2 of the Securities Exchange Act of 1934 (§ 240.12b-2 of this chapter).
Emerging growth company ☐
If an emerging growth company, indicate by check mark if the registrant has elected not to use the extended transition period for complying with any new or revised financial accounting standards provided pursuant to Section 13(a) of the Exchange Act. ☐
Item 2.02. Results of Operations and Financial Condition.
On February 25, 2021, Clearwater Paper Corporation (the “Company”) announced its results of operations for the fourth quarter and year ending December 31, 2020. A copy of the press release containing this announcement is furnished as Exhibit 99.1 hereto. In addition, a copy of the Company’s Fourth Quarter 2020 Earnings Release Materials is furnished as Exhibit 99.2 hereto.
In addition to disclosing financial results calculated in accordance with U.S. generally accepted accounting principles (“GAAP”), the following are disclosed the attached Adjusted EBITDA which is defined as earnings before interest expense, taxes, depreciation and amortization, other operating credits and charges, net and other non-operating items. Adjusted EBITDA margin, which is calculated by dividing Adjusted EBITDA from continuing operations by net sales and discloses Adjusted income from operations which is calculated by excluding from income from operations, other operating credits and charges, net, and adjusts for a normalized tax rate. Adjusted EBITDA and Adjusted income from operations are not a substitute for the GAAP measure of net income or other GAAP measures of operating performance.
The Company discloses Adjusted EBITDA in the attached because it is used as important supplemental measure of its performance and believes that similarly-titled measures are frequently used by securities analysts, investors and other interested persons in the evaluation of companies in its industry, some of which present similarly-titled measures when reporting their results. The Company uses Adjusted EBITDA to evaluate its performance as compared to other companies in its industry that have different financing and capital structures and/or tax rates. It should be noted that companies calculate similarly-titled measures differently and, therefore, as presented by the Company may not be comparable to similarly-titled measures reported by other companies. In addition, Adjusted EBITDA has material limitations as a performance measure because it excludes interest expense, income tax expense and depreciation and amortization which are necessary to operate the Company's business or which the Company otherwise incurred or experienced in connection with the operation of its business.
The Company believes that Adjusted income from operations, which excludes other operating credits and charges, net, adjusted for a normalized tax rate is a useful measure for evaluating our ability to generate earnings and that providing this measure will allow investors to more readily compare the earnings referred to in the press release to the Company's earnings for past and future periods. The Company believes that this measure is particularly useful where the amounts of the excluded items are not consistent between the periods presented. It should be noted that other companies may present similarly-titled measures differently and, therefore, as presented by the Company may not be comparable to similarly-titled measures reported by other companies. In addition, Adjusted income from operations has material limitations as a performance measure because it excludes items that are actually incurred or experienced in connection with the operations of the Company's business.
Item 7.01 Regulation FD Disclosure
Effective beginning in the first quarter of 2021, the Company's financial results will reflect inter-segment baled pulp sales at market prices and will record external pulp sales within the segment that produces such pulp. This change is intended to align with the Company's revised internal business and segment evaluation processes and to provide an enhanced view of the results of each segment. This realignment has no impact on the Company's historical consolidated balance sheet, statement of operations or cash flows. To provide historical information on a basis consistent with the new reporting methodology, the Company has recast certain historical segment information in the attached Exhibit 99.3 for the years ended December 31, 2020, 2019 and 2018, as well as the quarterly periods in the years ended December 31, 2020 and 2019. This summary segment financial information is unaudited and subject to adjustment in future public filings by the Company.
The information in Item 2.02 and this item 7.01, including Exhibits 99.1, 99.2 and 99.3, shall not be deemed “filed” for purposes of Section 18 of the Securities Exchange Act of 1934, as amended (the “Exchange Act”), nor shall it be deemed incorporated by reference in any filing under the Securities Act of 1933, as amended, or the Exchange Act, except as shall be expressly set forth by specific reference in such filing.
Item 9.01. Financial Statements and Exhibits
(d) Exhibit Index
| | | | | |
| Exhibit | Description |
| 99.1 | |
| 99.2 | |
| 99.3 | |
SIGNATURES
Pursuant to the requirements of the Securities Exchange Act of 1934, the registrant has duly caused this report to be signed on its behalf by the undersigned hereunto duly authorized.
Date: February 25, 2021
CLEARWATER PAPER CORPORATION
| | | | | |
| By: | /s/ Rebecca A. Barckley |
| Rebecca A. Barckley, Vice President, Corporate Controller |
| (Principal Accounting Officer) |
Exhibit 99.1
Clearwater Paper Reports Fourth Quarter and Year End 2020 Results
SPOKANE, Wash.--(BUSINESS WIRE)-- February 25, 2021 -- Clearwater Paper Corporation (NYSE:CLW), a premier supplier of quality consumer tissue and bleached paperboard today reported financial results for the fourth quarter and year ended December 31, 2020.
2020 FOURTH QUARTER HIGHLIGHTS
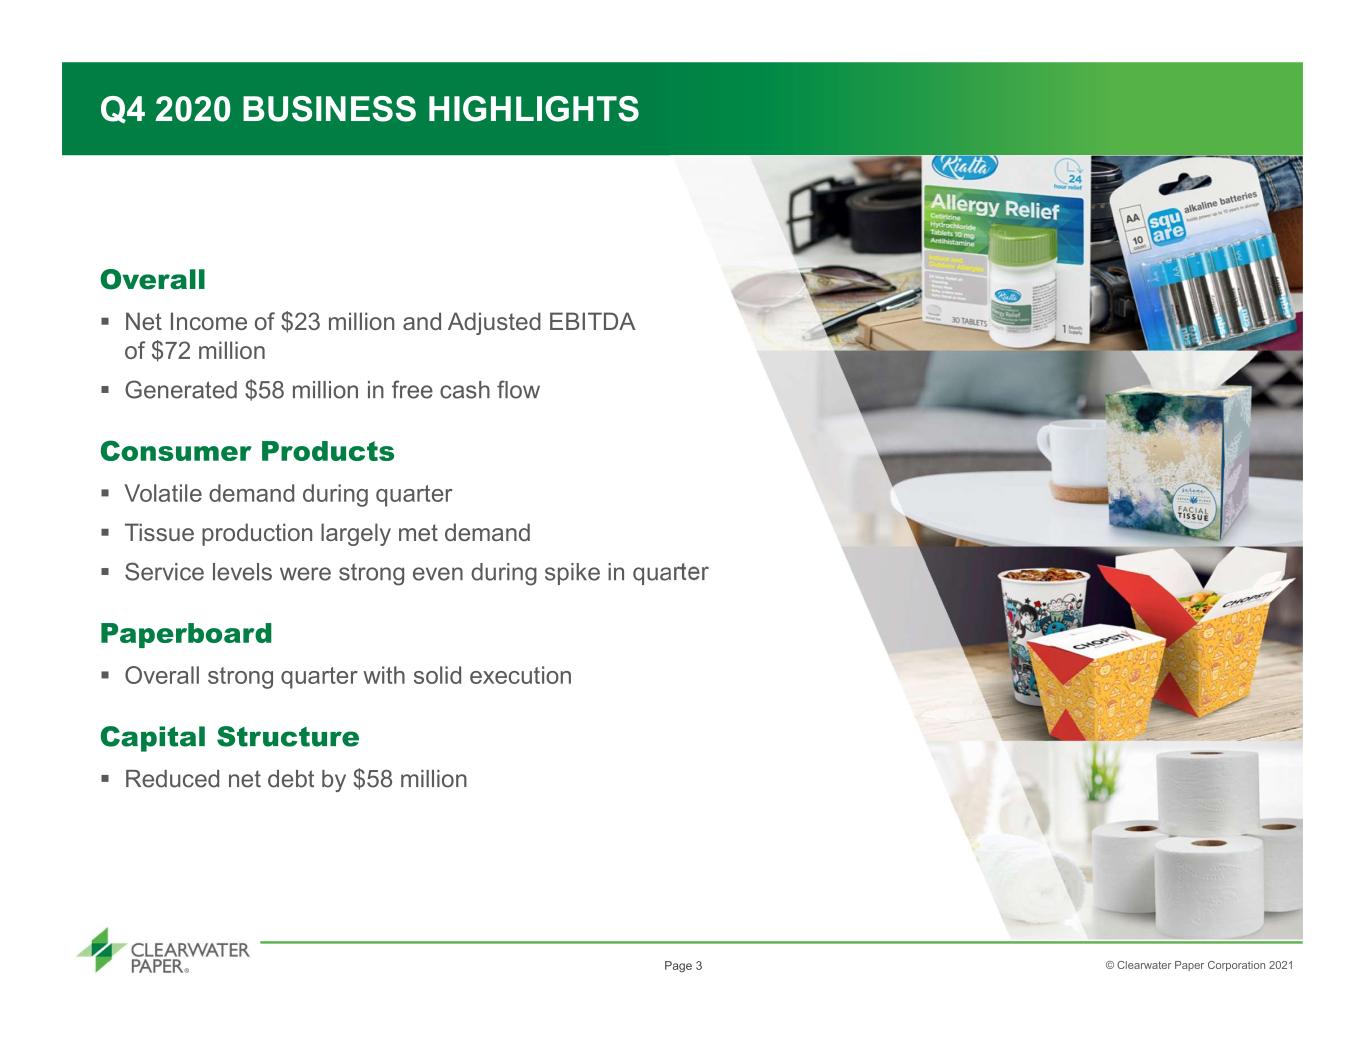
•Delivered strong performance due to continued elevated demand for tissue products and solid operational execution
•Achieved net income of $23 million, or $1.34 per diluted share and Adjusted EBITDA of $72 million
•Net sales of $453 million, up 4.0% compared to the fourth quarter of 2019
•Net debt reduction of $58 million
2020 FULL YEAR HIGHLIGHTS
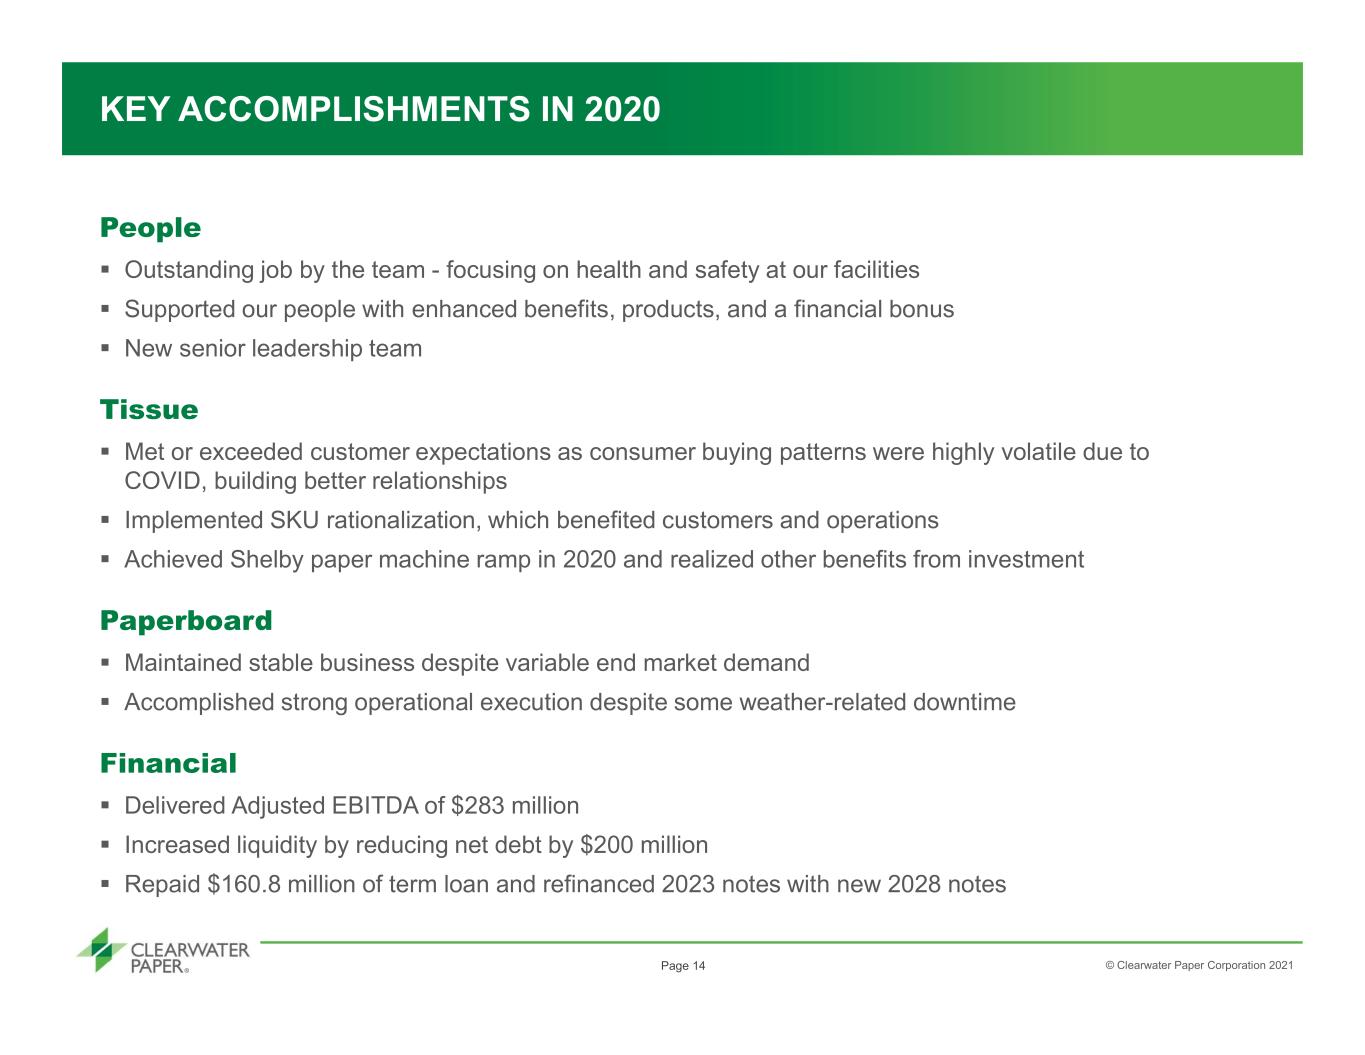
•Supported our customers and consumers during COVID volatility and delivered net income of $77 million or $4.61 per diluted share and Adjusted EBITDA of $283 million.
•Net sales of $1.9 billion, up 6.1% compared to 2019
•Net debt reduction of $200 million
"Our people delivered exceptional results while persevering through significant professional and personal challenges in 2020, and I could not be prouder of the team," said Arsen Kitch, president and chief executive officer. “We delivered an outstanding year by focusing on our people and our customers. Our tissue business navigated through significant demand volatility, built better customer relationships, and ramped the new Shelby paper machine. Our paperboard business maintained stability despite variable end market demand. This performance enabled us to reduce net debt and strengthen our balance sheet.”
OVERALL RESULTS
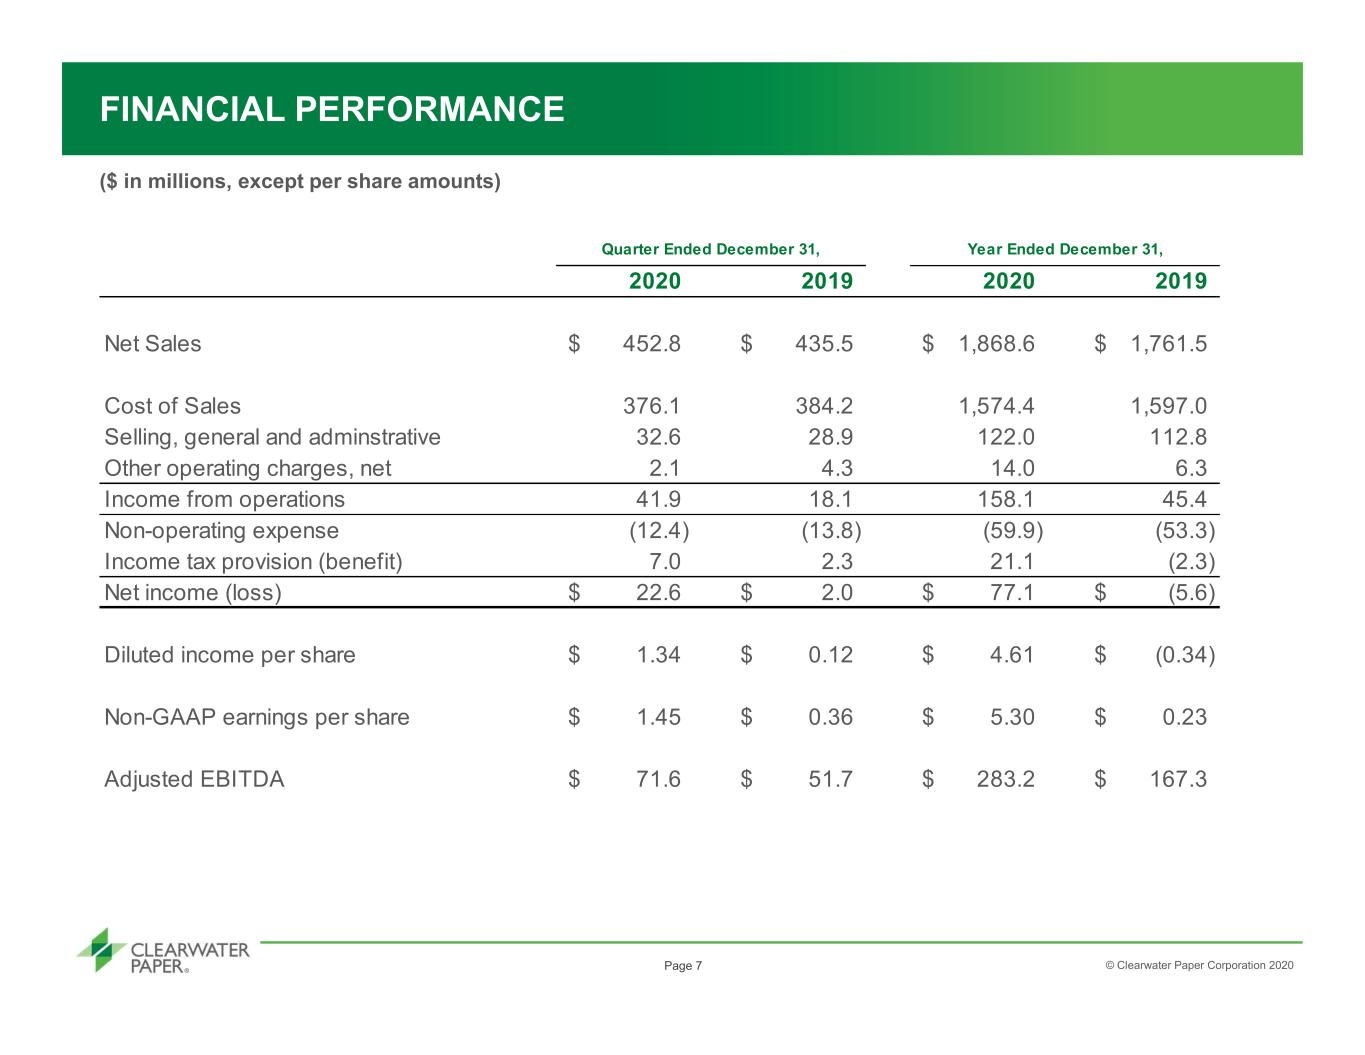
For the fourth quarter of 2020, Clearwater Paper reported net sales of $453 million, a 4.0% increase compared to net sales of $435 million reported in the fourth quarter of 2019. Net income for the fourth quarter of 2020 was $23 million, or $1.34 per diluted share, compared to net income in the fourth quarter of 2019 of $2 million, or $0.12 per diluted share. On a non-GAAP basis, Clearwater Paper reported adjusted net income in the fourth quarter of 2020 of $25 million, or $1.45 per diluted share, compared to fourth quarter 2019 adjusted net income of $6 million, or $0.37 per diluted share. Adjusted EBITDA for the quarter was $72 million compared to the fourth quarter of 2019 Adjusted EBITDA of $52 million.
For the full year 2020, Clearwater Paper reported net sales of $1.9 billion, a 6.1% increase compared to net sales of $1.8 billion for 2019. Net income for the full year was $77 million in 2020, or $4.61 per diluted share, compared to a net loss for 2019 of $6 million or $0.34 per diluted share. On a non-GAAP basis, Clearwater Paper reported adjusted net income for 2020 of $89 million, or $5.30 per diluted share, compared to 2019 adjusted net income of $4 million, or $0.23 per diluted share. Adjusted EBITDA for 2020 was $283 million, compared to 2019 Adjusted EBITDA of $167 million.
Consumer Products Segment
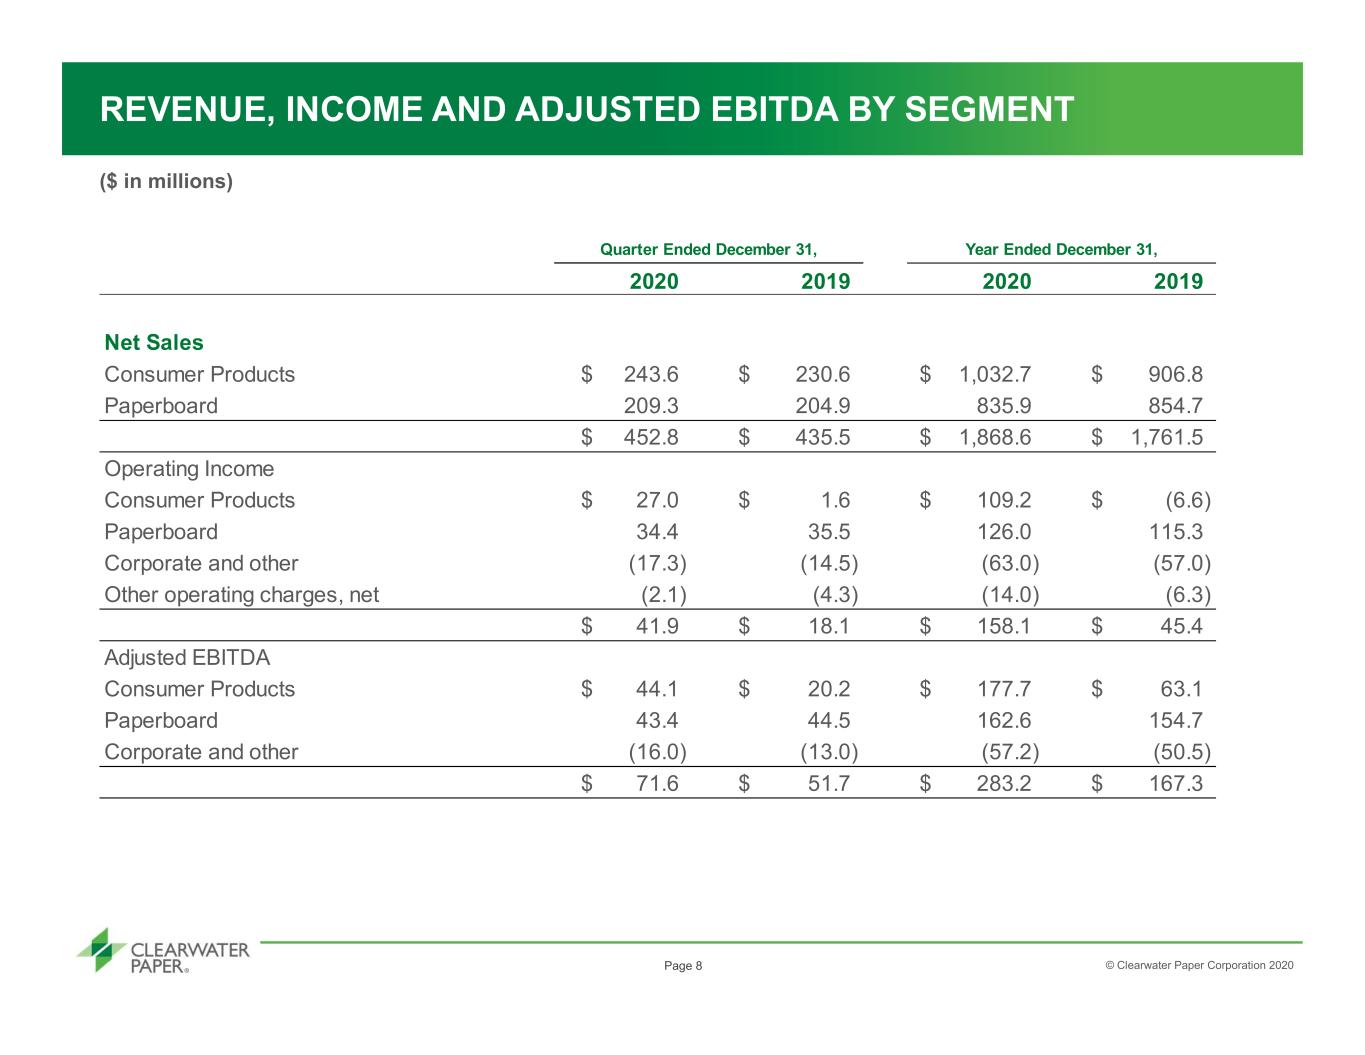
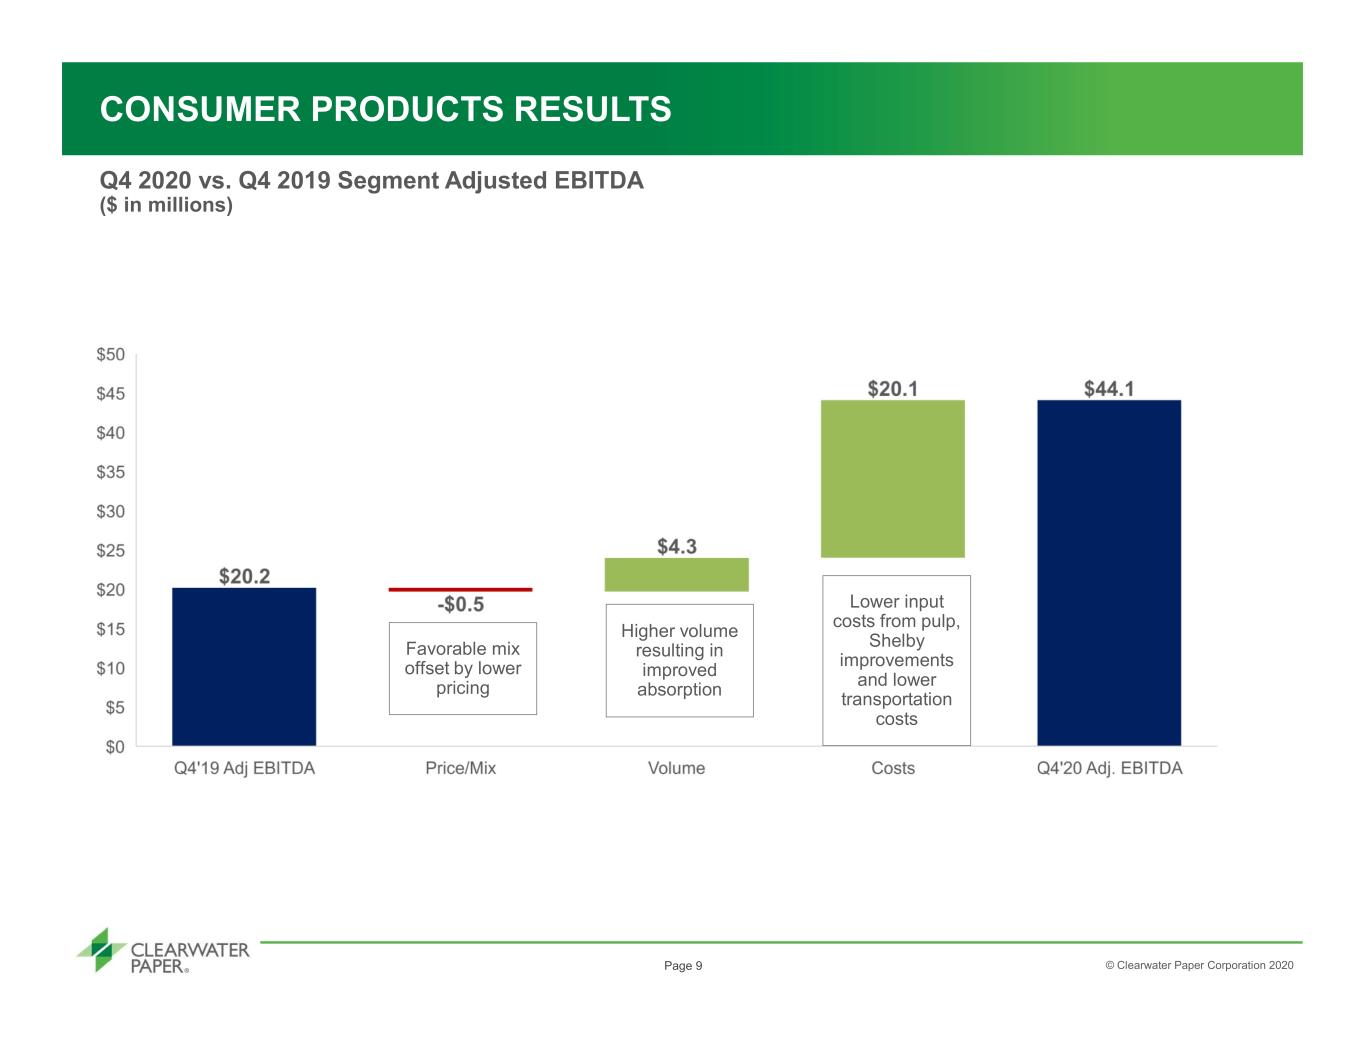
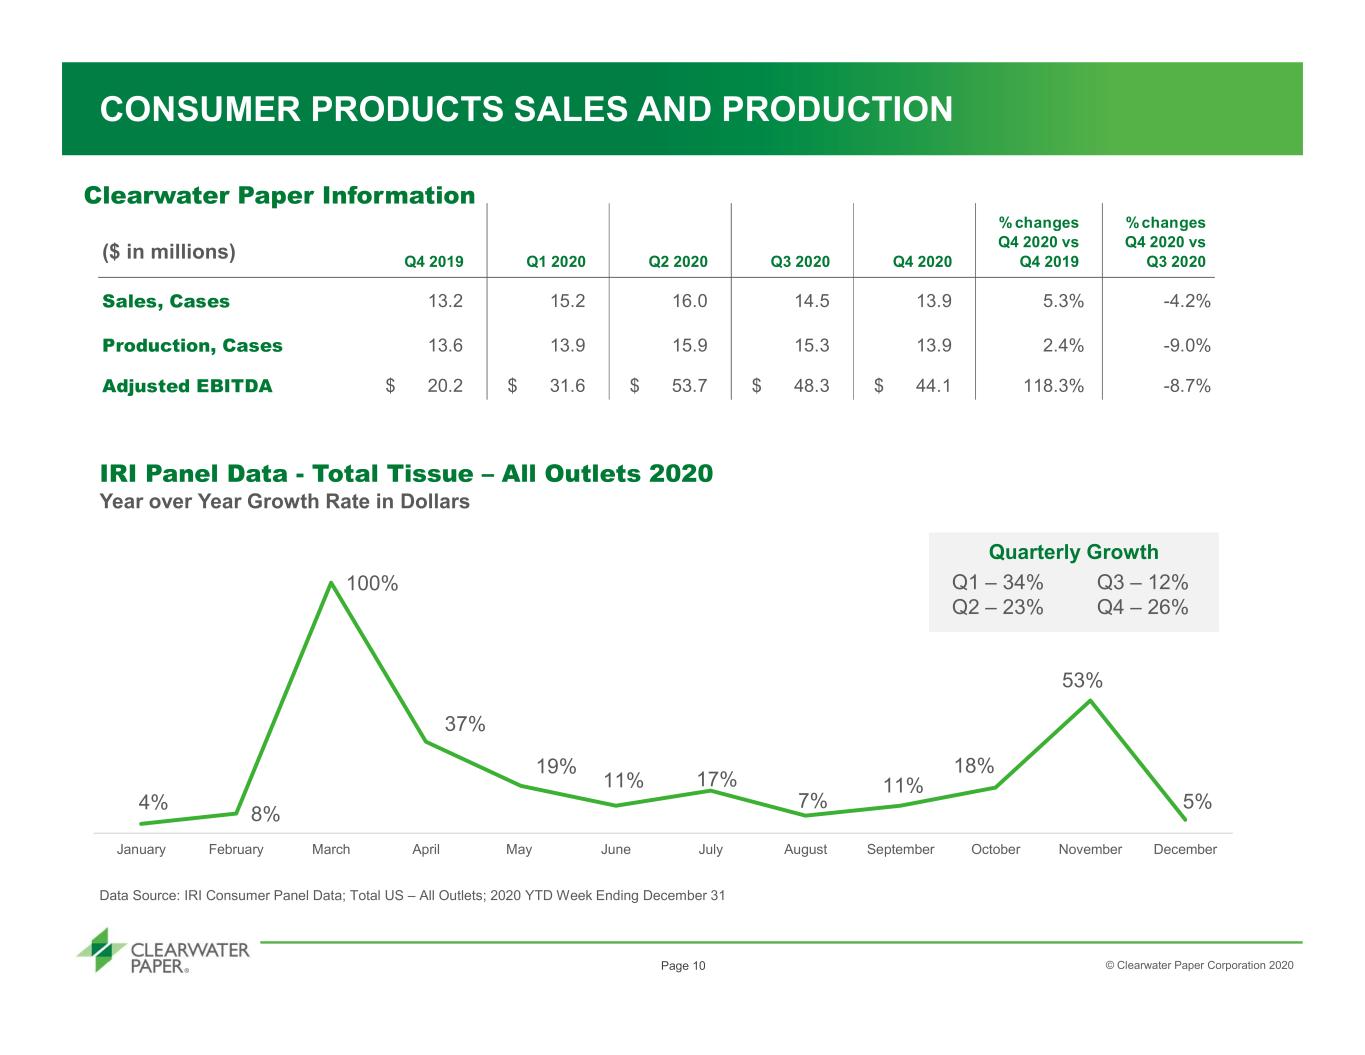
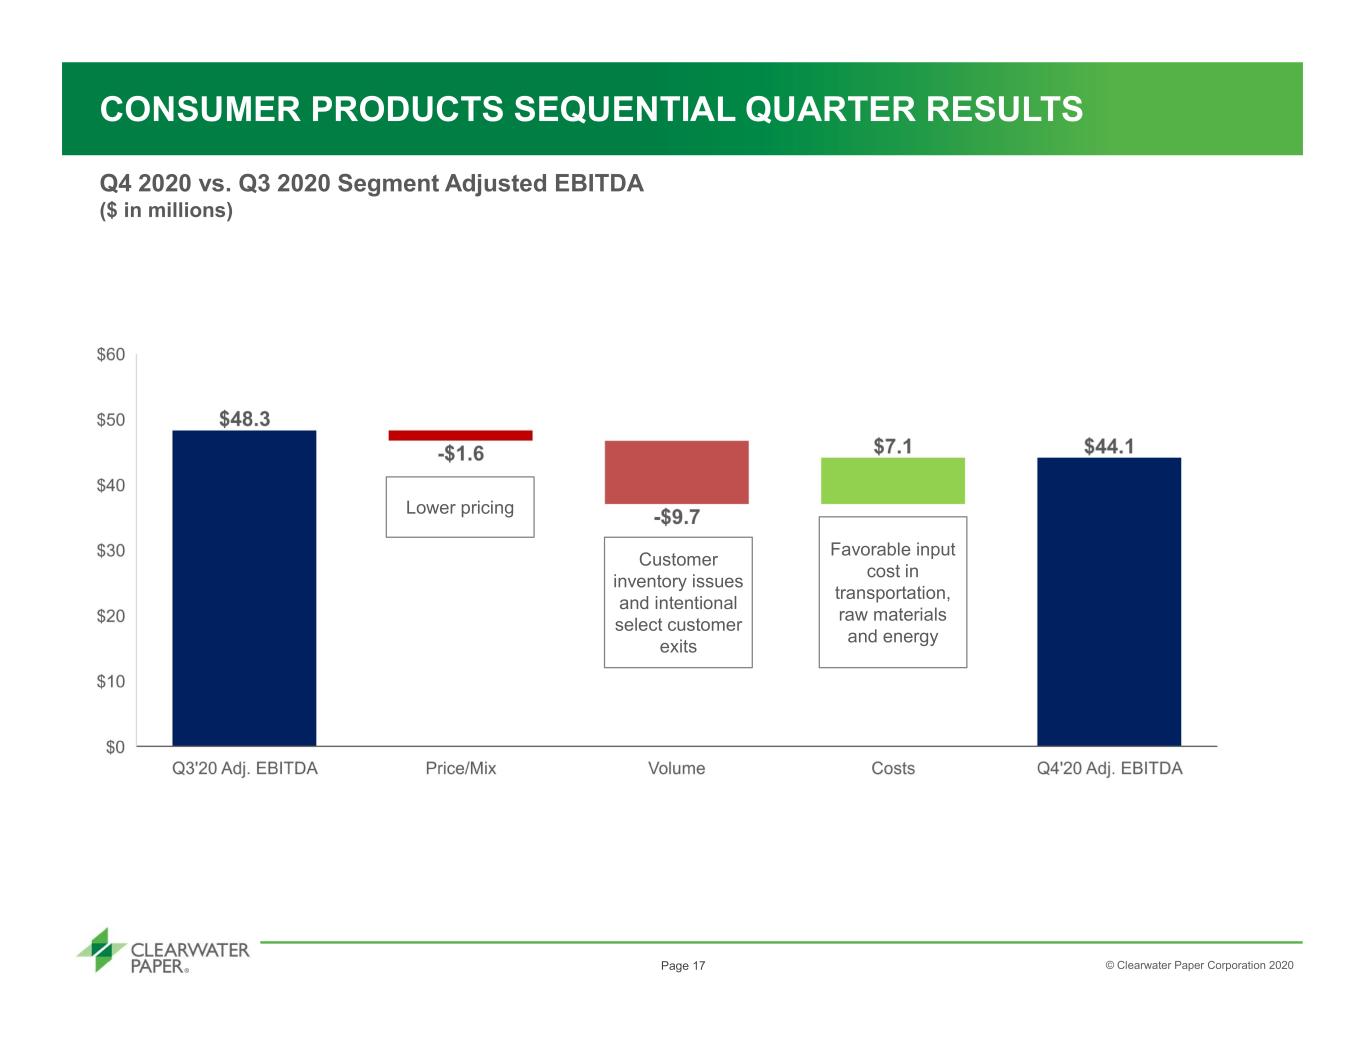
Net sales in the Consumer Products segment were $244 million for the fourth quarter of 2020, up 5.6% compared to the fourth quarter 2019 net sales of $231 million. In the fourth quarter of 2020, converted case shipments reached 13.9 million cases, an increase of 4% compared to 13.3 million cases shipped in the fourth quarter of 2019. Segment operating income for the fourth quarter of 2020 was $27 million compared to operating income of $2 million in the fourth quarter of 2019. Adjusted EBITDA for the segment was $44 million in the fourth quarter of 2020, up from $20 million in the fourth quarter of 2019. The increase in operating income and Adjusted EBITDA was primarily due to increased production and shipment volumes from elevated demand which drove improvement in fixed cost absorption. The segment also benefited from lower external pulp prices and freight costs.
Net sales in the Consumer Products segment were $1.0 billion for the full year 2020, up 14% compared to 2019 net sales of $907 million. For 2020, converted case shipments reached 60 million cases, an increase of 16% compared to 51 million cases shipped for 2019. Segment operating income for 2020 was $109 million, compared to operating loss of $7 million for 2019. Adjusted EBITDA for the segment was $178 million for 2020, up from $63 million for 2019.
Tissue Sales Volumes and Prices:
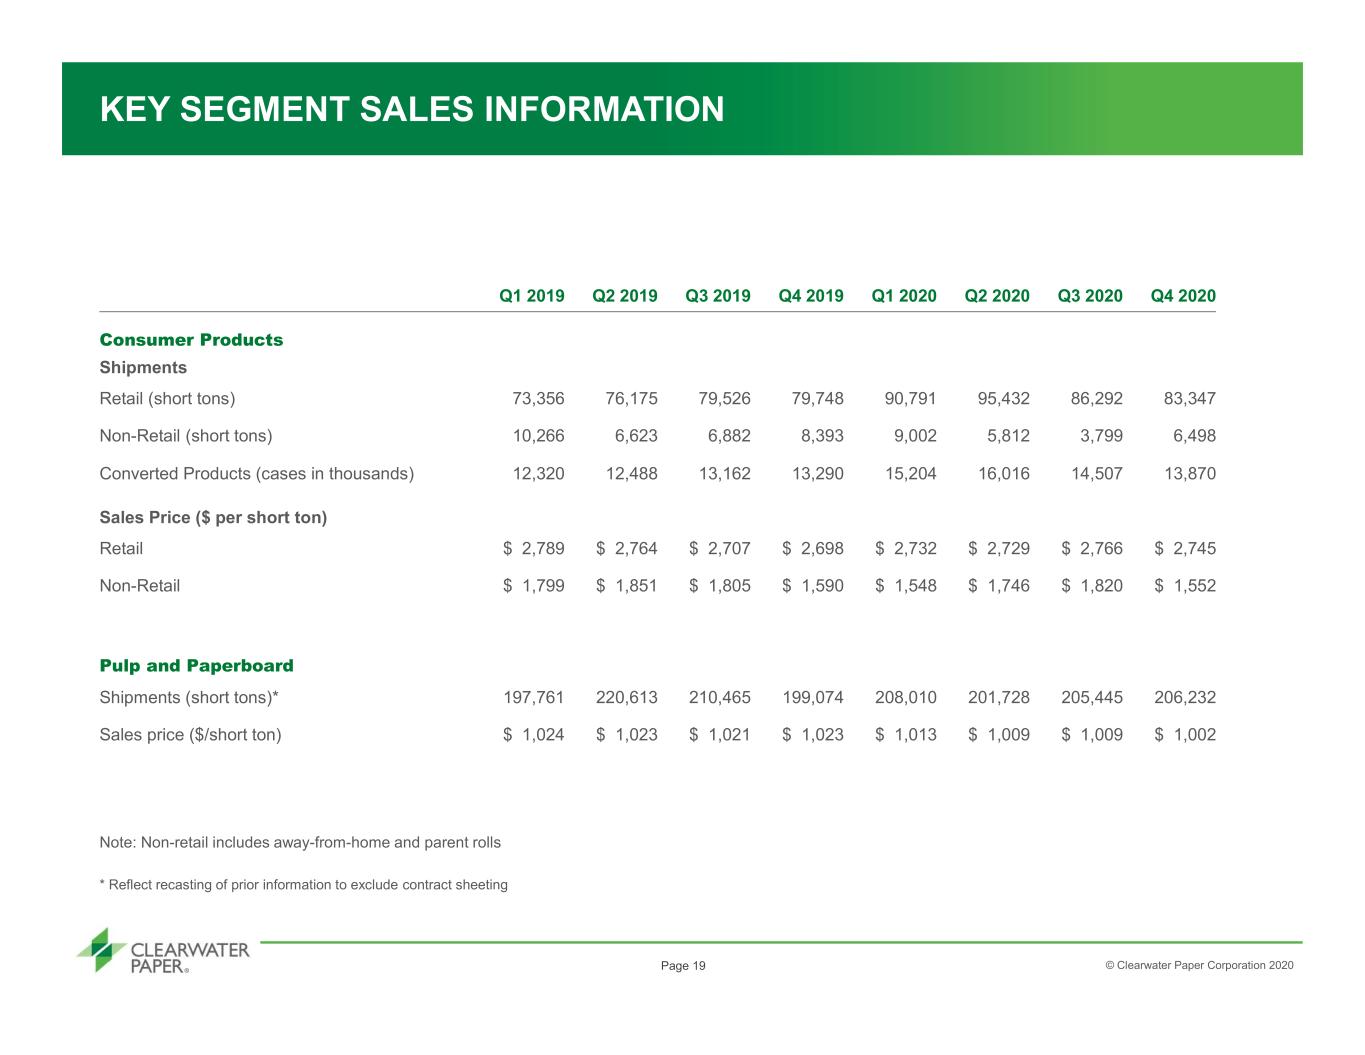
• Total tissue volumes sold were 89,845 tons in the fourth quarter of 2020, an increase of 2% compared to 88,141 tons
in the fourth quarter of 2019. Retail volumes represented 93% of total volumes sold in the fourth quarter of 2020, an increase from 90% in the fourth quarter of 2019. Total tissue volumes sold were 380,973 tons for the year ended of 2020, an increase of 12% compared to 340,969 tons for 2019. Retail volumes represented 93% of total volumes sold for 2020, an increase from 91% for 2019.
• Average retail tissue net selling prices increased 2% to $2,745 per ton in the fourth quarter of 2020, compared to $2,698 per ton in the fourth quarter of 2019. Average retail tissue net selling prices increased 0.1% to $2,742 per ton for 2020, compared to $2,738 per ton for 2019.
Pulp and Paperboard Segment
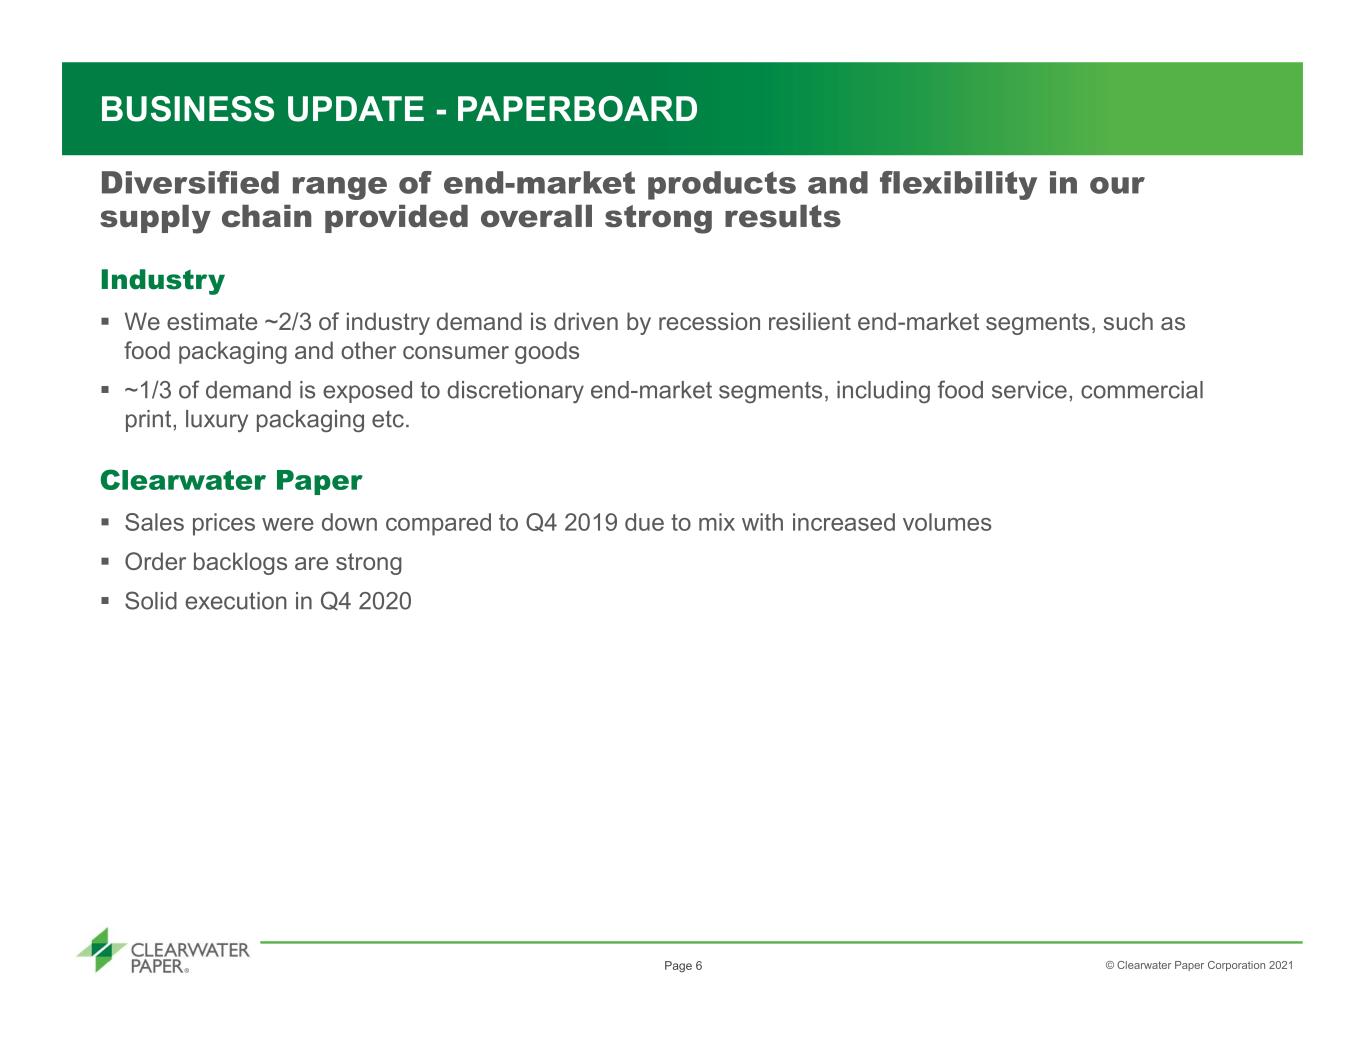
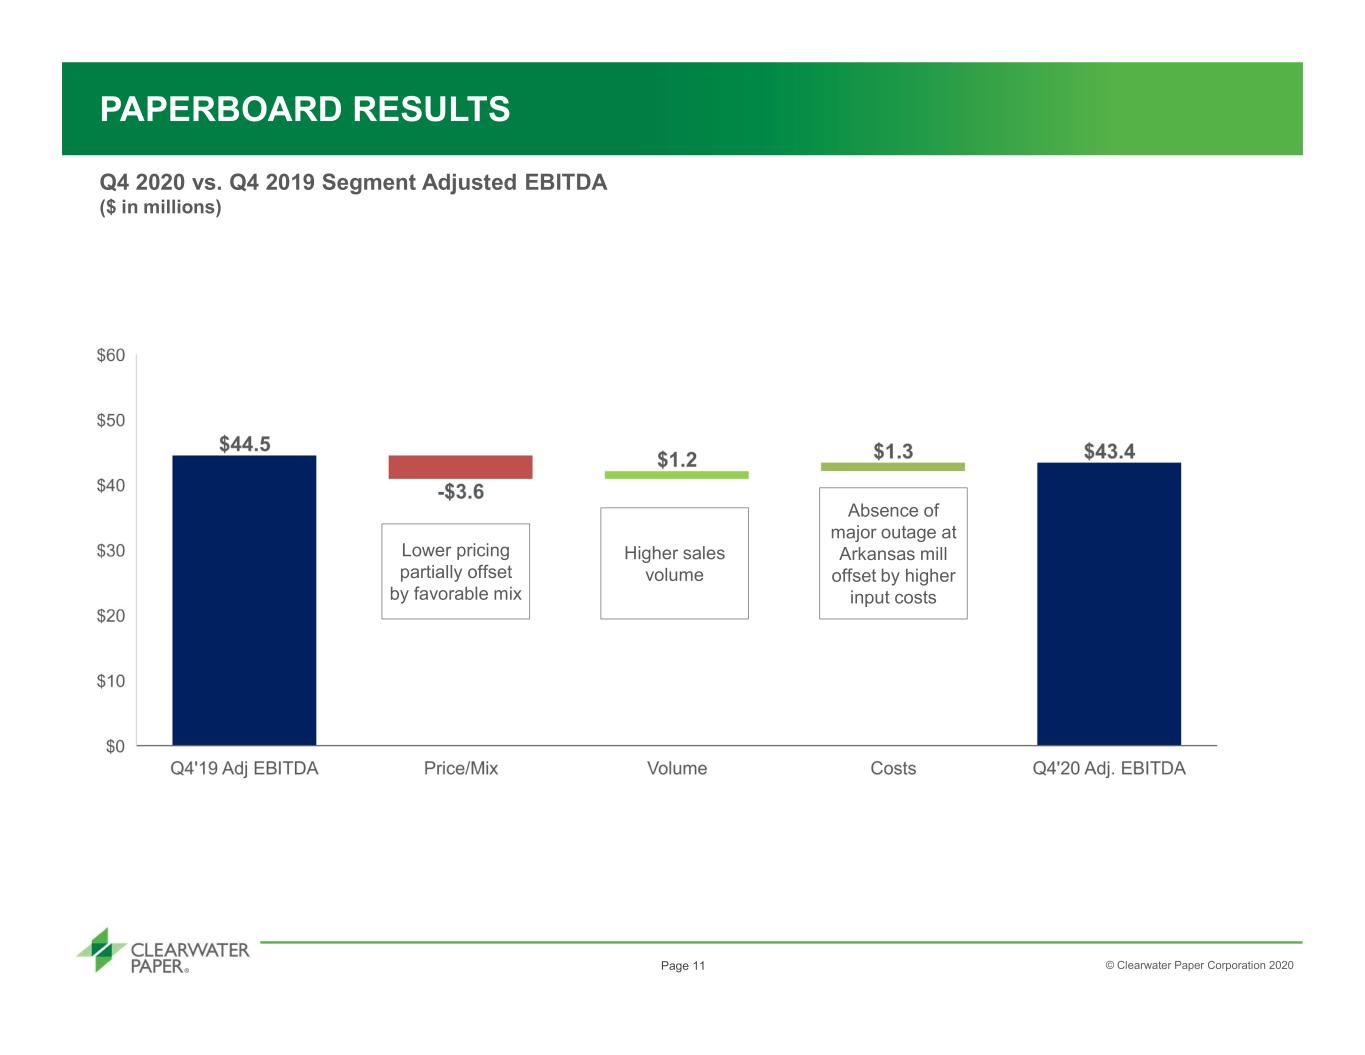
Net sales in the Pulp and Paperboard Products segment were $209 million for the fourth quarter of 2020, up 2.1% compared to fourth quarter 2019 net sales of $205 million. The increase in sales was due to higher sales volume with a positive mix partially offset by lower pricing. Segment operating income for the fourth quarter of 2020 was $34 million compared to $35 million for the fourth quarter of 2019. Adjusted EBITDA for the segment was $43 million in the fourth quarter of 2020, compared to $44 million in the fourth quarter of 2019.
Net sales in the Pulp and Paperboard Products segment were $836 million for 2020, down 2.2% compared to 2019 net sales of $855 million. Segment operating income for 2020 was $126 million compared to $115 million for 2019. Adjusted EBITDA for the segment was $163 million for 2020, compared to $155 million for 2019.
Pulp and Paperboard Sales Volumes and Prices:
• Paperboard sales volumes were 206,232 tons in the fourth quarter of 2020, an increase of 3.6% compared to 199,074 tons in the fourth quarter of 2019. Paperboard sales volumes were 821,415 for the year ended 2020, a decrease of 1% compared to 827,913 tons for the year ended 2019
• Paperboard average net selling price decreased 2.0% to $1,002 per ton for the fourth quarter of 2020, compared to $1,023 per ton in the fourth quarter of 2019. Paperboard average net selling price decreased 1% to $1,008 per ton for the year ended 2020, compared to $1,023 per ton for the year ended 2019.
COMPANY OUTLOOK
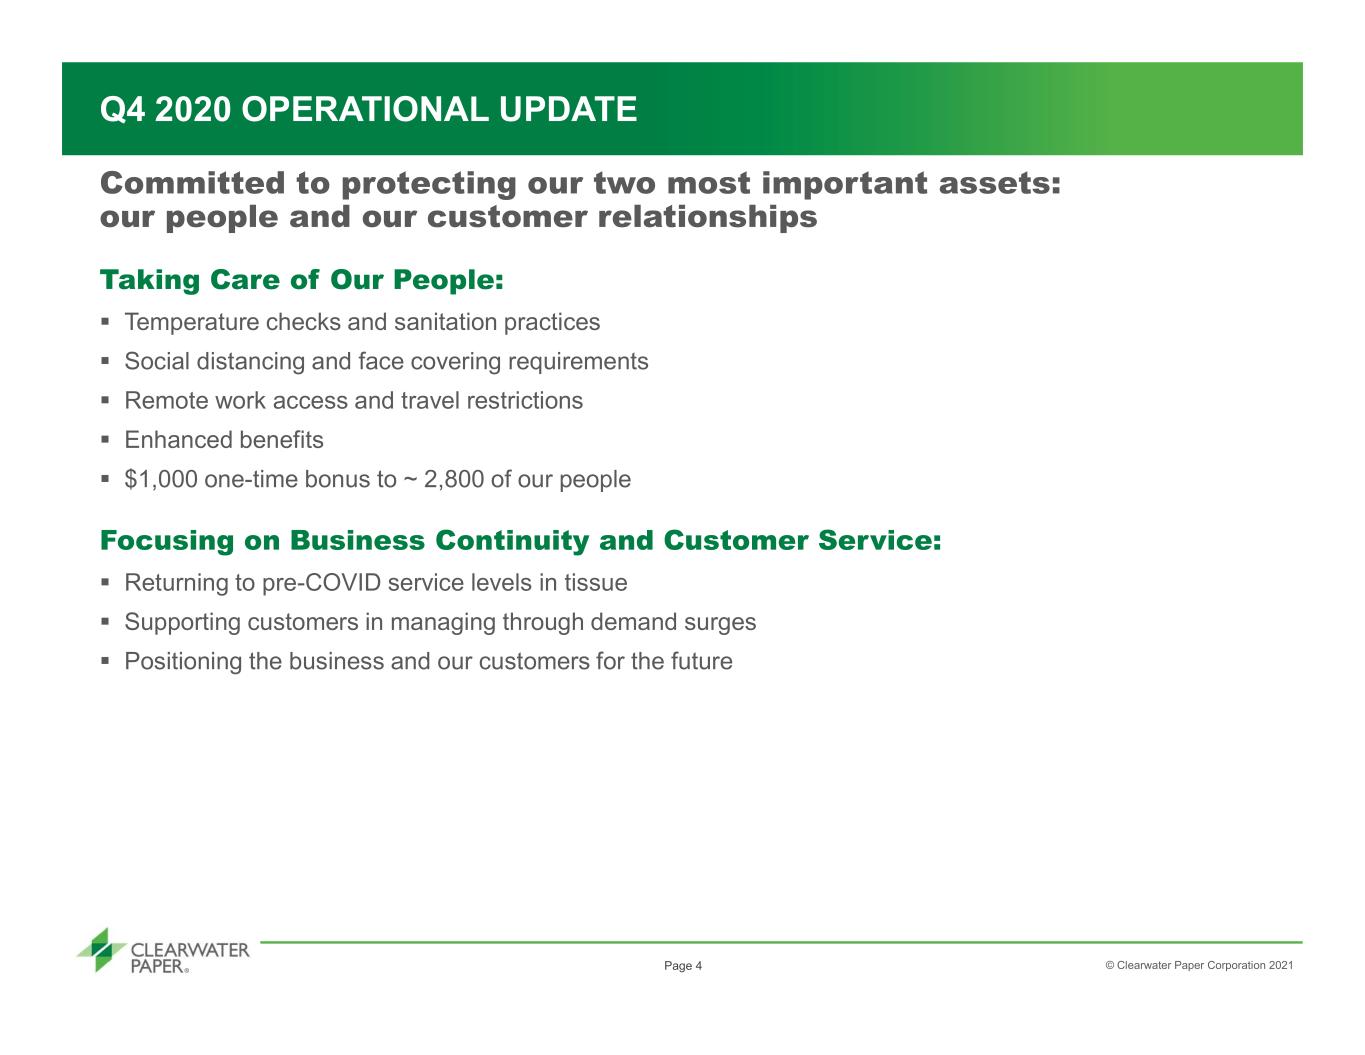
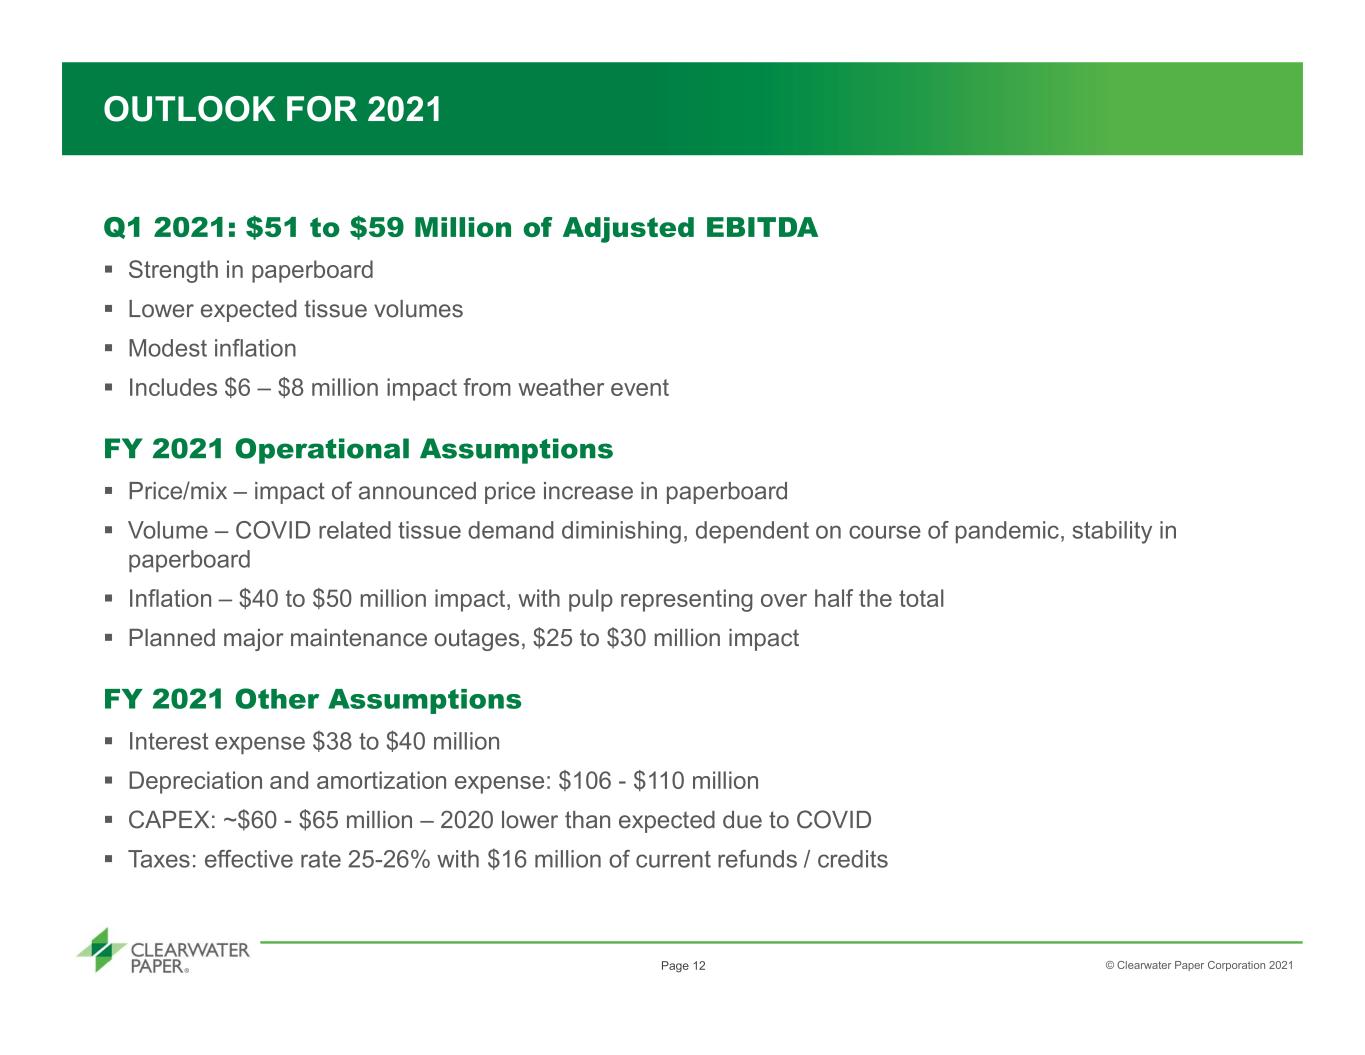
"For the first quarter of 2021, our primary focus will remain the health and safety of our people while we continue to operate our facilities and service customers. Demand for tissue products is expected to be volatile due to COVID-19 and will be lower than the first quarter of 2020 when COVID-19 started impacting consumer buying of tissue. We are anticipating some inflationary headwinds, notably in market pulp pricing, as well,” Kitch concluded.
WEBCAST INFORMATION
Clearwater Paper Corporation will discuss these results during an earnings conference call that begins at 2:00 p.m. Pacific Time today. A live webcast and accompanying supplemental information will be available on the company's website at http://ir.clearwaterpaper.com. A replay of today's conference call will be available on the website at http://ir.clearwaterpaper.com/results.cfm beginning at 5:00 p.m. Pacific Time today.
ABOUT CLEARWATER PAPER
Clearwater Paper is a premier supplier of private label tissue to major retailers and wholesale distributors, including grocery, drug, mass merchants and discount stores. In addition, the company produces bleached paperboard used by quality-conscious printers and packaging converters, and offers services that include custom sheeting, slitting and cutting. Clearwater Paper's employees build shareholder value by developing strong relationships through quality and service.
USE OF NON-GAAP MEASURES
In this press release, the company presents certain non-GAAP financial information for the fourth quarter and full year 2020 and 2019, including adjusted net income (loss) and Adjusted EBITDA. Because these amounts are not in accordance with GAAP, reconciliations to net income (loss) as determined in accordance with GAAP are included in the tables at the end of this press release. The company presents these non-GAAP amounts because management believes they assist investors and analysts in comparing the company's performance across reporting periods on a consistent basis by excluding items that the company does not believe are indicative of its core operating performance. In addition, the company uses Adjusted EBITDA: (i) as factors in evaluating management’s performance when determining incentive compensation, (ii) to evaluate the
effectiveness of the company's business strategies, and (iii) because the company's credit agreement and the indentures governing the company's outstanding notes use metrics similar to Adjusted EBITDA to measure the company's compliance with certain covenants.
FORWARD-LOOKING STATEMENTS
This press release contains certain forward-looking statements within the meaning of the Private Securities Litigation Reform Act of 1995 as amended, including statements regarding the health and safety of company’s employees, product demand, markt pulp pricing, retail in-stock conditions and inventories and general economic conditions. These forward-looking statements are based on current expectations, estimates, assumptions, and projections that are subject to change, and actual results may differ materially from the forward-looking statements. Factors that could cause actual results to differ materially include, but are not limited to: the impacts of the COVID-19 pandemic on our business and operations; competitive pricing pressures for the company’s products, including as a result of increased capacity, as additional manufacturing facilities are operated by the company’s competitors; the loss of, changes in prices in regard to, or reduction in, orders from a significant customer; changes in the cost and availability of wood fiber and wood pulp; changes in transportation costs and disruptions in transportation services; changes in customer product preferences and competitors' product offerings; larger competitors having operational and other advantages; customer acceptance and timing and quantity of purchases of the company’s tissue products, including the existence of sufficient demand for and the quality of tissue produced by the company’s expanded Shelby, North Carolina operations; consolidation and vertical integration of converting operations in the paperboard industry; the company’s ability to successfully implement its operational efficiencies and cost savings strategies, along with related capital projects, and achieve the expected operational or financial results of those projects, including from the continuous digester at the company’s Lewiston, Idaho facility; changes in the U.S. and international economies and in general economic conditions in the regions and industries in which the company operates; manufacturing or operating disruptions, including IT system and IT system implementation failures, equipment malfunctions and damage to the company’s manufacturing facilities; cyber-security risks; changes in costs for and availability of packaging supplies, chemicals, energy, and maintenance and repairs; labor disruptions; cyclical industry conditions; changes in expenses, required contributions, and potential withdrawal costs associated with the company’s pension plans; environmental liabilities or expenditures; reliance on a limited number of third-party suppliers for raw materials; the company’s ability to attract, motivate, train and retain qualified and key personnel; material weaknesses in the company’s internal control over financial reporting; the company’s substantial indebtedness and ability to service its debt obligations; restrictions on the company’s business from debt covenants and terms; negative changes in the company’s credit agency ratings; changes in laws, regulations or industry standards affecting the company’s business; and other risks and uncertainties described from time to time in the company's public filings with the Securities and Exchange Commission, including its Annual Report on Form 10-K for the year ended December 31, 2019. The forward-looking statements are made as of the date of this press release and the company does not undertake to update any forward-looking statements based on new developments or changes in the company's expectations after the date of this press release
| | | | | | | | | | | | | | | | | | | | | | | |
| Clearwater Paper Corporation |
| Consolidated Statements of Operations |
| (Unaudited) |
| | | | | |
| Three Months Ended December 31, | | Twelve Months Ended December 31, |
| (In millions, except per share data) | 2020 | | 2019 | | 2020 | | 2019 |
| Net sales | $ | 452.8 | | | $ | 435.5 | | | $ | 1,868.6 | | | $ | 1,761.5 | |
| Costs and expenses: | | | | | | | |
| Cost of sales | 376.1 | | | 384.2 | | | 1,574.4 | | | 1,597.0 | |
| Selling, general and administrative expenses | 32.6 | | | 28.9 | | | 122.0 | | | 112.8 | |
| Other operating charges, net | 2.1 | | | 4.3 | | | 14.0 | | | 6.3 | |
| Total operating costs and expenses | 410.9 | | | 417.4 | | | 1,710.4 | | | 1,716.1 | |
| Income (loss) from operations | 41.9 | | | 18.1 | | | 158.1 | | | 45.4 | |
| Interest expense, net | (9.5) | | | (12.4) | | | (46.5) | | | (44.9) | |
| Other non-operating expense | (1.9) | | | (1.4) | | | (7.6) | | | (5.7) | |
| Debt retirement costs | (1.1) | | | — | | | (5.9) | | | (2.7) | |
| Total non-operating expense | (12.4) | | | (13.8) | | | (59.9) | | | (53.3) | |
| Income (loss) before income taxes | 29.5 | | | 4.3 | | | 98.2 | | | (7.9) | |
| Income tax provision (benefit) | 7.0 | | | 2.3 | | | 21.1 | | | (2.3) | |
| Net income (loss) | $ | 22.6 | | | $ | 2.0 | | | $ | 77.1 | | | $ | (5.6) | |
| | | | | | | |
| Net income (loss) per common share: | | | | | | | |
| Basic | $ | 1.36 | | | $ | 0.12 | | | $ | 4.65 | | | $ | (0.34) | |
| Diluted | 1.34 | | | 0.12 | | | 4.61 | | | (0.34) | |
| Average shares outstanding (in thousands): | | | | | | | |
| Basic | 16,597 | | | 16,539 | | | 16,569 | | | 16,533 | |
| Diluted | 16,891 | | | 16,556 | | | 16,724 | | | 16,533 | |
| | | | | | | | | | | |
| Clearwater Paper Corporation |
| Condensed Consolidated Balance Sheets |
| (Unaudited) |
| | | |
| (In millions) | December 31, 2020 | | December 31, 2019 |
| ASSETS | | | |
| Current assets: | | | |
| Cash and cash equivalents | $ | 35.9 | | | $ | 20.0 | |
| Restricted cash | — | | | 1.4 | |
| Receivables, net | 160.6 | | | 159.4 | |
| Inventories | 263.3 | | | 281.4 | |
| Other current assets | 15.2 | | | 3.6 | |
| Total current assets | 474.9 | | | 465.8 | |
| Property, plant and equipment, net | 1,191.5 | | | 1,257.7 | |
| Operating lease right-of-use assets | 63.5 | | | 73.1 | |
| Goodwill and intangibles, net | 48.8 | | | 52.0 | |
| Other assets, net | 21.7 | | | 29.1 | |
| TOTAL ASSETS | $ | 1,800.4 | | | $ | 1,877.7 | |
| LIABILITIES AND STOCKHOLDERS' EQUITY | | | |
| Current liabilities: | | | |
| Short-term debt | $ | 1.7 | | | $ | 17.9 | |
| Trade payables | 143.4 | | | 159.5 | |
| Accrued compensation | 41.7 | | | 42.3 | |
| Other accrued liabilities | 58.0 | | | 60.7 | |
| Total current liabilities | 244.8 | | | 280.4 | |
| Long-term debt | 716.4 | | | 884.5 | |
| Long-term operating lease liabilities | 54.3 | | | 65.6 | |
| Liability for pension and other postretirement employee benefits | 80.5 | | | 76.6 | |
| Other long-term obligations | 25.2 | | | 17.3 | |
| Deferred tax liabilities | 158.1 | | | 121.3 | |
| TOTAL LIABILITIES | 1,279.3 | | | 1,445.8 | |
| | | |
| Common Stock | — | | | — | |
| Paid in capital | 16.6 | | | 9.8 | |
| Retained earnings | 558.8 | | | 481.7 | |
| Accumulated other comprehensive loss, net of tax | (54.3) | | | (59.5) | |
| Total Stockholders' Equity | 521.1 | | | 432.0 | |
| TOTAL LIABILITIES AND STOCKHOLDERS' EQUITY | $ | 1,800.4 | | | $ | 1,877.8 | |
| | | | | | | | | | | | | | | | | | | | | | | |
| Clearwater Paper Corporation |
| Consolidated Statements of Cash Flows |
| (Unaudited) |
| | | | | |
| | | |
| Three Months Ended December 31, | | Twelve Months Ended December 31, |
| (In millions) | 2020 | | 2019 | | 2020 | | 2019 |
| CASH FLOWS FROM OPERATING ACTIVITIES | | | | | | | |
| Net income (loss) | $ | 22.6 | | | $ | 2.0 | | | $ | 77.1 | | | $ | (5.6) | |
| Adjustments to reconcile net income (loss) to net cash flows provided by operating activities: | | | | | | | |
| Depreciation and amortization | 27.5 | | | 29.3 | | | 111.0 | | | 115.6 | |
| Equity-based compensation expense | 3.1 | | | 1.1 | | | 10.5 | | | 4.1 | |
| Deferred taxes | 10.1 | | | 5.7 | | | 33.5 | | | (0.3) | |
| Pension and other postretirement benefits | 1.0 | | | 0.4 | | | 3.8 | | | 1.4 | |
| Debt retirement costs | 1.1 | | | — | | | 5.9 | | | 2.7 | |
| Gain on divested assets, net | — | | | — | | | (1.4) | | | — | |
| Changes in operating assets and liabilities: | | | | | | | |
| (Increase) decrease in accounts receivable | 11.8 | | | (5.5) | | | 6.1 | | | (18.0) | |
| (Increase) decrease in inventory | (7.0) | | | (0.1) | | | 18.1 | | | (21.2) | |
| (Increase) decrease in other current assets | (6.4) | | | 4.4 | | | (11.2) | | | (0.8) | |
| Increase (decrease) in trade payables | (0.3) | | | 7.8 | | | (16.5) | | | (53.9) | |
| Increase (decrease) in accrued compensation | (7.6) | | | 8.8 | | | (2.5) | | | 4.8 | |
| Increase in other accrued liabilities | 10.3 | | | 14.9 | | | 7.0 | | | 20.7 | |
| Other, net | 4.7 | | | 3.1 | | | 5.6 | | | 6.1 | |
| Net cash flows provided by operating activities | 70.9 | | | 71.8 | | | 247.0 | | | 55.6 | |
| CASH FLOWS FROM INVESTING ACTIVITIES | | | | | | | |
| Additions to property, plant and equipment | (12.2) | | | (14.3) | | | (39.6) | | | (140.1) | |
| Net cash flows used in investing activities | (12.2) | | | (14.3) | | | (39.6) | | | (140.1) | |
| CASH FLOWS FROM FINANCING ACTIVITIES | | | | | | | |
| Borrowings of short-term debt | — | | | 14.5 | | | 108.5 | | | 549.3 | |
| Repayments of borrowings on short-term debt | — | | | (59.0) | | | (122.0) | | | (657.7) | |
| Borrowings of long-term debt | — | | | — | | 275.0 | | | 296.1 | |
| Repayments of long-term debt | (70.4) | | | — | | (449.4) | | | (103.0) | |
| Payments for debt issuance costs | (0.1) | | | (0.5) | | | (4.4) | | | (2.3) | |
| Other, net | — | | | (0.3) | | | (0.7) | | | (0.4) | |
| Net cash flows provided by (used in) financing activities | (70.5) | | | (45.3) | | | (192.9) | | | 82.0 | |
| Increase (decrease) in cash, cash equivalents and restricted cash | (11.7) | | | 12.2 | | | 14.4 | | | (2.5) | |
| Cash, cash equivalents and restricted cash at beginning of period | 48.6 | | | 10.2 | | | 22.4 | | | 24.9 | |
| Cash, cash equivalents and restricted cash at end of period | $ | 36.9 | | | $ | 22.4 | | | $ | 36.9 | | | $ | 22.4 | |
| | | | | | | | | | | | | | | | | | | | | | | | | | |
| Clearwater Paper Corporation |
| Segment Information |
| (Unaudited) |
| | | |
| Three Months Ended December 31, | | Twelve Months Ended December 31, |
| (In millions) | 2020 | | 2019 | | 2020 | | | 2019 |
| Segment net sales: | | | | | | | | | | |
| Consumer Products | $ | 243.6 | | | | $ | 230.6 | | | | $ | 1,032.7 | | | | $ | 906.8 | |
| Pulp and Paperboard | 209.3 | | | | 204.9 | | | | 835.9 | | | | 854.7 | |
| Total segment net sales | $ | 452.8 | | | | $ | 435.5 | | | | $ | 1,868.6 | | | | $ | 1,761.5 | |
| | | | | | | | | | |
| Operating income (loss): | | | | | | | | | | |
| Consumer Products | $ | 27.0 | | | | $ | 1.6 | | | | $ | 109.2 | | | | $ | (6.6) | |
| Pulp and Paperboard | 34.4 | | | | 35.3 | | | | 126.0 | | | | 115.3 | |
| Corporate | (17.3) | | | | (14.5) | | | | (63.0) | | | | (57.0) | |
| Other operating charges, net | (2.1) | | | | (4.3) | | | | (14.0) | | | | (6.3) | |
| Income (loss) from operations | $ | 41.9 | | | | $ | 18.1 | | | | $ | 158.1 | | | | $ | 45.4 | |
| | | | | | | | | | | | | | | | | | | | | | | |
| Clearwater Paper Corporation |
| Reconciliation of Non-GAAP Financial Measures |
| Adjusted EBITDA |
| (Unaudited) |
| | |
| Three Months Ended December 31, | | Twelve Months Ended December 31, |
| (In millions) | 2020 | | 2019 | | 2020 | | 2019 |
| Net income (loss) | $ | 22.6 | | | $ | 2.0 | | | $ | 77.1 | | | $ | (5.6) | |
| Add back: | | | | | | | |
| Income tax provision (benefit) | 7.0 | | | 2.3 | | | 21.1 | | | (2.3) | |
| Interest expense, net | 9.5 | | | 12.4 | | | 46.5 | | | 44.9 | |
| Depreciation and amortization expense | 27.5 | | | 29.3 | | | 111.0 | | | 115.6 | |
Other operating charges, net1 | 2.1 | | | 4.3 | | | 14.0 | | | 6.3 | |
| Other non-operating expense | 1.9 | | | 1.4 | | | 7.6 | | | 5.7 | |
| Debt retirement costs | 1.1 | | | — | | | 5.9 | | | 2.7 | |
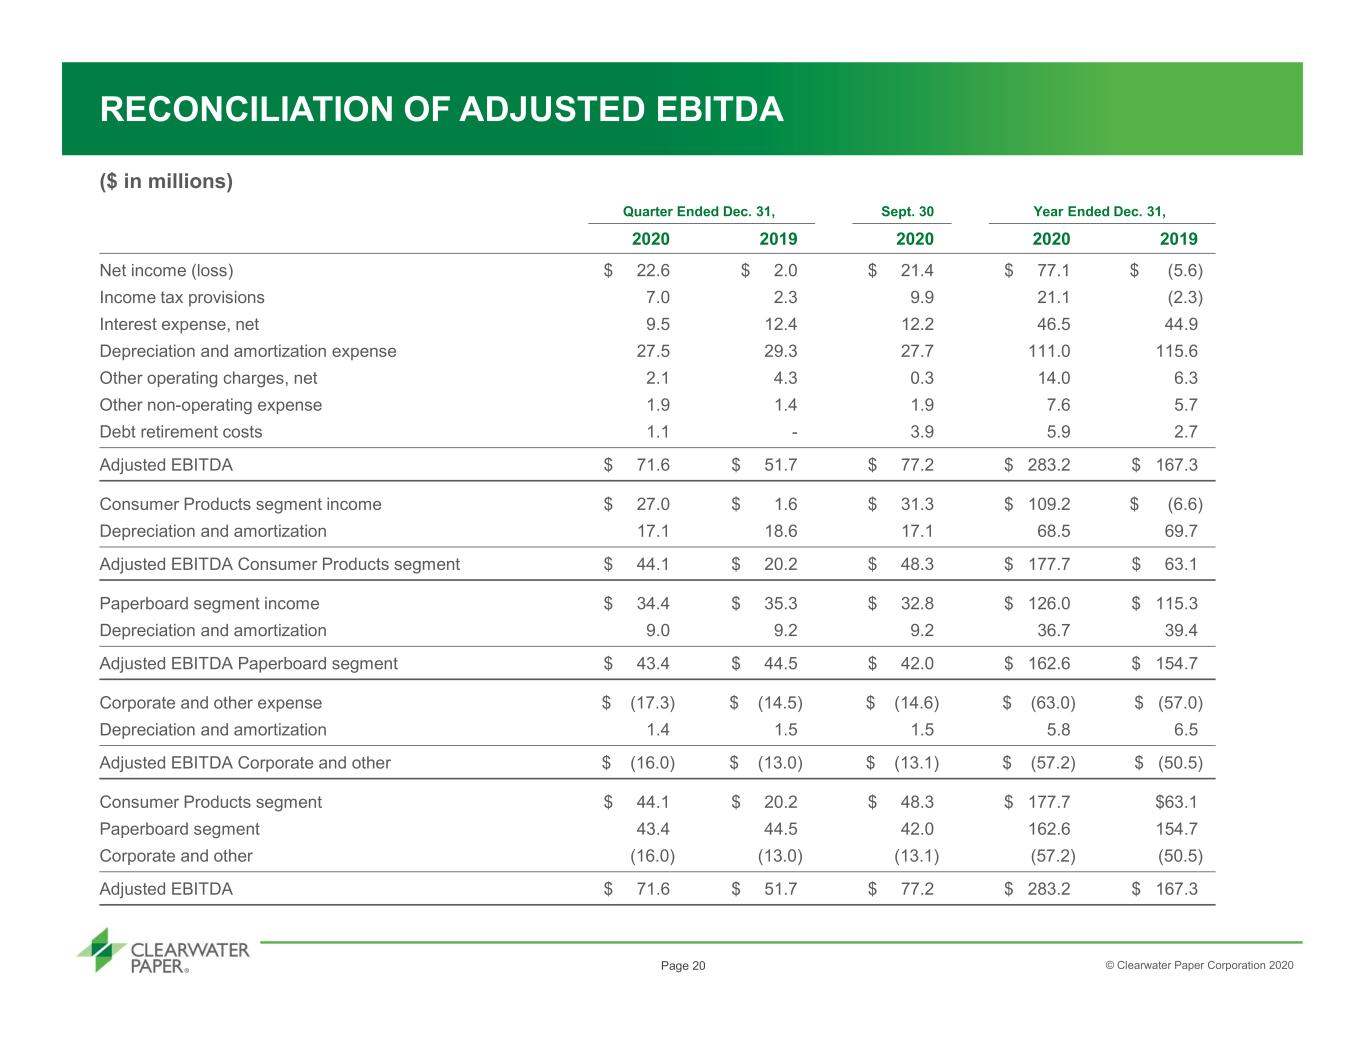
| Adjusted EBITDA | $ | 71.6 | | | $ | 51.7 | | | $ | 283.2 | | | $ | 167.3 | |
| | | | | | | |
| Consumer Products income (loss) | $ | 27.0 | | | $ | 1.6 | | | $ | 109.2 | | | $ | (6.6) | |
| Depreciation and amortization | 17.1 | | | 18.6 | | | 68.5 | | | 69.7 | |
| Consumer Products Adjusted EBITDA | $ | 44.1 | | | $ | 20.2 | | | $ | 177.7 | | | $ | 63.1 | |
| | | | | | | |
| Paperboard income | $ | 34.4 | | | $ | 35.3 | | | $ | 126.0 | | | $ | 115.3 | |
| Depreciation and amortization | 9.0 | | | 9.2 | | | 36.7 | | | 39.4 | |
| Paperboard Adjusted EBITDA | $ | 43.4 | | | $ | 44.5 | | | $ | 162.6 | | | $ | 154.7 | |
| | | | | | | |
| Corporate expenses | $ | (17.3) | | | $ | (14.5) | | | $ | (63.0) | | | $ | (57.0) | |
| Depreciation and amortization | 1.4 | | | 1.5 | | | 5.8 | | | 6.5 | |
| Corporate Adjusted EBITDA | $ | (16.0) | | | $ | (13.0) | | | $ | (57.2) | | | $ | (50.5) | |
| | | | | | | |
| Consumer Products | $ | 44.1 | | | $ | 20.2 | | | $ | 177.7 | | | $ | 63.1 | |
| Paperboard | 43.4 | | | 44.5 | | | 162.6 | | | 154.7 | |
| Corporate | (16.0) | | | (13.0) | | | (57.2) | | | (50.5) | |
| Adjusted EBITDA | $ | 71.6 | | | $ | 51.7 | | | $ | 283.2 | | | $ | 167.3 | |
1 Other operating charges, net consist of amounts unrelated to ongoing core operating activities. Please refer to Note 10 within Clearwater Paper's Form 10-K filed with the SEC for the year ended December 31, 2020 for the detailed breakout of this amount.
| | | | | | | | | | | | | | | | | | | | | | | |
| Clearwater Paper Corporation |
| Reconciliation of Non-GAAP Financial Measures |
| Adjusted Net Income |
| (Unaudited) |
| | | | | |
| Three Months Ended December 31, | | Twelve Months Ended December 31, |
| (In millions, except per share data) | 2020 | | 2019 | | 2020 | | 2019 |
| Net income (loss) | $ | 22.6 | | | $ | 2.0 | | | $ | 77.1 | | | $ | (5.6) | |
| Add back: | | | | | | | |
| Income tax provision (benefit) | 7.0 | | | 2.3 | | | 21.1 | | | (2.3) | |
| Income (loss) before income taxes | 29.6 | | | 4.3 | | | 98.2 | | | (7.9) | |
| | | | | | | |
| Add back: | | | | | | | |
| Debt retirement costs | 1.1 | | | — | | | 5.9 | | | 2.7 | |
| Other operating charges, net | 2.1 | | | 4.3 | | | 14.0 | | | 6.3 | |
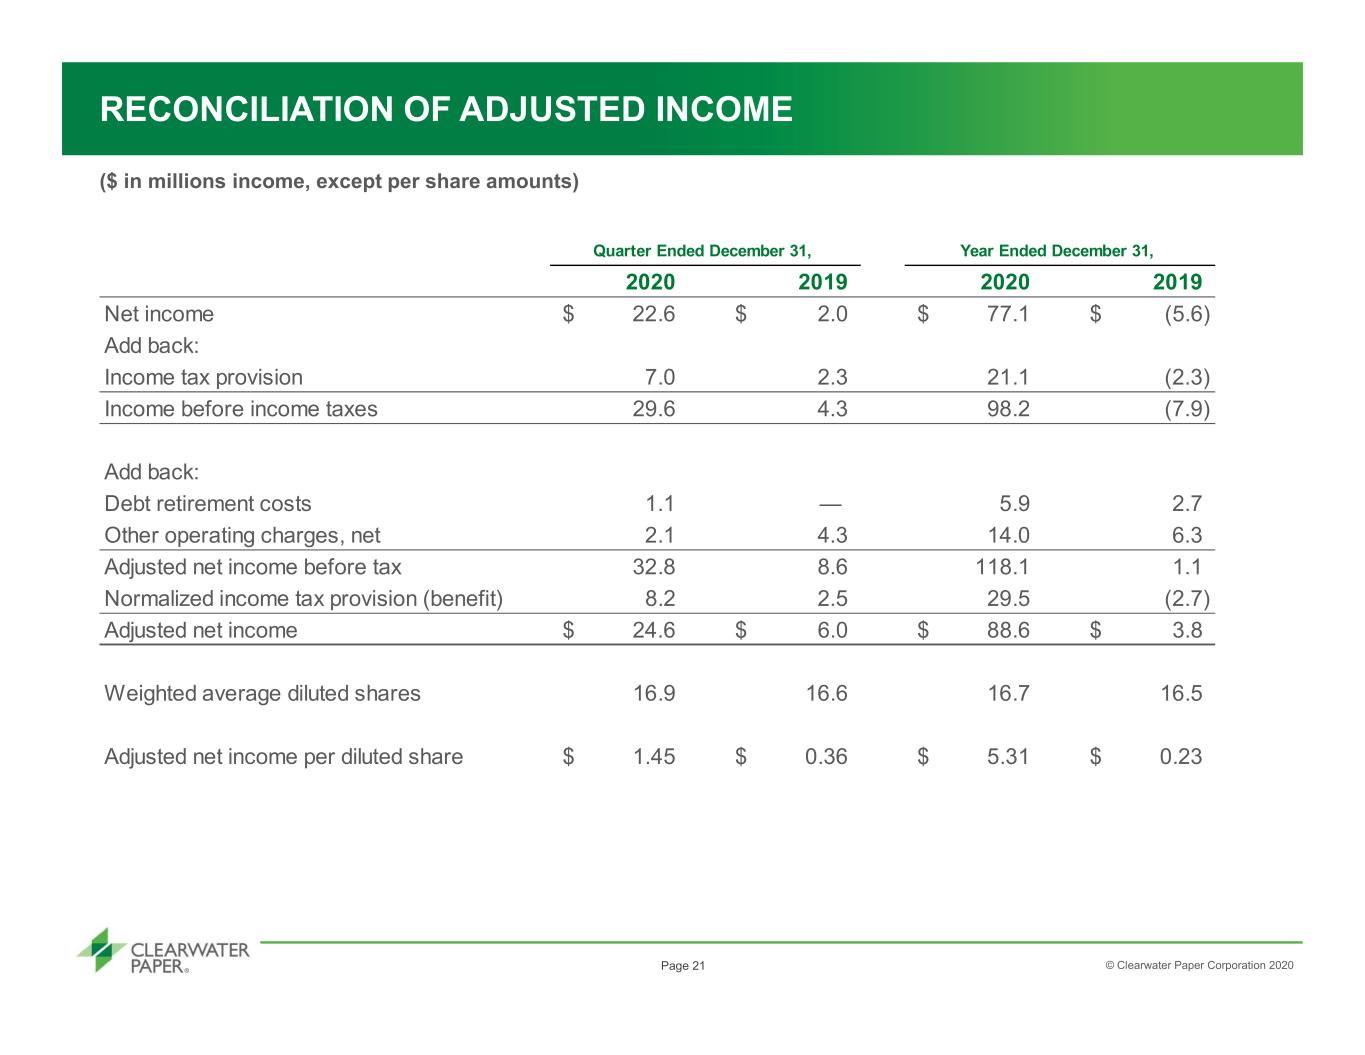
| Adjusted income before tax | 32.8 | | | 8.6 | | | 118.1 | | | 1.1 | |
| Normalized income provision (benefit) | 8.2 | | | 2.5 | | | 29.5 | | | (2.7) | |
| Adjusted net income (loss) | $ | 24.6 | | | $ | 6.1 | | | $ | 88.6 | | | $ | 3.8 | |
| | | | | | | |
| Weighted average diluted shares (in thousands) | 16,891 | | | 16,556 | | | 16,724 | | | 16,533 | |
| | | | | | | |
| Adjusted income (loss) per share | $ | 1.45 | | | $ | 0.37 | | | $ | 5.30 | | | $ | 0.23 | |
Clearwater Paper Corporation
Investors contact:
Sloan Bohlen
Solebury Trout
509.344.5906
News media:
Shannon Myers
509.344.5967