UNITED STATES
SECURITIES AND EXCHANGE COMMISSION
Washington, D.C. 20549  

 
FORM 8-K

CURRENT REPORT
 
Pursuant to Section 13 or 15(d) of the
Securities Exchange Act of 1934

Date of Report (Date of earliest event reported): May 5, 2020

CLEARWATER PAPER CORPORATION
(Exact name of registrant as specified in its charter)
Delaware
(State or other jurisdiction
of incorporation)
001-34146
(Commission File Number)
20-3594554
(IRS Employer
Identification No.)

601 West Riverside Ave., Suite 1100
Spokane, WA
(Address of principal executive offices)

99201
(Zip Code)

Registrant’s telephone number, including area code: (509) 344-5900
Not Applicable
(Former Name or Former Address, if Changed Since Last Report)
 
Check the appropriate box below if the Form 8-K filing is intended to simultaneously satisfy the filing obligation of the registrant under any of the following provisions (see General Instructions A.2. below):
¬
Written communications pursuant to Rule 425 under the Securities Act (17 CFR 230.425)
¬
Soliciting material pursuant to Rule 14a-12 under the Exchange Act (17 CFR 240.14a-12)
¬
Pre-commencement communications pursuant to Rule 14d-2(b) under the Exchange Act (17 CFR 240.14d-2(b))
¬
Pre-commencement communications pursuant to Rule 13e-4(c) under the Exchange Act (17 CFR 240.13e-4(c))
Securities registered pursuant to Section 12(b) of the Act:
Title of each class
Trading Symbol(s)
Name of each exchanged on which registered
Common Stock, par value $0.0001 per share
CLW
New York Stock Exchange

Indicate by check mark whether the registrant is an emerging growth company as defined in Rule 405 of the Securities Act of 1933 (§ 230.405 of this chapter) or Rule 12b-2 of the Securities Exchange Act of 1934 (§ 240.12b-2 of this chapter).
Emerging growth company 
 
If an emerging growth company, indicate by check mark if the registrant has elected not to use the extended transition period for complying with any new or revised financial accounting standards provided pursuant to Section 13(a) of the Exchange Act. 


Item 2.02.     Results of Operations and Financial Condition.

On May 5, 2020, Clearwater Paper Corporation (the “Company”) announced its results of operations and financial condition for the first quarter ending March 31, 2020.  A copy of the press release containing this announcement is furnished as Exhibit 99.1 hereto. In addition, a copy of the Company’s First Quarter Supplemental Information is furnished as Exhibit 99.2 hereto.
The information in this Item 2.02, including Exhibits 99.1 and 99.2, shall not be deemed “filed” for purposes of Section 18 of the Securities Exchange Act of 1934, as amended (the “Exchange Act”), nor shall it be deemed incorporated by reference in any filing under the Securities Act of 1933, as amended, or the Exchange Act, except as shall be expressly set forth by specific reference in such filing.  


Item 9.01.     Financial Statements and Exhibits

(d) Exhibit Index

Exhibit
Description
99.1
99.2


SIGNATURES
Pursuant to the requirements of the Securities Exchange Act of 1934, the registrant has duly caused this report to be signed on its behalf by the undersigned hereunto duly authorized.
Date: May 5, 2020
CLEARWATER PAPER CORPORATION

By:
/s/ Michael S. Gadd
 
Michael S. Gadd, Corporate Secretary


Exhibit 99.1
Clearwater Paper Reports First Quarter 2020 Results

SPOKANE, Wash.--(BUSINESS WIRE)--May 5, 2020 --Clearwater Paper Corporation (NYSE:CLW), a premier supplier of quality tissue and bleached paperboard products, today reported financial results for the first quarter of 2020.
HIGHLIGHTS
Rapidly implemented health and safety measures and protocols to maintain consistent operations during the COVID-19 outbreak
Delivered strong performance in the quarter due to solid execution to meet increased demand for essential tissue and paperboard products in response to COVID-19 pandemic
First quarter net income of $10 million, or $0.62 per diluted share and Adjusted EBITDA of $55 million
Sixth consecutive quarter of sequential sales growth for the Consumer Products segment
First quarter operating cash flow up $42 million versus the first quarter of 2019 driven by working capital changes
Available liquidity, including cash on hand, of $234.4 million based upon the March 31, 2020 balance sheet
"We remain focused on two priorities -- the health and safety of our employees and continuing to safely operate our facilities to meet the needs of our customers,"  said Arsen S. Kitch, president and chief executive officer. "Our financial results for the first quarter of 2020 significantly benefited from an increase in demand for our products, particularly in our Consumer Products segment, and strong operational execution by our teams."
OVERALL RESULTS
For the first quarter of 2020, Clearwater Paper reported net sales of $478 million, an 11% increase compared to net sales of $429 million for the first quarter of 2019. Net income for the first quarter of 2020 was $10 million, or $0.62 per diluted share, compared to net income for the first quarter of 2019 of $4 million, or $0.23 per diluted share. On a non-GAAP basis, Clearwater Paper reported adjusted net income in the first quarter 2020 of $10 million, or $0.57 per diluted share, compared to first quarter 2019 adjusted net income of $3 million, or $0.19 per diluted share. Adjusted EBITDA for the quarter was $55 million, compared to first quarter 2019 Adjusted EBITDA of $40 million.
Consumer Products
Net sales in the Consumer Products segment were $266 million for the first quarter of 2020, up 19% compared to first quarter 2019 net sales of $223 million. In the first quarter of 2020, converted case shipments reached 15.2 million cases, an increase of 23.4% compared to 12.3 million cases shipped in the first quarter of 2019, based upon the increased demand as a result of changes in consumer behavior in response to the COVID-19 pandemic and incremental demand based upon new customer programs.
Segment operating income for the first quarter of 2020 was $14 million, compared to operating income of $1 million in the first quarter of 2019. Adjusted EBITDA for the segment was $32 million in the first quarter of 2020, up from $16 million in the first quarter of 2019. The increase in operating income and Adjusted EBITDA was primarily due to increased shipment volumes, and reductions in costs due to lower external pulp prices and freight costs partially offset by the continued start up costs associated with the Shelby expansion.
Tissue Sales Volumes and Prices:
• Total tissue volumes sold were 99,793 tons in the first quarter of 2020, a increase of 16,171 tons or 19% compared to 83,622 tons in the first quarter of 2019. Retail volumes represented 91% of total volumes sold in the first quarter of 2020, an increase from 88% in the first quarter of 2019.
• Average tissue net selling prices decreased 2% to $2,625 per ton in the first quarter of 2020, compared to $2,667 per ton in the first quarter of 2019.
Pulp and Paperboard
Net sales in the Pulp and Paperboard segment were $212 million for the first quarter of 2020, up 3% compared to first quarter 2019 net sales of $205 million. The increase was due to increased volume with a positive mix partially offset by lower pricing.
Segment operating income and margin for the first quarter of 2020 were $26 million and 12%, compared to $29 million and 14%, respectively, for the first quarter of 2019. Adjusted EBITDA for the segment was $36 million in the first quarter of 2020, compared to $39 million in the first quarter of 2019. The decrease in operating income and Adjusted EBITDA was primarily driven by a public utility disruption at our Cypress Bend facility caused by a weather event which was offset by the higher sales volumes.


Paperboard Sales Volumes and Prices:
• Paperboard sales volumes were 211,296 tons in the first quarter of 2020, an increase of 4% compared to 202,834 tons in the first quarter of 2019.
• Paperboard average net selling price decreased 0.2% to $999 per ton for the first quarter of 2020, compared to $1,001 per ton in the first quarter of 2019.
COMPANY OUTLOOK
"For the upcoming quarter, our primary focus will remain on the health and safety of our employees while we continue to operate our facilities and service customers. Demand for tissue products is expected to remain elevated as consumers shift to at home consumption and retailers continue to focus on keeping their shelves stocked. We are also closely monitoring economic conditions and assessing the impact on our business for the balance of the year,” Kitch concluded.
WEBCAST INFORMATION
Clearwater Paper Corporation will discuss these results during an earnings conference call that begins at 2:00 p.m. Pacific Time today. A live webcast and accompanying supplemental information will be available on the company's website at http://ir.clearwaterpaper.com. A replay of today's conference call will be available on the website at http://ir.clearwaterpaper.com/results.cfm beginning at 5:00 p.m. Pacific Time today.

ABOUT CLEARWATER PAPER
Clearwater Paper is a premier supplier of private label tissue to major retailers and wholesale distributors, including grocery, drug, mass merchants and discount stores.  In addition, the company produces bleached paperboard used by quality-conscious printers and packaging converters, and offers services that include custom sheeting, slitting and cutting.  Clearwater Paper's employees build shareholder value by developing strong relationships through quality and service.


USE OF NON-GAAP MEASURES
In this press release, the company presents certain non-GAAP financial information for the first quarter of 2020 and 2019, including adjusted income (loss) and Adjusted EBITDA. Because these amounts are not in accordance with GAAP, reconciliations to net income (loss) as determined in accordance with GAAP are included in the tables at the end of this press release. The company presents these non-GAAP amounts because management believes they assist investors and analysts in comparing the company's performance across reporting periods on a consistent basis by excluding items that the company does not believe are indicative of its core operating performance. In addition, the company uses Adjusted EBITDA: (i) as factors in evaluating management’s performance when determining incentive compensation, (ii) to evaluate the effectiveness of the company's business strategies, and (iii) because the company's credit agreement and the indentures governing the company's outstanding notes use metrics similar to Adjusted EBITDA to measure the company's compliance with certain covenants.
FORWARD-LOOKING STATEMENTS

This press release contains certain forward-looking statements within the meaning of the Private Securities Litigation Reform Act of 1995 as amended, including statements regarding the health and safety of company’s employees, disruptions in operations at the company's facilities, product demand and economic conditions. These forward-looking statements are based on current expectations, estimates, assumptions, and projections that are subject to change, and actual results may differ materially from the forward-looking statements. Factors that could cause actual results to differ materially include, but are not limited to: the impacts of the COVID-19 pandemic on our business and operations; competitive pricing pressures for the company’s products, including as a result of increased capacity, as additional manufacturing facilities are operated by the company’s competitors; the loss of, changes in prices in regard to, or reduction in, orders from a significant customer; changes in the cost and availability of wood fiber and wood pulp; changes in transportation costs and disruptions in transportation services; changes in customer product preferences and competitors' product offerings; larger competitors having operational and other advantages; customer acceptance and timing and quantity of purchases of the company’s tissue products, including the existence of sufficient demand for and the quality of tissue produced by the company’s expanded Shelby, North Carolina operations; consolidation and vertical integration of converting operations in the paperboard industry; the company’s ability to successfully implement its operational efficiencies and cost savings strategies, along with related capital projects, and achieve the expected operational or financial results of those projects, including from the continuous digester at the company’s Lewiston, Idaho facility; changes in the U.S. and international economies and in general economic conditions in the regions


and industries in which the company operates; manufacturing or operating disruptions, including IT system and IT system implementation failures, equipment malfunctions and damage to the company’s manufacturing facilities; cyber-security risks; changes in costs for and availability of packaging supplies, chemicals, energy, and maintenance and repairs; labor disruptions; cyclical industry conditions; changes in expenses, required contributions, and potential withdrawal costs associated with the company’s pension plans; environmental liabilities or expenditures; reliance on a limited number of third-party suppliers for raw materials; the company’s ability to attract, motivate, train and retain qualified and key personnel; material weaknesses in the company’s internal control over financial reporting; the company’s substantial indebtedness and ability to service its debt obligations; restrictions on the company’s business from debt covenants and terms; negative changes in the company’s credit agency ratings; changes in laws, regulations or industry standards affecting the company’s business; and other risks and uncertainties described from time to time in the company's public filings with the Securities and Exchange Commission, including its Annual Report on Form 10-K for the year ended December 31, 2019. The forward-looking statements are made as of the date of this press release and the company does not undertake to update any forward-looking statements based on new developments or changes in the company's expectations after the date of this press release


Clearwater Paper Corporation
Consolidated Statements of Operations
(Dollars in millions - except per-share amounts) (Unaudited)


Three Months Ended
 
March 31,
 
2020
 
2019
Net sales
$
477.9

 
$
428.8

Costs and expenses:


Cost of sales
423.0

 
384.3

Selling, general and administrative expenses
27.5

 
30.4

Other operating charges, net
8.6

 
(0.3
)
Total operating costs and expenses
459.1

 
414.4

Income from operations
18.8

 
14.4

Interest expense, net
(12.8
)
 
(8.6
)
Other non-operating expense
(1.9
)
 
(1.3
)
Total non-operating expense
(14.7
)
 
(9.9
)
Income before income taxes
4.1

 
4.5

Income tax provision (benefit)
(6.2
)
 
0.7

Net income
$
10.3

 
$
3.8


Net income per common share:


Basic
$
0.62

 
$
0.23

Diluted
0.62

 
0.23

Average shares outstanding (in thousands):


Basic
16,555

 
16,516

Diluted
16,615

 
16,563


Clearwater Paper Corporation
Condensed Consolidated Balance Sheets
(Dollars in millions) (Unaudited)


March 31,
 
December 31,
 
2020
 
2019
ASSETS


Current assets:


Cash and cash equivalents
$
60.8

 
$
20.0

Restricted cash

 
1.4

Receivables, net
207.1

 
159.4

Inventories
240.5

 
281.4

Other current assets
12.6

 
3.6

Total current assets
520.9

 
465.8

Property, plant and equipment, net
1,235.5

 
1,257.7

Operating lease right-of-use assets
70.4

 
73.1

Goodwill and intangibles, net
51.2

 
52.0

Other assets, net
18.8

 
29.1

TOTAL ASSETS
$
1,896.8

 
$
1,877.7


LIABILITIES AND STOCKHOLDERS' EQUITY


Current liabilities:


Short-term debt
$
58.1

 
$
17.9

Trade payables
146.8

 
158.2

Accrued compensation
34.1

 
45.0

Other accrued liabilities
51.4

 
59.3

Total current liabilities
290.4

 
280.4

Long-term debt
883.9

 
884.5

Long-term operating lease liabilities
62.7

 
65.6

Liability for pension and other postretirement employee benefits
75.3

 
76.6

Other long-term obligations
16.2

 
17.3

Deferred tax liabilities
123.6

 
121.3

Total liabilities
1,452.1

 
1,445.7


Common stock


Paid in capital
10.4

 
9.8

Retained earnings
492.1

 
481.7

Accumulated other comprehensive loss, net of tax
(57.7
)
 
(59.5
)
Total stockholders' equity
444.8

 
432.0

TOTAL LIABILITIES AND STOCKHOLDERS' EQUITY
$
1,896.8

 
$
1,877.7


Clearwater Paper Corporation
Consolidated Statements of Cash Flows
(Dollars in millions) (Unaudited)
 
Three Months Ended
 
March 31,
 
2020
 
2019
CASH FLOWS FROM OPERATING ACTIVITIES


Net income
$
10.3

 
$
3.8

Adjustments to reconcile net income to net cash flows provided by (used in) operating activities:


Depreciation and amortization
28.0

 
25.8

Equity-based compensation expense
1.5

 
0.8

Deferred taxes
1.8

 
0.9

Pension and other post employment benefit plans
0.8


Gain on divested assets
(1.4
)
 

Other non-cash activity, net
0.9

 
(0.6
)
Changes in operating assets and liabilities:


Increase in accounts receivable
(37.3
)
 
(23.1
)
(Increase) decrease in inventory
40.9

 
(21.6
)
Increase in other current assets
(9.0
)
 
(8.8
)
Decrease in trade payables
(13.0
)
 
(10.8
)
Decrease in accrued compensation
(10.9
)
 
(11.9
)
Increase (decrease) in other accrued liabilities
(0.1
)
 
13.5

Other, net
(0.5
)
 
2.6

Net cash flows provided by (used in) operating activities
12.1

 
(29.4
)
CASH FLOWS FROM INVESTING ACTIVITIES


Additions to property, plant and equipment
(10.5
)
 
(71.6
)
Net cash flows used in investing activities
(10.5
)
 
(71.6
)
CASH FLOWS FROM FINANCING ACTIVITIES


Borrowings of short-term debt
88.5

 
290.4

Repayments of borrowings on short-term debt
(48.8
)
 
(199.0
)
Repayments of long-term debt
(1.1
)
 

Other, net
(0.8
)
 
(0.7
)
Net cash flows provided by financing activities
37.8

 
90.7

Increase (decrease) in cash, cash equivalents and restricted cash
39.4

 
(10.3
)
Cash, cash equivalents and restricted cash at beginning of period
22.4

 
24.9

Cash, cash equivalents and restricted cash at end of period
$
61.8

 
$
14.6


Clearwater Paper Corporation
Segment Information
(Dollars in millions) (Unaudited)


Three Months Ended
 
March 31,
 
2020
 
2019
Segment net sales:


Consumer Products
$
265.7

 
$
223.4

Pulp and Paperboard
212.2

 
205.4

Total segment net sales
$
477.9

 
$
428.8


Operating income:


Consumer Products
$
14.3

 
$
1.3

Pulp and Paperboard
26.5

 
29.4

Corporate
(13.4
)
 
(16.6
)
Other operating charges, net
(8.6
)
 
0.3

Income from operations
$
18.8

 
$
14.4


Clearwater Paper Corporation
Reconciliation of Non-GAAP Financial Measures
Adjusted EBITDA1
(Dollars in millions) (Unaudited)


Three Months Ended
 
 
March 31,
 
 
2020
 
2019
Net income
 
$
10.3

 
$
3.8

Add back:


Income tax provision (benefit)
 
(6.2
)
 
0.7

Interest expense, net
 
12.8

 
8.6

Depreciation and amortization expense
 
28.0

 
25.8

Other operating charges, net2
 
8.6

 
(0.3
)
Other non-operating expense
 
1.9

 
1.3

Adjusted EBITDA1
 
$
55.4

 
$
39.9


Consumer Products income
 
$
14.3

 
1.3

Depreciation and amortization
 
17.3

 
14.7

Consumer Products Adjusted EBITDA
 
$
31.6

 
$
16.0


Pulp and Paperboard income
 
$
26.5

 
$
29.4

Depreciation and amortization
 
9.3

 
9.5

Pulp and Paperboard Adjusted EBITDA
 
$
35.8

 
$
38.9


Corporate expenses
 
$
(13.4
)
 
$
(16.6
)
Depreciation and amortization
 
1.4

 
1.6

Corporate Adjusted EBITDA
 
$
(12.0
)
 
$
(15.0
)


Consumer Products
 
$
31.6

 
$
16.0

Pulp and Paperboard
 
35.8

 
38.9

Corporate
 
(12.0
)
 
(15.0
)
Adjusted EBITDA
 
$
55.4

 
$
39.9


1 
Adjusted EBITDA is a non-GAAP measure that management uses to evaluate the cash generating capacity of the company. The most directly comparable GAAP measure is net income. Adjusted EBITDA is net income (loss) adjusted for net interest expense (including debt retirement costs), income taxes, depreciation and amortization, non-operating pension and post retirement costs and other operating charges. It should not be considered as an alternative to net earnings computed under GAAP.
2 
Other operating charges, net consist of amounts unrelated to ongoing core operating activities. Please refer to Footnote 10 within Clearwater Paper's Form 10-Q filed with the SEC for the period end March 31, 2020 for the detailed breakout of this amount.


Clearwater Paper Corporation
Reconciliation of Non-GAAP Financial Measures
Adjusted Net Income
(Dollars in millions, except per-share amounts) (Unaudited)


Three months ended
 
 
March 31,
 
 
2020
 
2019
Net income
 
$
10.3

 
$
3.8

Add back:


Income tax provision (benefit)
 
(6.2
)
 
0.7

Income before income taxes
 
4.1

 
4.5


Add back:


Other operating charges, net
 
8.6

 
(0.3
)
Adjusted net income before tax
 
$
12.7

 
$
4.2

Normalized income tax provision
 
3.2

 
1.1

Adjusted net income
 
$
9.5

 
$
3.1


Weighted average diluted shares
 
16,615

 
16,563


Adjusted net income per diluted share
 
$
0.57

 
$
0.19


Clearwater Paper Corporation

Investors contact:
Sloan Bohlen
Solebury Trout
509.344.5906

News media:
Shannon Myers
509.344.5967

[email protected]


Clearwater Paper Corporation FIRST QUARTER 2020 SUPPLEMENTAL INFORMATION May 5, 2020 ARSEN S. KITCH PRESIDENT, CHIEF EXECUTIVE OFFICER AND DIRECTOR MICHAEL J. MURPHY SENIOR VICE PRESIDENT AND CHIEF FINANCIAL OFFICER

 
Forward-Looking Statements This presentation of supplemental information contains, in addition to historical information, certain forward-looking statements within the meaning of the Private Securities Litigation Reform Act of 1995, including statements regarding our response to COVID-19 and the impact of COVID-19 on consumer behavior, our business and operations; industry trends in response to COVID-19 and potential recession; improvements to our cost structure; Q2 2020 outlook for net income (loss), Adjusted EBITDA, operating income (loss), adjusted operating income (loss), net earnings (loss), adjusted net earnings (loss), net earnings (loss) per diluted common share, and adjusted net earnings (loss) per diluted common share, product pricing and sales mix, product volumes shipped, costs, net sales and adjusted operating margin; our capital structure and liquidity; and near-term strategic positioning and market assessment. These forward- looking statements are based on management’s current expectations, estimates, assumptions and projections that are subject to change. Our actual results of operations may differ materially from those expressed or implied by the forward-looking statements contained in this presentation. Important factors that could cause or contribute to such differences include the risks and uncertainties described from time to time in the company's public filings with the Securities and Exchange Commission, including but not limited to the following: • impact of COVID-19 on our operations and our supplier’s operations and on customer demand; • competitive pricing pressures for our products, including as a result of increased capacity as additional manufacturing facilities are operated by our competitors and the impact of foreign currency fluctuations on the pricing of products globally; • the loss of, changes in prices in regard to, or reduction in, orders from a significant customer; • changes in the cost and availability of wood fiber and wood pulp; • changes in transportation costs and disruptions in transportation services; • changes in customer product preferences and competitors' product offerings; • larger competitors having operational and other advantages; • customer acceptance and timing and quantity of purchases of our tissue products, including the existence of sufficient demand for and the quality of tissue produced by our expanded Shelby, North Carolina operations; • consolidation and vertical integration of converting operations in the paperboard industry; • our ability to successfully implement our operational efficiencies and cost savings strategies, along with related capital projects, and achieve the expected operational or financial results of those projects, including from the continuous digester at our Lewiston, Idaho facility; • changes in the U.S. and international economies and in general economic conditions in the regions and industries in which we operate; • manufacturing or operating disruptions, including IT system and IT system implementation failures, equipment malfunctions and damage to our manufacturing facilities; • cyber-security risks; • changes in costs for and availability of packaging supplies, chemicals, energy and maintenance and repairs; • labor disruptions; • cyclical industry conditions; • changes in expenses, required contributions and potential withdrawal costs associated with our pension plans; • environmental liabilities or expenditures; • reliance on a limited number of third-party suppliers for raw materials; • our ability to attract, motivate, train and retain qualified and key personnel; • our substantial indebtedness and ability to service our debt obligations; • restrictions on our business from debt covenants and terms; • negative changes in our credit agency ratings; and • changes in laws, regulations or industry standards affecting our business. Forward-looking statements contained in this presentation present management’s views only as of the date of this presentation. We undertake no obligation to publicly update forward-looking statements, to retract future revisions of management's views based on events or circumstances occurring after the date of this presentation. Page 2 © Clearwater Paper Corporation 2020
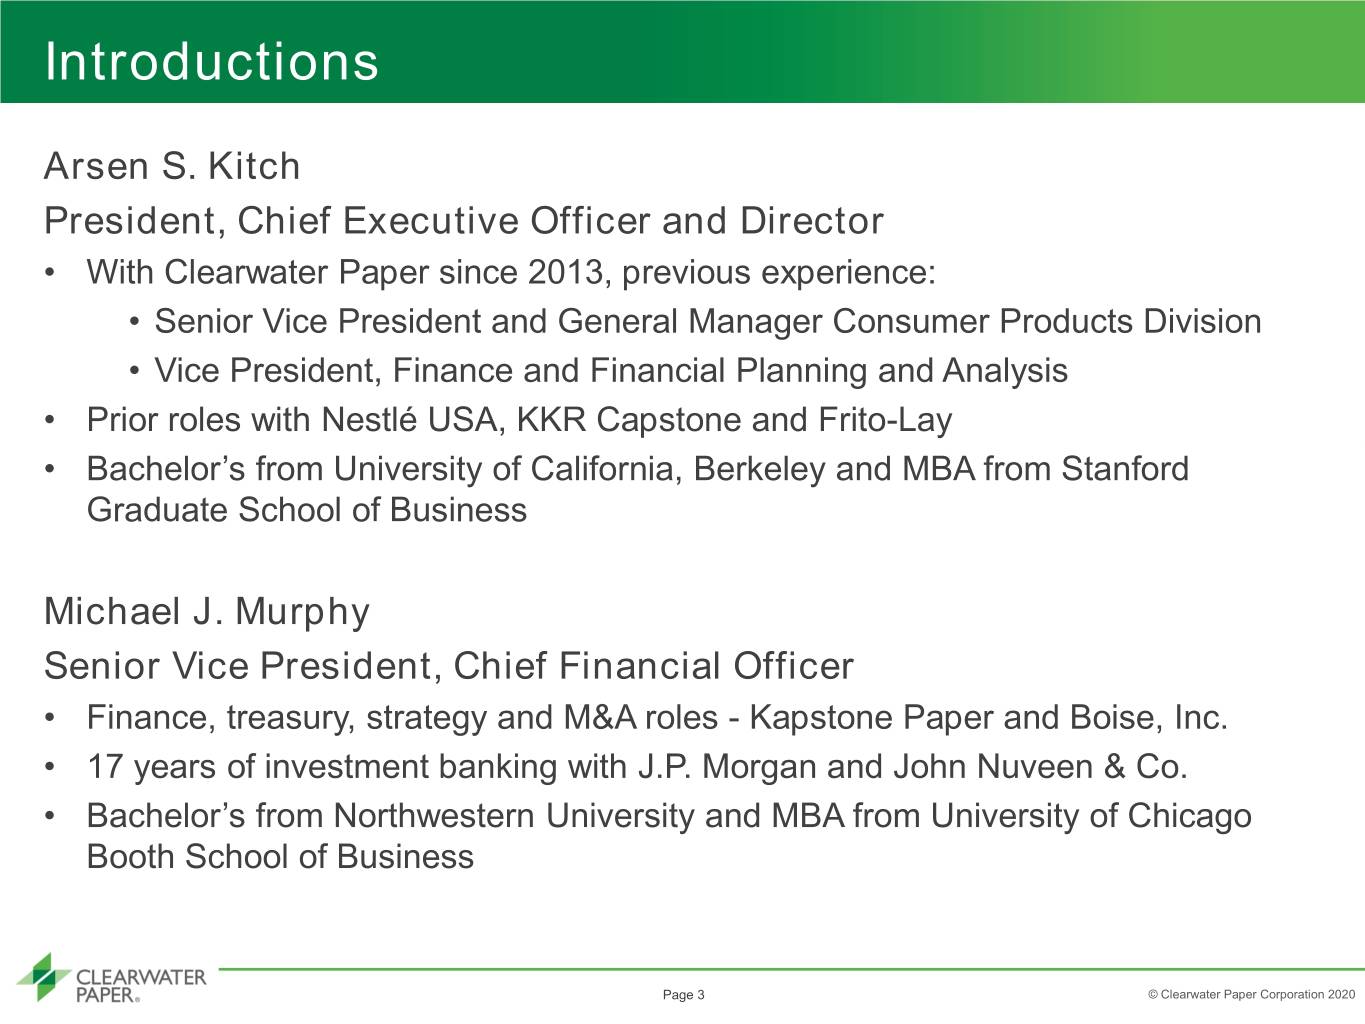

 
Introductions Arsen S. Kitch President, Chief Executive Officer and Director • With Clearwater Paper since 2013, previous experience: • Senior Vice President and General Manager Consumer Products Division • Vice President, Finance and Financial Planning and Analysis • Prior roles with Nestlé USA, KKR Capstone and Frito-Lay • Bachelor’s from University of California, Berkeley and MBA from Stanford Graduate School of Business Michael J. Murphy Senior Vice President, Chief Financial Officer • Finance, treasury, strategy and M&A roles - Kapstone Paper and Boise, Inc. • 17 years of investment banking with J.P. Morgan and John Nuveen & Co. • Bachelor’s from Northwestern University and MBA from University of Chicago Booth School of Business Page 3 © Clearwater Paper Corporation 2020
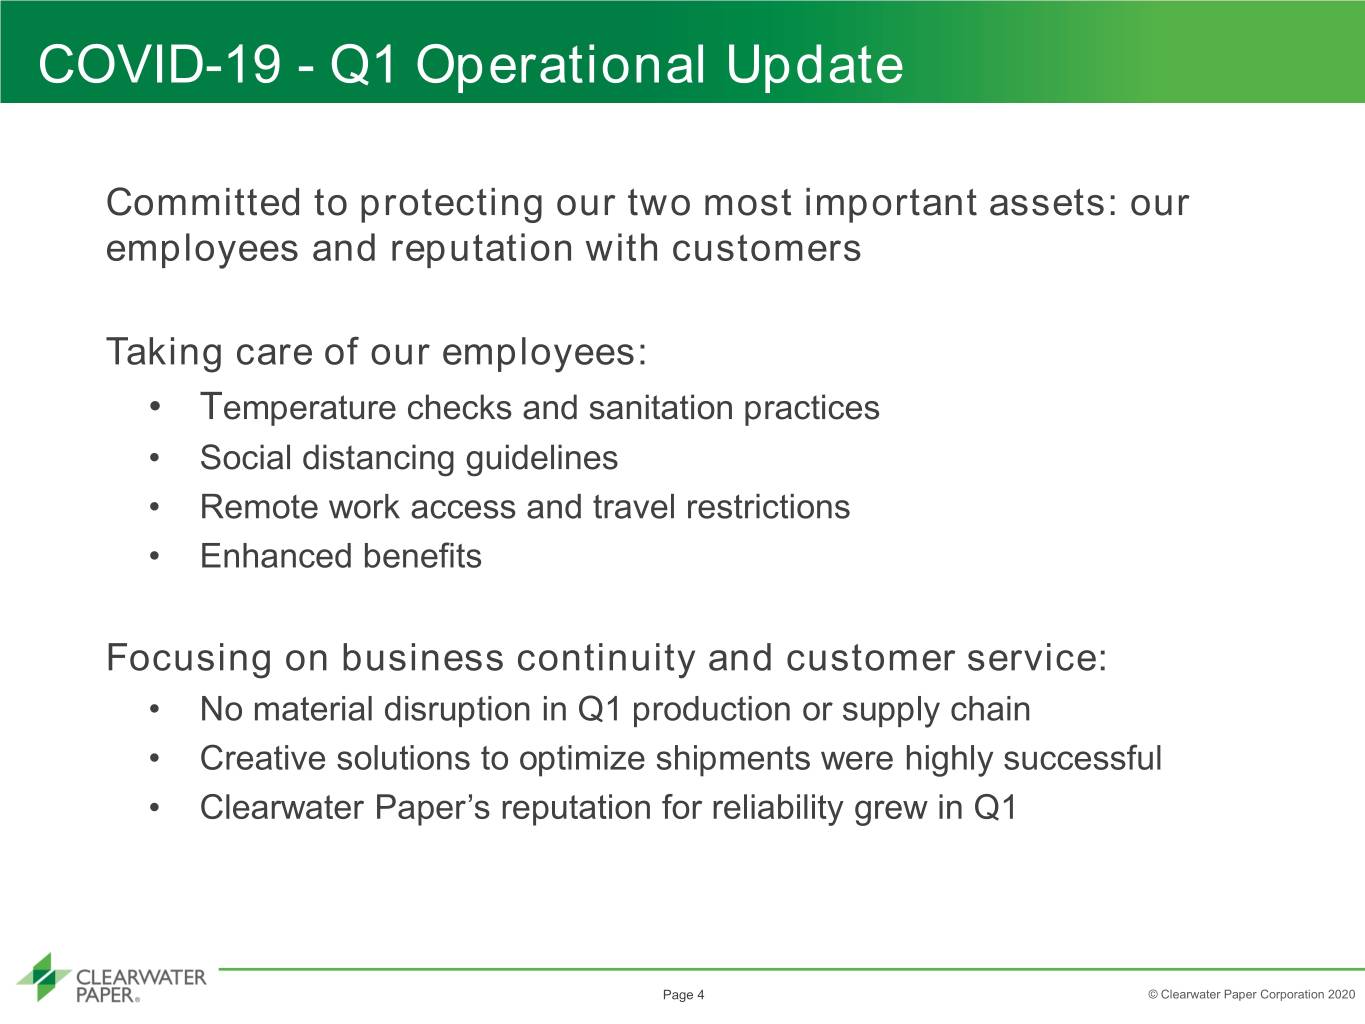

 
COVID-19 - Q1 Operational Update Committed to protecting our two most important assets: our employees and reputation with customers Taking care of our employees: • Temperature checks and sanitation practices • Social distancing guidelines • Remote work access and travel restrictions • Enhanced benefits Focusing on business continuity and customer service: • No material disruption in Q1 production or supply chain • Creative solutions to optimize shipments were highly successful • Clearwater Paper’s reputation for reliability grew in Q1 Page 4 © Clearwater Paper Corporation 2020
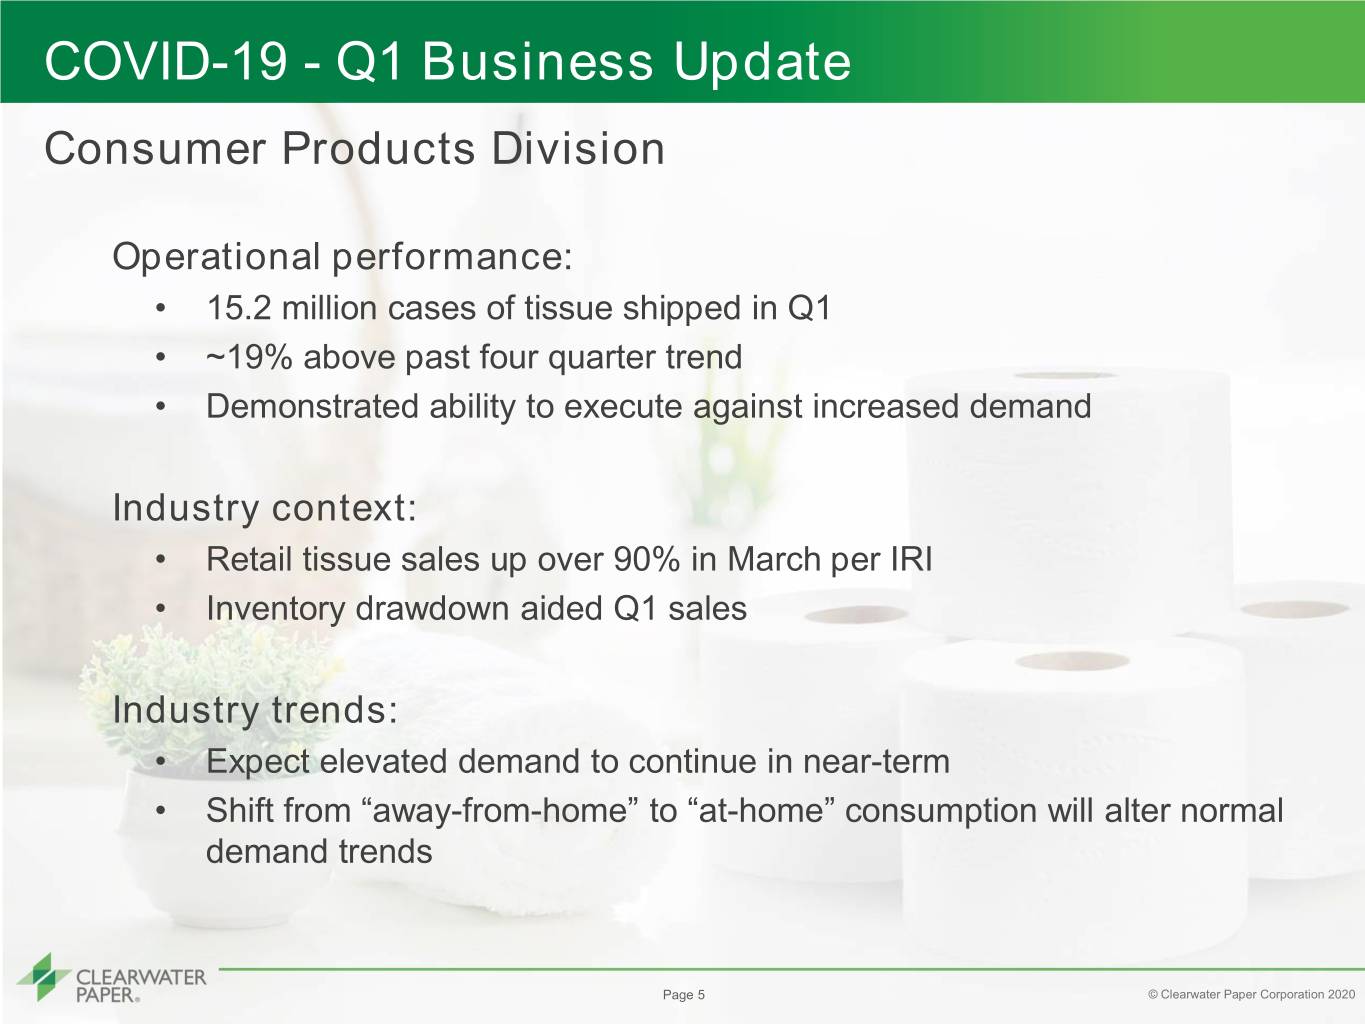

 
COVID-19 - Q1 Business Update Consumer Products Division Operational performance: • 15.2 million cases of tissue shipped in Q1 • ~19% above past four quarter trend • Demonstrated ability to execute against increased demand Industry context: • Retail tissue sales up over 90% in March per IRI • Inventory drawdown aided Q1 sales Industry trends: • Expect elevated demand to continue in near-term • Shift from “away-from-home” to “at-home” consumption will alter normal demand trends Page 5 © Clearwater Paper Corporation 2020
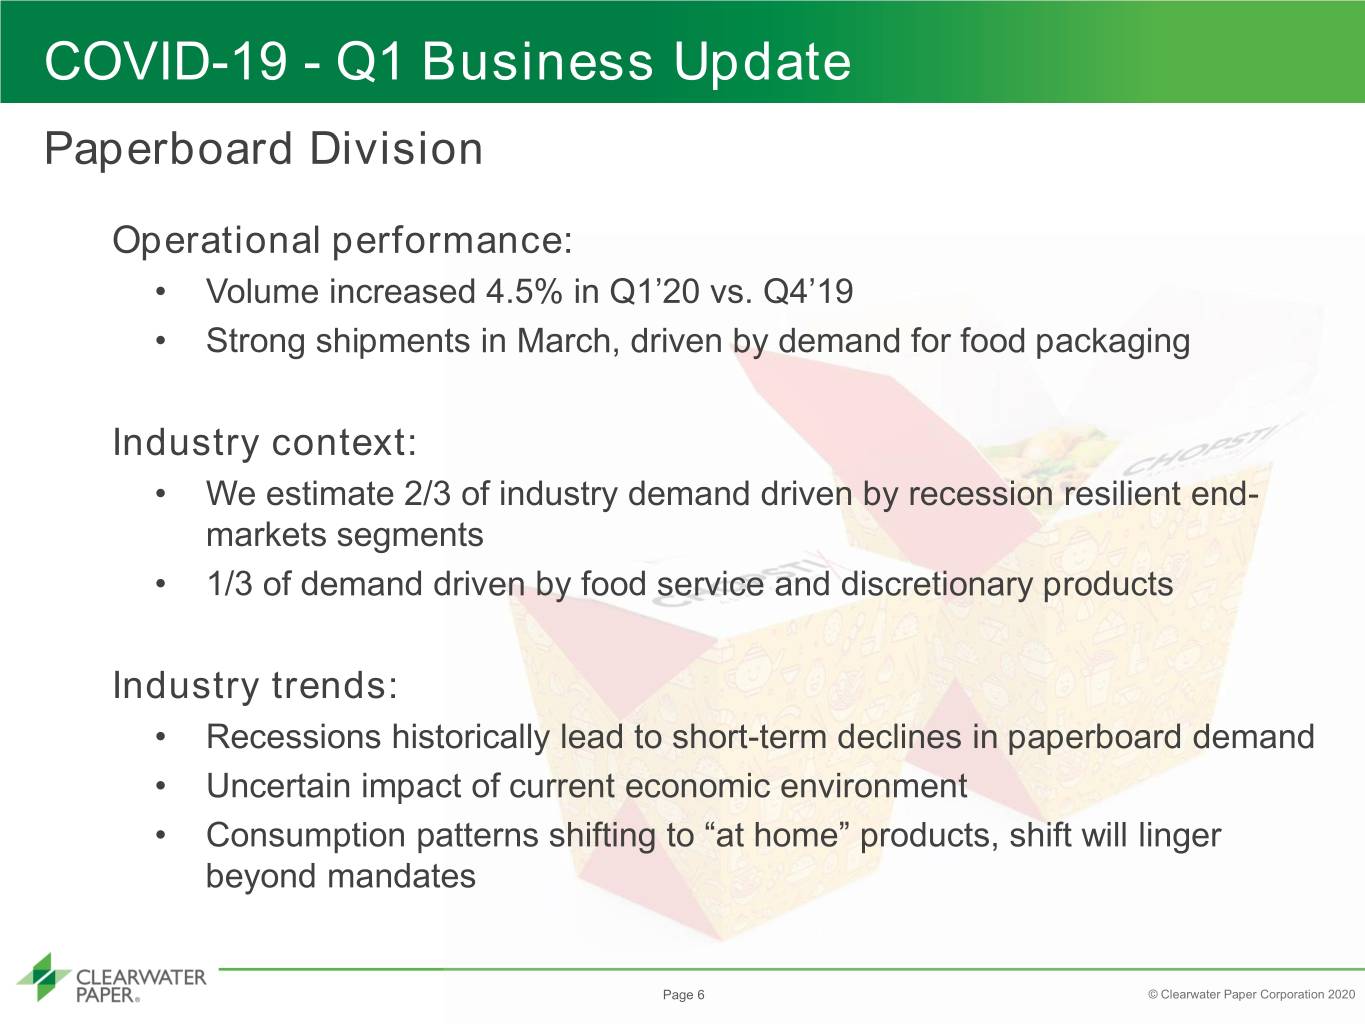

 
COVID-19 - Q1 Business Update Paperboard Division Operational performance: • Volume increased 4.5% in Q1’20 vs. Q4’19 • Strong shipments in March, driven by demand for food packaging Industry context: • We estimate 2/3 of industry demand driven by recession resilient end- markets segments • 1/3 of demand driven by food service and discretionary products Industry trends: • Recessions historically lead to short-term declines in paperboard demand • Uncertain impact of current economic environment • Consumption patterns shifting to “at home” products, shift will linger beyond mandates Page 6 © Clearwater Paper Corporation 2020
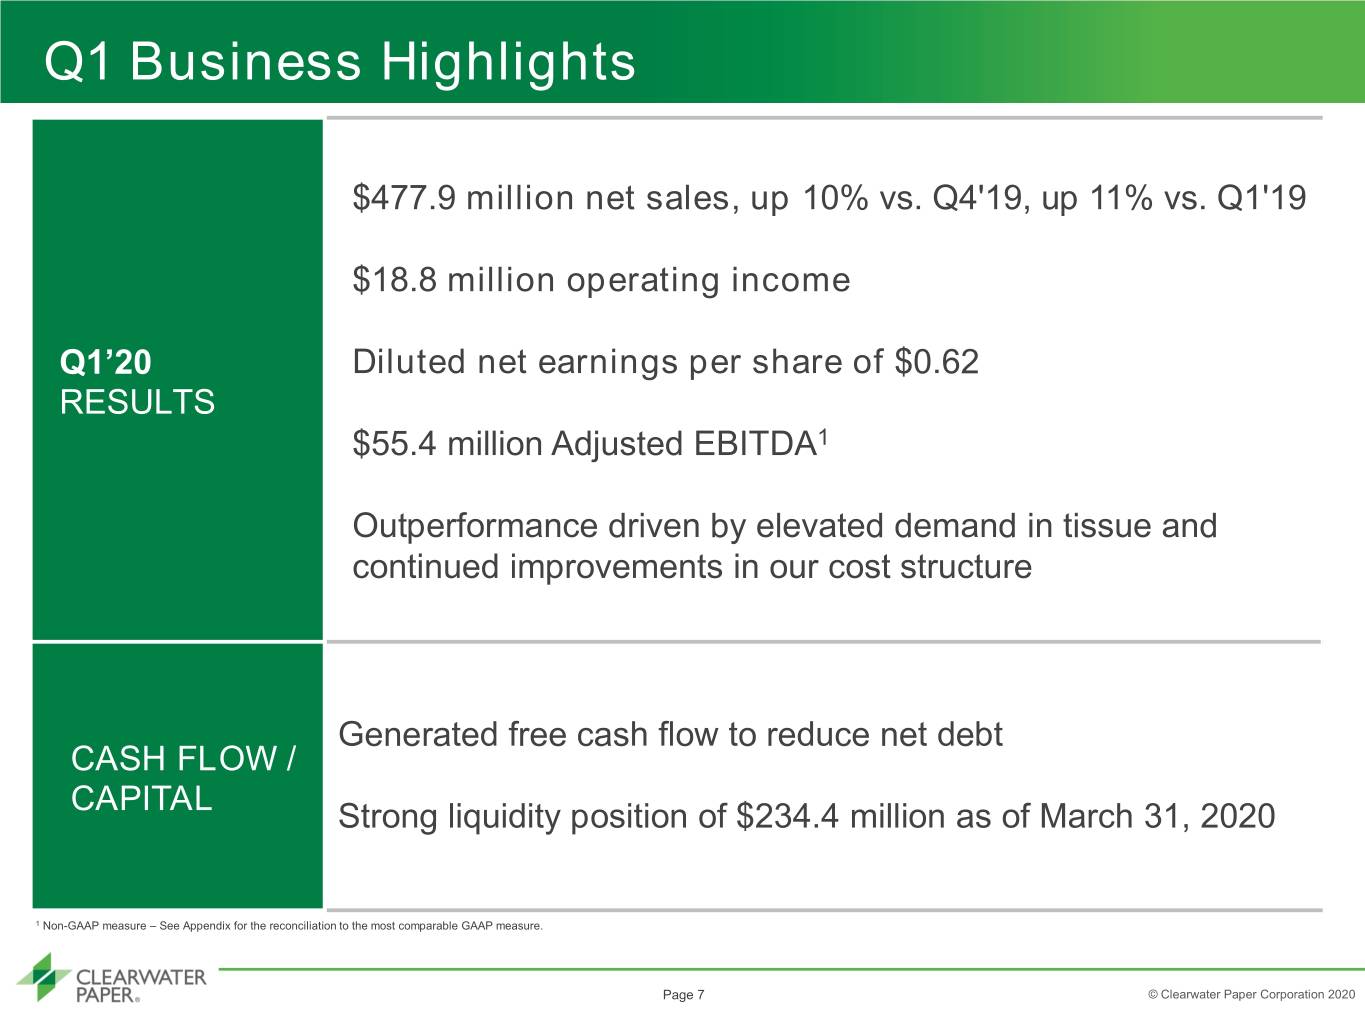

 
Q1 Business Highlights $477.9 million net sales, up 10% vs. Q4'19, up 11% vs. Q1'19 $18.8 million operating income Q1’20 Diluted net earnings per share of $0.62 RESULTS $55.4 million Adjusted EBITDA1 Outperformance driven by elevated demand in tissue and continued improvements in our cost structure Generated free cash flow to reduce net debt CASH FLOW / CAPITAL Strong liquidity position of $234.4 million as of March 31, 2020 1 Non-GAAP measure – See Appendix for the reconciliation to the most comparable GAAP measure. Page 7 © Clearwater Paper Corporation 2020
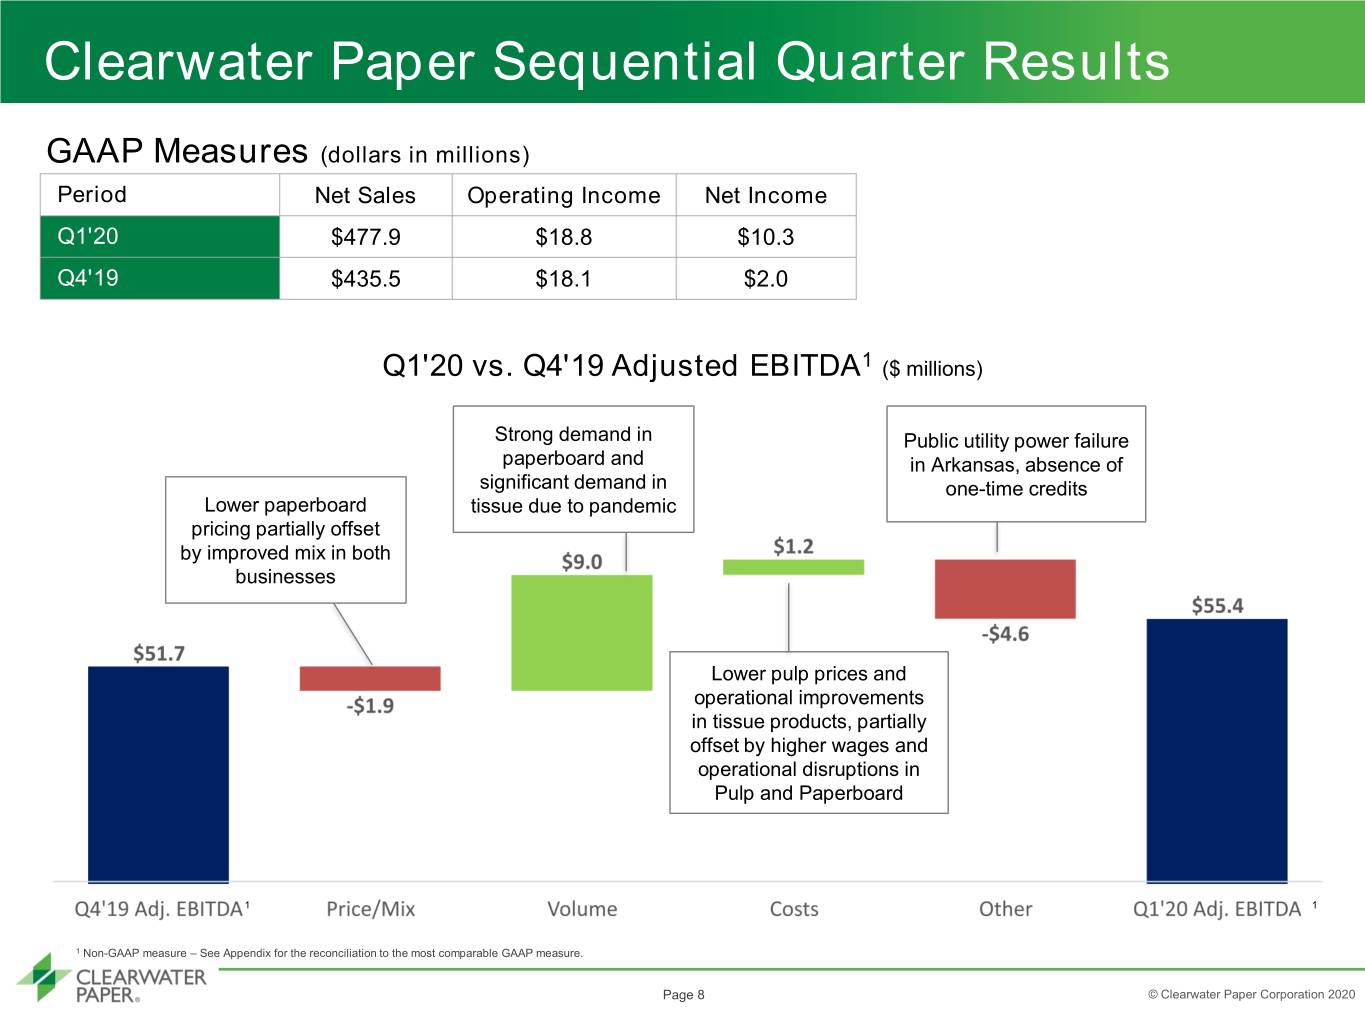

 
Clearwater Paper Sequential Quarter Results GAAP Measures (dollars in millions) Period Net Sales Operating Income Net Income Q1'20 $477.9 $18.8 $10.3 Q4'19 $435.5 $18.1 $2.0 Q1'20 vs. Q4'19 Adjusted EBITDA1 ($ millions) Strong demand in Public utility power failure paperboard and in Arkansas, absence of significant demand in one-time credits Lower paperboard tissue due to pandemic pricing partially offset by improved mix in both businesses Lower pulp prices and operational improvements in tissue products, partially offset by higher wages and operational disruptions in Pulp and Paperboard 1 1 1 Non-GAAP measure – See Appendix for the reconciliation to the most comparable GAAP measure. Page 8 © Clearwater Paper Corporation 2020
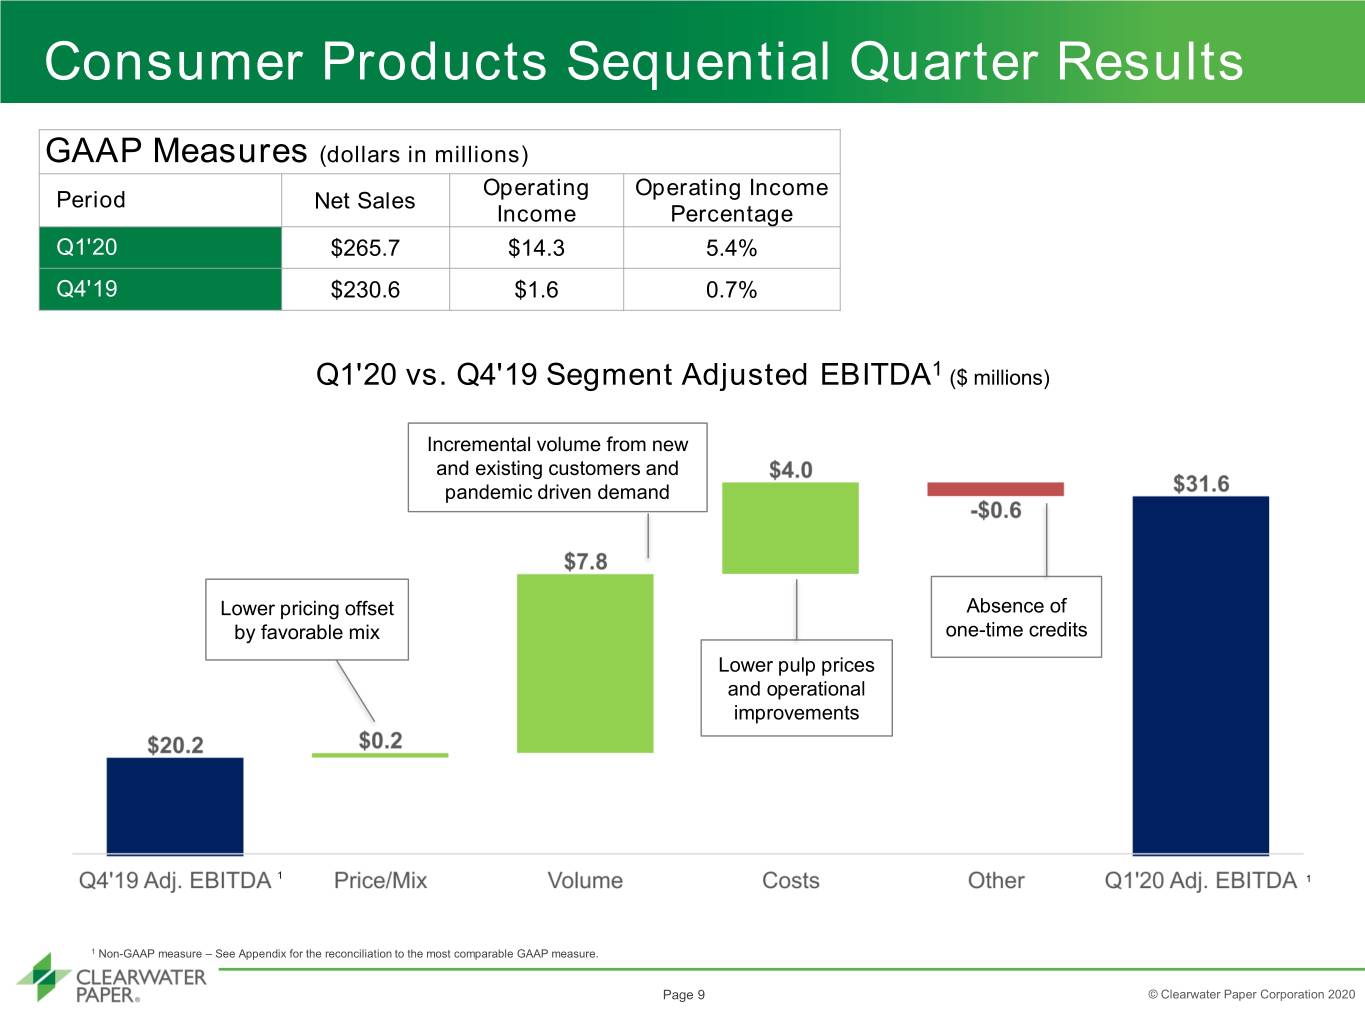

 
Consumer Products Sequential Quarter Results GAAP Measures (dollars in millions) Operating Operating Income Period Net Sales Income Percentage Q1'20 $265.7 $14.3 5.4% Q4'19 $230.6 $1.6 0.7% Q1'20 vs. Q4'19 Segment Adjusted EBITDA1 ($ millions) Incremental volume from new and existing customers and pandemic driven demand Lower pricing offset Absence of by favorable mix one-time credits Lower pulp prices and operational improvements 1 1 1 Non-GAAP measure – See Appendix for the reconciliation to the most comparable GAAP measure. Page 9 © Clearwater Paper Corporation 2020
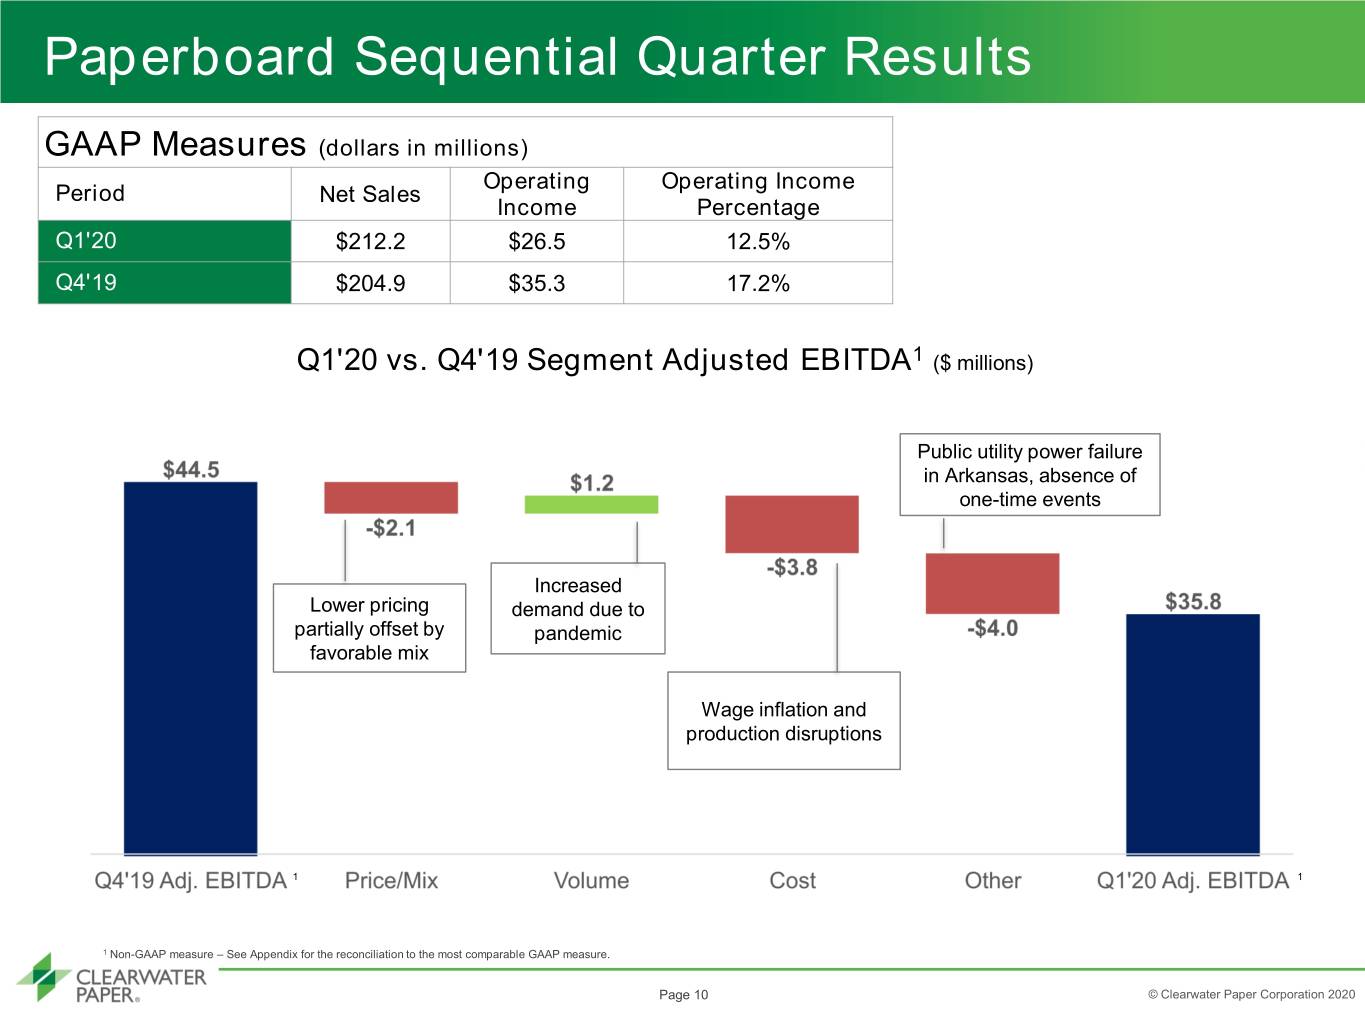

 
Paperboard Sequential Quarter Results GAAP Measures (dollars in millions) Operating Operating Income Period Net Sales Income Percentage Q1'20 $212.2 $26.5 12.5% Q4'19 $204.9 $35.3 17.2% Q1'20 vs. Q4'19 Segment Adjusted EBITDA1 ($ millions) Public utility power failure in Arkansas, absence of one-time events Increased Lower pricing demand due to partially offset by pandemic favorable mix Wage inflation and production disruptions 1 1 1 Non-GAAP measure – See Appendix for the reconciliation to the most comparable GAAP measure. Page 10 © Clearwater Paper Corporation 2020
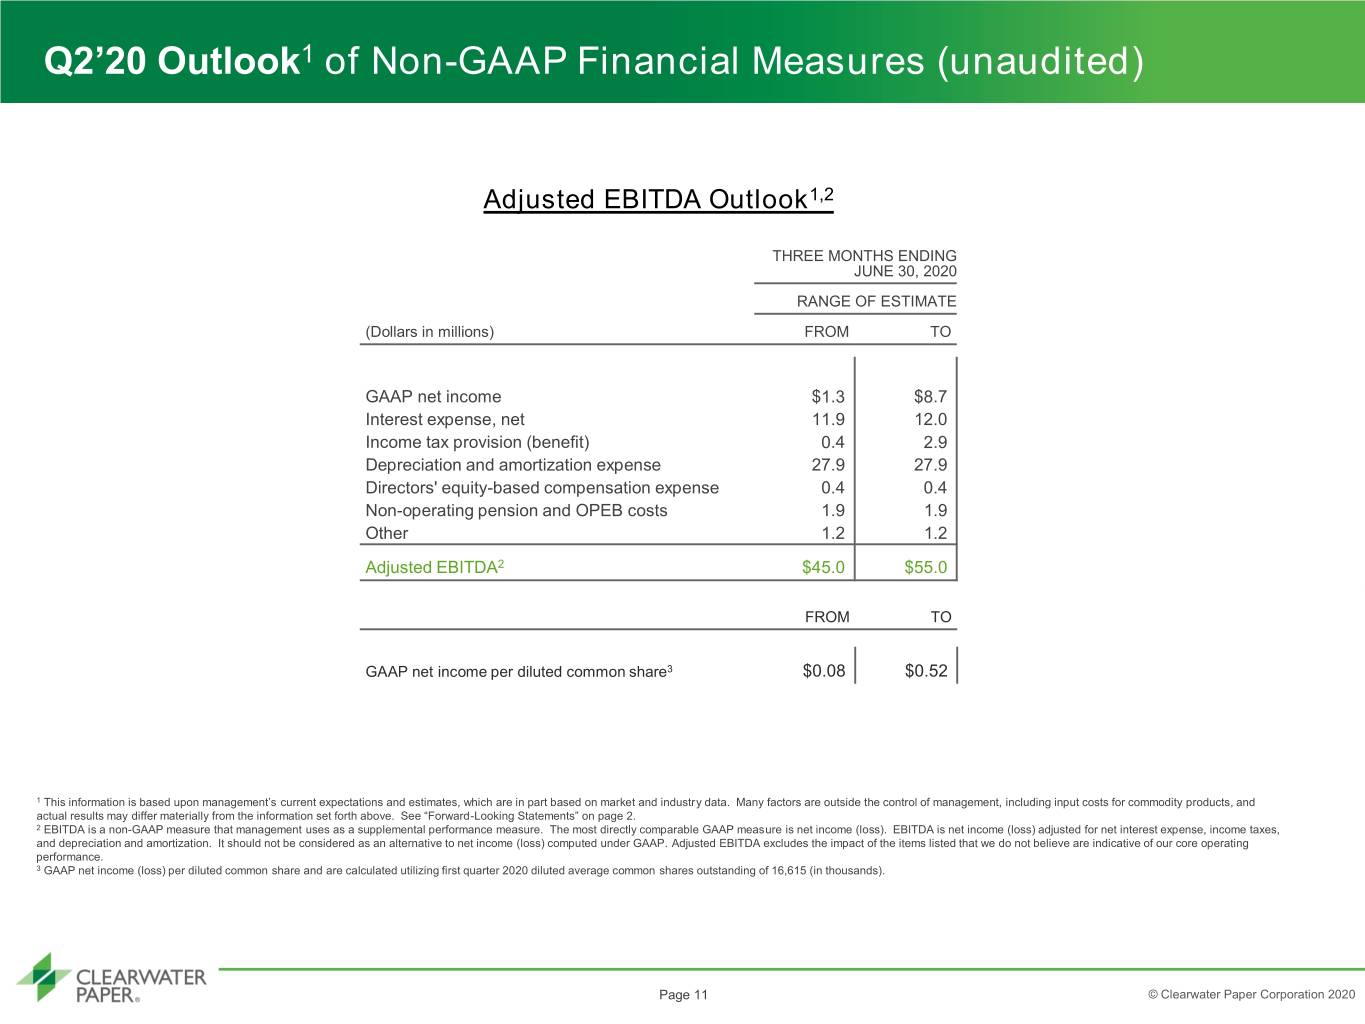

 
Q2’20 Outlook1 of Non-GAAP Financial Measures (unaudited) Adjusted EBITDA Outlook1,2 OUTLOOK THREE MONTHS ENDING JUNE 30, 2020 RANGE OF ESTIMATE (Dollars in millions) FROM TO GAAP net income $1.3 $8.7 Interest expense, net 11.9 12.0 Income tax provision (benefit) 0.4 2.9 Depreciation and amortization expense 27.9 27.9 Directors' equity-based compensation expense 0.4 0.4 Non-operating pension and OPEB costs 1.9 1.9 Other 1.2 1.2 Adjusted EBITDA2 $45.0 $55.0 FROM TO GAAP net income per diluted common share3 $0.08 $0.52 1 This information is based upon management’s current expectations and estimates, which are in part based on market and industry data. Many factors are outside the control of management, including input costs for commodity products, and actual results may differ materially from the information set forth above. See “Forward-Looking Statements” on page 2. 2 EBITDA is a non-GAAP measure that management uses as a supplemental performance measure. The most directly comparable GAAP measure is net income (loss). EBITDA is net income (loss) adjusted for net interest expense, income taxes, and depreciation and amortization. It should not be considered as an alternative to net income (loss) computed under GAAP. Adjusted EBITDA excludes the impact of the items listed that we do not believe are indicative of our core operating performance. 3 GAAP net income (loss) per diluted common share and are calculated utilizing first quarter 2020 diluted average common shares outstanding of 16,615 (in thousands). Page 11 © Clearwater Paper Corporation 2020
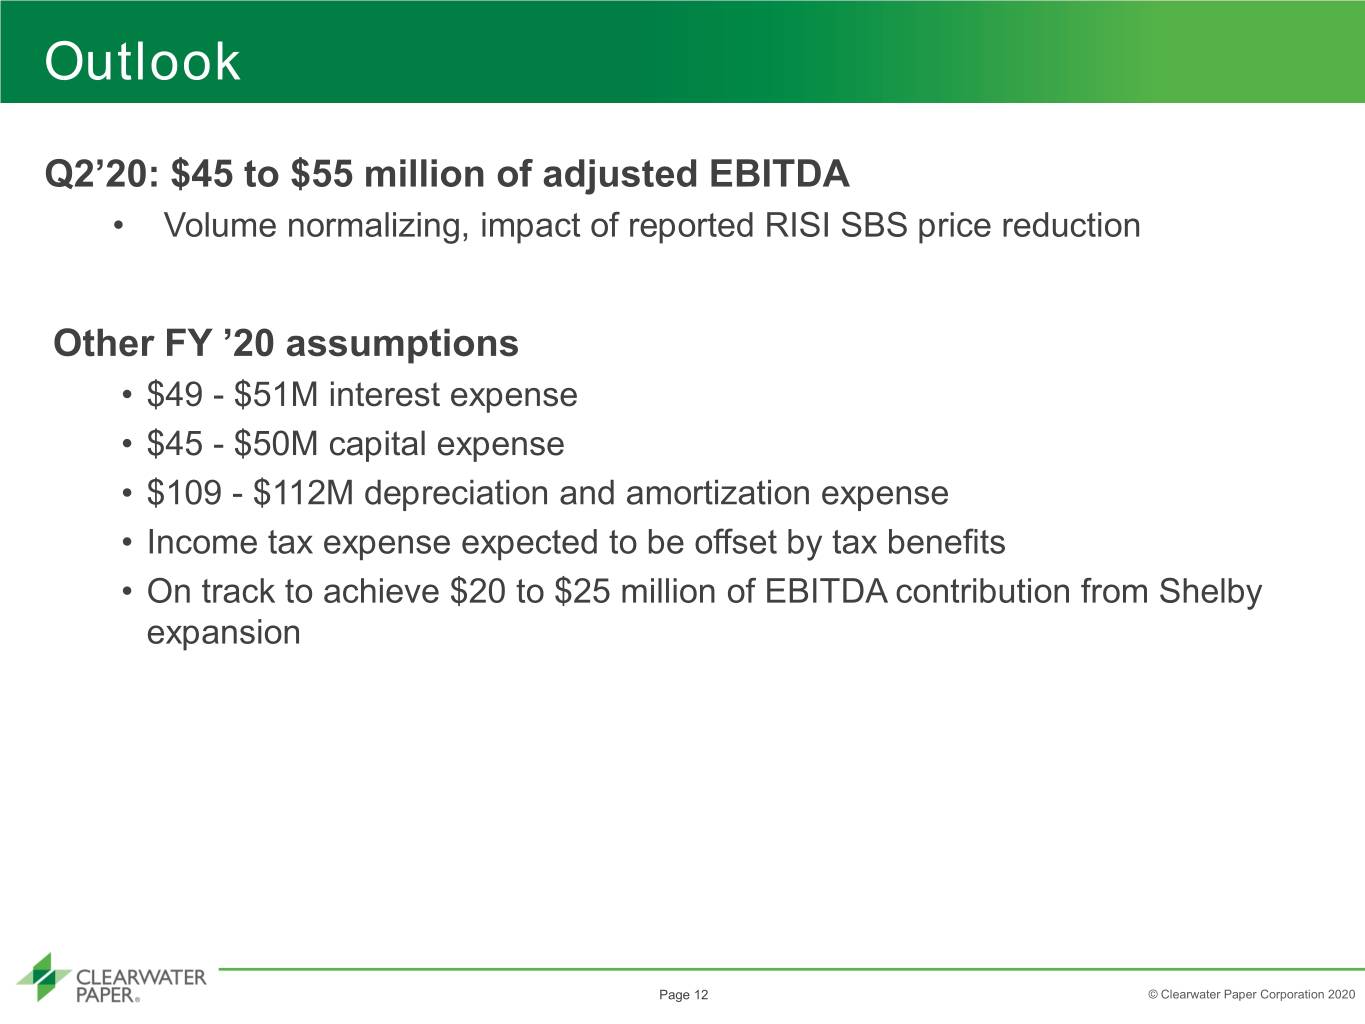

 
Outlook Q2’20: $45 to $55 million of adjusted EBITDA • Volume normalizing, impact of reported RISI SBS price reduction Other FY ’20 assumptions • $49 - $51M interest expense • $45 - $50M capital expense • $109 - $112M depreciation and amortization expense • Income tax expense expected to be offset by tax benefits • On track to achieve $20 to $25 million of EBITDA contribution from Shelby expansion Page 12 © Clearwater Paper Corporation 2020
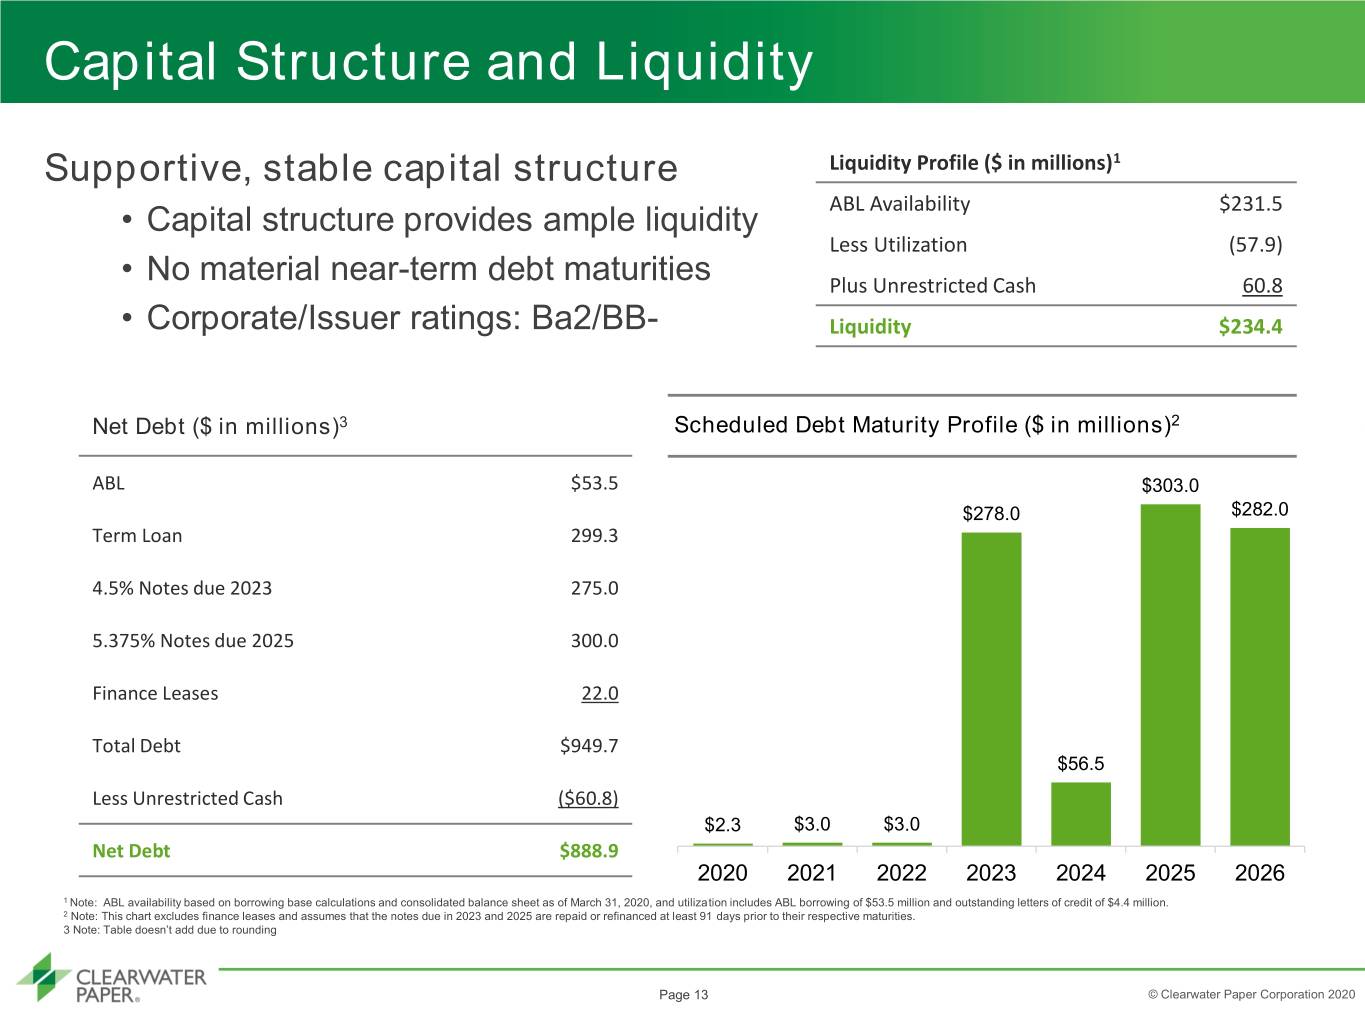

 
Capital Structure and Liquidity Supportive, stable capital structure Liquidity Profile ($ in millions)1 • Capital structure provides ample liquidity ABL Availability $231.5 Less Utilization (57.9) • No material near-term debt maturities Plus Unrestricted Cash 60.8 • Corporate/Issuer ratings: Ba2/BB- Liquidity $234.4 Net Debt ($ in millions)3 Scheduled Debt Maturity Profile ($ in millions)2 ABL $53.5 $303.0 $278.0 $282.0 Term Loan 299.3 4.5% Notes due 2023 275.0 5.375% Notes due 2025 300.0 Finance Leases 22.0 Total Debt $949.7 $56.5 Less Unrestricted Cash ($60.8) $2.3 $3.0 $3.0 Net Debt $888.9 2020 2021 2022 2023 2024 2025 2026 1 Note: ABL availability based on borrowing base calculations and consolidated balance sheet as of March 31, 2020, and utilization includes ABL borrowing of $53.5 million and outstanding letters of credit of $4.4 million. 2 Note: This chart excludes finance leases and assumes that the notes due in 2023 and 2025 are repaid or refinanced at least 91 days prior to their respective maturities. 3 Note: Table doesn’t add due to rounding Page 13 © Clearwater Paper Corporation 2020
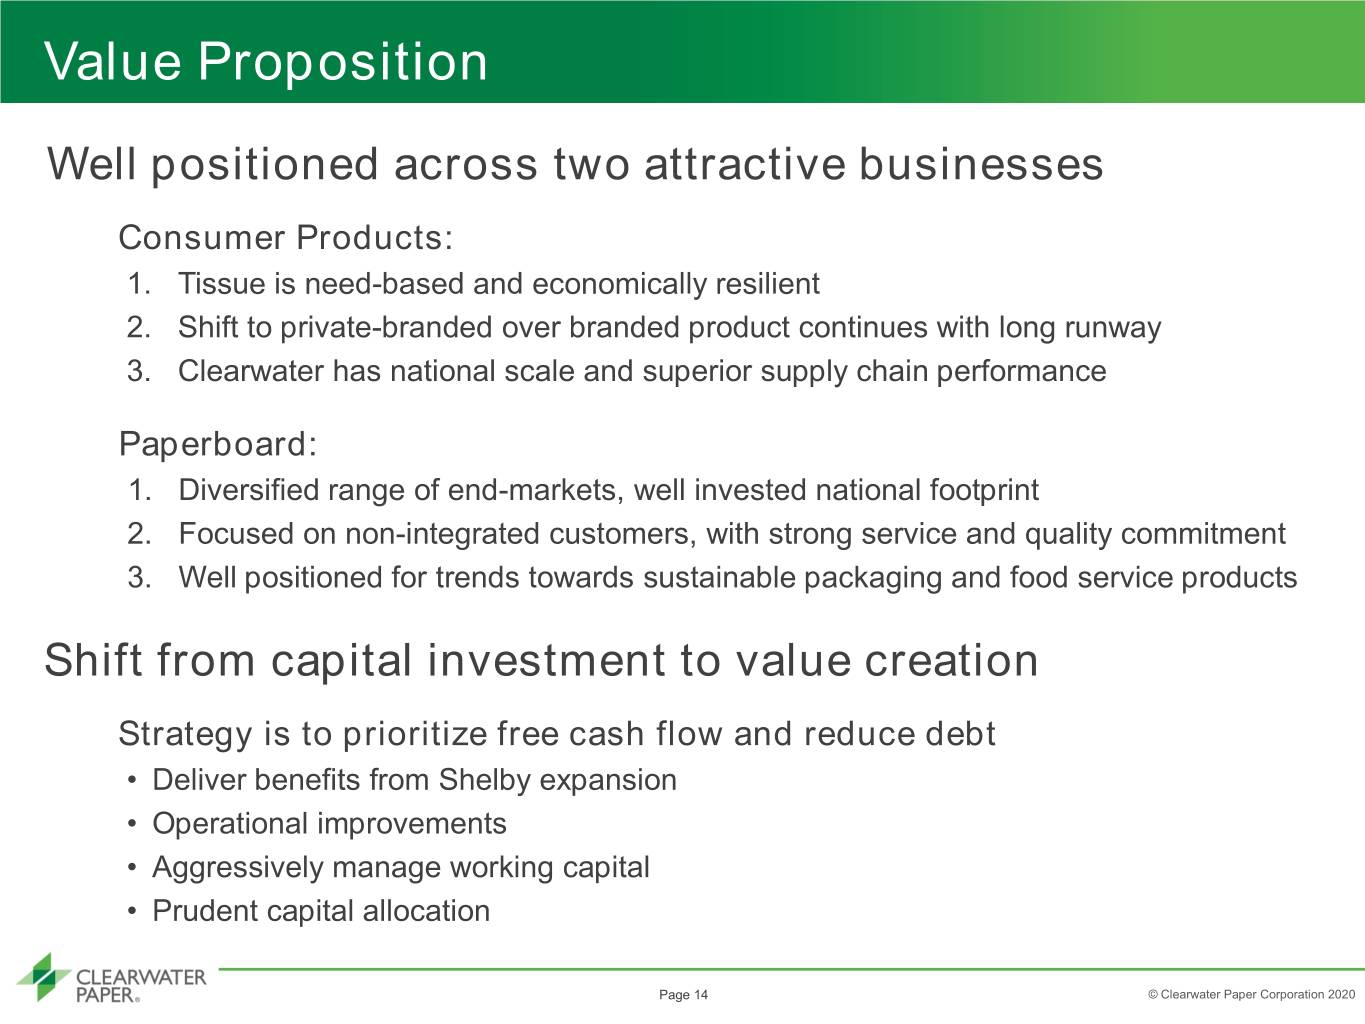

 
Value Proposition Well positioned across two attractive businesses Consumer Products: 1. Tissue is need-based and economically resilient 2. Shift to private-branded over branded product continues with long runway 3. Clearwater has national scale and superior supply chain performance Paperboard: 1. Diversified range of end-markets, well invested national footprint 2. Focused on non-integrated customers, with strong service and quality commitment 3. Well positioned for trends towards sustainable packaging and food service products Shift from capital investment to value creation Strategy is to prioritize free cash flow and reduce debt • Deliver benefits from Shelby expansion • Operational improvements • Aggressively manage working capital • Prudent capital allocation Page 14 © Clearwater Paper Corporation 2020

 
Appendix © Clearwater Paper Corporation 2020
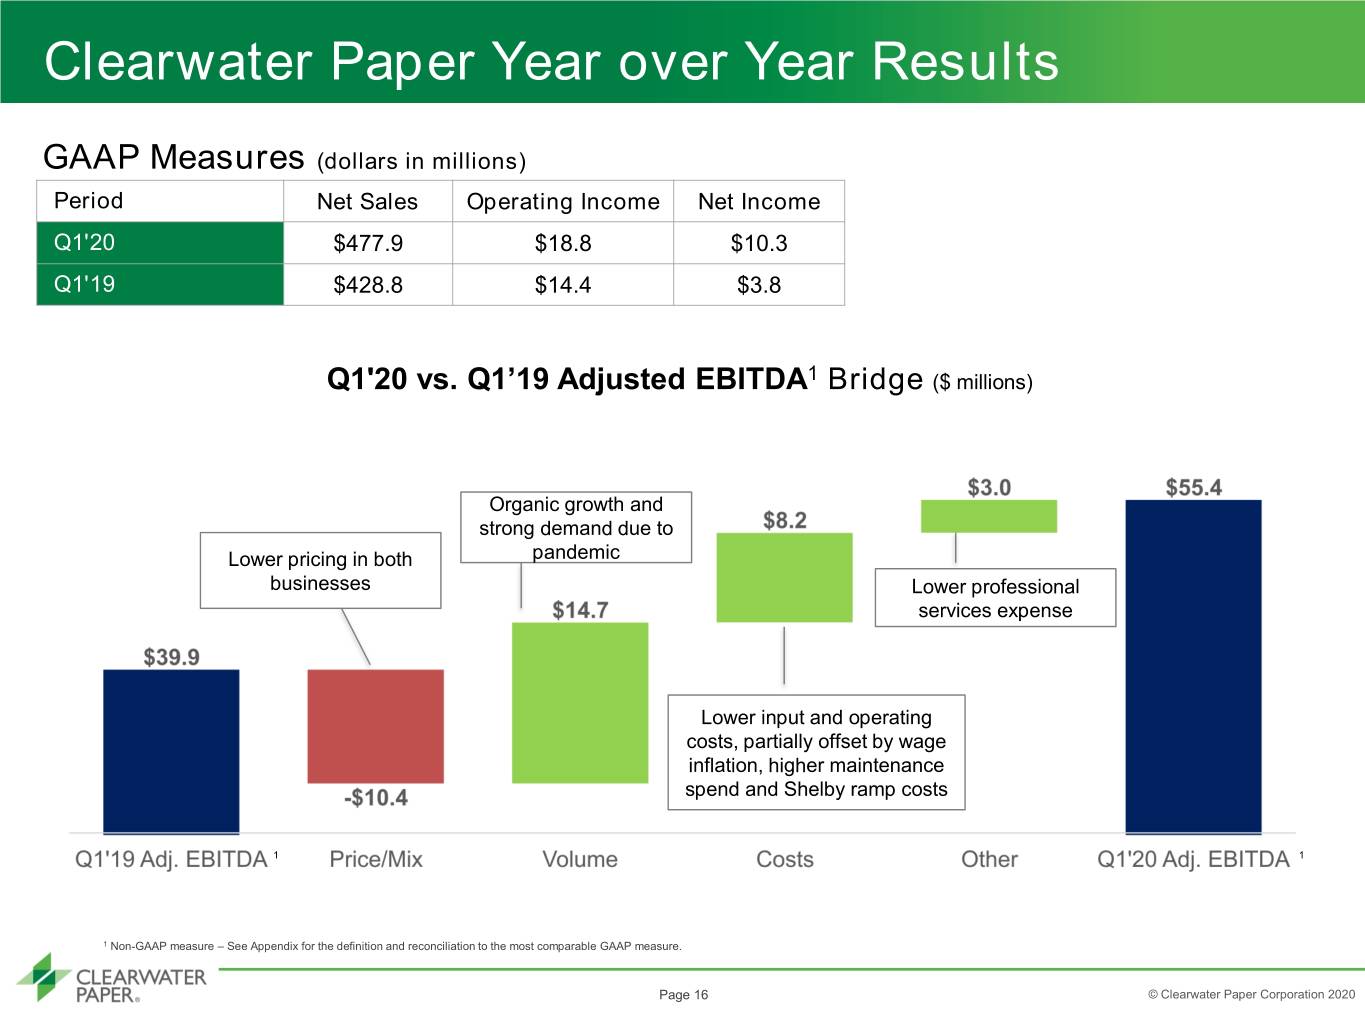

 
Clearwater Paper Year over Year Results GAAP Measures (dollars in millions) Period Net Sales Operating Income Net Income Q1'20 $477.9 $18.8 $10.3 Q1'19 $428.8 $14.4 $3.8 Q1'20 vs. Q1’19 Adjusted EBITDA1 Bridge ($ millions) Organic growth and strong demand due to Lower pricing in both pandemic businesses Lower professional services expense Lower input and operating costs, partially offset by wage inflation, higher maintenance spend and Shelby ramp costs 1 1 1 Non-GAAP measure – See Appendix for the definition and reconciliation to the most comparable GAAP measure. Page 16 © Clearwater Paper Corporation 2020
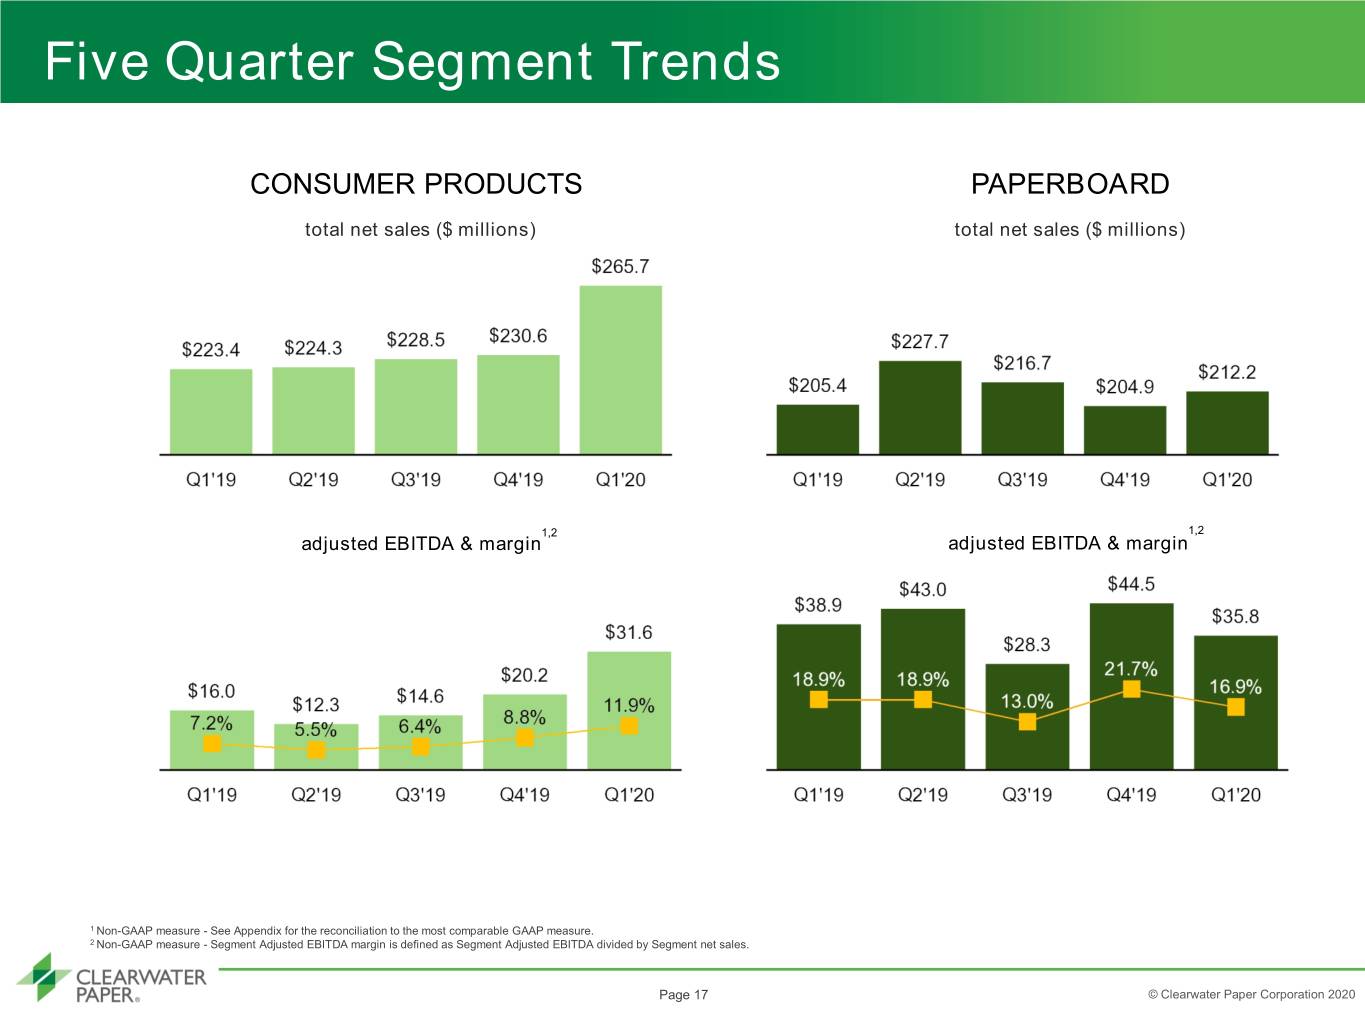

 
Five Quarter Segment Trends CONSUMER PRODUCTS PAPERBOARD total net sales ($ millions) total net sales ($ millions) 1,2 1,2 adjusted EBITDA & margin adjusted EBITDA & margin 1 Non-GAAP measure - See Appendix for the reconciliation to the most comparable GAAP measure. 2 Non-GAAP measure - Segment Adjusted EBITDA margin is defined as Segment Adjusted EBITDA divided by Segment net sales. Page 17 © Clearwater Paper Corporation 2020
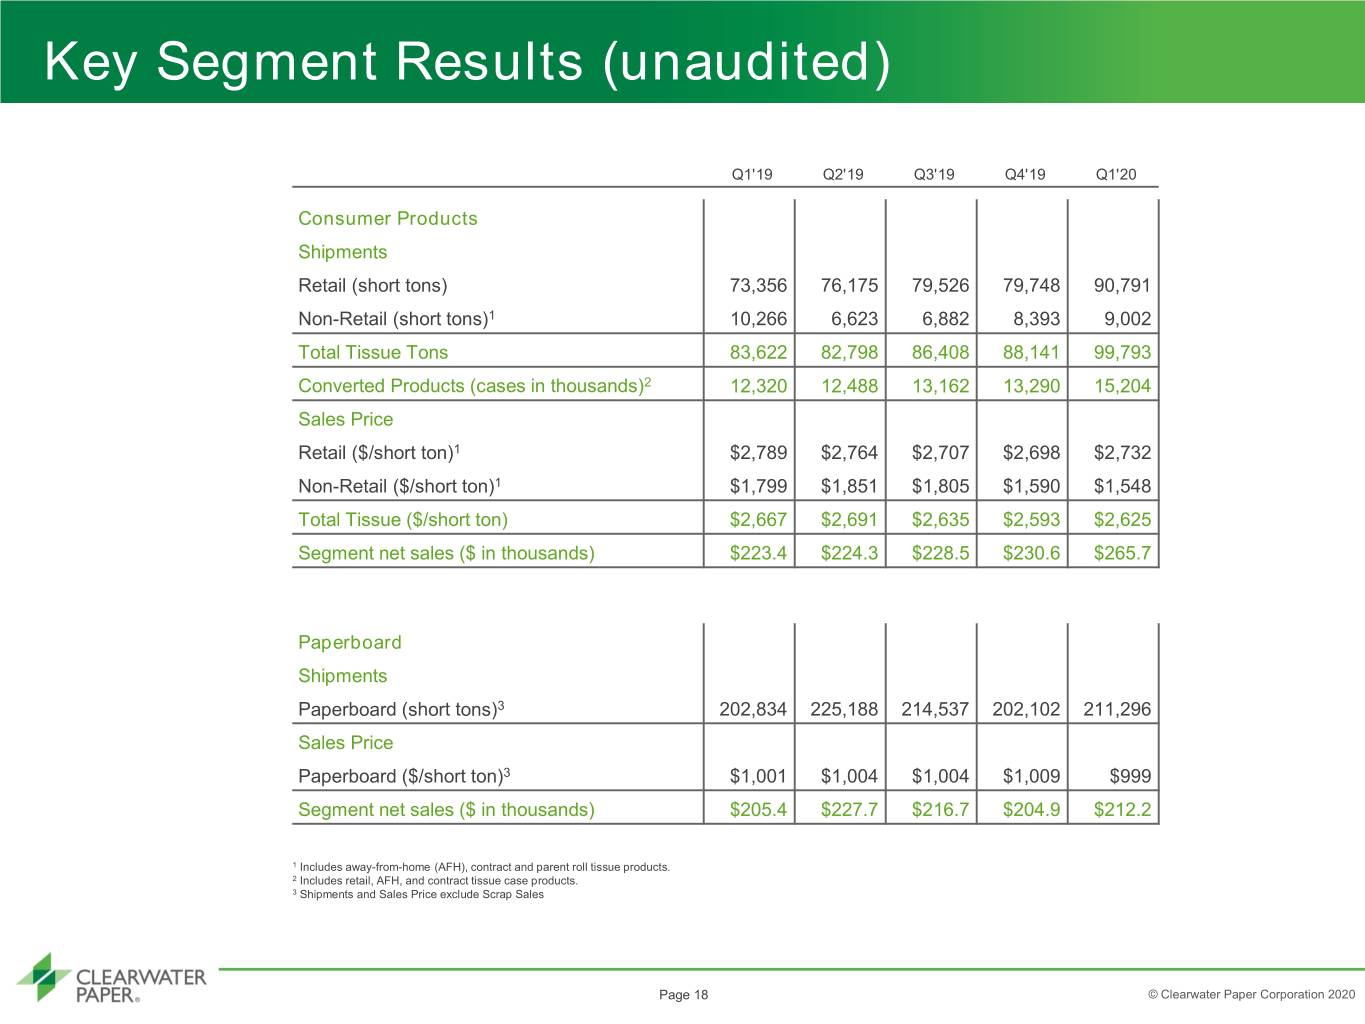

 
Key Segment Results (unaudited) Q1'19 Q2'19 Q3'19 Q4'19 Q1'20 Consumer Products Shipments Retail (short tons) 73,356 76,175 79,526 79,748 90,791 Non-Retail (short tons)1 10,266 6,623 6,882 8,393 9,002 Total Tissue Tons 83,622 82,798 86,408 88,141 99,793 Converted Products (cases in thousands)2 12,320 12,488 13,162 13,290 15,204 Sales Price Retail ($/short ton)1 $2,789 $2,764 $2,707 $2,698 $2,732 Non-Retail ($/short ton)1 $1,799 $1,851 $1,805 $1,590 $1,548 Total Tissue ($/short ton) $2,667 $2,691 $2,635 $2,593 $2,625 Segment net sales ($ in thousands) $223.4 $224.3 $228.5 $230.6 $265.7 Paperboard Shipments Paperboard (short tons)3 202,834 225,188 214,537 202,102 211,296 Sales Price Paperboard ($/short ton)3 $1,001 $1,004 $1,004 $1,009 $999 Segment net sales ($ in thousands) $205.4 $227.7 $216.7 $204.9 $212.2 1 Includes away-from-home (AFH), contract and parent roll tissue products. 2 Includes retail, AFH, and contract tissue case products. 3 Shipments and Sales Price exclude Scrap Sales Page 18 © Clearwater Paper Corporation 2020
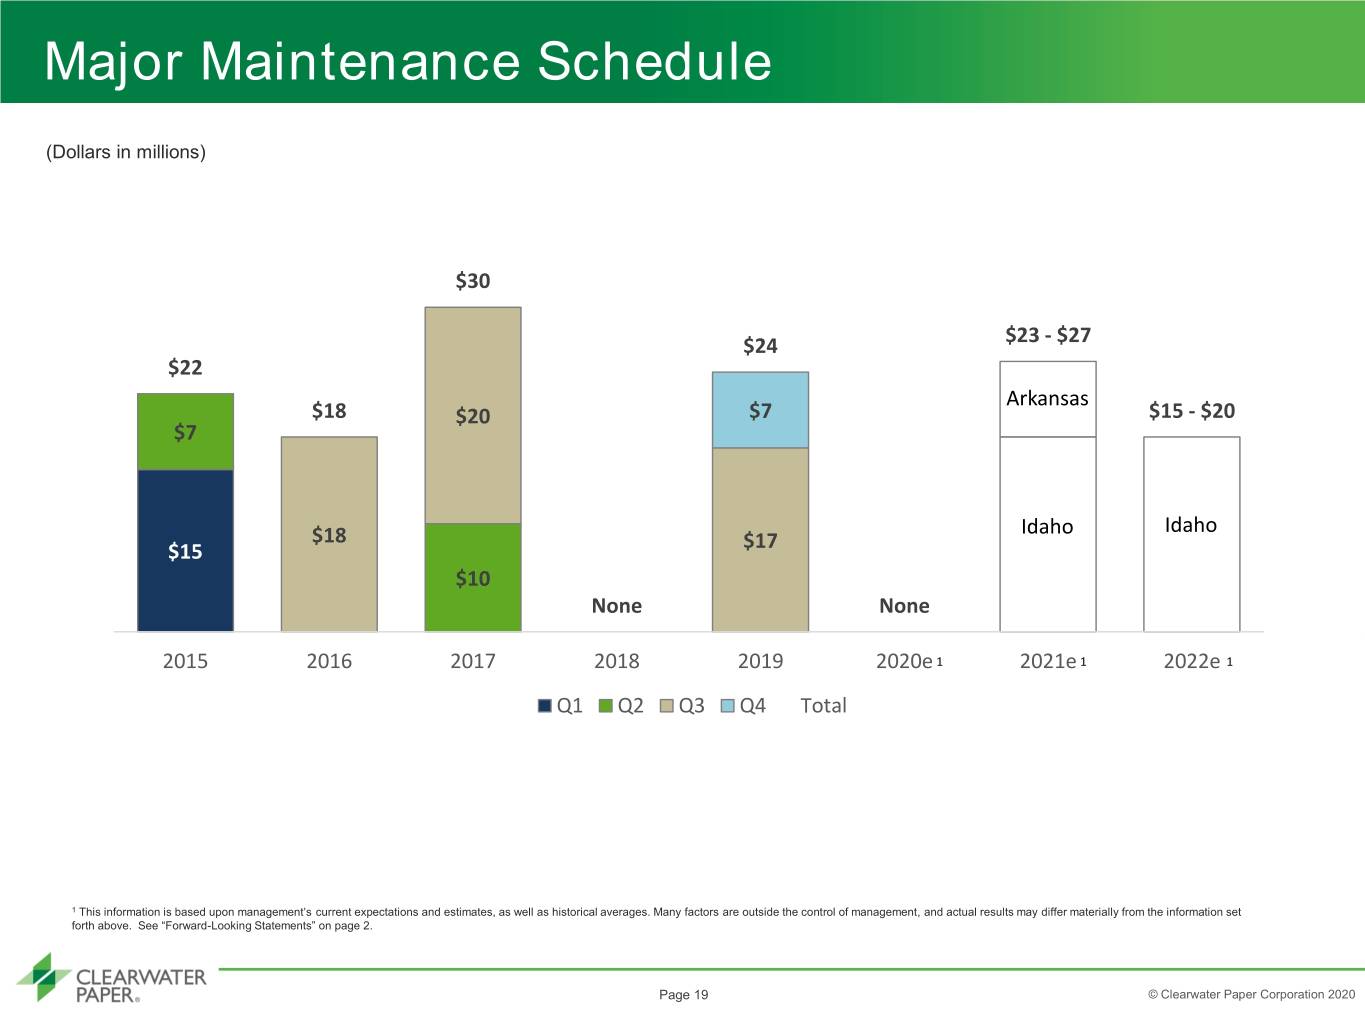

 
Major Maintenance Schedule (Dollars in millions) $30 $24 $23 - $27 $22 Arkansas $18 $20 $7 $15 - $20 $7 $18 Idaho Idaho $15 $17 $10 None None 2015 2016 2017 2018 2019 2020e 1 2021e 1 2022e 1 Q1 Q2 Q3 Q4 Total 1 This information is based upon management’s current expectations and estimates, as well as historical averages. Many factors are outside the control of management, and actual results may differ materially from the information set forth above. See “Forward-Looking Statements” on page 2. Page 19 © Clearwater Paper Corporation 2020
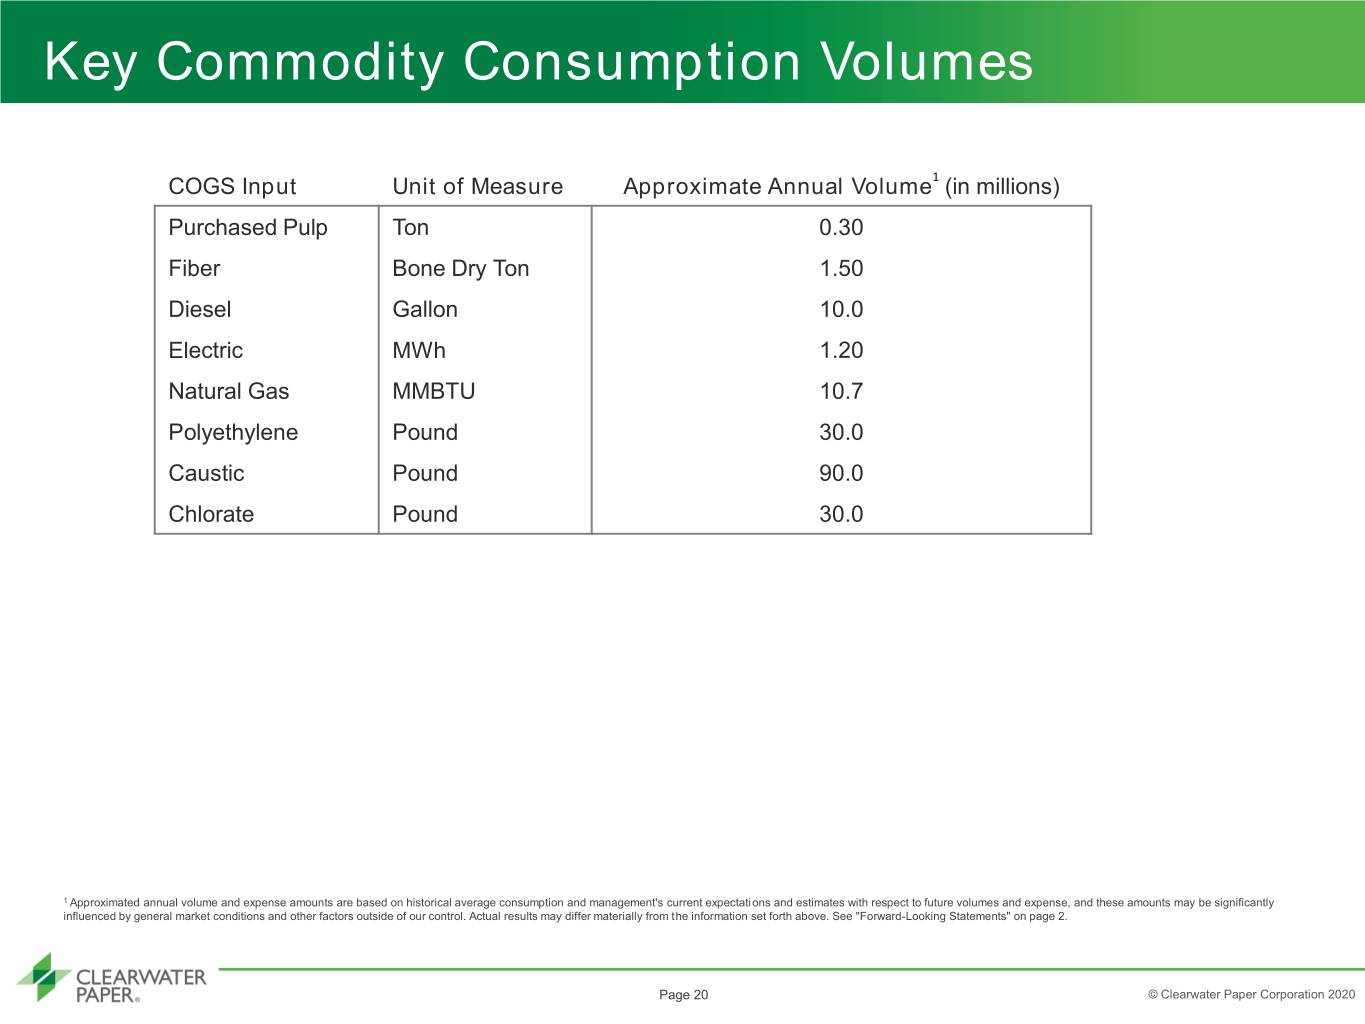

 
Key Commodity Consumption Volumes COGS Input Unit of Measure Approximate Annual Volume 1 (in millions) Purchased Pulp Ton 0.30 Fiber Bone Dry Ton 1.50 Diesel Gallon 10.0 Electric MWh 1.20 Natural Gas MMBTU 10.7 Polyethylene Pound 30.0 Caustic Pound 90.0 Chlorate Pound 30.0 1 Approximated annual volume and expense amounts are based on historical average consumption and management's current expectations and estimates with respect to future volumes and expense, and these amounts may be significantly influenced by general market conditions and other factors outside of our control. Actual results may differ materially from the information set forth above. See "Forward-Looking Statements" on page 2. Page 20 © Clearwater Paper Corporation 2020
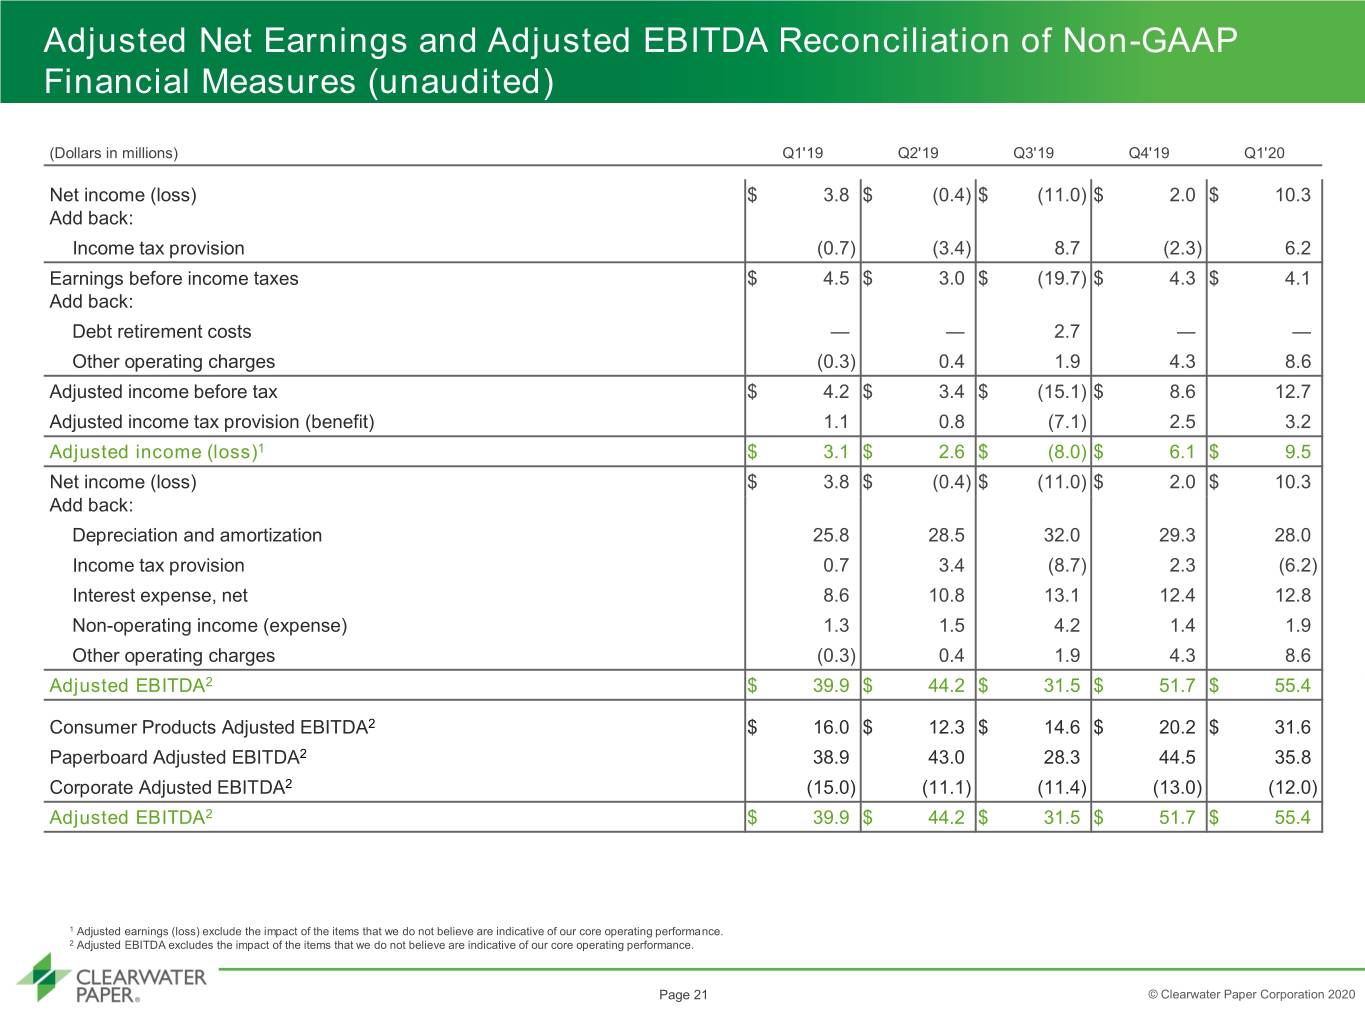

 
Adjusted Net Earnings and Adjusted EBITDA Reconciliation of Non-GAAP Financial Measures (unaudited) (Dollars in millions) Q1'19 Q2'19 Q3'19 Q4'19 Q1'20 Net income (loss) $ 3.8 $ (0.4) $ (11.0) $ 2.0 $ 10.3 Add back: Income tax provision (0.7) (3.4) 8.7 (2.3) 6.2 Earnings before income taxes $ 4.5 $ 3.0 $ (19.7) $ 4.3 $ 4.1 Add back: Debt retirement costs — — 2.7 — — Other operating charges (0.3) 0.4 1.9 4.3 8.6 Adjusted income before tax $ 4.2 $ 3.4 $ (15.1) $ 8.6 12.7 Adjusted income tax provision (benefit) 1.1 0.8 (7.1) 2.5 3.2 Adjusted income (loss)1 $ 3.1 $ 2.6 $ (8.0) $ 6.1 $ 9.5 Net income (loss) $ 3.8 $ (0.4) $ (11.0) $ 2.0 $ 10.3 Add back: Depreciation and amortization 25.8 28.5 32.0 29.3 28.0 Income tax provision 0.7 3.4 (8.7) 2.3 (6.2) Interest expense, net 8.6 10.8 13.1 12.4 12.8 Non-operating income (expense) 1.3 1.5 4.2 1.4 1.9 Other operating charges (0.3) 0.4 1.9 4.3 8.6 Adjusted EBITDA2 $ 39.9 $ 44.2 $ 31.5 $ 51.7 $ 55.4 Consumer Products Adjusted EBITDA2 $ 16.0 $ 12.3 $ 14.6 $ 20.2 $ 31.6 Paperboard Adjusted EBITDA2 38.9 43.0 28.3 44.5 35.8 Corporate Adjusted EBITDA2 (15.0) (11.1) (11.4) (13.0) (12.0) Adjusted EBITDA2 $ 39.9 $ 44.2 $ 31.5 $ 51.7 $ 55.4 1 Adjusted earnings (loss) exclude the impact of the items that we do not believe are indicative of our core operating performance. 2 Adjusted EBITDA excludes the impact of the items that we do not believe are indicative of our core operating performance. Page 21 © Clearwater Paper Corporation 2020
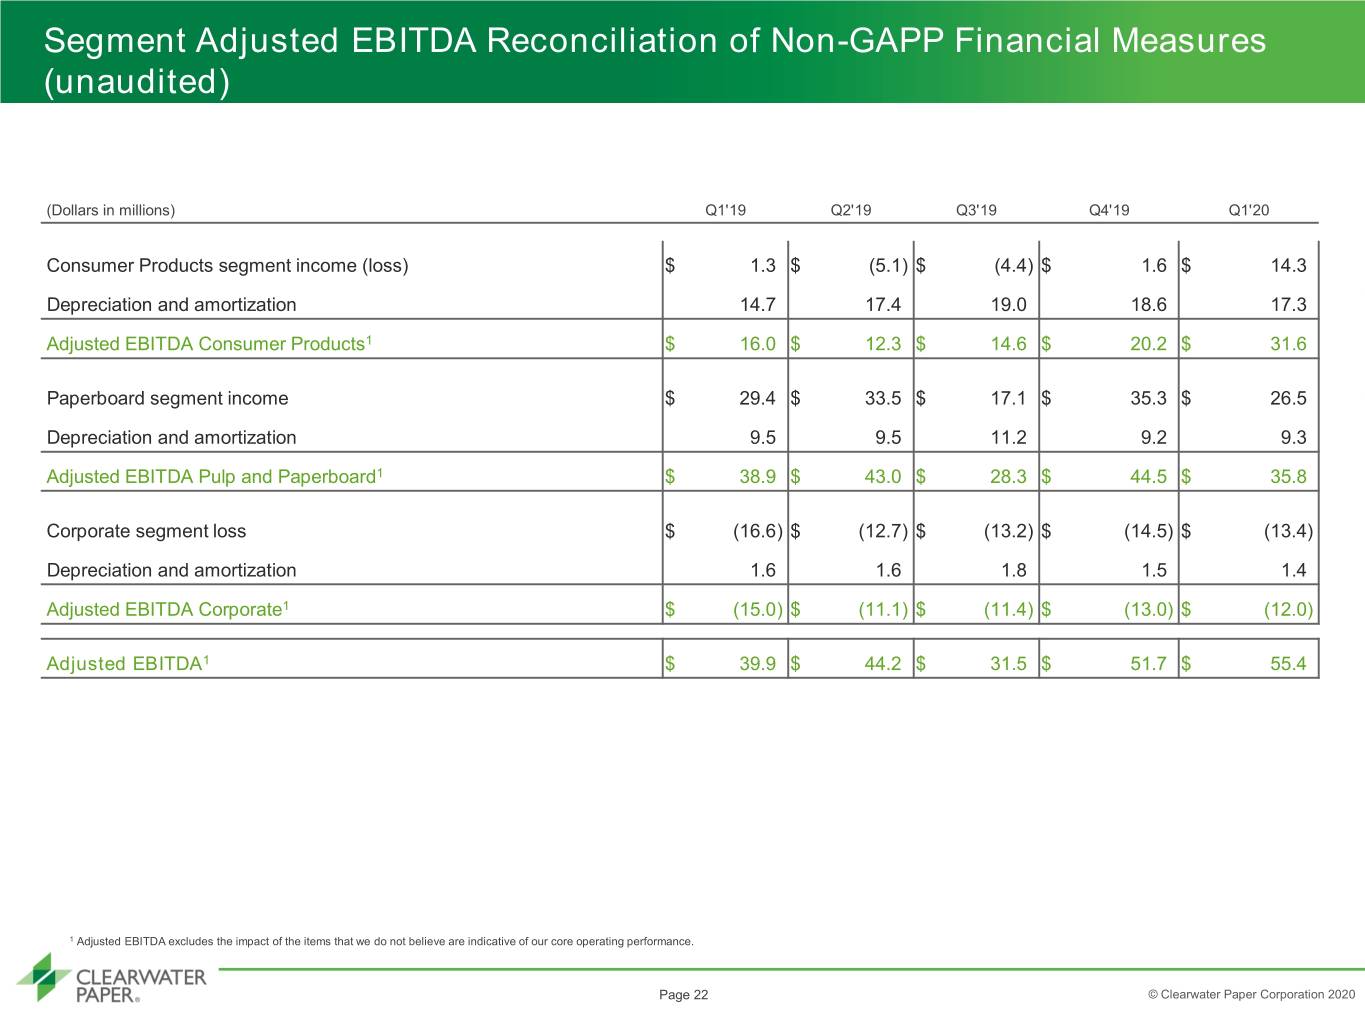

 
Segment Adjusted EBITDA Reconciliation of Non-GAPP Financial Measures (unaudited) (Dollars in millions) Q1'19 Q2'19 Q3'19 Q4'19 Q1'20 Consumer Products segment income (loss) $ 1.3 $ (5.1) $ (4.4) $ 1.6 $ 14.3 Depreciation and amortization 14.7 17.4 19.0 18.6 17.3 Adjusted EBITDA Consumer Products1 $ 16.0 $ 12.3 $ 14.6 $ 20.2 $ 31.6 Paperboard segment income $ 29.4 $ 33.5 $ 17.1 $ 35.3 $ 26.5 Depreciation and amortization 9.5 9.5 11.2 9.2 9.3 Adjusted EBITDA Pulp and Paperboard1 $ 38.9 $ 43.0 $ 28.3 $ 44.5 $ 35.8 Corporate segment loss $ (16.6) $ (12.7) $ (13.2) $ (14.5) $ (13.4) Depreciation and amortization 1.6 1.6 1.8 1.5 1.4 Adjusted EBITDA Corporate1 $ (15.0) $ (11.1) $ (11.4) $ (13.0) $ (12.0) Adjusted EBITDA1 $ 39.9 $ 44.2 $ 31.5 $ 51.7 $ 55.4 1 Adjusted EBITDA excludes the impact of the items that we do not believe are indicative of our core operating performance. Page 22 © Clearwater Paper Corporation 2020
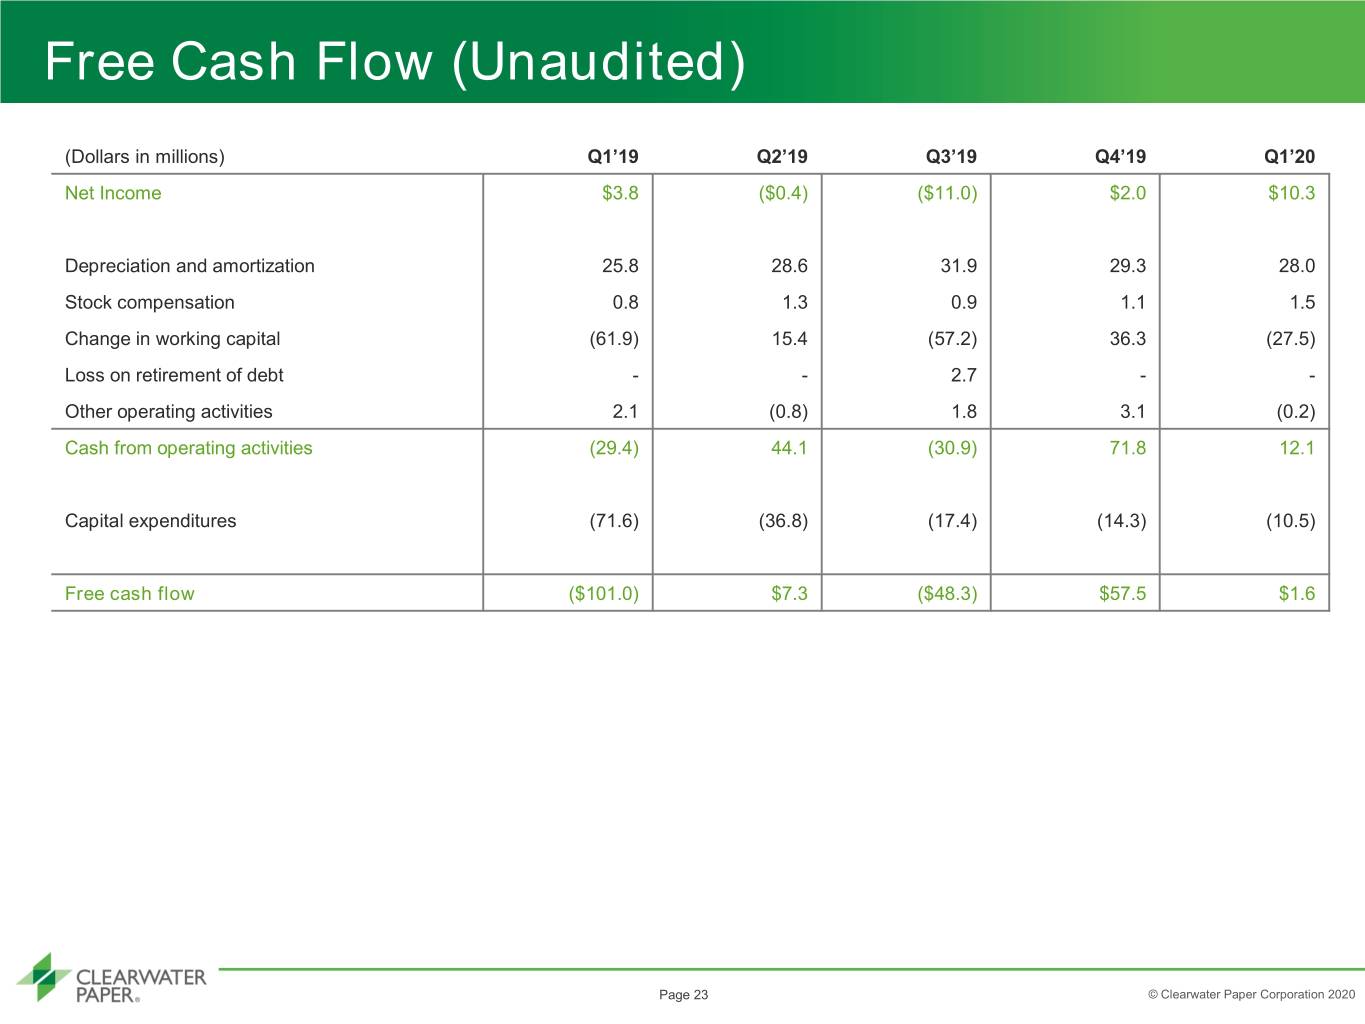

 
Free Cash Flow (Unaudited) (Dollars in millions) Q1’19 Q2’19 Q3’19 Q4’19 Q1’20 Net Income $3.8 ($0.4) ($11.0) $2.0 $10.3 Depreciation and amortization 25.8 28.6 31.9 29.3 28.0 Stock compensation 0.8 1.3 0.9 1.1 1.5 Change in working capital (61.9) 15.4 (57.2) 36.3 (27.5) Loss on retirement of debt - - 2.7 - - Other operating activities 2.1 (0.8) 1.8 3.1 (0.2) Cash from operating activities (29.4) 44.1 (30.9) 71.8 12.1 Capital expenditures (71.6) (36.8) (17.4) (14.3) (10.5) Free cash flow ($101.0) $7.3 ($48.3) $57.5 $1.6 Page 23 © Clearwater Paper Corporation 2020