Exhibit 99.1
Clearwater Paper Reports Third Quarter 2020 Results
SPOKANE, Wash.--(BUSINESS WIRE)--November 3, 2020 --Clearwater Paper Corporation (NYSE:CLW), a premier supplier of quality tissue and bleached paperboard products, today reported financial results for the third quarter and first nine months of 2020.
THIRD QUARTER HIGHLIGHTS
•Delivered strong performance due to elevated demand for tissue products, steady demand for paperboard, and solid operational execution
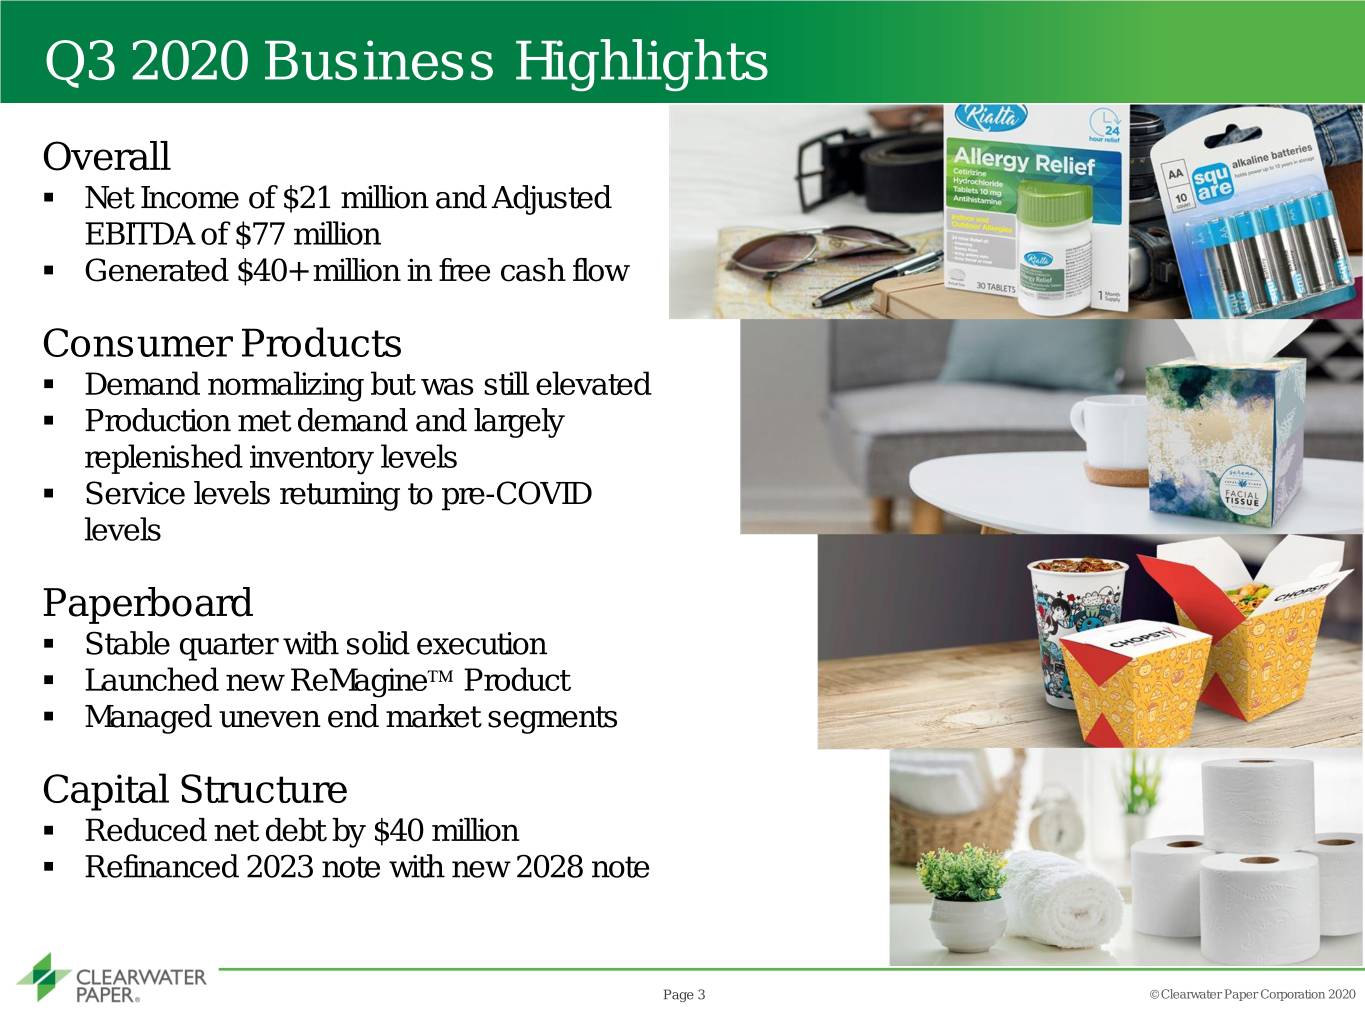
•Net income of $21 million, or $1.28 per diluted share and Adjusted EBITDA of $77 million
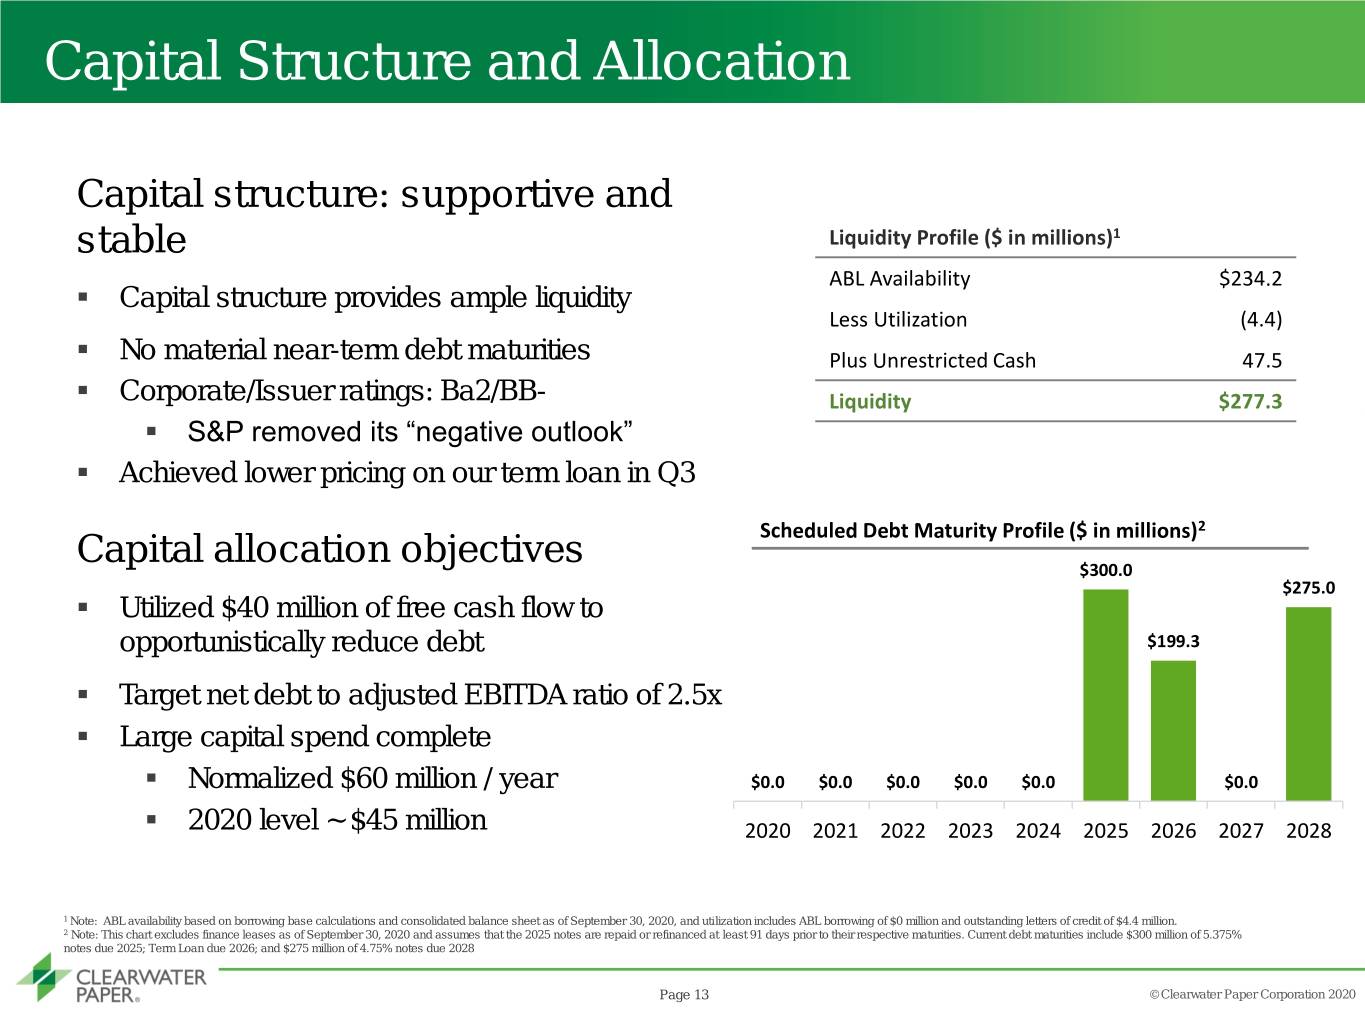
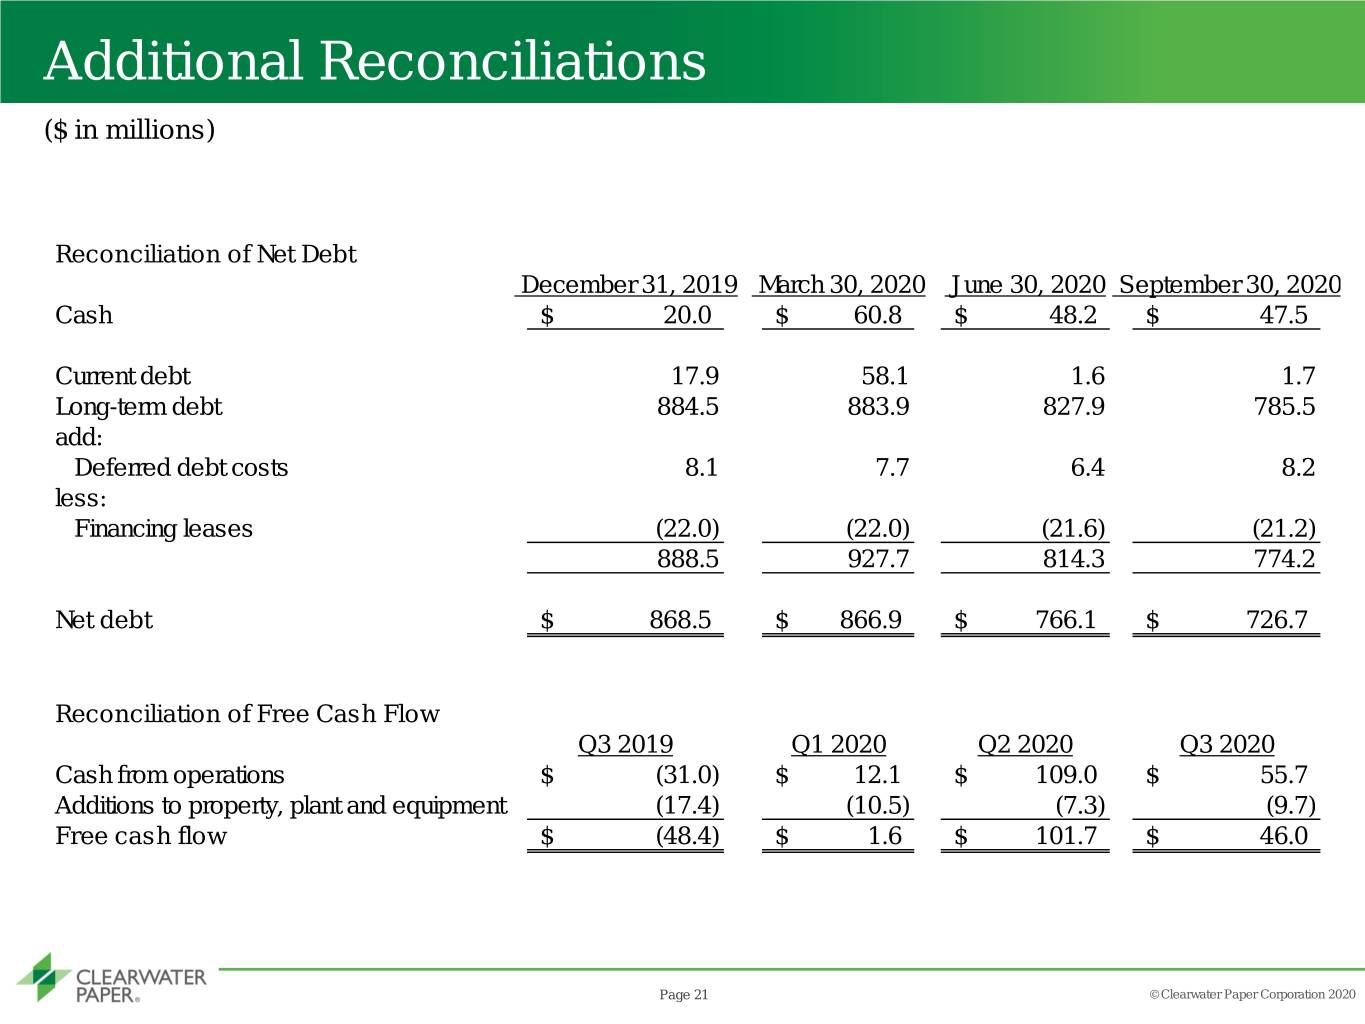
•Net debt reduction of over $40 million and refinancing of 2023 notes with new 2028 notes
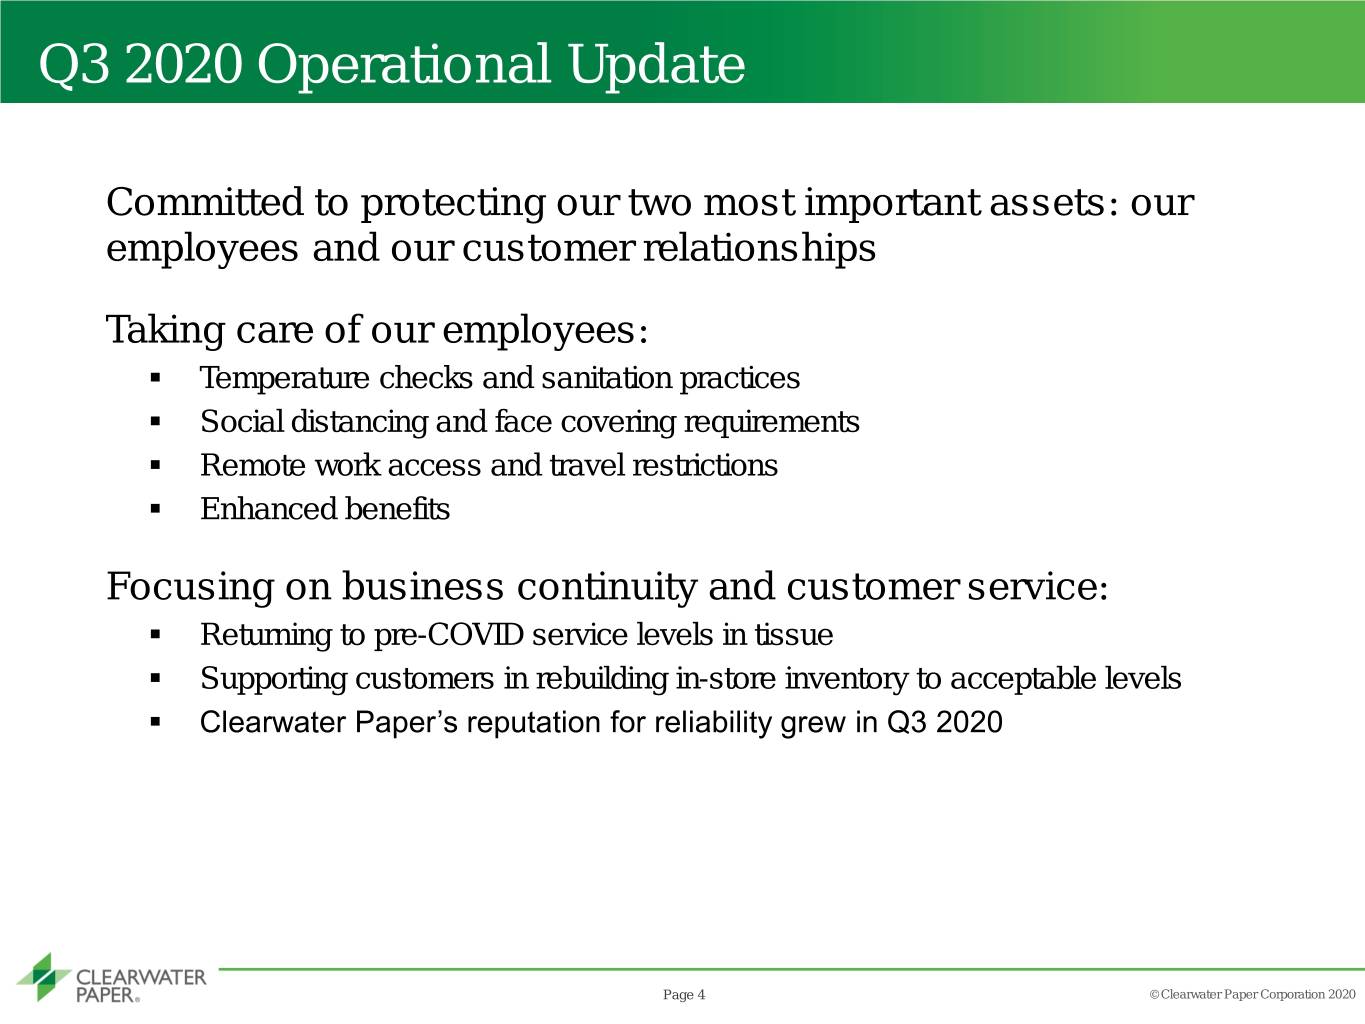
"We remain committed to the health and safety of our employees and continuing to safely operate our facilities to meet the needs of our customers,” said Arsen Kitch, president and chief executive officer. “In the third quarter, we achieved strong results due to continued elevated demand and production in tissue, although at lower levels than the earlier phases of the COVID-19 pandemic, stable paperboard performance and benign input costs.”
OVERALL RESULTS
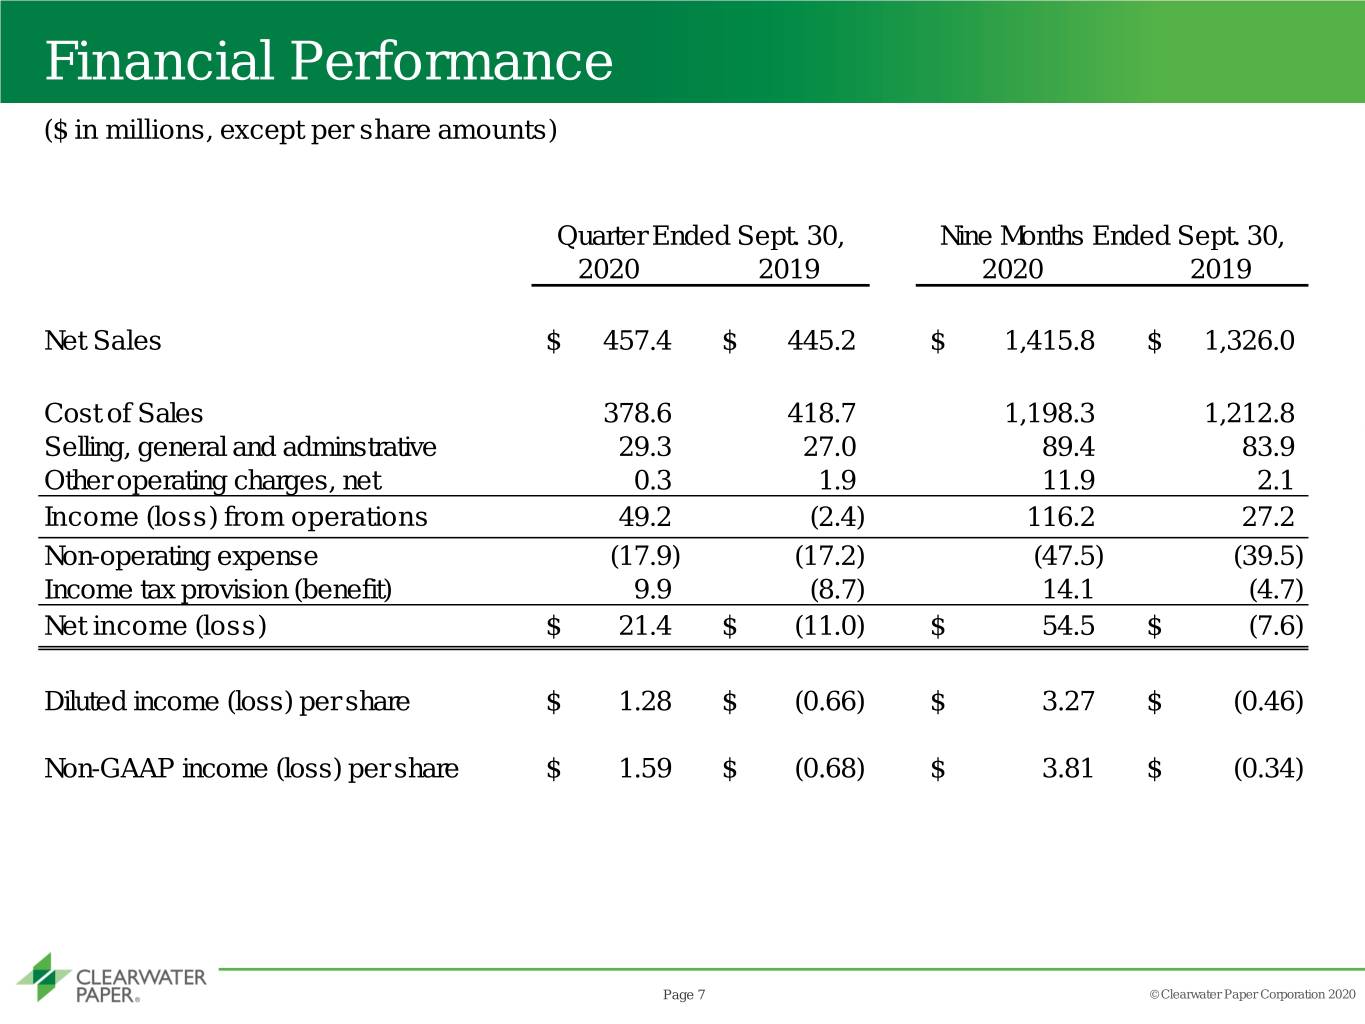
For the third quarter of 2020, Clearwater Paper reported net sales of $457 million, a 3% increase compared to net sales of $445 million for the third quarter of 2019. Net income for the third quarter of 2020 was $21 million, or $1.28 per diluted share, compared to net loss for the third quarter of 2019 of $11 million, or $0.66 per diluted share. On a non-GAAP basis, Clearwater Paper reported adjusted net income in the third quarter of 2020 of $27 million, or $1.59 per diluted share, compared to third quarter 2019 adjusted net loss of $11 million, or $0.68 per diluted share. Adjusted EBITDA for the quarter was $77 million, compared to the third quarter of 2019 Adjusted EBITDA of $32 million.
For the first nine months of 2020, Clearwater Paper reported net sales of $1.4 billion, a 7% increase compared to net sales of $1.3 billion for the first nine months of 2019. Net income for the first nine months of 2020 was $55 million, or $3.27 per diluted share, compared to net loss for the first nine months of 2019 of $8 million, or $0.46 per diluted share. On a non-GAAP basis, Clearwater Paper reported adjusted net income in the first nine months of 2020 of $64 million, or $3.81 per diluted share, compared to the first nine months of 2019 adjusted net loss of $6 million, or $0.34 per diluted share. Adjusted EBITDA for the first nine months of 2020 was $212 million, compared to the first nine months of 2019 Adjusted EBITDA of $116 million.
Consumer Products Segment
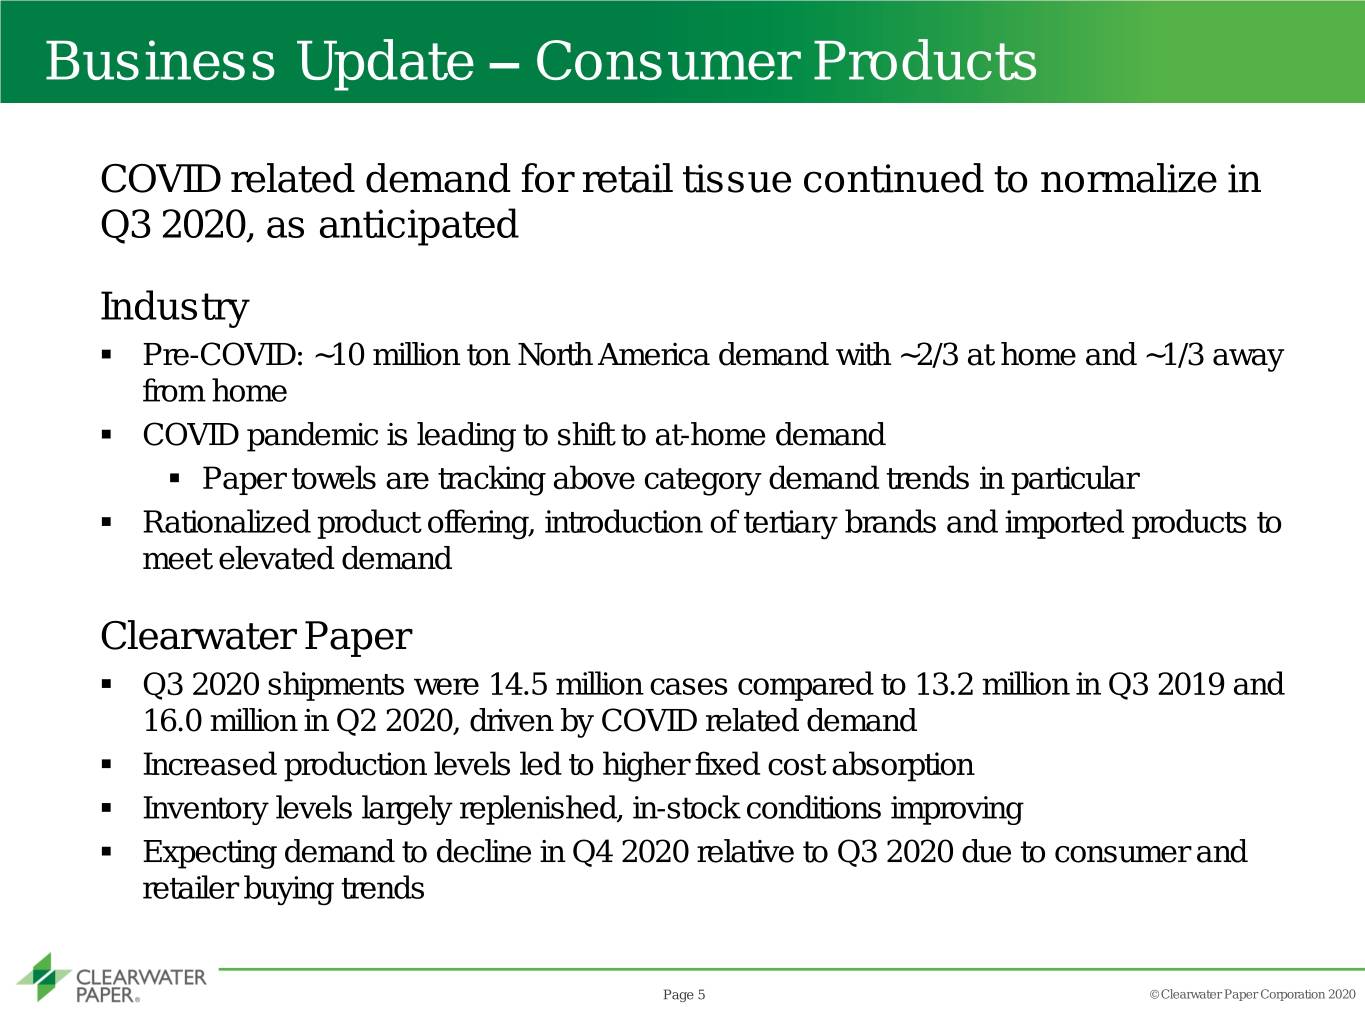
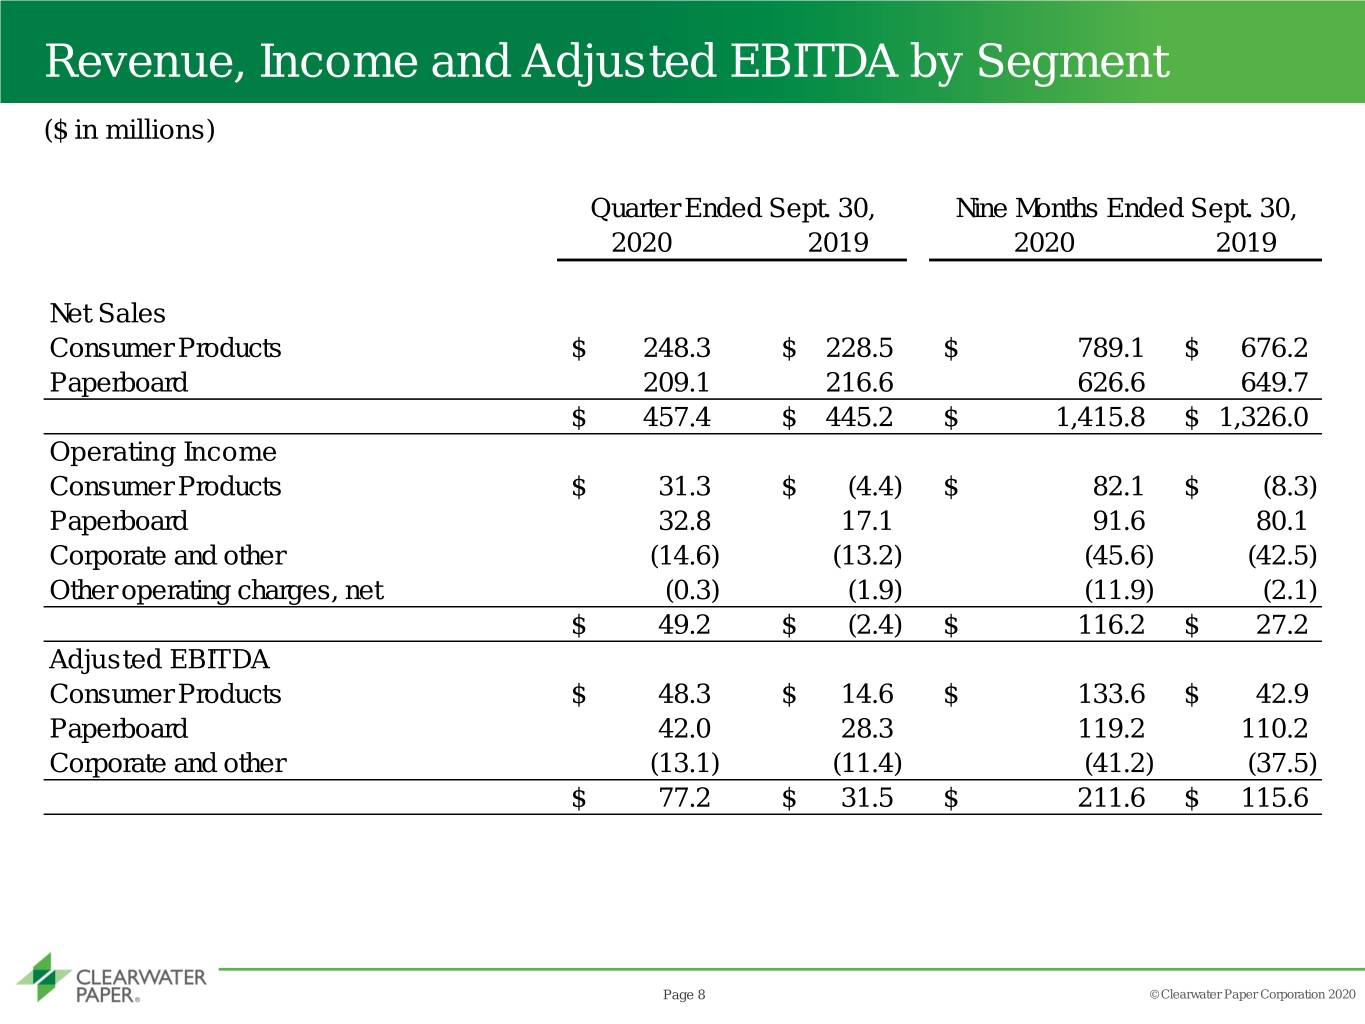
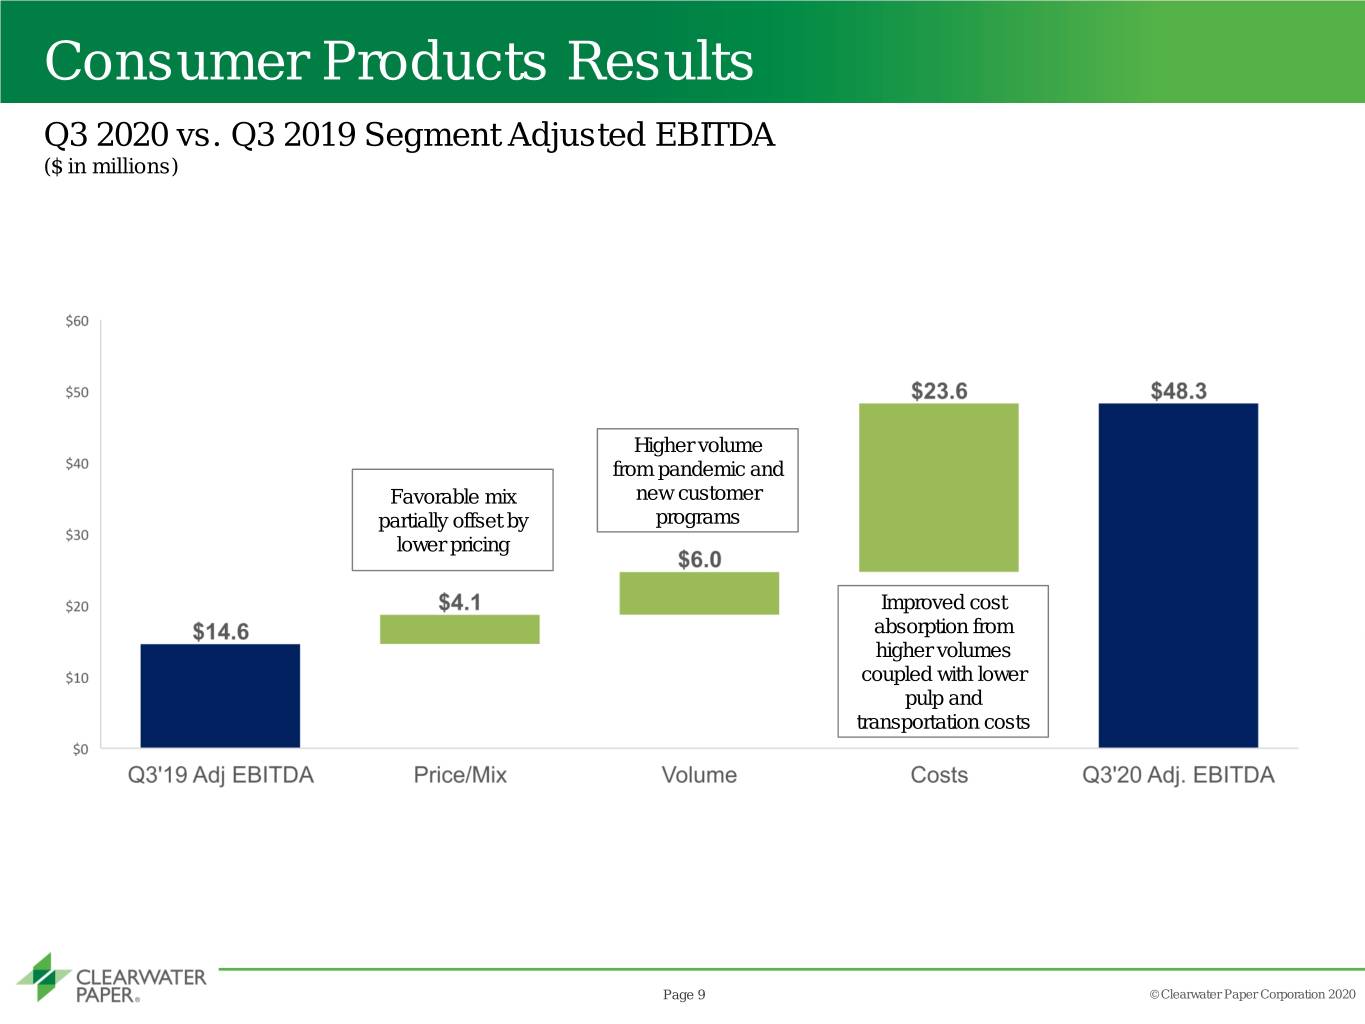
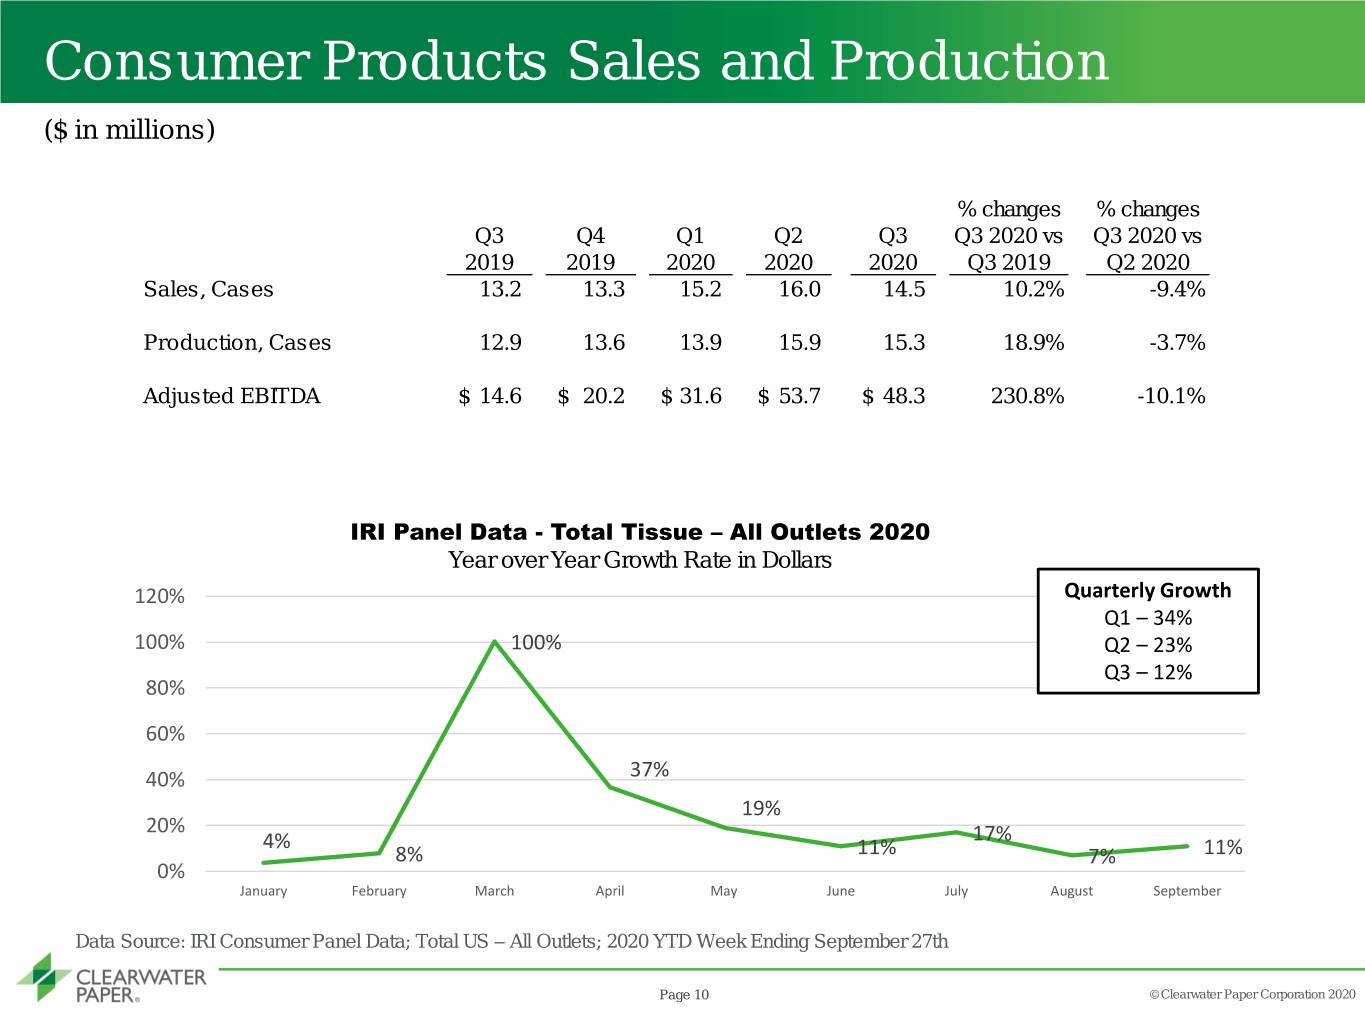
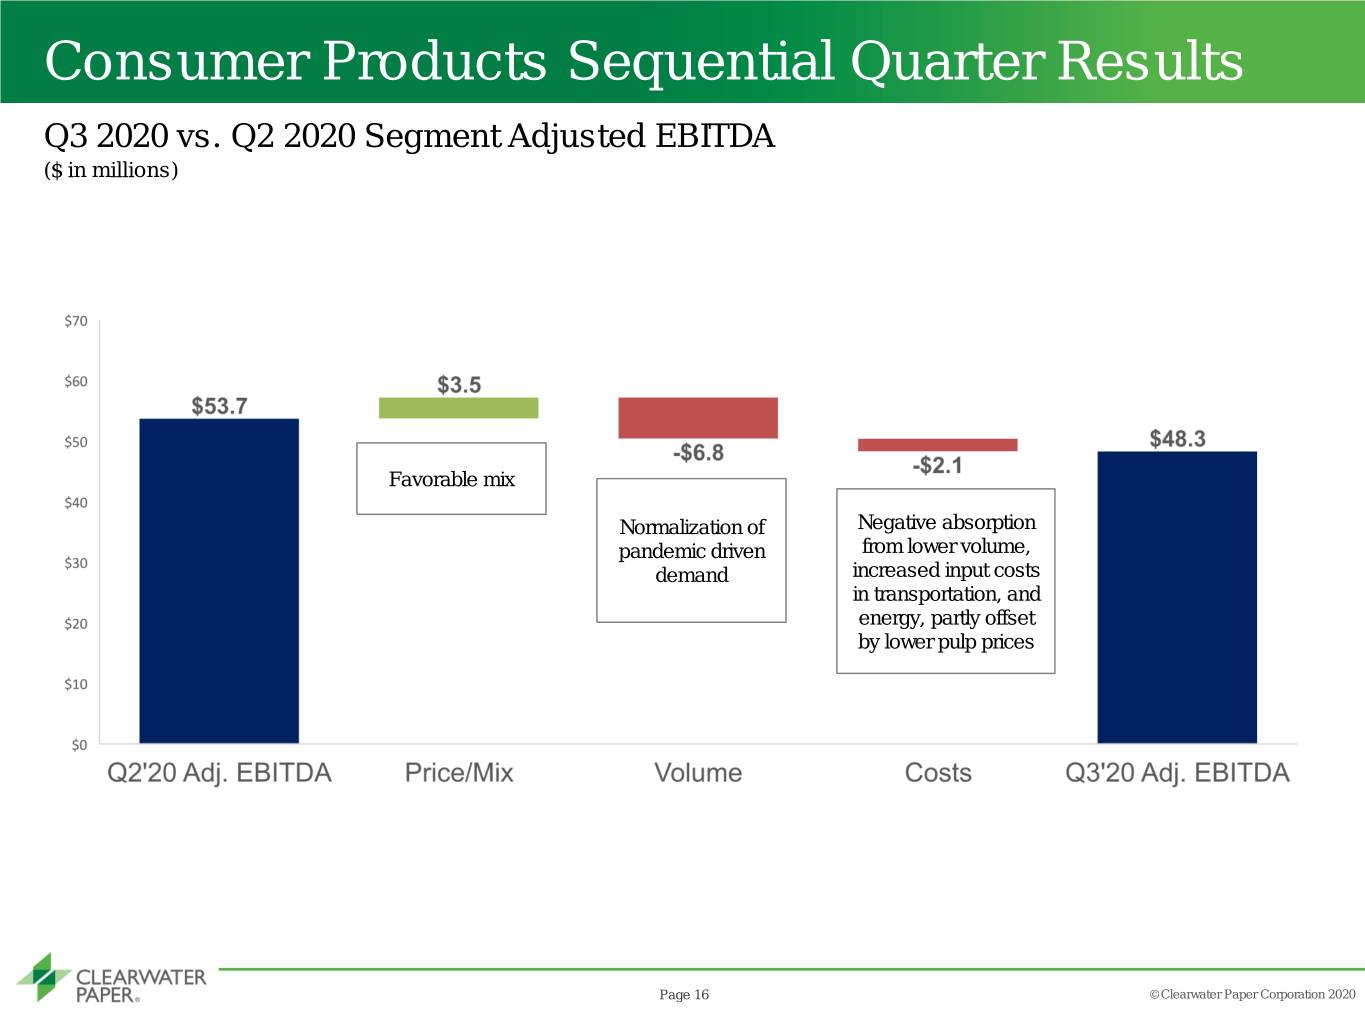
Net sales in the Consumer Products segment were $248 million for the third quarter of 2020, up 9% compared to the third quarter 2019 net sales of $229 million. In the third quarter of 2020, converted case shipments reached 14.5 million cases, an increase of 10% compared to 13.2 million cases shipped in the third quarter of 2019. Segment operating income for the third quarter of 2020 was $31 million compared to operating loss of $4 million in the third quarter of 2019. Adjusted EBITDA for the segment was $48 million in the third quarter of 2020, up from $15 million in the third quarter of 2019. The increase in operating income and Adjusted EBITDA was primarily due to increased production and shipment volumes from continued elevated demand, which drove improvement in fixed cost absorption. The segment also realized benefits from lower external pulp prices.
Net sales in the Consumer Products segment were $789 million for the first nine months of 2020, up 17% compared to the first nine months 2019 net sales of $676 million. In the first nine months of 2020, converted case shipments reached 45.7 million cases, an increase of 20% compared to 38.0 million cases shipped in the first nine months of 2019. Segment operating income for the first nine months of 2020 was $82 million, compared to operating loss of $8 million in the first nine months of 2019. Adjusted EBITDA for the segment was $134 million in the first nine months of 2020, up from $43 million in the first nine months of 2019.
Tissue Sales Volumes and Prices:
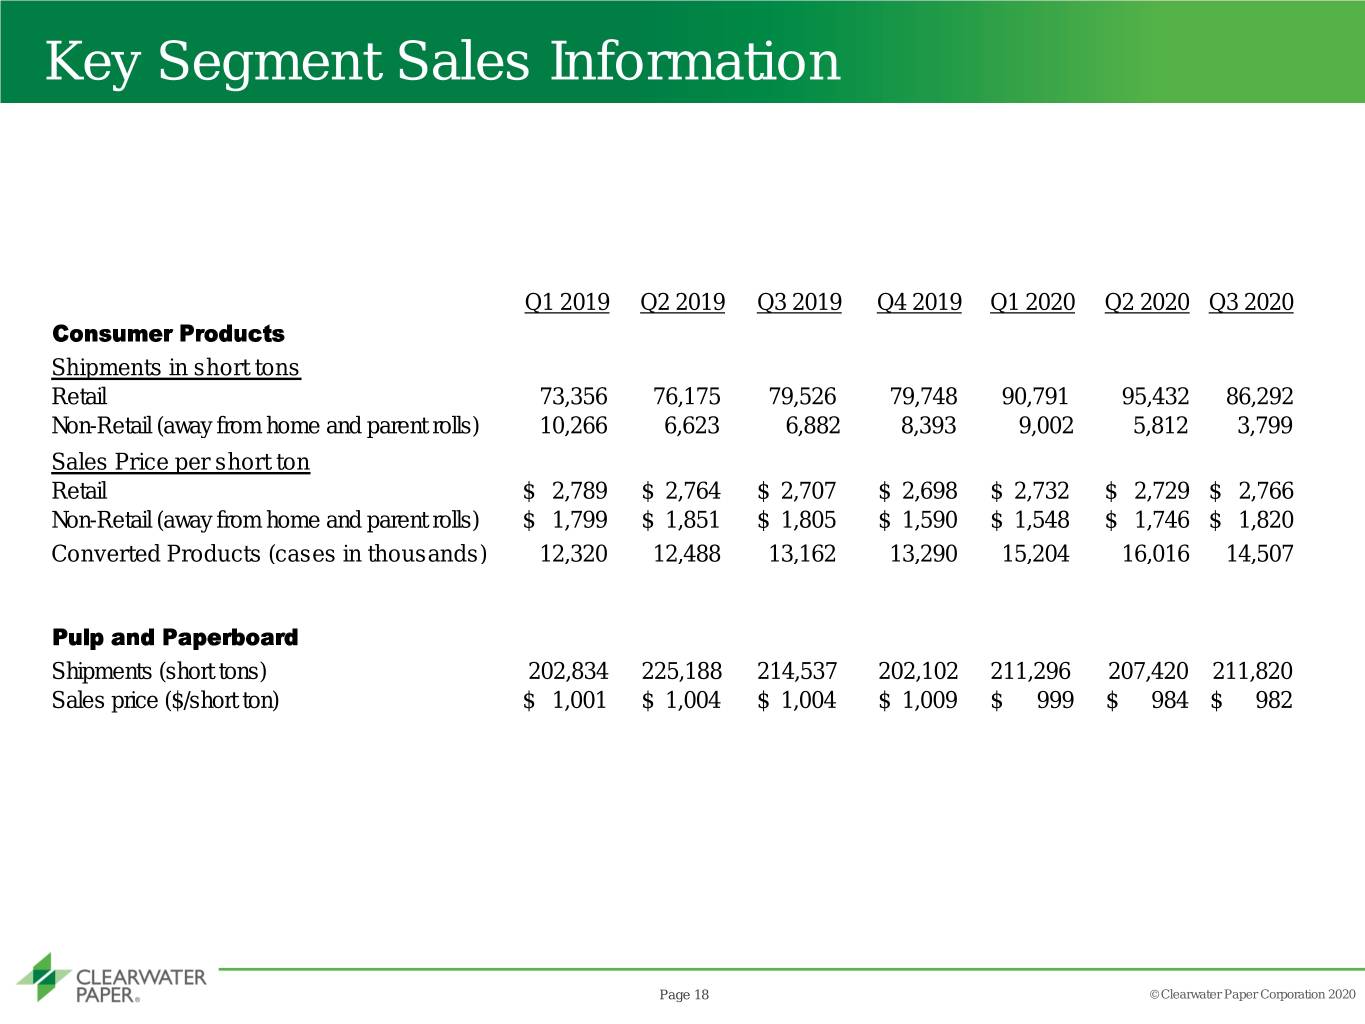
• Total tissue volumes sold were 90,091 tons in the third quarter of 2020, an increase of 4% compared to 86,408 tons in the third quarter of 2019. Retail volumes represented 96% of total volumes sold in the third quarter of 2020, an increase from 92% in the third quarter of 2019. Total tissue volumes sold were 291,128 tons in the first nine months of 2020, an
increase of 15% compared to 252,828 tons in the first nine months of 2019. Retail volumes represented 94% of total volumes sold in the first nine months of 2020, an increase from 91% in the first nine months of 2019.
• Average tissue net selling prices increased 3% to $2,726 per ton in the third quarter of 2020, compared to $2,635 per ton in the third quarter of 2019. Average tissue net selling prices increased to $2,672 per ton in the first nine months of 2020, compared to $2,664 per ton in the first nine months of 2019.
Paperboard Products Segment
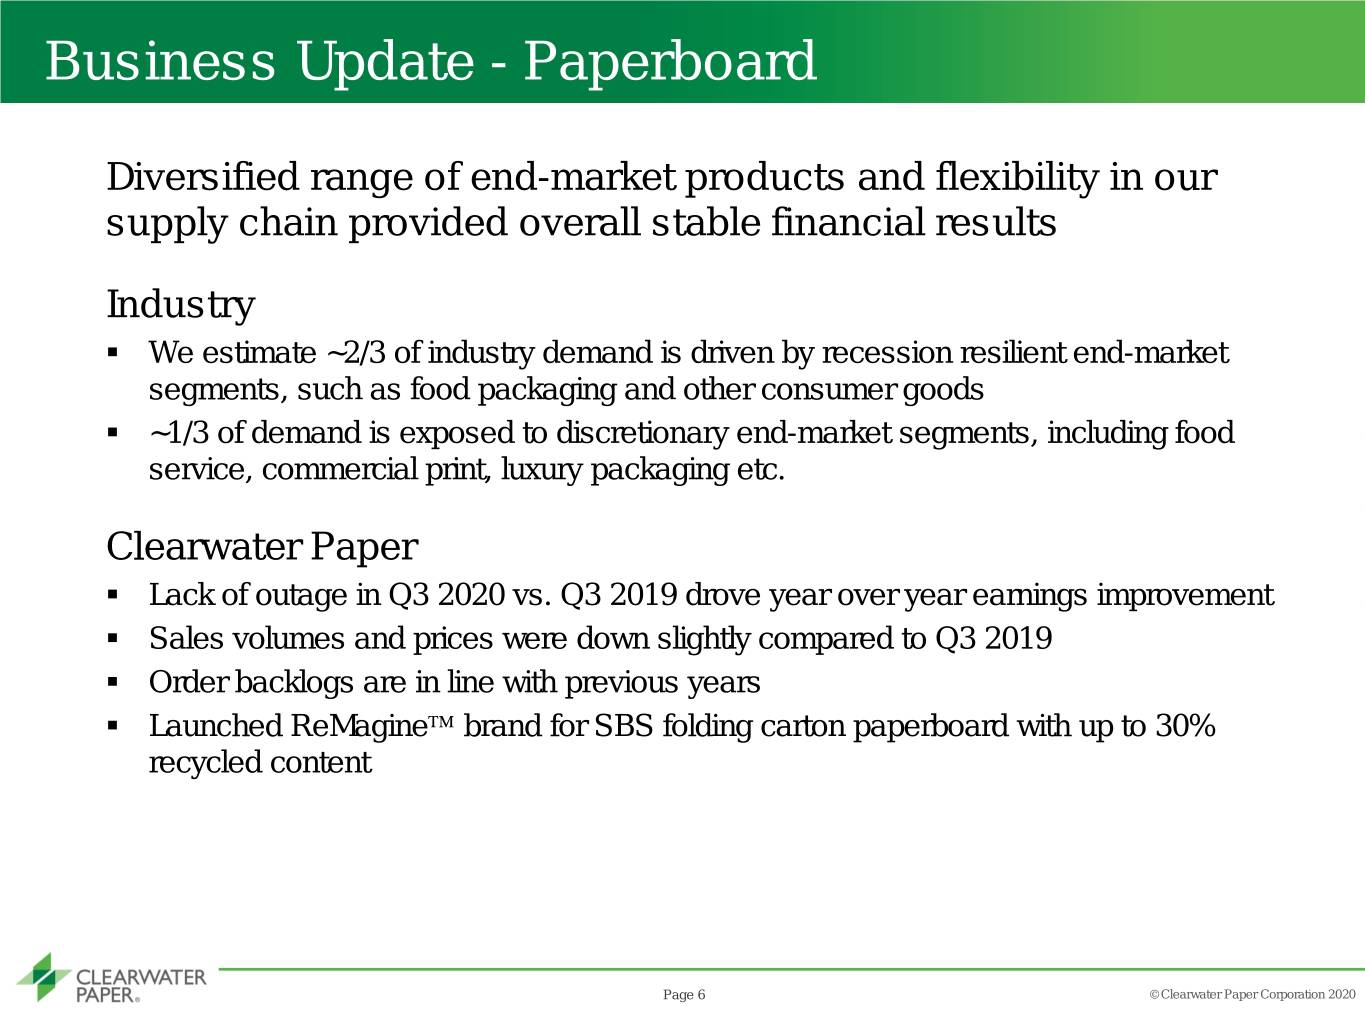
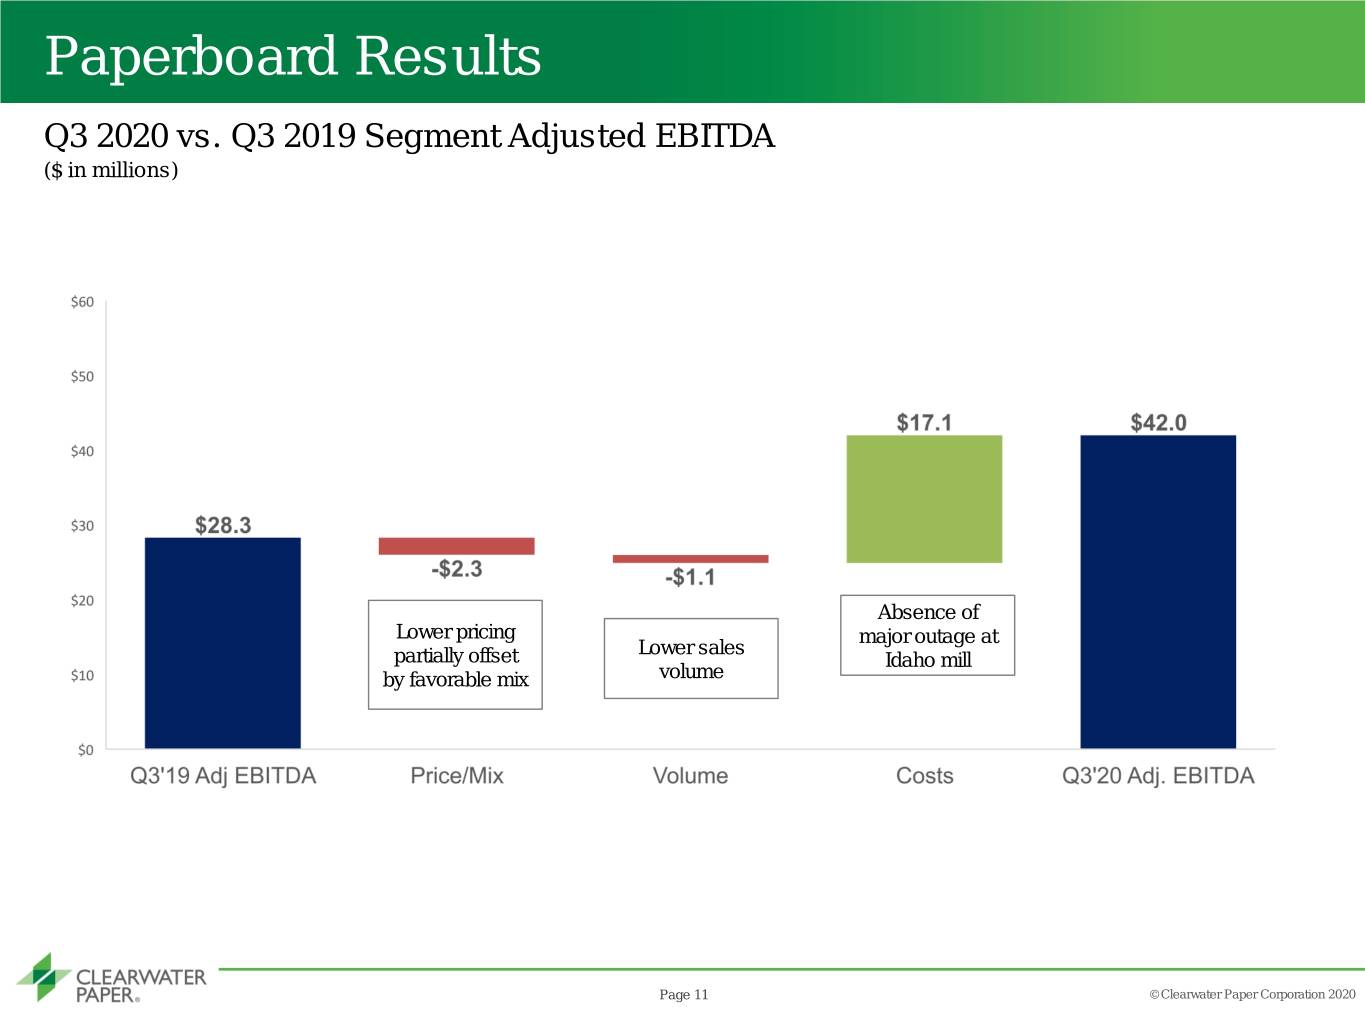
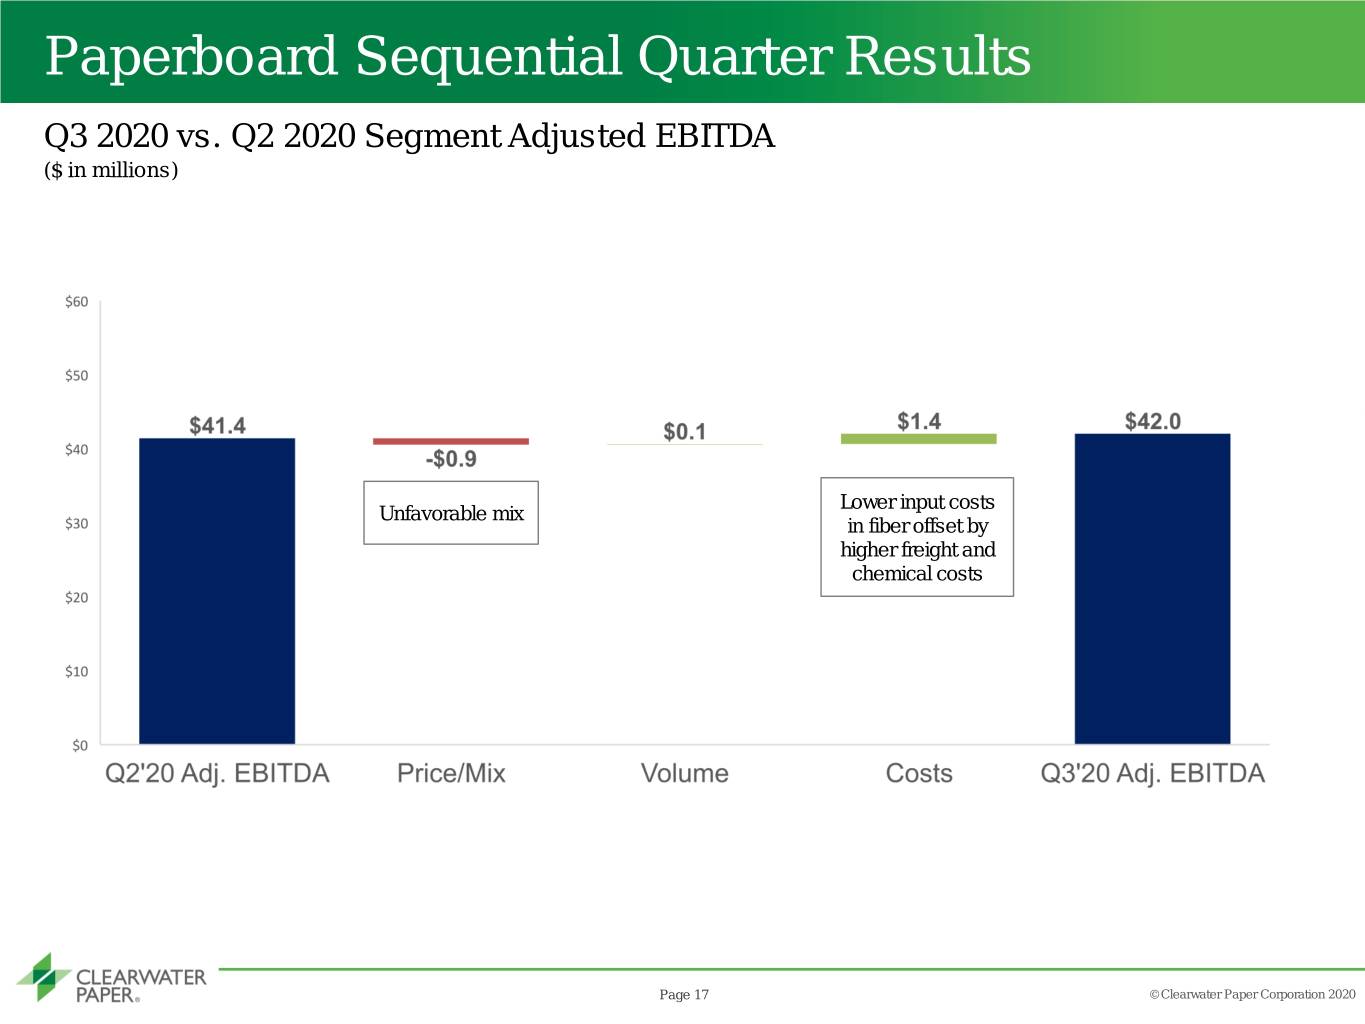
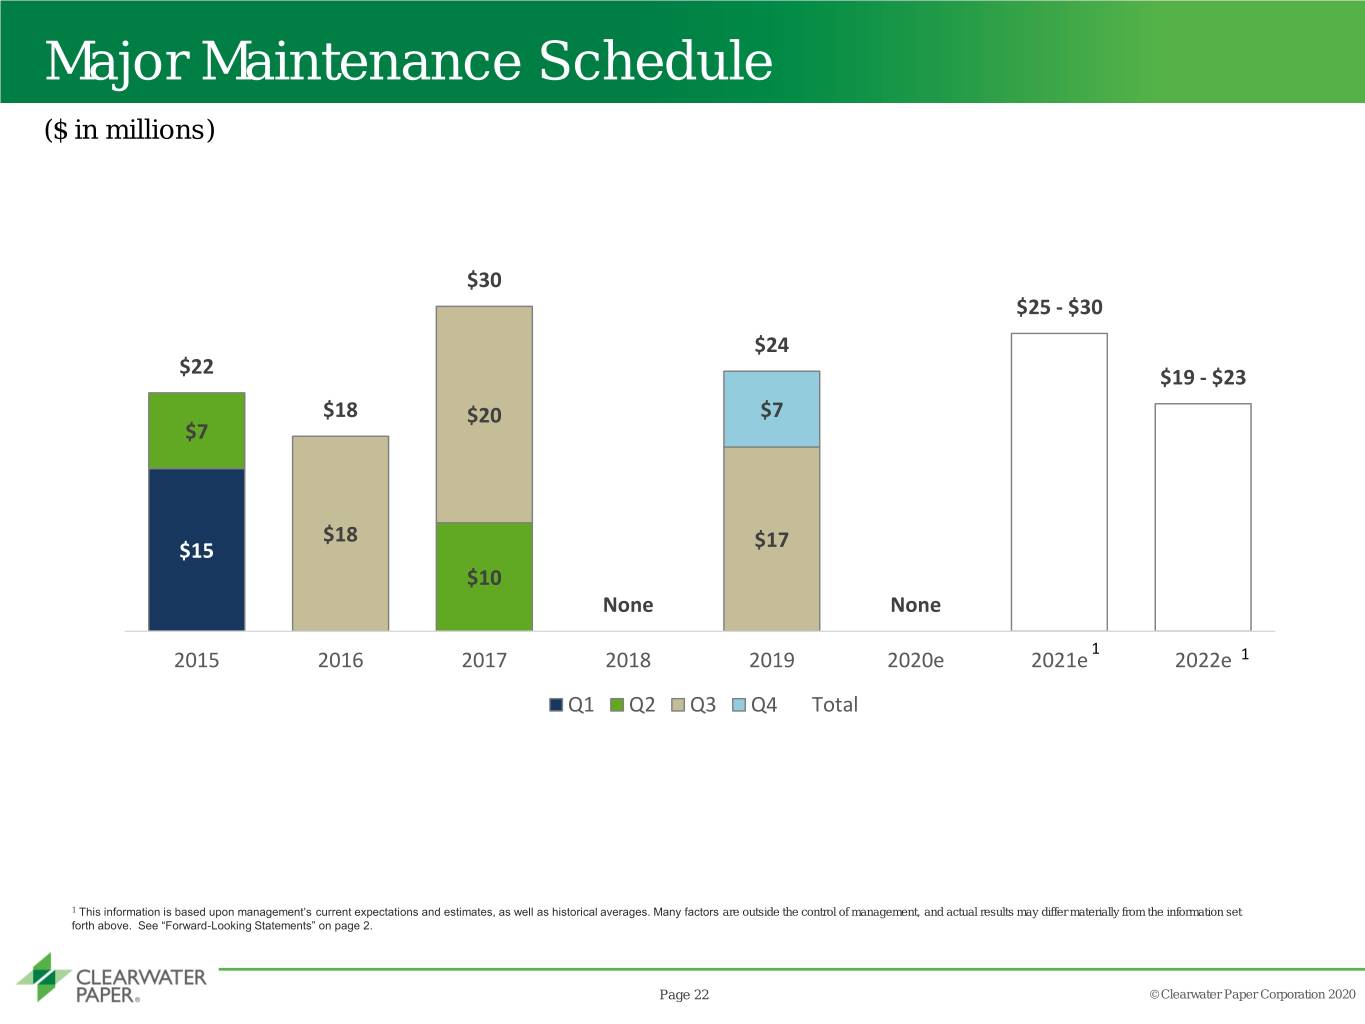
Net sales in the Paperboard Products segment were $209 million for the third quarter of 2020, down 3% compared to third quarter 2019 net sales of $217 million. The decrease in sales was due to lower sales volume and pricing partially offset with a positive mix. Segment operating income for the third quarter of 2020 was $33 million compared to $17 million for the third quarter of 2019. Adjusted EBITDA for the segment was $42 million in the third quarter of 2020, compared to $28 million in the third quarter of 2019. The improvement in segment operating income and Adjusted EBITDA is primarily due to no planned major outage in the third quarter of 2020 versus a planned outage at our Lewiston, Idaho facility in 2019.
Net sales in the Paperboard Product segment were $627 million for the first nine months of 2020, down 4% compared to the first nine months 2019 net sales of $650 million. Segment operating income for the first nine months of 2020 was $92 million compared to $80 million for the first nine months of 2019. Adjusted EBITDA for the segment was $119 million in the first nine months of 2020, compared to $110 million in the first nine months of 2019. The improvement in segment operating income and Adjusted EBITDA is primarily due to no planned major outage in the first nine months of 2020 versus a planned outage at our Lewiston, Idaho facility in 2019.
Paperboard Sales Volumes and Prices:
• Paperboard sales volumes were 211,820 tons in the third quarter of 2020, a decrease of 1% compared to 214,537 tons in the third quarter of 2019. Paperboard sales volumes were 630,526 tons in the first nine months of 2020, a decrease of 2% compared to 642,559 tons in the first nine months of 2019.
• Paperboard average net selling price decreased 2% to $982 per ton for the third quarter of 2020, compared to $1,004 per ton in the third quarter of 2019. Paperboard average net selling price decreased 1% to $988 per ton for the first nine months of 2020, compared to $1,003 per ton in the first nine months of 2019.
COMPANY OUTLOOK
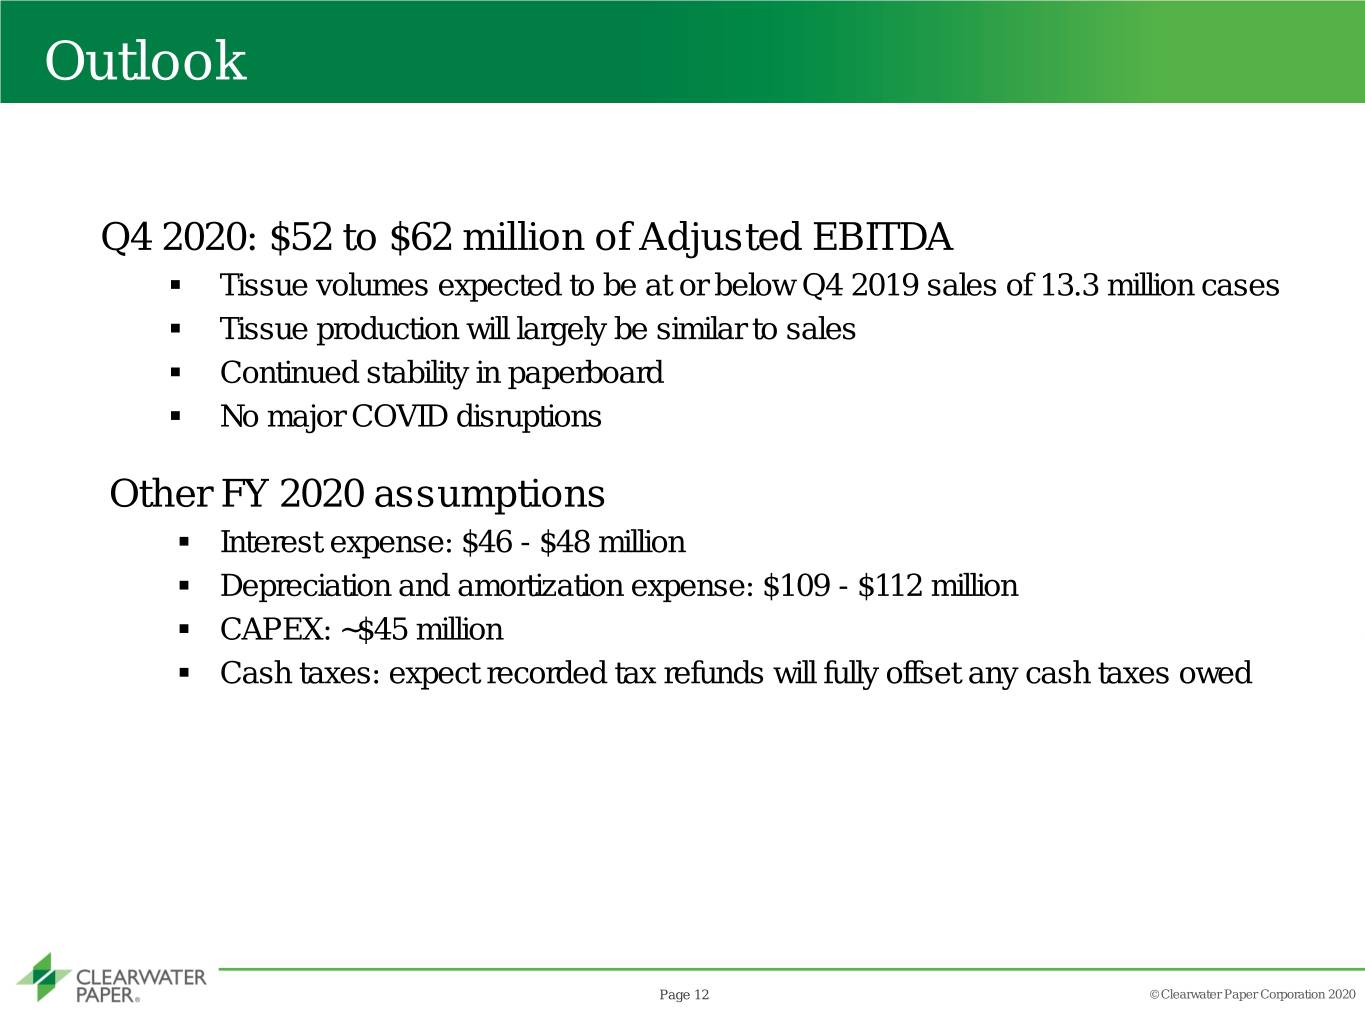
"For the fourth quarter, our primary focus will remain on our top priorities - the health and safety of our employees while we continue to operate our facilities and service customers. Demand for tissue products is expected to soften relative to the third quarter of 2020 as retail in-stock conditions and inventories have improved. We are also closely monitoring economic conditions and assessing the impact on our business for the balance of the year,” Kitch concluded.
WEBCAST INFORMATION
Clearwater Paper Corporation will discuss these results during an earnings conference call that begins at 2:00 p.m. Pacific Standard Time today. A live webcast and accompanying supplemental information will be available on the company's website at http://ir.clearwaterpaper.com. A replay of today's conference call will be available on the website at http://ir.clearwaterpaper.com/results.cfm beginning at 5:00 p.m. Pacific Standard Time today.
ABOUT CLEARWATER PAPER
Clearwater Paper is a premier supplier of private-branded tissue to major retailers and wholesale distributors, including grocery, drug, mass merchants and discount stores. In addition, the company produces bleached paperboard used by quality-conscious printers and packaging converters, and offers services that include custom sheeting, slitting and cutting. Clearwater Paper's employees build shareholder value by developing strong relationships through quality and service.
USE OF NON-GAAP MEASURES
In this press release, the company presents certain non-GAAP financial information for the third quarter and first nine months of 2020 and 2019, including adjusted income (loss) and Adjusted EBITDA. Because these amounts are not in accordance with GAAP, reconciliations to net income (loss) as determined in accordance with GAAP are included in the tables at the end of this press release. The company presents these non-GAAP amounts because management believes they assist investors and analysts in comparing the company's performance across reporting periods on a consistent basis by excluding items that the company does not believe are indicative of its core operating performance. In addition, the company uses Adjusted EBITDA: (i) as factors in evaluating management’s performance when determining incentive compensation, (ii) to evaluate the effectiveness of the company's business strategies, and (iii) because the company's credit agreement and the indentures governing the company's outstanding notes use metrics similar to Adjusted EBITDA to measure the company's compliance with certain covenants.
FORWARD-LOOKING STATEMENTS
This press release contains certain forward-looking statements within the meaning of the Private Securities Litigation Reform Act of 1995 as amended, including statements regarding the health and safety of company’s employees, product demand, retail in-stock conditions and inventories and general economic conditions. These forward-looking statements are based on current expectations, estimates, assumptions, and projections that are subject to change, and actual results may differ materially from the forward-looking statements. Factors that could cause actual results to differ materially include, but are not limited to: the impacts of the COVID-19 pandemic on our business and operations; competitive pricing pressures for the company’s products, including as a result of increased capacity, as additional manufacturing facilities are operated by the company’s competitors; the loss of, changes in prices in regard to, or reduction in, orders from a significant customer; changes in the cost and availability of wood fiber and wood pulp; changes in transportation costs and disruptions in transportation services; changes in customer product preferences and competitors' product offerings; larger competitors having operational and other advantages; customer acceptance and timing and quantity of purchases of the company’s tissue products, including the existence of sufficient demand for and the quality of tissue produced by the company’s expanded Shelby, North Carolina operations; consolidation and vertical integration of converting operations in the paperboard industry; the company’s ability to successfully implement its operational efficiencies and cost savings strategies, along with related capital projects, and achieve the expected operational or financial results of those projects, including from the continuous digester at the company’s Lewiston, Idaho facility; changes in the U.S. and international economies and in general economic conditions in the regions and industries in which the company operates; manufacturing or operating disruptions, including IT system and IT system implementation failures, equipment malfunctions and damage to the company’s manufacturing facilities; cyber-security risks; changes in costs for and availability of packaging supplies, chemicals, energy, and maintenance and repairs; labor disruptions; cyclical industry conditions; changes in expenses, required contributions, and potential withdrawal costs associated with the company’s pension plans; environmental liabilities or expenditures; reliance on a limited number of third-party suppliers for raw materials; the company’s ability to attract, motivate, train and retain qualified and key personnel; material weaknesses in the company’s internal control over financial reporting; the company’s substantial indebtedness and ability to service its debt obligations; restrictions on the company’s business from debt covenants and terms; negative changes in the company’s credit agency ratings; changes in laws, regulations or industry standards affecting the company’s business; and other risks and uncertainties described from time to time in the company's public filings with the Securities and Exchange Commission, including its Annual Report on Form 10-K for the year ended December 31, 2019 and subsequently filed periodic reports on Form 10-Q. The forward-looking statements are made as of the date of this press release and the company does not undertake to update any forward-looking statements based on new developments or changes in the company's expectations after the date of this press release
| | | | | | | | | | | | | | | | | | | | | | | |
| Clearwater Paper Corporation |
| Consolidated Statements of Operations |
| (Unaudited) |
| | | | | |
| Three Months Ended September 30, | | Nine Months Ended September 30, |
| (In millions, except per-share data) | 2020 | | 2019 | | 2020 | | 2019 |
| Net sales | $ | 457.4 | | | $ | 445.2 | | | $ | 1,415.8 | | | $ | 1,326.0 | |
| Costs and expenses: | | | | | | | |
| Cost of sales | 378.6 | | | 418.7 | | | 1,198.3 | | | 1,212.8 | |
| Selling, general and administrative expenses | 29.3 | | | 27.0 | | | 89.4 | | | 83.9 | |
| Other operating charges, net | 0.3 | | | 1.9 | | | 11.9 | | | 2.1 | |
| Total operating costs and expenses | 408.2 | | | 447.6 | | | 1,299.6 | | | 1,298.7 | |
| Income (loss) from operations | 49.2 | | | (2.4) | | | 116.2 | | | 27.2 | |
| Interest expense, net | (12.2) | | | (13.1) | | | (37.0) | | | (32.5) | |
| Other non-operating expense | (1.9) | | | (1.4) | | | (5.7) | | | (4.3) | |
| Debt retirement costs | (3.9) | | | (2.7) | | | (4.8) | | | (2.7) | |
| Total non-operating expense | (17.9) | | | (17.2) | | | (47.5) | | | (39.5) | |
| Income (loss) before income taxes | 31.3 | | | (19.7) | | | 68.7 | | | (12.2) | |
| Income tax provision (benefit) | 9.9 | | | (8.7) | | | 14.1 | | | (4.7) | |
| Net income (loss) | $ | 21.4 | | | $ | (11.0) | | | $ | 54.5 | | | $ | (7.6) | |
| | | | | | | |
| Net income (loss) per common share: | | | | | | | |
| Basic | $ | 1.29 | | | $ | (0.66) | | | $ | 3.29 | | | $ | (0.46) | |
| Diluted | 1.28 | | | (0.66) | | | 3.27 | | | (0.46) | |
| Average shares outstanding (in thousands): | | | | | | | |
| Basic | 16,595 | | | 16,539 | | | 16,581 | | | 16,531 | |
| Diluted | 16,783 | | | 16,539 | | | 16,689 | | | 16,531 | |
| | | | | | | | | | | |
| Clearwater Paper Corporation |
| Condensed Consolidated Balance Sheets |
| (Unaudited) |
| | | |
| (In millions, except share data) | September 30, 2020 | | December 31, 2019 |
| ASSETS | | | |
| Current assets: | | | |
| Cash and cash equivalents | $ | 47.5 | | | $ | 20.0 | |
| Restricted cash | — | | | 1.4 | |
| Receivables, net | 179.5 | | | 159.4 | |
| Inventories | 256.4 | | | 281.4 | |
| Other current assets | 8.5 | | | 3.6 | |
| Total current assets | 492.0 | | | 465.8 | |
| Property, plant and equipment, net | 1,200.9 | | | 1,257.7 | |
| Operating lease right-of-use assets | 66.0 | | | 73.1 | |
| Goodwill and intangibles, net | 49.6 | | | 52.0 | |
| Other assets, net | 18.5 | | | 29.1 | |
| TOTAL ASSETS | $ | 1,826.9 | | | $ | 1,877.7 | |
| | | |
| LIABILITIES AND STOCKHOLDERS' EQUITY | | | |
| Current liabilities: | | | |
| Short-term debt | $ | 1.7 | | | $ | 17.9 | |
| Trade payables | 140.5 | | | 158.2 | |
| Accrued compensation | 50.1 | | | 45.0 | |
| Other accrued liabilities | 47.3 | | | 59.3 | |
| Total current liabilities | 239.6 | | | 280.4 | |
| Long-term debt | 785.5 | | | 884.5 | |
| Long-term operating lease liabilities | 57.3 | | | 65.6 | |
| Liability for pension and other postretirement employee benefits | 73.2 | | | 76.6 | |
| Other long-term obligations | 22.6 | | | 17.3 | |
| Deferred tax liabilities | 152.5 | | | 121.3 | |
| TOTAL LIABILITIES | 1,330.8 | | | 1,445.7 | |
| | | |
| Common stock | — | | | — | |
| Paid in capital | 13.9 | | | 9.8 | |
| Retained earnings | 536.3 | | | 481.7 | |
| Accumulated other comprehensive loss, net of tax | (54.0) | | | (59.5) | |
| TOTAL STOCKHOLDERS' EQUITY | 496.2 | | | 432.0 | |
| TOTAL LIABILITIES AND STOCKHOLDERS' EQUITY | $ | 1,826.9 | | | $ | 1,877.7 | |
| | | | | | | | | | | | | | | | | | | | |
| Clearwater Paper Corporation |
| Consolidated Statements of Cash Flows |
| (Unaudited) |
| Three Months Ended September 30, | Nine Months Ended September 30, |
| (In millions) | 2020 | | 2019 | 2020 | | 2019 |
| CASH FLOWS FROM OPERATING ACTIVITIES | | | | | | |
| Net income (loss) | $ | 21.4 | | | $ | (11.0) | | $ | 54.5 | | | $ | (7.6) | |
| Adjustments to reconcile net income (loss) to net cash flows provided by (used in) operating activities: | | | | | | |
| Depreciation and amortization | 27.7 | | | 32.0 | | 83.5 | | | 86.3 | |
| Stock-based compensation expense | 2.5 | | | 0.9 | | 7.3 | | | 3.0 | |
| Deferred taxes | 12.8 | | | (11.2) | | 23.5 | | | (6.0) | |
| Pension and other postretirement benefit plans | 0.9 | | | 0.7 | | 2.9 | | | 1.0 | |
| Debt retirement costs | 3.9 | | | 2.7 | | 4.8 | | | 2.7 | |
| Gain on divested assets | — | | | — | | (1.4) | | | — | |
| | | | | | |
| Changes in operating assets and liabilities: | | | | | | |
| (Increase) decrease in accounts receivable | 12.8 | | | 13.4 | | (5.7) | | | (12.5) | |
| (Increase) decrease in inventory | (21.0) | | | 4.0 | | 25.0 | | | (21.1) | |
| (Increase) decrease in other current assets | 0.6 | | | 0.6 | | (4.8) | | | (5.2) | |
| Increase (decrease) in trade payables | 4.1 | | | (54.4) | | (16.2) | | | (61.7) | |
| Increase (decrease) in accrued compensation | (0.5) | | | 0.1 | | 5.1 | | | (4.0) | |
| Increase (decrease) in other accrued liabilities | (9.3) | | | (10.5) | | (3.3) | | | 5.8 | |
| Other, net | (0.1) | | | 1.8 | | 0.8 | | | 3.0 | |
| Net cash flows provided by (used in) by operating activities | 55.7 | | | (31.0) | | 176.1 | | | (16.2) | |
| CASH FLOWS FROM INVESTING ACTIVITIES | | | | | | |
| Additions to property, plant and equipment | (9.7) | | | (17.4) | | (27.5) | | | (125.8) | |
| | | | | | |
| Net cash flows used in investing activities | (9.7) | | | (17.4) | | (27.5) | | | (125.8) | |
| CASH FLOWS FROM FINANCING ACTIVITIES | | | | | | |
| Borrowings of short-term debt | — | | | 98.0 | | 108.5 | | | 534.9 | |
| Repayments of short-term debt | — | | | (276.0) | | (122.0) | | | (598.7) | |
| Borrowings of long-term debt | 275.0 | | | 296.1 | | 275.0 | | | 296.1 | |
| Repayments of long-term debt | (317.6) | | | (101.7) | | (379.0) | | | (101.7) | |
| Payments for debt issuance costs | (4.3) | | | (1.8) | | (4.3) | | | (1.8) | |
| Other, net | 0.2 | | | (0.3) | | (0.7) | | | (1.4) | |
| Net cash flows provided by (used in) financing activities | (46.7) | | | 14.3 | | (122.5) | | | 127.4 | |
| Increase (decrease) in cash, cash equivalents and restricted cash | (0.6) | | | (34.0) | | 26.1 | | | (14.7) | |
| Cash, cash equivalents and restricted cash at beginning of period | 49.2 | | | 44.3 | | 22.4 | | | 24.9 | |
| Cash, cash equivalents and restricted cash at end of period | $ | 48.6 | | | $ | 10.3 | | $ | 48.6 | | | $ | 10.3 | |
| | | | | | | | | | | | | | | | | | | | | | | |
| Clearwater Paper Corporation |
| Segment Information |
| (Unaudited) |
| | | |
| Three Months Ended September 30, | | Nine Months Ended September 30, |
| (In millions) | 2020 | | 2019 | | 2020 | | 2019 |
| Segment net sales: | | | | | | | |
| Consumer Products | $ | 248.3 | | | $ | 228.5 | | | $ | 789.1 | | | $ | 676.2 | |
| Paperboard | 209.1 | | | 216.6 | | | 626.6 | | | 649.7 | |
| Total segment net sales | $ | 457.4 | | | $ | 445.2 | | | $ | 1,415.8 | | | $ | 1,326.0 | |
| | | | | | | |
| Operating income (loss): | | | | | | | |
| Consumer Products | $ | 31.3 | | | $ | (4.4) | | | $ | 82.1 | | | $ | (8.3) | |
| Paperboard | 32.8 | | | 17.1 | | | 91.6 | | | 80.1 | |
| Corporate | (14.6) | | | (13.2) | | | (45.6) | | | (42.5) | |
| Other operating charges, net | (0.3) | | | (1.9) | | | $ | (11.9) | | | (2.1) | |
| Income (loss) from operations | $ | 49.2 | | | $ | (2.4) | | | $ | 116.2 | | | $ | 27.2 | |
| | | | | | | | | | | | | | | | | | | | | | | | | | |
| Clearwater Paper Corporation |
| Reconciliation of Non-GAAP Financial Measures |
| Adjusted EBITDA |
| (Unaudited) |
| | |
| | Three Months Ended September 30, | | Nine Months Ended September 30, |
| (In millions) | | 2020 | | 2019 | | 2020 | | 2019 |
| Net income (loss) | | $ | 21.4 | | | $ | (11.0) | | | $ | 54.5 | | | $ | (7.6) | |
| Add back: | | | | | | | | |
| Income tax provision (benefit) | | 9.9 | | | (8.7) | | | 14.1 | | | (4.7) | |
| Interest expense, net | | 12.2 | | | 13.1 | | | 37.0 | | | 32.5 | |
| Depreciation and amortization expense | | 27.7 | | | 32.0 | | | 83.5 | | | 86.3 | |
Other operating charges, net1 | | 0.3 | | | 1.9 | | | 11.9 | | | 2.1 | |
| Other non-operating expense | | 1.9 | | | 1.4 | | | 5.7 | | | 4.3 | |
| Debt retirement costs | | 3.9 | | | 2.7 | | | 4.8 | | | 2.7 | |
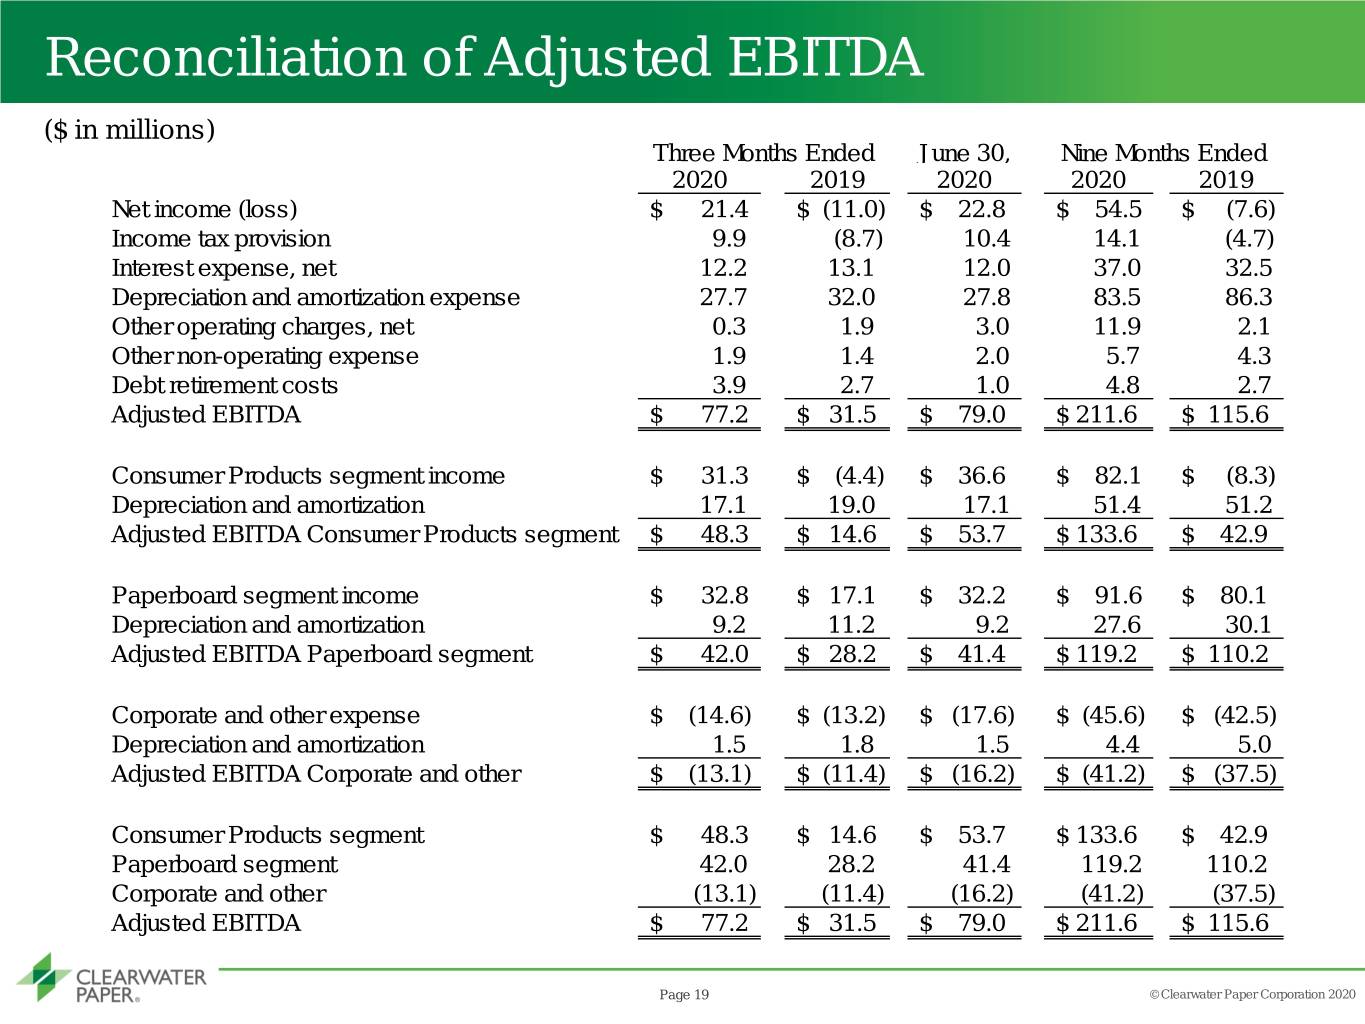
| Adjusted EBITDA | | $ | 77.2 | | | $ | 31.5 | | | $ | 211.6 | | | $ | 115.6 | |
| | | | | | | | |
| Consumer Products income (loss) | | $ | 31.3 | | | $ | (4.4) | | | $ | 82.1 | | | $ | (8.3) | |
| Depreciation and amortization | | 17.1 | | | 19.0 | | | 51.4 | | | 51.2 | |
| Consumer Products Adjusted EBITDA | | $ | 48.3 | | | $ | 14.6 | | | $ | 133.6 | | | $ | 42.9 | |
| | | | | | | | |
| Paperboard income | | $ | 32.8 | | | $ | 17.1 | | | $ | 91.6 | | | $ | 80.1 | |
| Depreciation and amortization | | 9.2 | | | 11.2 | | | 27.6 | | | 30.1 | |
| Paperboard Adjusted EBITDA | | $ | 42.0 | | | $ | 28.3 | | | $ | 119.2 | | | $ | 110.2 | |
| | | | | | | | |
| Corporate expenses | | $ | (14.6) | | | $ | (13.2) | | | $ | (45.6) | | | $ | (42.5) | |
| Depreciation and amortization | | 1.5 | | | 1.8 | | | 4.4 | | | 5.0 | |
| Corporate Adjusted EBITDA | | $ | (13.1) | | | $ | (11.4) | | | $ | (41.2) | | | $ | (37.5) | |
| | | | | | | | |
| Consumer Products | | $ | 48.3 | | | $ | 14.6 | | | $ | 133.6 | | | $ | 42.9 | |
| Paperboard | | 42.0 | | | 28.3 | | | 119.2 | | | 110.2 | |
| Corporate | | (13.1) | | | (11.4) | | | (41.2) | | | (37.5) | |
| Adjusted EBITDA | | $ | 77.2 | | | $ | 31.5 | | | $ | 211.6 | | | $ | 115.6 | |
1 Other operating charges, net consist of amounts unrelated to ongoing core operating activities. Please refer to Note 9 within Clearwater Paper's Form 10-Q filed with the SEC for the period end September 30, 2020 for the detailed breakout of this amount.
| | | | | | | | | | | | | | | | | | | | |
| Clearwater Paper Corporation |
| Reconciliation of Non-GAAP Financial Measures |
| Adjusted Net Income |
| (Unaudited) |
| | | | |
| Three Months Ended September 30, | Nine Months Ended September 30, |
| (In millions, except per-share data) | 2020 | | 2019 | 2020 | | 2019 |
| Net income (loss) | $ | 21.4 | | | $ | (11.0) | | $ | 54.5 | | | $ | (7.6) | |
| Add back: | | | | | | |
| Income tax provision (benefit) | 9.9 | | | (8.7) | | 14.1 | | | (4.7) | |
| Income (loss) before income taxes | 31.3 | | | (19.7) | | 68.7 | | | (12.2) | |
| | | | | | |
| Add back: | | | | | | |
| Debt retirement costs | 3.9 | | | 2.7 | | 4.8 | | | 2.7 | |
| Other operating charges, net | 0.3 | | | 1.9 | | 11.9 | | | 2.1 | |
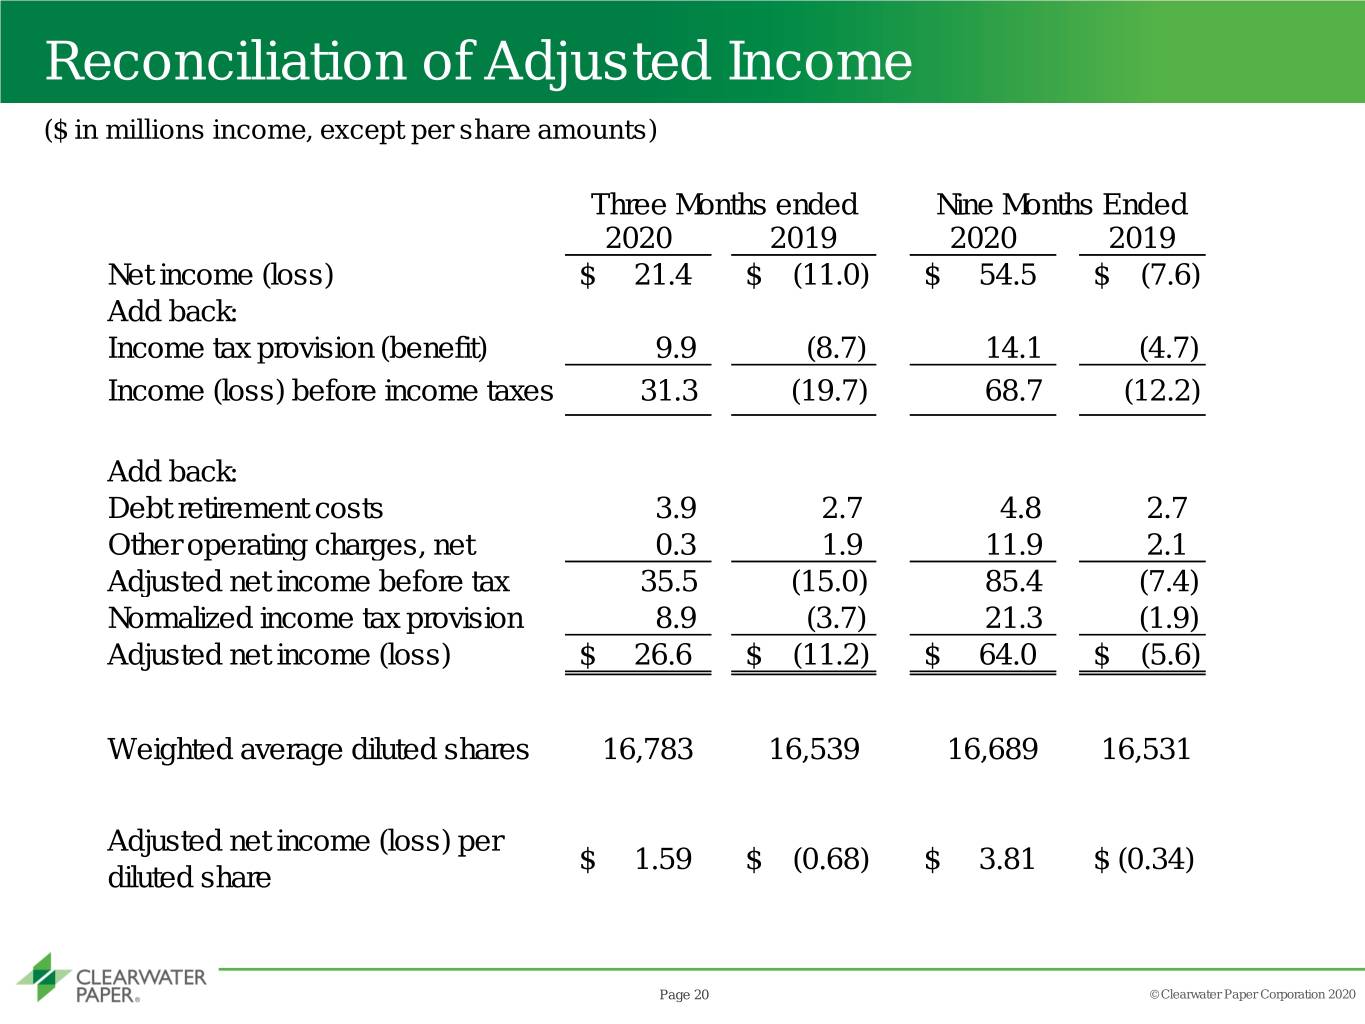
| Adjusted income (loss) before tax | $ | 35.5 | | | $ | (15.0) | | $ | 85.3 | | | $ | (7.4) | |
| Normalized income tax provision (benefit) | 8.9 | | | (3.7) | | 21.3 | | | (1.9) | |
| Adjusted income (loss) | $ | 26.6 | | | $ | (11.2) | | $ | 64.0 | | | $ | (5.6) | |
| | | | | | |
| Weighted average diluted shares | 16,783 | | | 16,539 | | 16,689 | | | 16,531 | |
| | | | | | |
| Adjusted income (loss) per diluted share | $ | 1.59 | | | $ | (0.68) | | $ | 3.81 | | | $ | (0.34) | |
Clearwater Paper Corporation
Investors contact:
Sloan Bohlen
Solebury Trout
509.344.5906
News media:
Shannon Myers
509.344.5967