Exhibit No. 99.1
News Release 
COMMERCIAL METALS COMPANY REPORTS FOURTH QUARTER
AND FULL YEAR FISCAL 2020 RESULTS
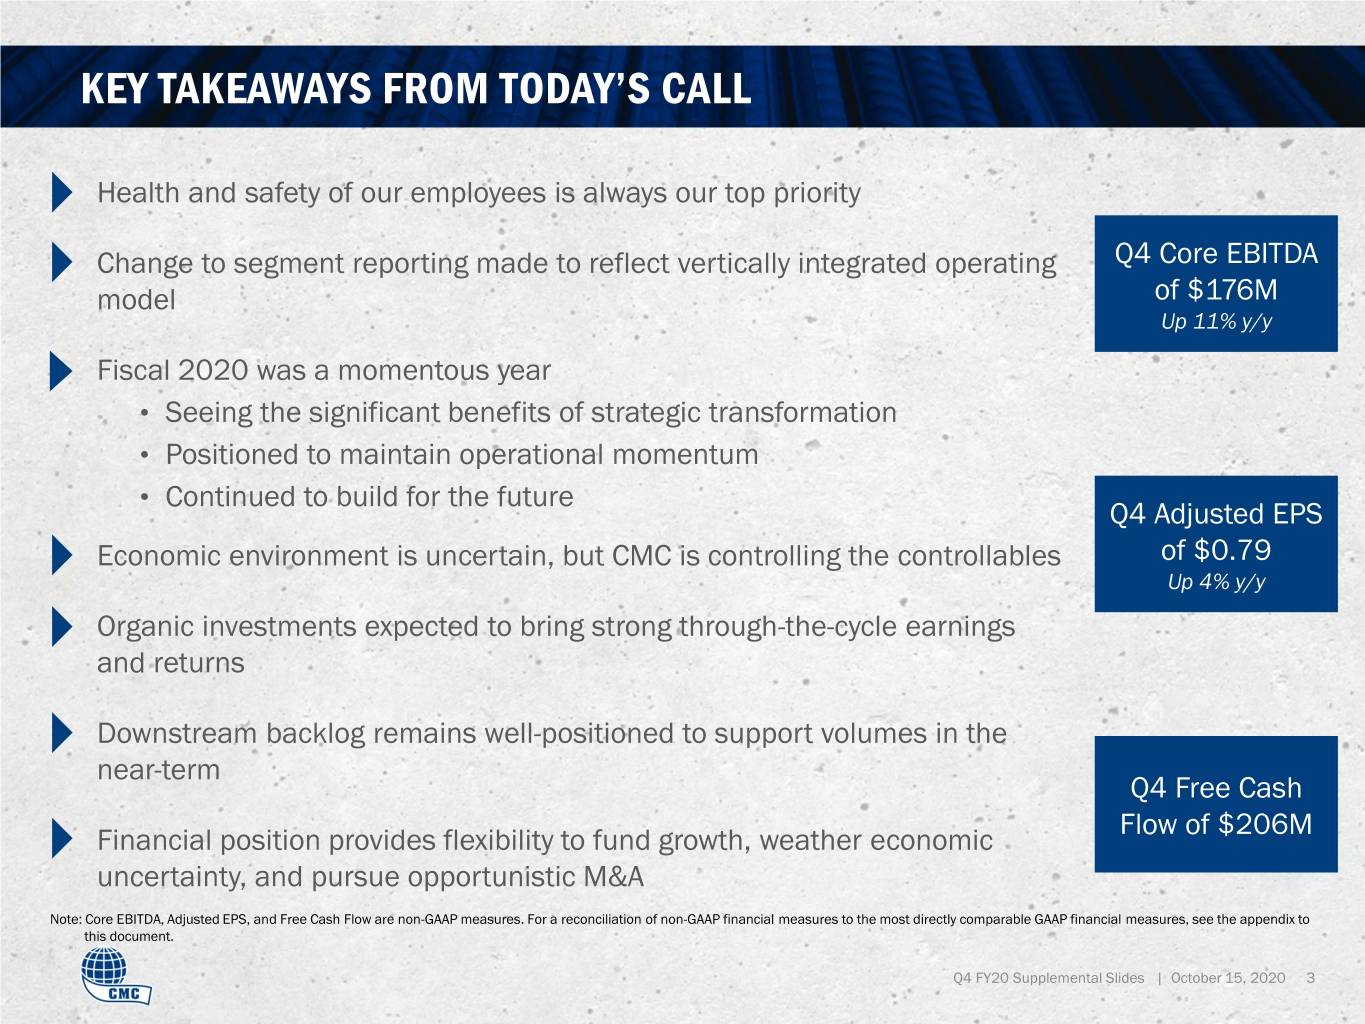
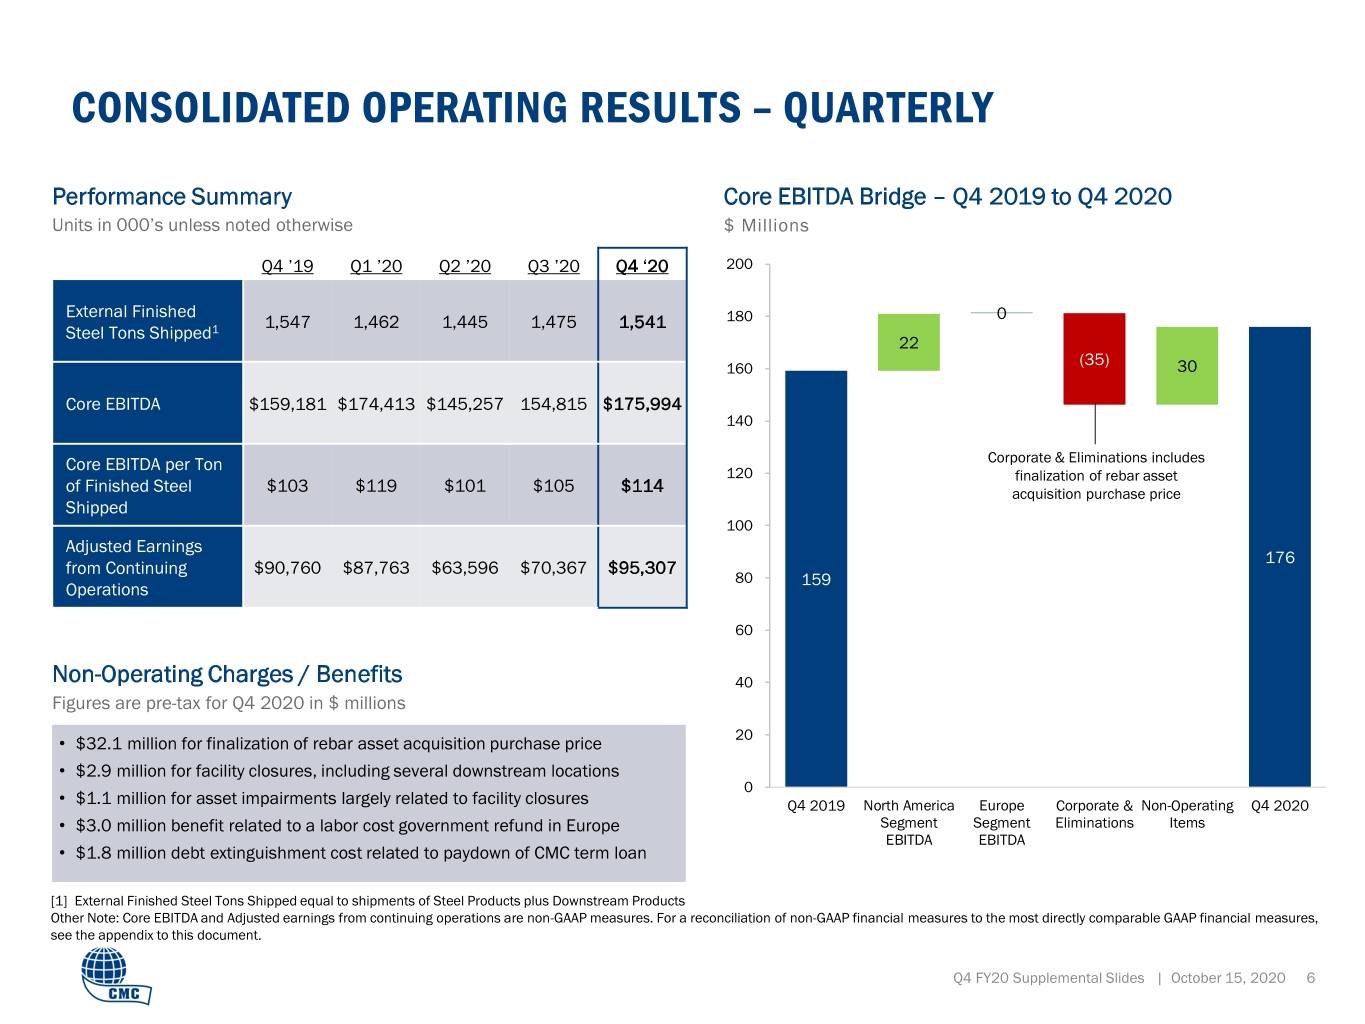
•Fourth quarter GAAP Earnings from Continuing Operations increased 5.6% sequentially, Adjusted Earnings from Continuing Operations increased 35%
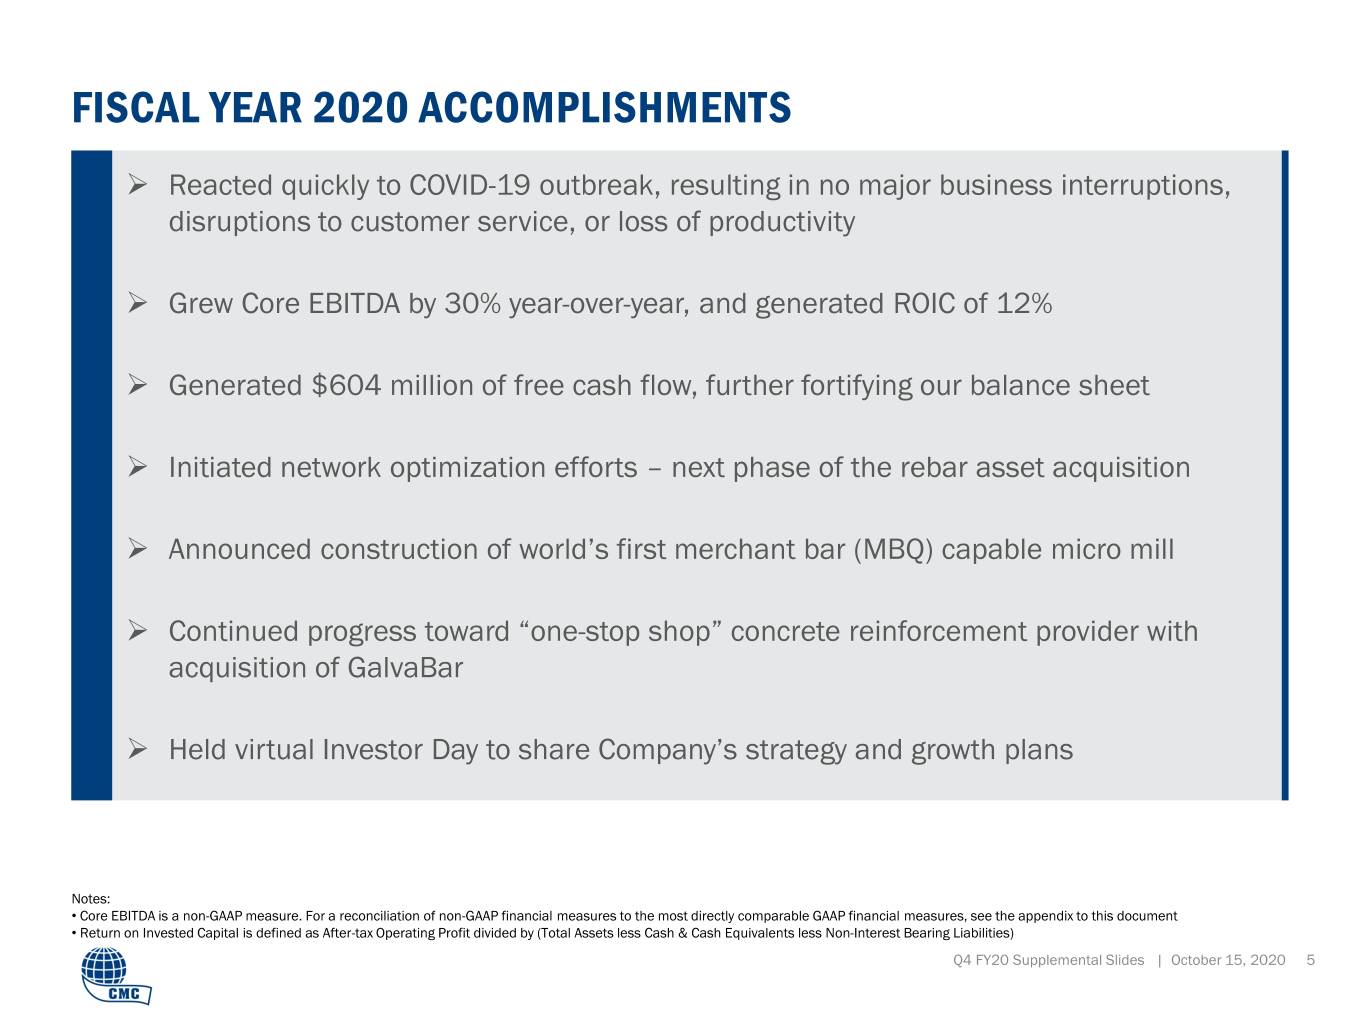
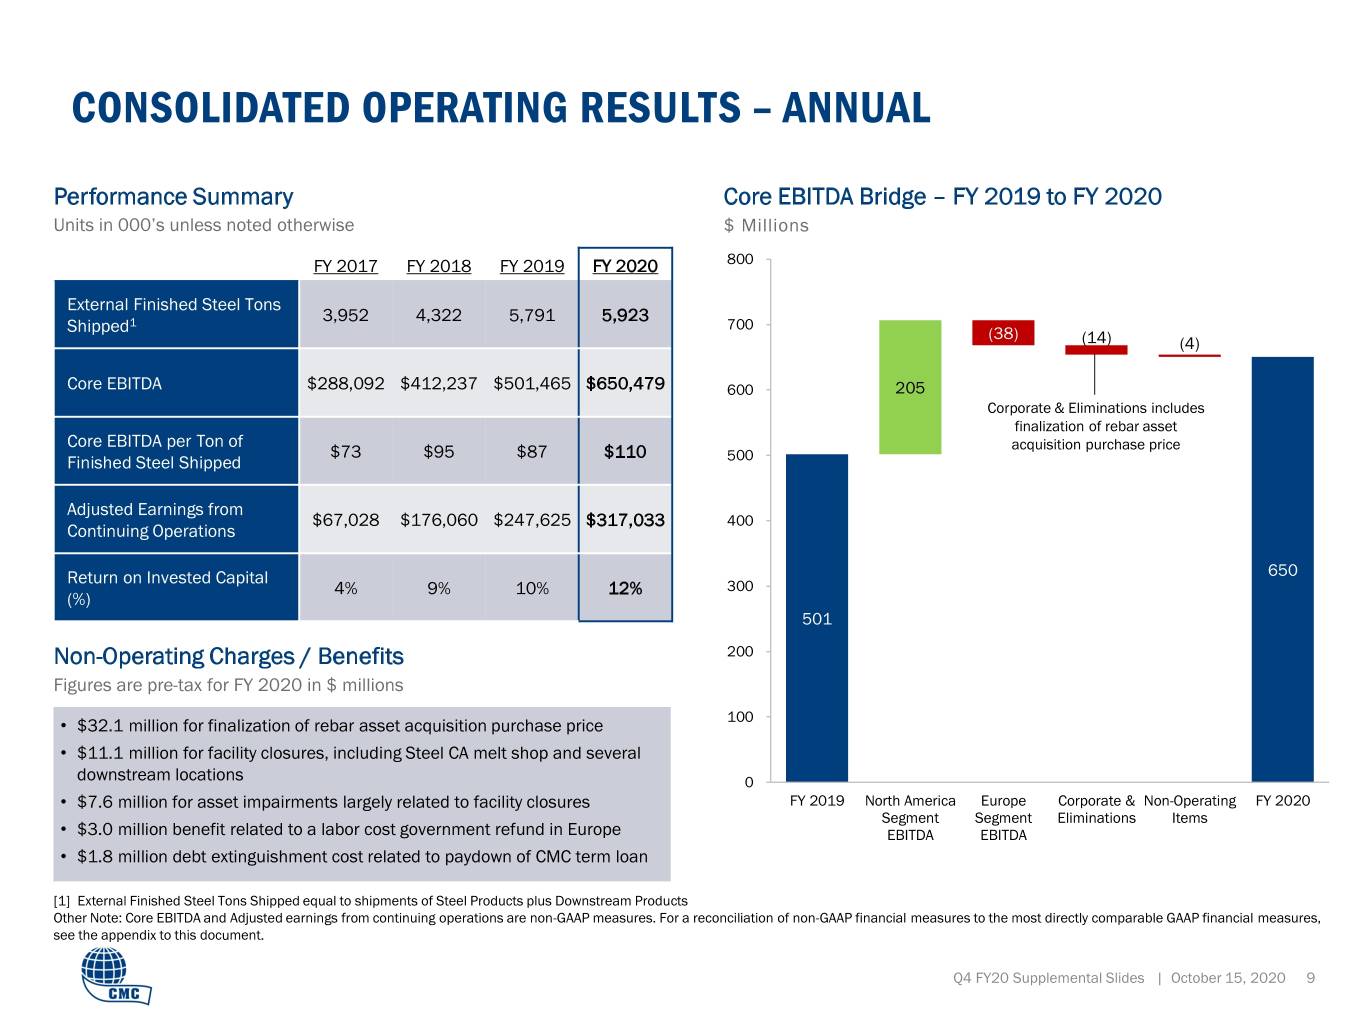
•Fourth quarter Core EBITDA rose 14% sequentially. Fiscal year 2020 Core EBITDA increased 30% year-over-year
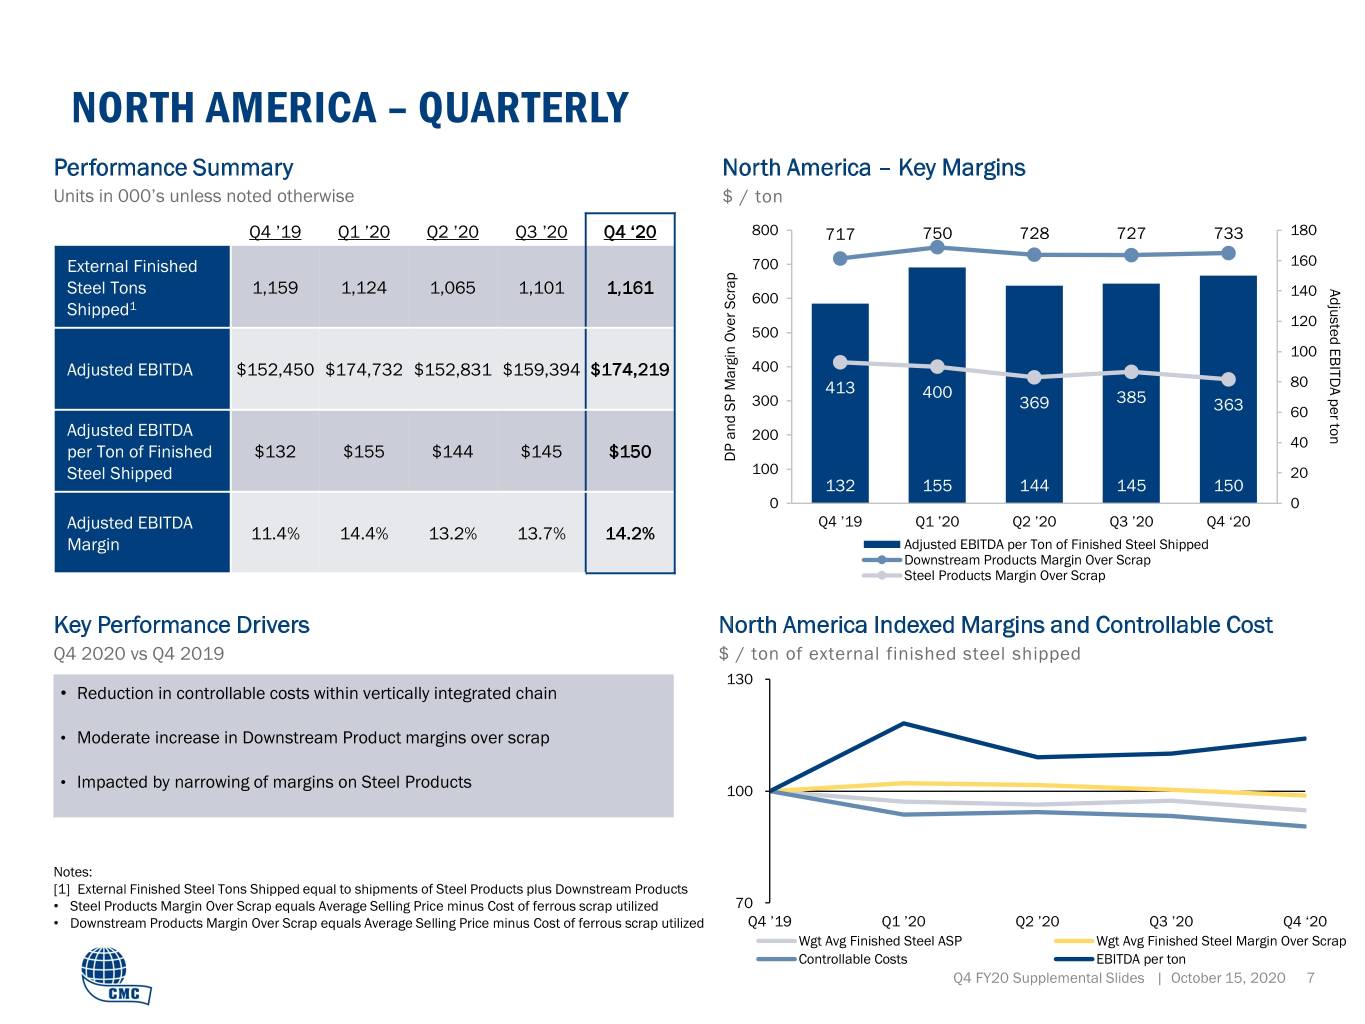
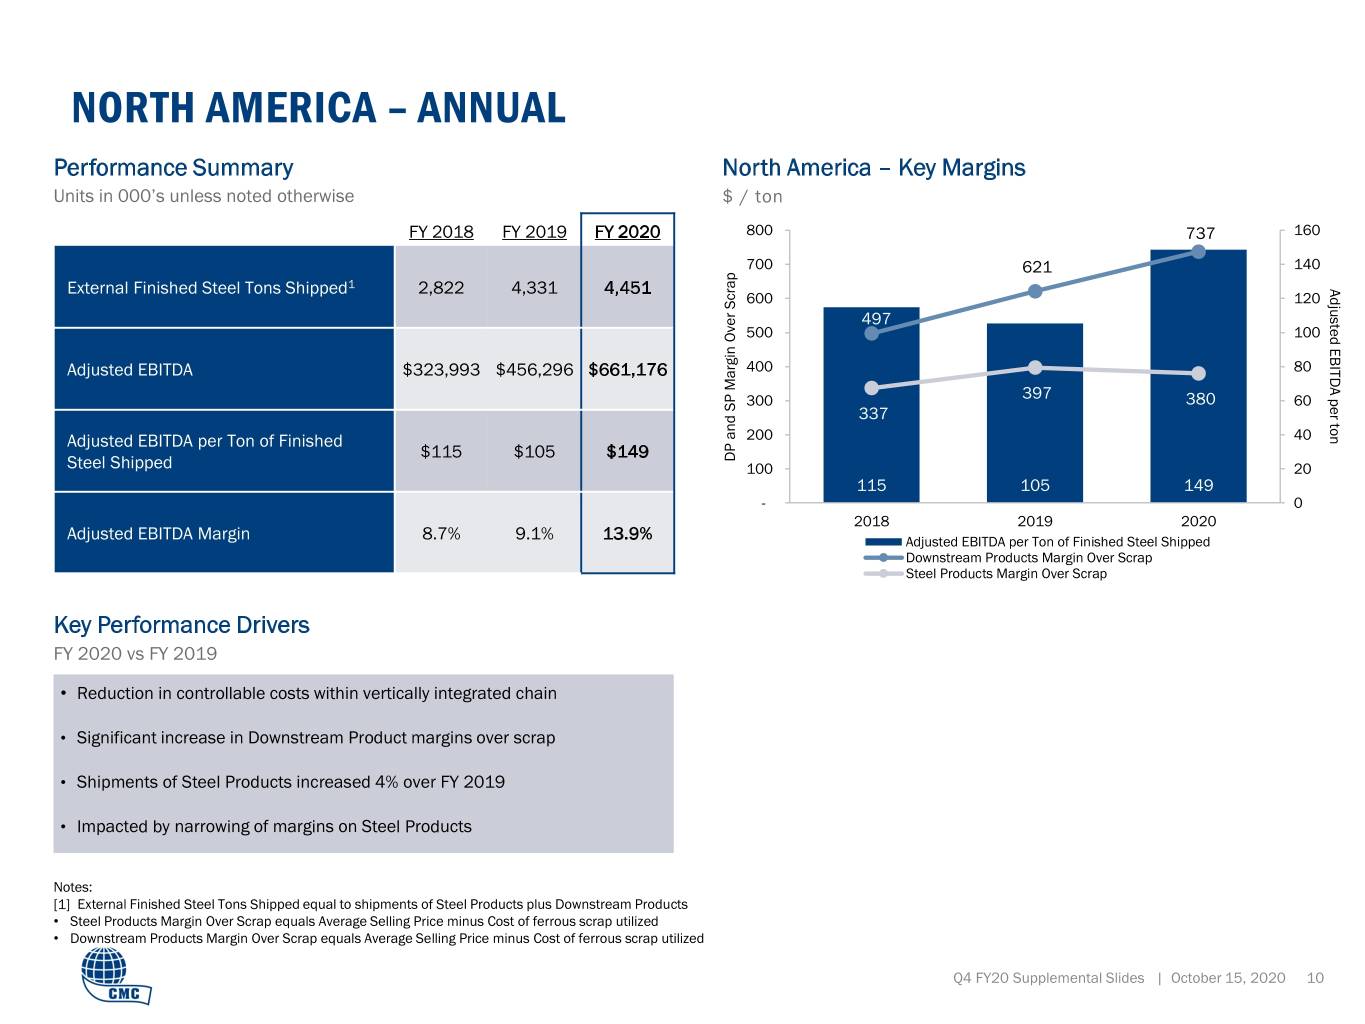
•Fourth quarter North America segment Adjusted EBITDA increased 9% sequentially, driven by higher shipments of finished product and strong cost management throughout the vertically integrated value chain
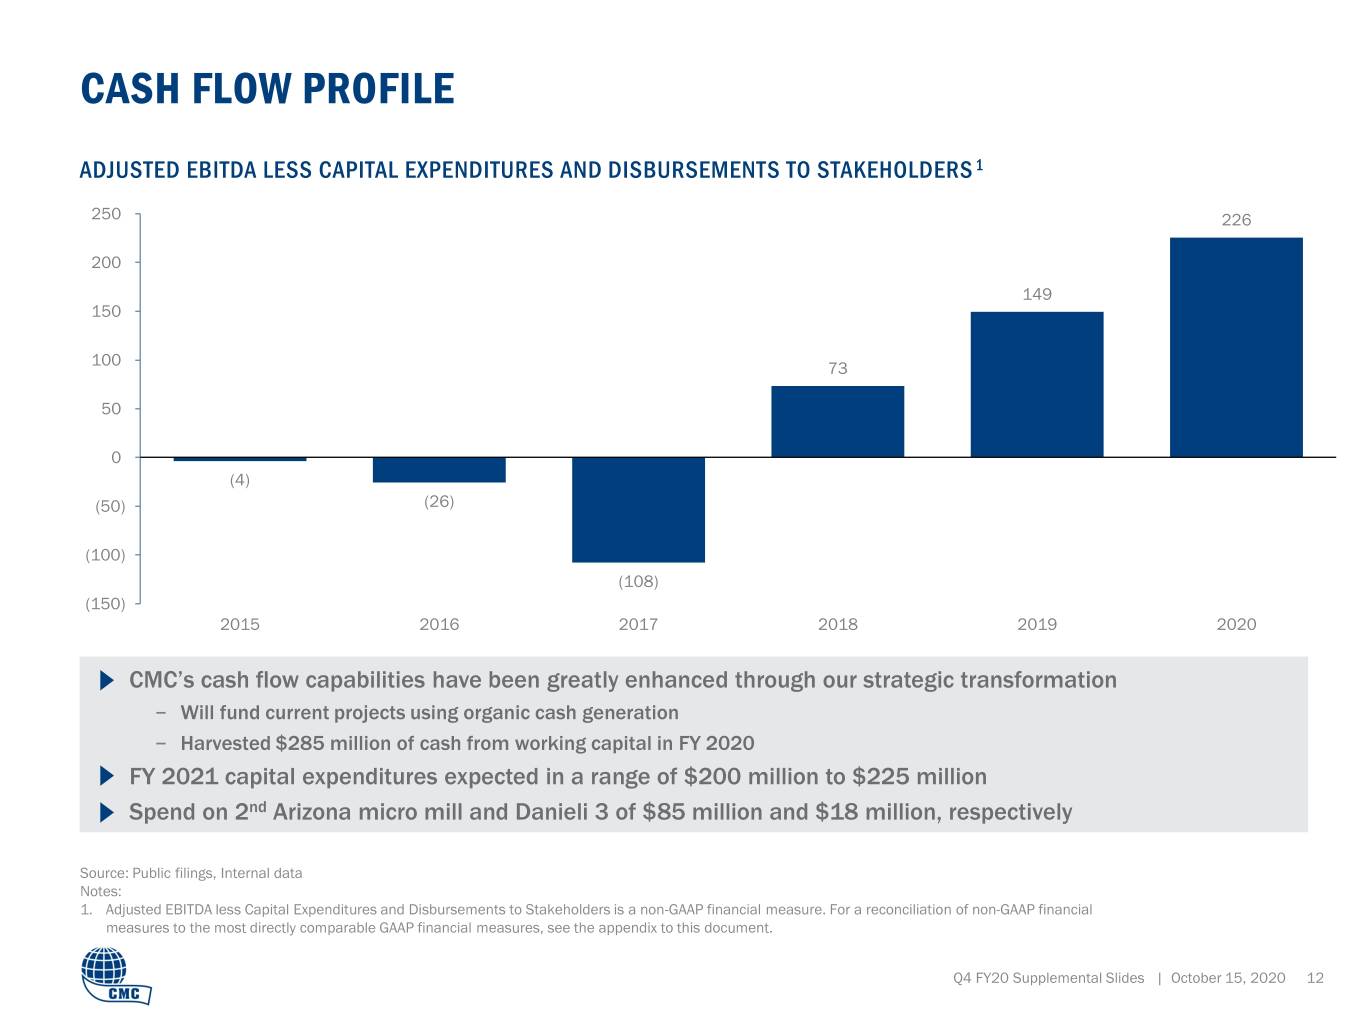
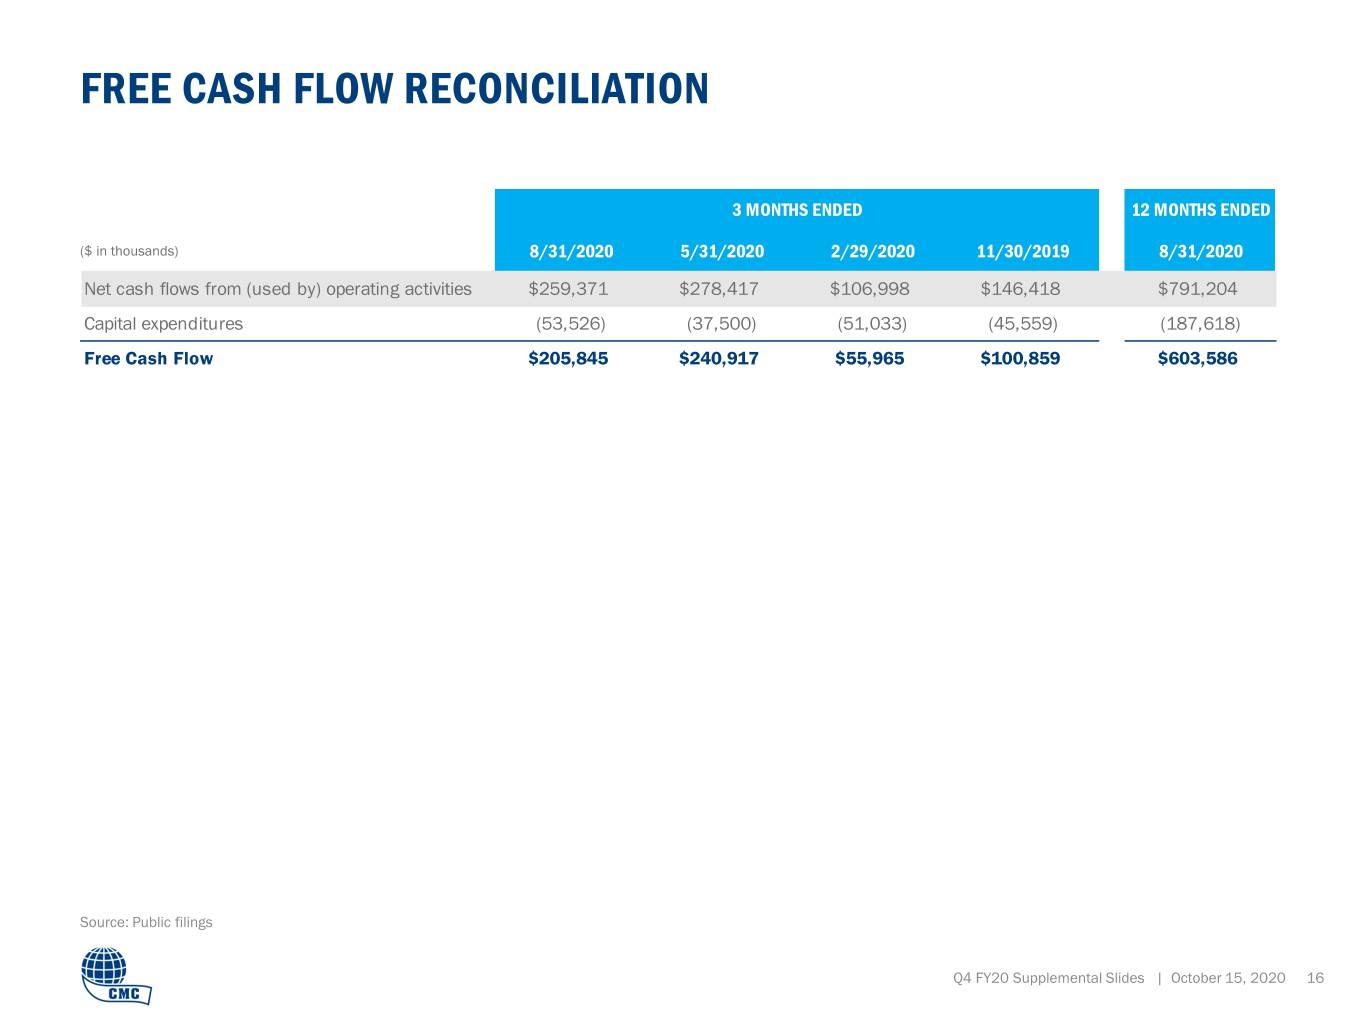
•Generated full year Cash from Operations of $791.2 million
Irving, TX - October 15, 2020 - Commercial Metals Company (NYSE: CMC) today announced financial results for its fiscal fourth quarter and year ended August 31, 2020. Earnings from continuing operations were $67.8 million, or $0.56 per diluted share, in the fourth quarter, compared to $85.9 million, or $0.72 per diluted share, in the prior year period. For the full year, earnings from continuing operations were $278.3 million, or $2.31 per diluted share, compared to $198.8 million, or $1.67 per diluted share in the prior year.
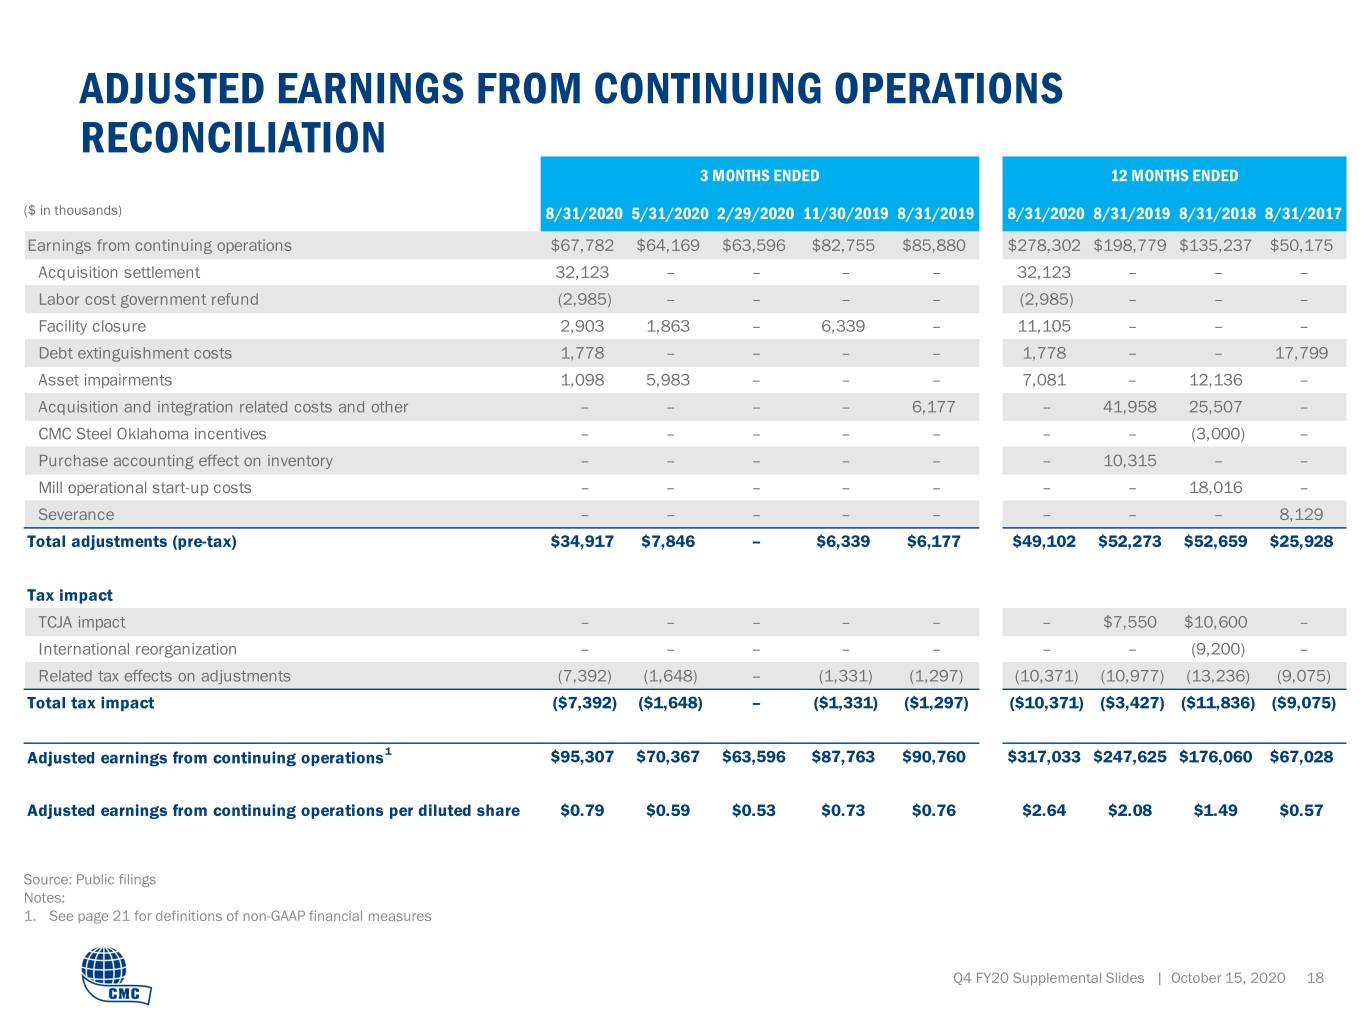
During the fourth quarter of fiscal 2020, the Company incurred $27.5 million in net after-tax charges, the largest of which related to the post-closing working capital settlement associated with its fiscal 2019 rebar asset acquisition. In addition, the Company incurred non-cash charges in connection with facility closures, as it continued to optimize its operational footprint, as well as debt extinguishment costs related to the complete pay-down of CMC's term loan facility. Excluding these and other, one-time expenses, fourth quarter adjusted earnings from continuing operations were $95.3 million, or $0.79 per diluted share, compared to adjusted earnings from continuing operations of $0.76 per diluted share in the prior year period. Details can be found in the non-GAAP reconciliation on page 12.
Barbara R. Smith, Chairman of the Board, President and Chief Executive Officer, commented, "Fiscal 2020 was an exceptional year for CMC, and our strong results – including enhanced earnings, increased cash flow, additional operational flexibility, and a more robust balance sheet – demonstrate the value of CMC’s purposeful strategic transformation completed over the last several years and our position as a leader in concrete reinforcement."
"The past year was also one of unprecedented challenges that altered the work and home life of each of our employees. I could not be prouder of the way the CMC team members responded, delivering a banner year for our Company despite the difficulties presented by the COVID-19 pandemic. Looking ahead, we continue to strategically build for the future. We expect our ongoing network optimization efforts will yield additional margin and working
(CMC Year End 2020 - 2)
capital benefits, and our third rolling line in Poland to begin commissioning toward the end of this fiscal year. In addition, we recently announced the construction of a third micro mill, which will be the world's first merchant product-capable micro mill upon its completion in fiscal 2023," Smith added.
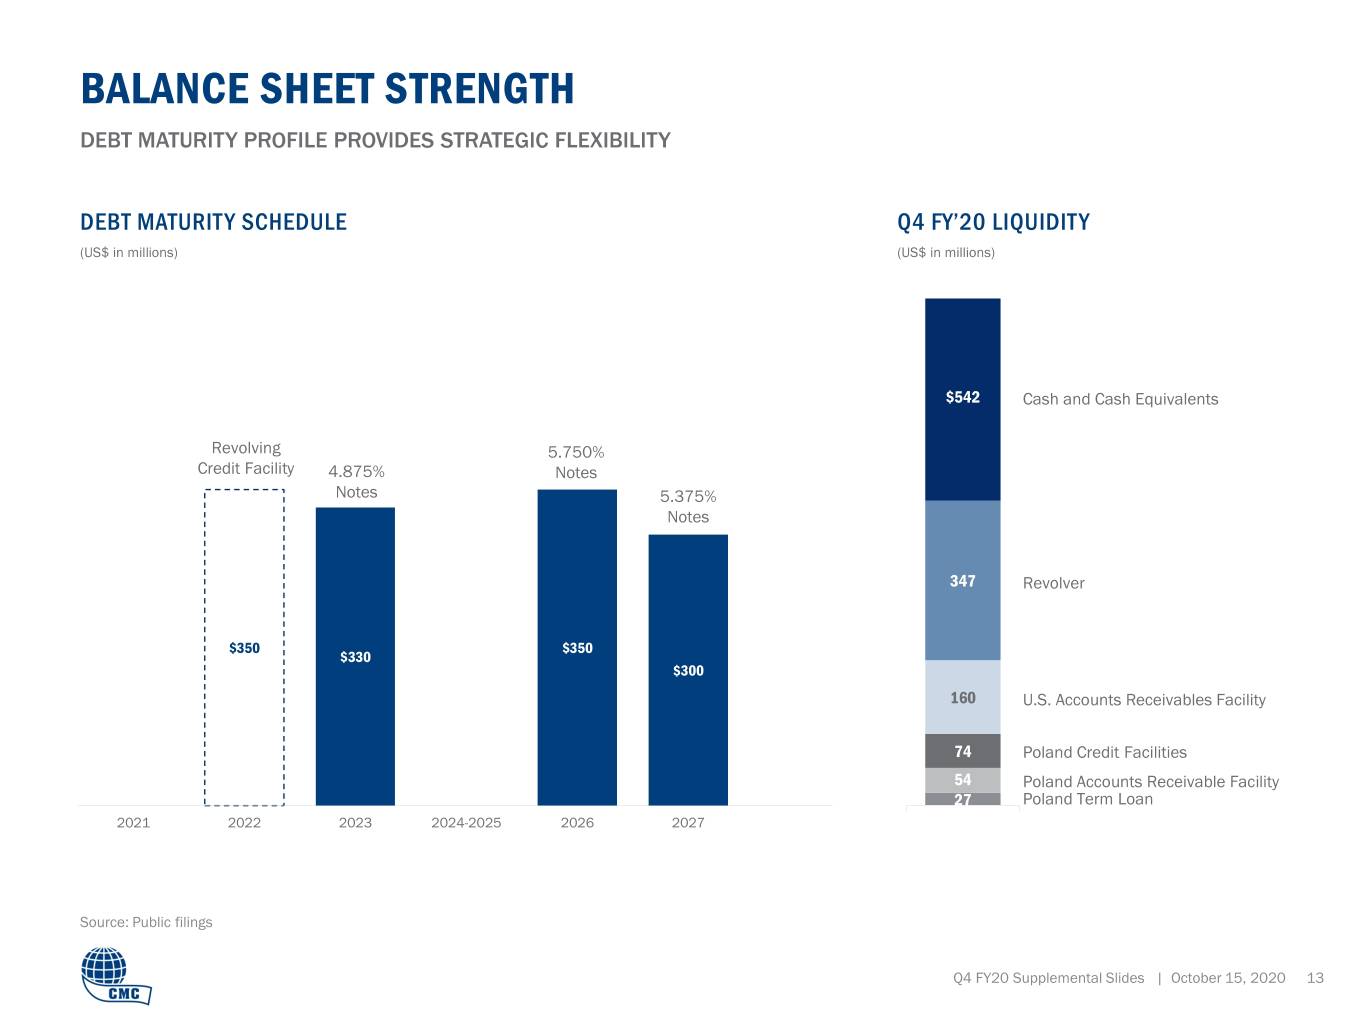
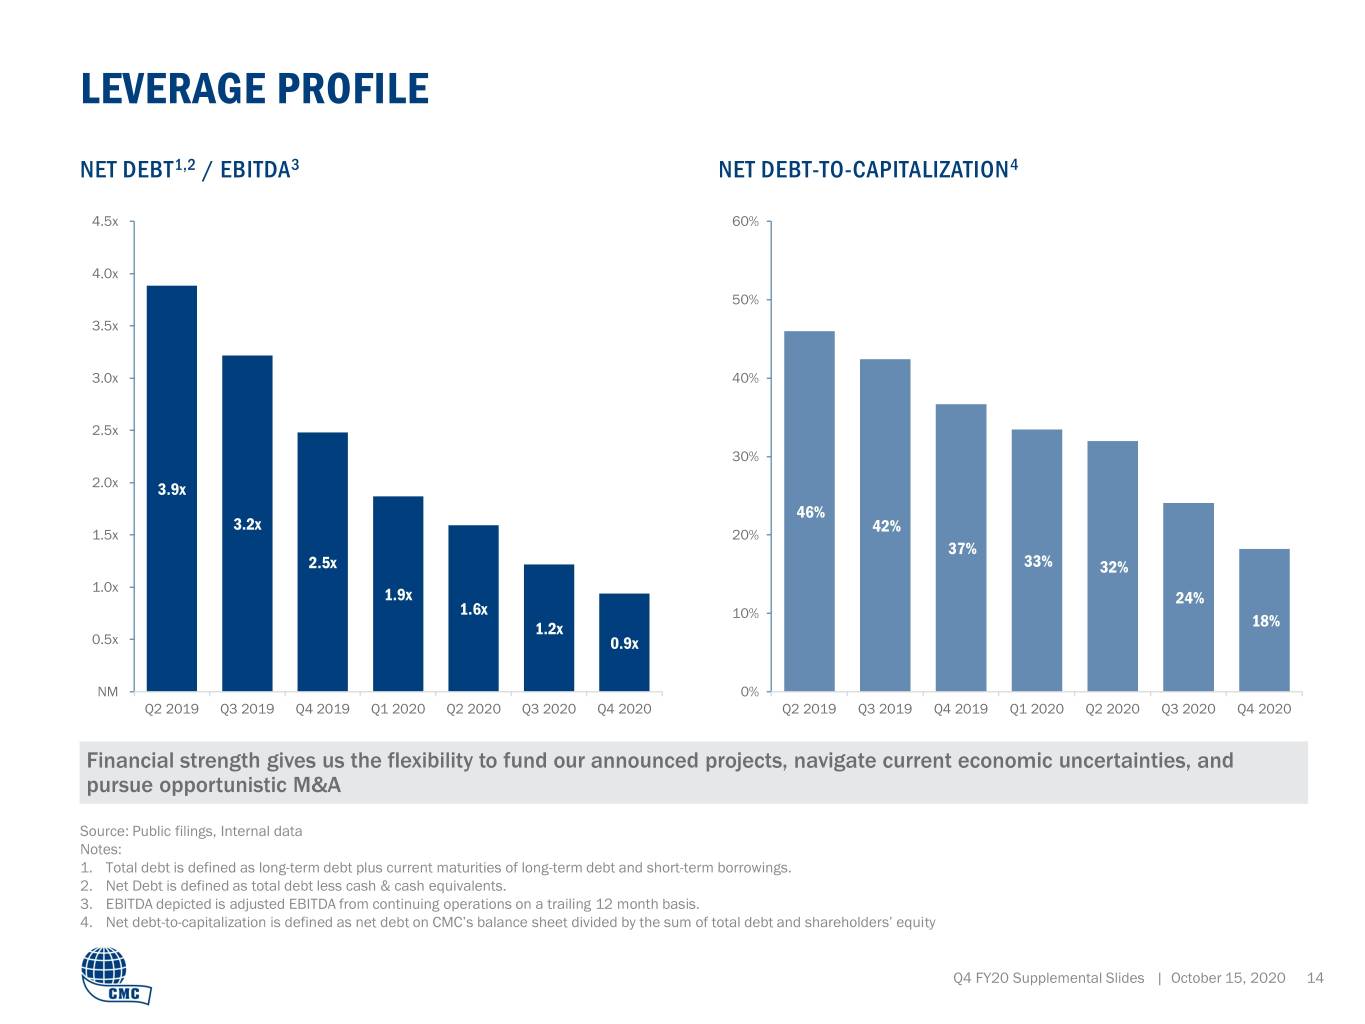
As a result of the strong free cash flow generated during the fourth quarter, the Company reduced its debt sequentially, while also improving its cash balance to $542.1 million at August 31, 2020. Compared to the prior year-end, CMC's cash balance increased by $349.6 million, while total indebtedness was reduced by $161.0 million. Availability under the Company's credit and accounts receivable programs was $661.9 million at August 31, 2020.
On October 14, 2020, the board of directors declared a quarterly dividend of $0.12 per share of CMC common stock payable to stockholders of record on October 29, 2020. The dividend will be paid on November 13, 2020, and marks 224 consecutive quarterly dividend payments by the Company.
(CMC Year End 2020 - 3)
Business Segments - Fiscal Fourth Quarter 2020 Review
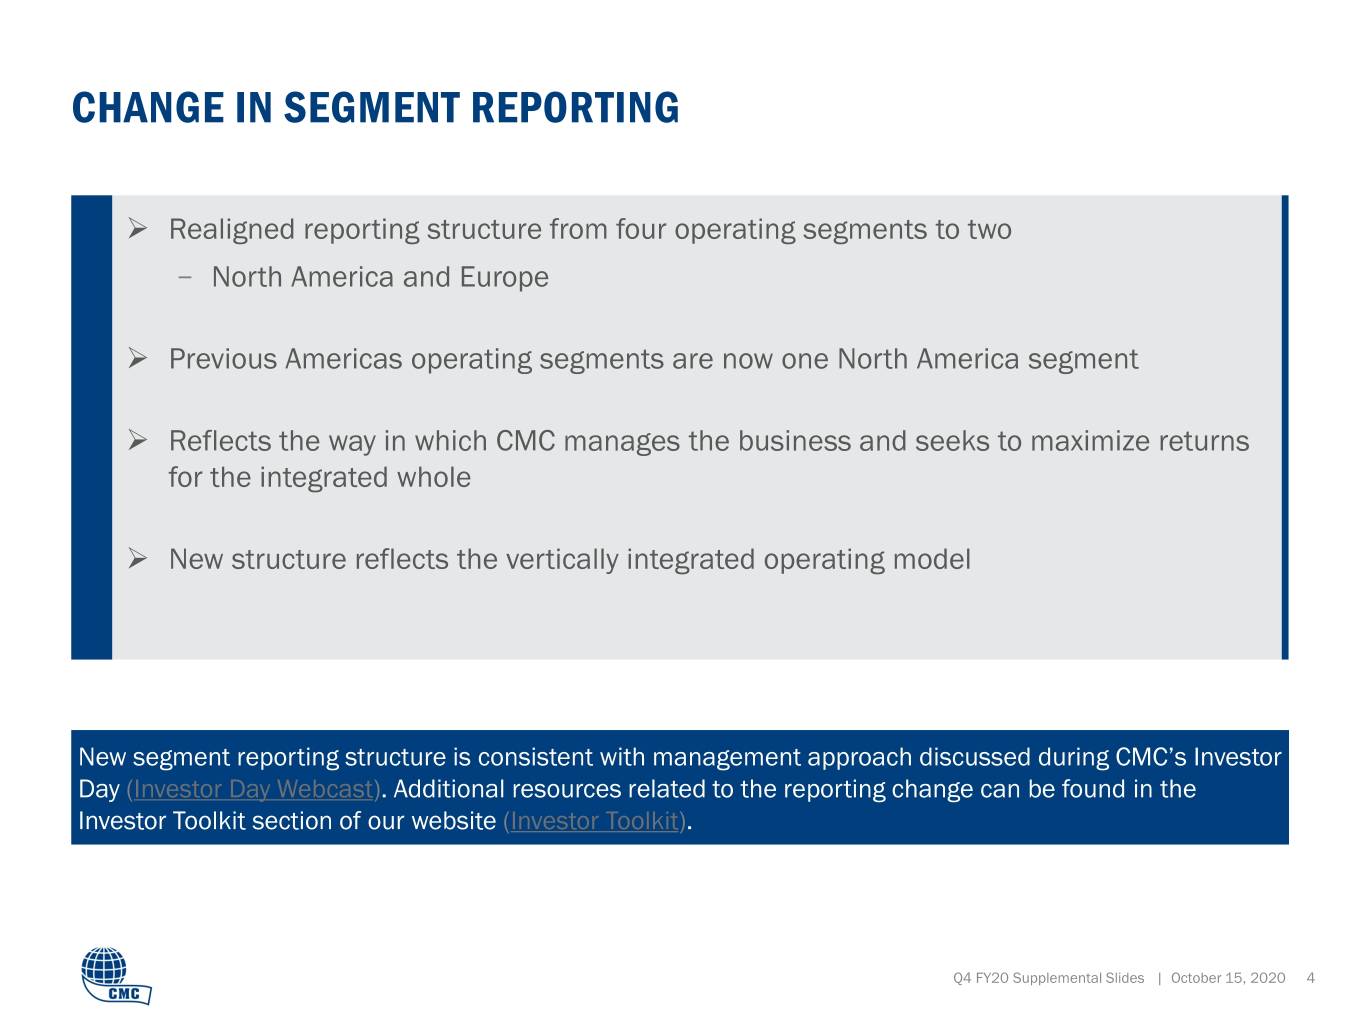
Beginning with its fiscal fourth quarter 2020 results, CMC is reporting two operating segments: North America and Europe. North America comprises the former Americas Recycling, Americas Mills, and Americas Fabrication segments. Europe comprises the former International Mill segment, with no other changes. For additional details regarding changes to the operating segment reporting, please refer to the investor relations section of CMC's website.
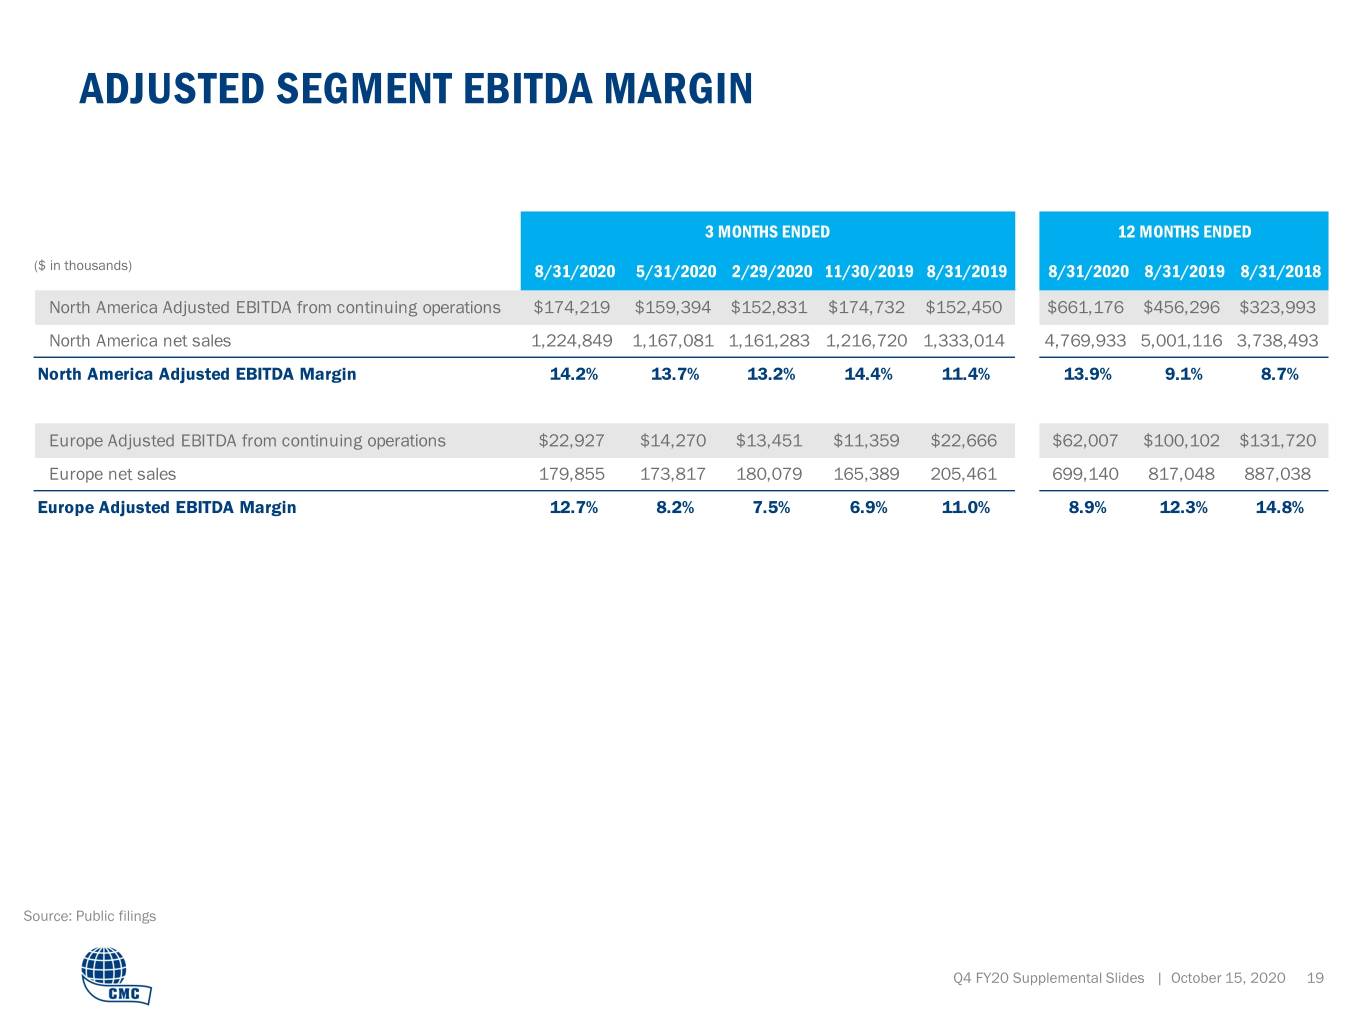
The North America segment generated adjusted EBITDA of $174.2 million for the fourth quarter of fiscal 2020, an increase of 14% compared to $152.5 million in the prior year period. The improvement reflects strong management of non-raw material costs at each stage of our vertically integrated value chain. Cost performance at the mills was particularly strong, with a meaningful portion of the improvement driven by the recent decision to curtail melting operations at Steel California and supply billets from lower cost plants. Lower operating costs at downstream locations also contributed to the improved performance.
Shipment volumes of finished goods, which includes steel products and downstream products, were flat compared to the prior year quarter. Demand for rebar from the mills remained strong, growing year-over-year, supported by healthy construction backlogs across our customer base. As a result of gains in market share, shipments of merchant bar were flat compared to the prior year period, as underlying consumption declined across the industry. Downstream product volumes declined modestly year-over-year due largely to the impact of weather challenges in the Gulf Coast and Texas markets.
Margins over scrap cost within the vertical chain declined from the fourth quarter of fiscal 2019, due primarily to steel products. Average selling price for steel products decreased $59 per ton year-over-year, which was only partially offset by lower scrap costs. Margin over scrap cost on downstream products expanded modestly compared to a year ago, driven by lower input costs and stronger pricing in CMC's committed backlog, which led to higher average selling prices.
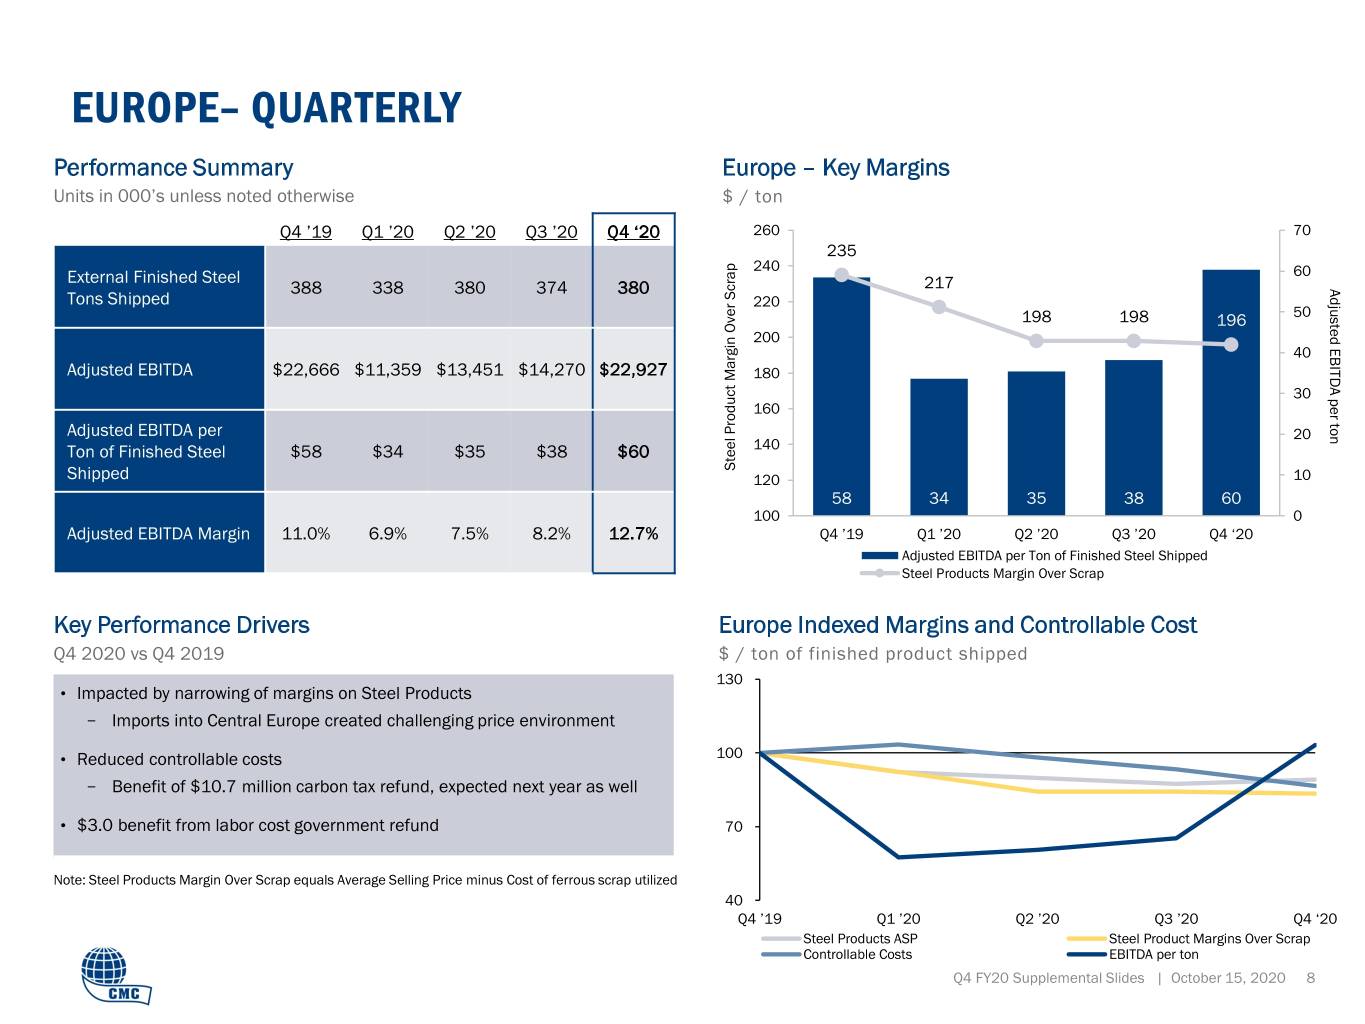
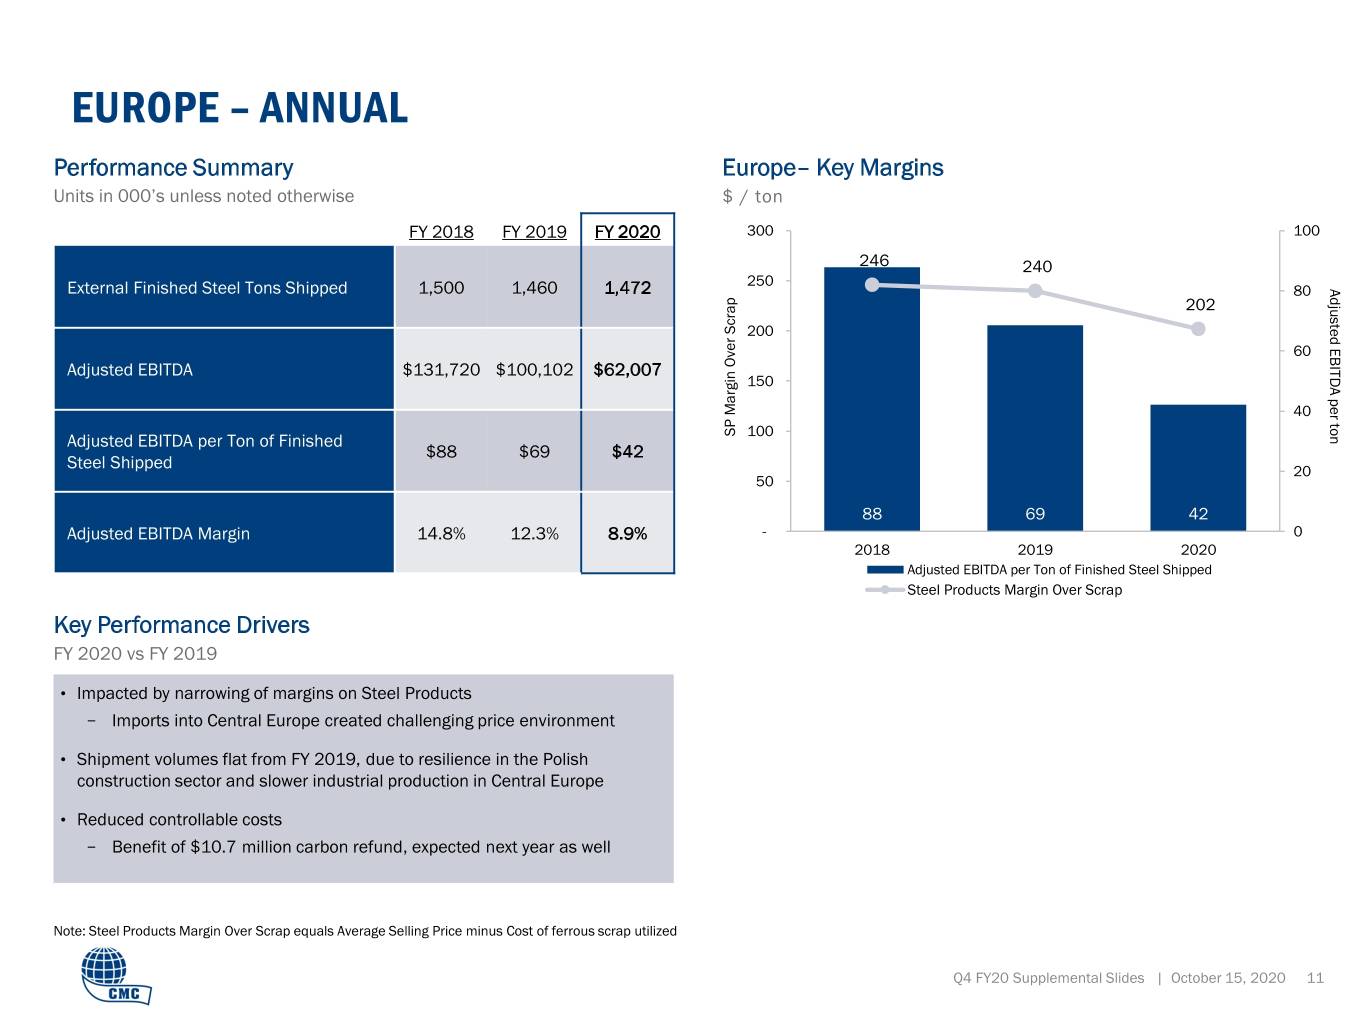
The Europe segment reported adjusted EBITDA of $22.9 million for the fourth quarter of fiscal 2020, up slightly compared to adjusted EBITDA of $22.7 million for the prior year quarter. Results benefited from a $10.7 million carbon credit that was received during the quarter. While shipment volumes decreased modestly compared to the prior year quarter, they remain supported by resilience in the Polish construction sector. The Central European market for long products continues to be challenged by ongoing incursions of imported material, which led to a $39 per ton reduction in steel product margin over scrap compared to the prior year period.
Outlook
"We expect finished steel volumes for our North America and Europe operations to follow typical seasonal trends in the first fiscal quarter, with some negative impact in North America due to storms in the Texas and Gulf
(CMC Year End 2020 - 4)
Coast markets," said Ms. Smith. "Shipments of steel and downstream products in the near-term should be supported by our solid construction backlog. We anticipate margin headwinds in the first quarter within North America due to the recent rise in scrap costs mitigated, in part, by steel price increases that became effective during the quarter. The market for long products in Europe is expected to remain challenged due to elevated import levels. However, demand appears solid, driven by construction sector resilience, and rebounding Central European industrial production."
Conference Call
CMC invites you to listen to a live broadcast of its fourth quarter fiscal 2020 conference call today, Thursday, October 15, 2020, at 11:00 a.m. ET. Barbara Smith, Chairman of the Board of Directors, President, and Chief Executive Officer, and Paul Lawrence, Vice President and Chief Financial Officer, will host the call. The call is accessible via our website at www.cmc.com. In the event you are unable to listen to the live broadcast, the call will be archived and available for replay on our website on the next business day. Financial and statistical information presented in the broadcast are located on CMC's website under "Investors."
About Commercial Metals Company
Commercial Metals Company and its subsidiaries manufacture, recycle and fabricate steel and metal products, related materials and services through a network of facilities that includes seven electric arc furnace ("EAF") mini mills, two EAF micro mills, two rerolling mills, steel fabrication and processing plants, construction-related product warehouses, and metal recycling facilities in the U.S. and Poland.
Forward-Looking Statements
This news release contains forward-looking statements within the meaning of the federal securities laws with respect to general economic conditions, key macro-economic drivers that impact our business, the effects of ongoing trade actions, the effects of continued pressure on the liquidity of our customers, potential synergies and organic growth provided by our recent acquisitions and strategic investments, demand for our products, metal margins, the effect of COVID-19 and related governmental and economic responses thereto, the ability to operate our steel mills at full capacity, future supplies of raw materials and energy for our operations, share repurchases, legal proceedings, the undistributed earnings of our non-U.S. subsidiaries, U.S. non-residential construction activity, international trade, capital expenditures, our liquidity and our ability to satisfy future liquidity requirements, estimated contractual obligations and our expectations or beliefs concerning future events. These forward-looking statements can generally be identified by phrases such as we or our management "expects," "anticipates," "believes," "estimates," "intends," "plans to," "ought," "could," "will," "should," "likely," "appears," "projects," "forecasts," "outlook" or other similar words or phrases. There are inherent risks and uncertainties in any forward-looking statements. We caution readers not to place undue reliance on any forward-looking statements.
(CMC Year End 2020 - 5)
Although we believe that our expectations are reasonable, we can give no assurance that these expectations will prove to have been correct, and actual results may vary materially. Except as required by law, we undertake no obligation to update, amend or clarify any forward-looking statements to reflect changed assumptions, the occurrence of anticipated or unanticipated events, new information or circumstances or any other changes. Important factors that could cause actual results to differ materially from our expectations include those described in Part I, Item 1A, "Risk Factors" of our annual report on Form 10-K for the fiscal year ended August 31, 2020, as well as the following: changes in economic conditions which affect demand for our products or construction activity generally, and the impact of such changes on the highly cyclical steel industry; rapid and significant changes in the price of metals, potentially impairing our inventory values due to declines in commodity prices or reducing the profitability of our downstream products contracts due to rising commodity pricing; impacts from COVID-19 on the economy, demand for our products and on our operations, including the responses of governmental authorities to contain COVID-19; excess capacity in our industry, particularly in China, and product availability from competing steel mills and other steel suppliers including import quantities and pricing; compliance with and changes in environmental laws and regulations, including increased regulation associated with climate change and greenhouse gas emissions; involvement in various environmental matters that may result in fines, penalties or judgments; potential limitations in our or our customers' abilities to access credit and non-compliance by our customers with our contracts; activity in repurchasing shares of our common stock under our repurchase program; financial covenants and restrictions on the operation of our business contained in agreements governing our debt; our ability to successfully identify, consummate and integrate acquisitions, and the effects that acquisitions may have on our financial leverage; risks associated with acquisitions generally, such as the inability to obtain, or delays in obtaining, required approvals under applicable antitrust legislation and other regulatory and third party consents and approvals; lower than expected future levels of revenues and higher than expected future costs; failure or inability to implement growth strategies in a timely manner; impact of goodwill impairment charges; impact of long-lived asset impairment charges; currency fluctuations; global factors, including trade measures, political uncertainties and military conflicts; availability and pricing of electricity, electrodes and natural gas for mill operations; ability to hire and retain key executives and other employees; competition from other materials or from competitors that have a lower cost structure or access to greater financial resources; information technology interruptions and breaches in security; ability to make necessary capital expenditures; availability and pricing of raw materials and other items over which we exert little influence, including scrap metal, energy and insurance; unexpected equipment failures; losses or limited potential gains due to hedging transactions; litigation claims and settlements, court decisions, regulatory rulings and legal compliance risks; risk of injury or death to employees, customers or other visitors to our operations; civil unrest, protests and riots; new and clarifying guidance with regard to interpretation of certain provisions of the Tax Cuts and Jobs Act that could impact our assessment; and increased costs related to health care reform legislation.
(CMC Year End 2020 - 6)
| COMMERCIAL METALS COMPANY FINANCIAL & OPERATING STATISTICS (UNAUDITED) | ||||||||||||||||||||||||||||||||||||||||||||
| Three Months Ended | Fiscal Year Ended | |||||||||||||||||||||||||||||||||||||||||||
| (in thousands, except per ton amounts) | 8/31/2020 | 5/31/2020 | 2/29/2020 | 11/30/2019 | 8/31/2019 | 8/31/2020 | 8/31/2019 | |||||||||||||||||||||||||||||||||||||
| North America | ||||||||||||||||||||||||||||||||||||||||||||
| Net sales | $ | 1,224,849 | $ | 1,167,081 | $ | 1,161,283 | $ | 1,216,720 | $ | 1,333,014 | $ | 4,769,933 | $ | 5,001,116 | ||||||||||||||||||||||||||||||
| Adjusted EBITDA | 174,219 | 159,394 | 152,831 | 174,732 | 152,450 | 661,176 | 456,296 | |||||||||||||||||||||||||||||||||||||
| External tons shipped | ||||||||||||||||||||||||||||||||||||||||||||
| Raw materials | 300 | 288 | 321 | 320 | 399 | 1,229 | 1,662 | |||||||||||||||||||||||||||||||||||||
| Rebar | 498 | 463 | 461 | 475 | 474 | 1,897 | 1,726 | |||||||||||||||||||||||||||||||||||||
| Merchant and other | 234 | 211 | 238 | 236 | 237 | 919 | 973 | |||||||||||||||||||||||||||||||||||||
| Steel products | 732 | 674 | 699 | 711 | 711 | 2,816 | 2,699 | |||||||||||||||||||||||||||||||||||||
| Downstream products | 429 | 427 | 366 | 413 | 448 | 1,635 | 1,632 | |||||||||||||||||||||||||||||||||||||
| Average selling price per ton | ||||||||||||||||||||||||||||||||||||||||||||
| Raw materials | $ | 605 | $ | 517 | $ | 595 | $ | 547 | $ | 535 | $ | 567 | $ | 563 | ||||||||||||||||||||||||||||||
| Steel products | 600 | 624 | 625 | 626 | 659 | 618 | 681 | |||||||||||||||||||||||||||||||||||||
| Downstream products | 970 | 966 | 984 | 976 | 963 | 975 | 905 | |||||||||||||||||||||||||||||||||||||
| Cost of raw materials per ton | $ | 427 | $ | 348 | $ | 435 | $ | 392 | $ | 383 | $ | 402 | $ | 406 | ||||||||||||||||||||||||||||||
| Cost of ferrous scrap utilized per ton | 237 | 239 | 256 | 226 | 246 | 238 | 284 | |||||||||||||||||||||||||||||||||||||
| Steel products metal margin per ton | $ | 363 | $ | 385 | $ | 369 | $ | 400 | $ | 413 | $ | 380 | $ | 397 | ||||||||||||||||||||||||||||||
| Europe | ||||||||||||||||||||||||||||||||||||||||||||
| Net sales | $ | 179,855 | $ | 173,817 | $ | 180,079 | $ | 165,389 | $ | 205,461 | $ | 699,140 | $ | 817,048 | ||||||||||||||||||||||||||||||
| Adjusted EBITDA | 22,927 | 14,270 | 13,451 | 11,359 | 22,666 | 62,007 | 100,102 | |||||||||||||||||||||||||||||||||||||
| External tons shipped | ||||||||||||||||||||||||||||||||||||||||||||
| Rebar | 150 | 122 | 145 | 122 | 151 | 539 | 423 | |||||||||||||||||||||||||||||||||||||
| Merchant and other | 230 | 252 | 235 | 216 | 237 | 933 | 1,037 | |||||||||||||||||||||||||||||||||||||
| Steel products | 380 | 374 | 380 | 338 | 388 | 1,472 | 1,460 | |||||||||||||||||||||||||||||||||||||
| Average selling price per ton | ||||||||||||||||||||||||||||||||||||||||||||
| Steel products | $ | 446 | $ | 437 | $ | 449 | $ | 461 | $ | 500 | $ | 448 | $ | 528 | ||||||||||||||||||||||||||||||
| Cost of ferrous scrap utilized per ton | $ | 250 | $ | 239 | $ | 251 | $ | 244 | $ | 265 | $ | 246 | $ | 288 | ||||||||||||||||||||||||||||||
| Steel products metal margin per ton | $ | 196 | $ | 198 | $ | 198 | $ | 217 | $ | 235 | $ | 202 | $ | 240 | ||||||||||||||||||||||||||||||
(CMC Year End 2020 - 7)
| COMMERCIAL METALS COMPANY BUSINESS SEGMENTS (UNAUDITED) | ||||||||||||||||||||||||||||||||||||||||||||
| (in thousands) | Three Months Ended | Fiscal Year Ended | ||||||||||||||||||||||||||||||||||||||||||
| Net sales | 8/31/2020 | 5/31/2020 | 2/29/2020 | 11/30/2019 | 8/31/2019 | 8/31/2020 | 8/31/2019 | |||||||||||||||||||||||||||||||||||||
| North America | $ | 1,224,849 | $ | 1,167,081 | $ | 1,161,283 | $ | 1,216,720 | $ | 1,333,014 | $ | 4,769,933 | $ | 5,001,116 | ||||||||||||||||||||||||||||||
| Europe | 179,855 | 173,817 | 180,079 | 165,389 | 205,461 | 699,140 | 817,048 | |||||||||||||||||||||||||||||||||||||
| Corporate and Other | 4,428 | 785 | (399) | 2,599 | 4,530 | 7,413 | 10,838 | |||||||||||||||||||||||||||||||||||||
| Total net sales | $ | 1,409,132 | $ | 1,341,683 | $ | 1,340,963 | $ | 1,384,708 | $ | 1,543,005 | $ | 5,476,486 | $ | 5,829,002 | ||||||||||||||||||||||||||||||
| Adjusted EBITDA from continuing operations | ||||||||||||||||||||||||||||||||||||||||||||
| North America | $ | 174,219 | $ | 159,394 | $ | 152,831 | $ | 174,732 | $ | 152,450 | $ | 661,176 | $ | 456,296 | ||||||||||||||||||||||||||||||
| Europe | 22,927 | 14,270 | 13,451 | 11,359 | 22,666 | 62,007 | 100,102 | |||||||||||||||||||||||||||||||||||||
| Corporate and Other | (64,846) | (26,882) | (28,561) | (26,286) | (29,871) | (146,575) | (132,313) | |||||||||||||||||||||||||||||||||||||
(CMC Year End 2020 - 8)
| COMMERCIAL METALS COMPANY CONSOLIDATED STATEMENTS OF EARNINGS (UNAUDITED) | |||||||||||||||||||||||
| Three Months Ended | Fiscal Year Ended | ||||||||||||||||||||||
| (in thousands, except share data) | 8/31/2020 | 8/31/2019 | 8/31/2020 | 8/31/2019 | |||||||||||||||||||
| Net sales | $ | 1,409,132 | $ | 1,543,005 | $ | 5,476,486 | $ | 5,829,002 | |||||||||||||||
| Costs and expenses: | |||||||||||||||||||||||
| Cost of goods sold | 1,145,725 | 1,290,346 | 4,531,688 | 5,025,514 | |||||||||||||||||||
| Selling, general and administrative expenses | 162,070 | 131,882 | 504,572 | 463,271 | |||||||||||||||||||
| Asset impairments | 1,098 | 369 | 7,611 | 384 | |||||||||||||||||||
| Interest expense | 13,962 | 17,702 | 61,837 | 71,373 | |||||||||||||||||||
| 1,322,855 | 1,440,299 | 5,105,708 | 5,560,542 | ||||||||||||||||||||
| Earnings from continuing operations before income taxes | 86,277 | 102,706 | 370,778 | 268,460 | |||||||||||||||||||
| Income taxes | 18,495 | 16,826 | 92,476 | 69,681 | |||||||||||||||||||
| Earnings from continuing operations | 67,782 | 85,880 | 278,302 | 198,779 | |||||||||||||||||||
| Earnings (loss) from discontinued operations before income taxes | (34) | 280 | 1,907 | (528) | |||||||||||||||||||
| Income taxes | 125 | 49 | 706 | 158 | |||||||||||||||||||
| Earnings (loss) from discontinued operations | (159) | 231 | 1,201 | (686) | |||||||||||||||||||
| Net earnings | $ | 67,623 | $ | 86,111 | $ | 279,503 | $ | 198,093 | |||||||||||||||
| Basic earnings (loss) per share* | |||||||||||||||||||||||
| Earnings from continuing operations | $ | 0.57 | $ | 0.73 | $ | 2.34 | $ | 1.69 | |||||||||||||||
| Earnings (loss) from discontinued operations | — | — | 0.01 | (0.01) | |||||||||||||||||||
| Net earnings | $ | 0.57 | $ | 0.73 | $ | 2.35 | $ | 1.68 | |||||||||||||||
| Diluted earnings (loss) per share* | |||||||||||||||||||||||
| Earnings from continuing operations | $ | 0.56 | $ | 0.72 | $ | 2.31 | $ | 1.67 | |||||||||||||||
| Earnings (loss) from discontinued operations | — | — | 0.01 | (0.01) | |||||||||||||||||||
| Net earnings | $ | 0.56 | $ | 0.72 | $ | 2.32 | $ | 1.66 | |||||||||||||||
| Cash dividends per share | $ | 0.12 | $ | 0.12 | $ | 0.48 | $ | 0.48 | |||||||||||||||
| Average basic shares outstanding | 119,198,785 | 118,046,800 | 118,921,854 | 117,834,558 | |||||||||||||||||||
| Average diluted shares outstanding | 120,645,931 | 119,392,062 | 120,309,621 | 119,124,628 | |||||||||||||||||||
* Earnings Per Share ("EPS") is calculated independently for each component and may not sum to net earnings EPS due to rounding.
(CMC Year End 2020 - 9)
COMMERCIAL METALS COMPANY AND SUBSIDIARIES CONSOLIDATED BALANCE SHEETS (UNAUDITED) | ||||||||||||||
| August 31, | ||||||||||||||
| (in thousands, except share data) | 2020 | 2019 | ||||||||||||
| Assets | ||||||||||||||
| Current assets: | ||||||||||||||
| Cash and cash equivalents | $ | 542,103 | $ | 192,461 | ||||||||||
Accounts receivable (less allowance for doubtful accounts of $9,597 and $8,403) | 880,728 | 1,016,088 | ||||||||||||
| Inventories | 625,393 | 692,368 | ||||||||||||
| Prepaid and other current assets | 165,879 | 179,088 | ||||||||||||
| Total current assets | 2,214,103 | 2,080,005 | ||||||||||||
| Property, plant and equipment: | ||||||||||||||
| Land | 143,567 | 142,825 | ||||||||||||
| Buildings and improvements | 786,820 | 750,381 | ||||||||||||
| Equipment | 2,364,923 | 2,234,800 | ||||||||||||
| Construction in process | 103,776 | 68,579 | ||||||||||||
| 3,399,086 | 3,196,585 | |||||||||||||
| Less accumulated depreciation and amortization | (1,828,019) | (1,695,614) | ||||||||||||
| Property, plant and equipment, net | 1,571,067 | 1,500,971 | ||||||||||||
| Goodwill | 64,321 | 64,138 | ||||||||||||
| Other noncurrent assets | 232,237 | 113,657 | ||||||||||||
| Total assets | $ | 4,081,728 | $ | 3,758,771 | ||||||||||
| Liabilities and stockholders' equity | ||||||||||||||
| Current liabilities: | ||||||||||||||
| Accounts payable | $ | 266,102 | $ | 288,005 | ||||||||||
| Accrued expenses and other payables | 454,977 | 353,786 | ||||||||||||
| Acquired unfavorable contract backlog | 6,035 | 35,360 | ||||||||||||
| Current maturities of long-term debt and short-term borrowings | 18,149 | 17,439 | ||||||||||||
| Total current liabilities | 745,263 | 694,590 | ||||||||||||
| Deferred income taxes | 130,810 | 79,290 | ||||||||||||
| Other noncurrent liabilities | 250,706 | 133,620 | ||||||||||||
| Long-term debt | 1,065,536 | 1,227,214 | ||||||||||||
| Total liabilities | 2,192,315 | 2,134,714 | ||||||||||||
| Stockholders' equity: | ||||||||||||||
Common stock, par value $0.01 per share; authorized 200,000,000 shares; issued 129,060,664 shares; outstanding 119,220,905 and 117,924,938 shares | 1,290 | 1,290 | ||||||||||||
| Additional paid-in capital | 358,912 | 358,668 | ||||||||||||
| Accumulated other comprehensive loss | (103,764) | (124,126) | ||||||||||||
| Retained earnings | 1,807,826 | 1,585,379 | ||||||||||||
Less treasury stock, 9,839,759 and 11,135,726 shares at cost | (175,063) | (197,350) | ||||||||||||
| Stockholders' equity | 1,889,201 | 1,623,861 | ||||||||||||
| Stockholders' equity attributable to noncontrolling interests | 212 | 196 | ||||||||||||
| Total equity | 1,889,413 | 1,624,057 | ||||||||||||
| Total liabilities and stockholders' equity | $ | 4,081,728 | $ | 3,758,771 | ||||||||||
(CMC Year End 2020 - 10)
| COMMERCIAL METALS COMPANY AND SUBSIDIARIES CONSOLIDATED STATEMENTS OF CASH FLOWS (UNAUDITED) | ||||||||||||||
| Year Ended August 31, | ||||||||||||||
| (in thousands) | 2020 | 2019 | ||||||||||||
| Cash flows from (used by) operating activities: | ||||||||||||||
| Net earnings | $ | 279,503 | $ | 198,093 | ||||||||||
| Adjustments to reconcile net earnings to cash flows from (used by) operating activities: | ||||||||||||||
| Depreciation and amortization | 165,758 | 158,671 | ||||||||||||
| Deferred income taxes and other long-term taxes | 49,580 | 49,523 | ||||||||||||
| Share-based compensation | 31,850 | 25,106 | ||||||||||||
| Amortization of acquired unfavorable contract backlog | (29,367) | (74,784) | ||||||||||||
| Asset impairments | 7,611 | 384 | ||||||||||||
| Net gain on sales of a subsidiary, assets and other | (4,213) | (2,281) | ||||||||||||
| Write-down of inventory and other | 2,065 | 723 | ||||||||||||
| Loss on debt extinguishment | 1,778 | — | ||||||||||||
| Provision for losses on receivables, net | 578 | 388 | ||||||||||||
| Changes in operating assets and liabilities, net of acquisitions | ||||||||||||||
| Accounts receivable | 146,375 | 27,204 | ||||||||||||
| Inventories | 78,903 | 89,664 | ||||||||||||
| Accounts payable, accrued expenses and other payables | 45,718 | (15,315) | ||||||||||||
| Other operating assets and liabilities | 15,065 | (52,851) | ||||||||||||
| Beneficial interest in securitized accounts receivable | — | (367,521) | ||||||||||||
| Net cash flows from (used by) operating activities | 791,204 | 37,004 | ||||||||||||
| Cash flows from (used by) investing activities: | ||||||||||||||
| Capital expenditures | (187,618) | (138,836) | ||||||||||||
| Acquisitions, net of cash acquired | (18,137) | (700,941) | ||||||||||||
| Proceeds from the sale of property, plant and equipment | 11,843 | 3,910 | ||||||||||||
| Proceeds from insurance, sale of discontinued operations and other | 974 | 6,298 | ||||||||||||
| Beneficial interest in securitized accounts receivable | — | 367,521 | ||||||||||||
| Net cash flows from (used by) investing activities | (192,938) | (462,048) | ||||||||||||
| Cash flows from (used by) financing activities: | ||||||||||||||
| Proceeds from issuance of long-term debt | 62,539 | 180,000 | ||||||||||||
| Repayments of long-term debt | (246,523) | (127,704) | ||||||||||||
| Proceeds from accounts receivable programs | 234,482 | 288,896 | ||||||||||||
| Repayments under accounts receivable programs | (237,828) | (296,033) | ||||||||||||
| Cash dividends | (57,056) | (56,537) | ||||||||||||
| Stock issued under incentive and purchase plans, net of forfeitures | (3,420) | (1,876) | ||||||||||||
| Other | 16 | 10 | ||||||||||||
| Net cash flows from (used by) financing activities | (247,790) | (13,244) | ||||||||||||
| Effect of exchange rate changes on cash | 759 | (598) | ||||||||||||
| Increase (decrease) in cash and cash equivalents | 351,235 | (438,886) | ||||||||||||
| Cash, restricted cash and cash equivalents at beginning of year | 193,729 | 632,615 | ||||||||||||
| Cash, restricted cash and cash equivalents at end of year | $ | 544,964 | $ | 193,729 | ||||||||||
| Supplemental information: | ||||||||||||||
| Cash and cash equivalents | $ | 542,103 | $ | 192,461 | ||||||||||
| Restricted cash | $ | 2,861 | $ | 1,268 | ||||||||||
| Total cash, cash equivalents and restricted cash | $ | 544,964 | $ | 193,729 | ||||||||||
(CMC Year End 2020 - 11)
COMMERCIAL METALS COMPANY
NON-GAAP FINANCIAL MEASURES (UNAUDITED)
This press release contains financial measures not derived in accordance with generally accepted accounting principles ("GAAP"). Reconciliations to the most comparable GAAP measures are provided below.
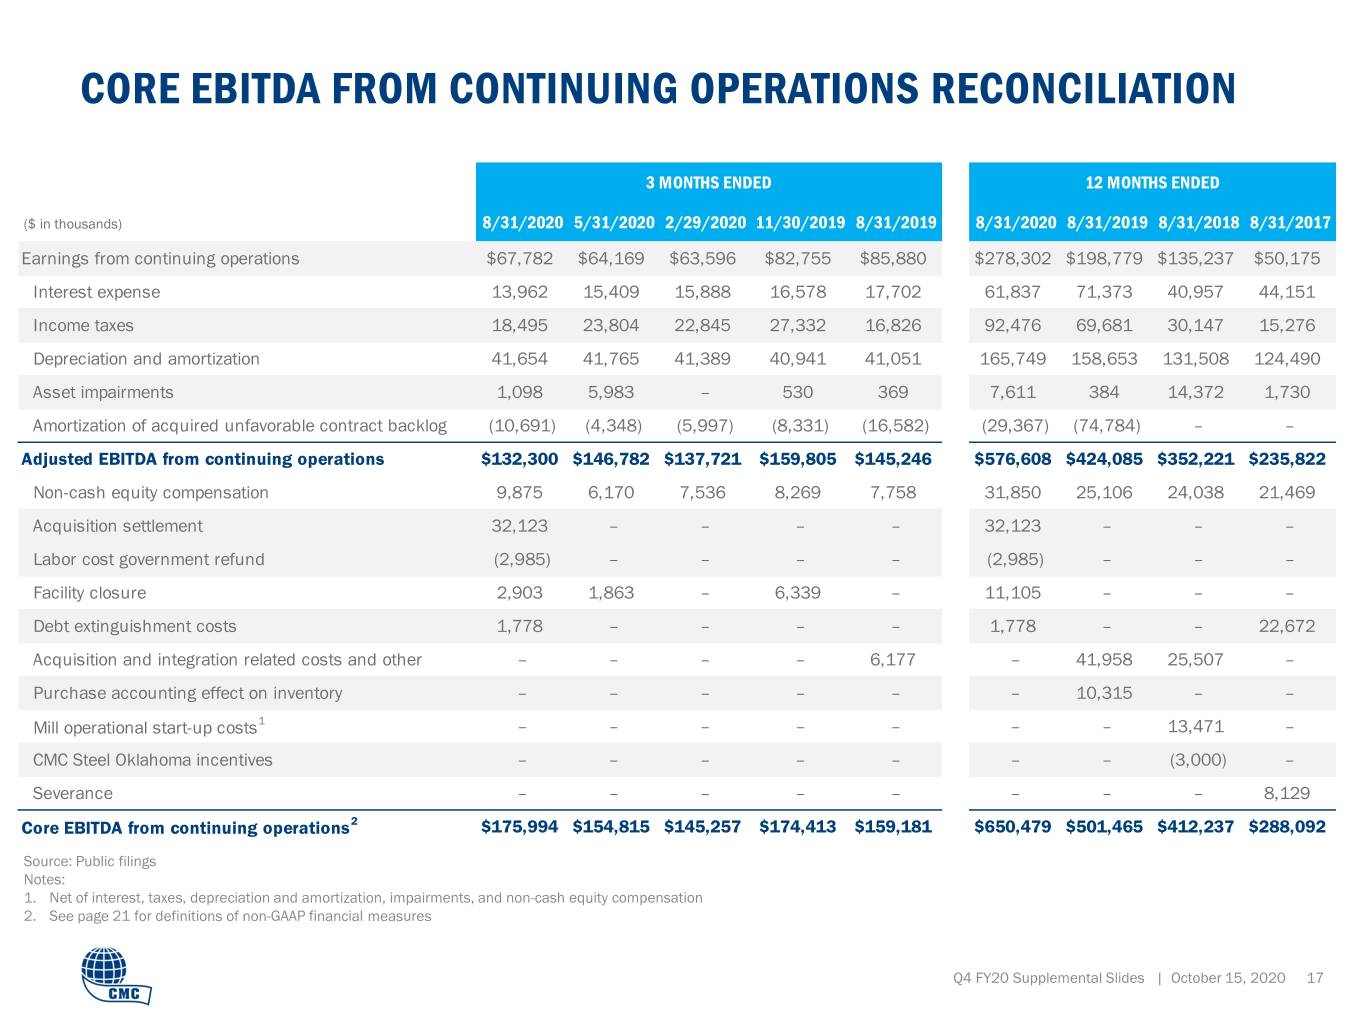
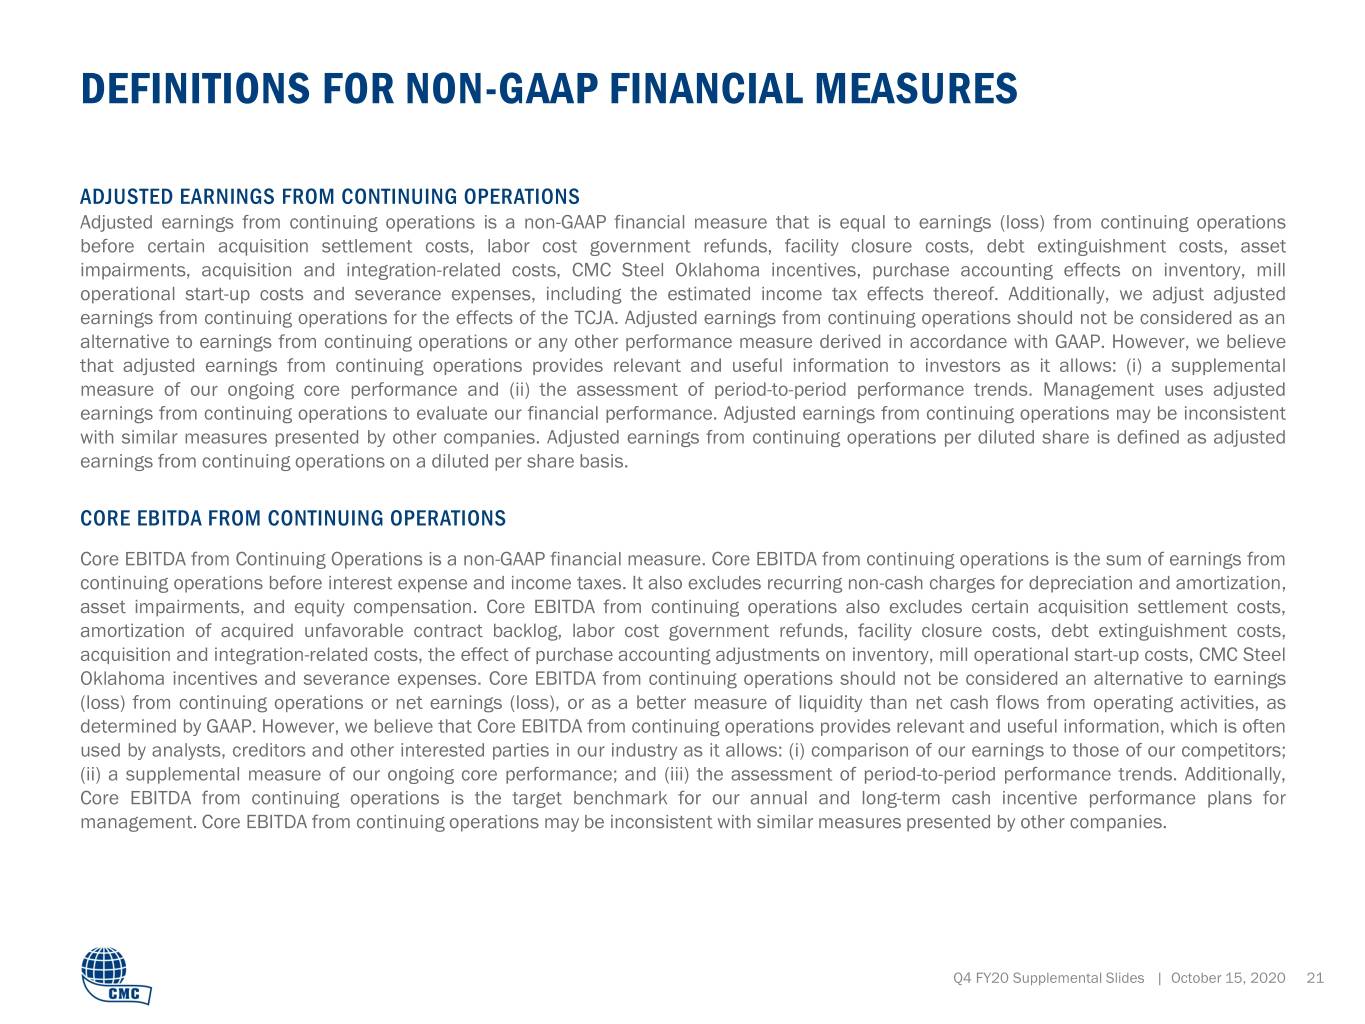
Core EBITDA from Continuing Operations is a non-GAAP financial measure. Core EBITDA from continuing operations is the sum of earnings from continuing operations before interest expense and income taxes. It also excludes recurring non-cash charges for depreciation and amortization, asset impairments, and equity compensation. Core EBITDA from continuing operations also excludes certain acquisition settlement costs, amortization of acquired unfavorable contract backlog, labor cost government refunds, facility closure costs, debt extinguishment costs, acquisition and integration-related costs and the effect of purchase accounting adjustments on inventory. Core EBITDA from continuing operations should not be considered an alternative to earnings (loss) from continuing operations or net earnings (loss), or as a better measure of liquidity than net cash flows from operating activities, as determined by GAAP. However, we believe that Core EBITDA from continuing operations provides relevant and useful information, which is often used by analysts, creditors and other interested parties in our industry as it allows: (i) comparison of our earnings to those of our competitors; (ii) a supplemental measure of our ongoing core performance; and (iii) the assessment of period-to-period performance trends. Additionally, Core EBITDA from continuing operations is the target benchmark for our annual and long-term cash incentive performance plans for management. Core EBITDA from continuing operations may be inconsistent with similar measures presented by other companies.
A reconciliation of earnings from continuing operations before income taxes to Core EBITDA from continuing operations is provided below:
| Three Months Ended | Fiscal Year Ended | ||||||||||||||||||||||||||||||||||||||||
| (in thousands) | 8/31/2020 | 5/31/2020 | 2/29/2020 | 11/30/2019 | 8/31/2019 | 8/31/2020 | 8/31/2019 | ||||||||||||||||||||||||||||||||||
| Earnings from continuing operations | $ | 67,782 | $ | 64,169 | $ | 63,596 | $ | 82,755 | $ | 85,880 | $ | 278,302 | $ | 198,779 | |||||||||||||||||||||||||||
| Interest expense | 13,962 | 15,409 | 15,888 | 16,578 | 17,702 | 61,837 | 71,373 | ||||||||||||||||||||||||||||||||||
| Income taxes | 18,495 | 23,804 | 22,845 | 27,332 | 16,826 | 92,476 | 69,681 | ||||||||||||||||||||||||||||||||||
| Depreciation and amortization | 41,654 | 41,765 | 41,389 | 40,941 | 41,051 | 165,749 | 158,653 | ||||||||||||||||||||||||||||||||||
| Asset impairments | 1,098 | 5,983 | — | 530 | 369 | 7,611 | 384 | ||||||||||||||||||||||||||||||||||
| Non-cash equity compensation | 9,875 | 6,170 | 7,536 | 8,269 | 7,758 | 31,850 | 25,106 | ||||||||||||||||||||||||||||||||||
| Acquisition settlement | 32,123 | — | — | — | — | 32,123 | — | ||||||||||||||||||||||||||||||||||
| Amortization of acquired unfavorable contract backlog | (10,691) | (4,348) | (5,997) | (8,331) | (16,582) | (29,367) | (74,784) | ||||||||||||||||||||||||||||||||||
| Labor cost government refund | (2,985) | — | — | — | — | (2,985) | — | ||||||||||||||||||||||||||||||||||
| Facility closure | 2,903 | 1,863 | — | 6,339 | — | 11,105 | — | ||||||||||||||||||||||||||||||||||
| Debt extinguishment costs | 1,778 | — | — | — | — | 1,778 | — | ||||||||||||||||||||||||||||||||||
| Acquisition and integration related costs and other | — | — | — | — | 6,177 | — | 41,958 | ||||||||||||||||||||||||||||||||||
| Purchase accounting effect on inventory | — | — | — | — | — | — | 10,315 | ||||||||||||||||||||||||||||||||||
| Core EBITDA from continuing operations | $ | 175,994 | $ | 154,815 | $ | 145,257 | $ | 174,413 | $ | 159,181 | $ | 650,479 | $ | 501,465 | |||||||||||||||||||||||||||
(CMC Year End 2020 - 12)
Adjusted earnings from continuing operations is a non-GAAP financial measure that is equal to earnings (loss) from continuing operations before certain acquisition settlement costs, labor cost government refunds, facility closure costs, debt extinguishment costs, asset impairments, acquisition and integration-related costs and purchase accounting effects on inventory, including the estimated income tax effects thereof. Additionally, we adjust adjusted earnings from continuing operations for the effects of the TCJA. Adjusted earnings from continuing operations should not be considered as an alternative to earnings from continuing operations or any other performance measure derived in accordance with GAAP. However, we believe that adjusted earnings from continuing operations provides relevant and useful information to investors as it allows: (i) a supplemental measure of our ongoing core performance and (ii) the assessment of period-to-period performance trends. Management uses adjusted earnings from continuing operations to evaluate our financial performance. Adjusted earnings from continuing operations may be inconsistent with similar measures presented by other companies. Adjusted earnings from continuing operations per diluted share is defined as adjusted earnings from continuing operations on a diluted per share basis.
A reconciliation of earnings from continuing operations to adjusted earnings from continuing operations is provided below:
| Three Months Ended | Fiscal Year Ended | ||||||||||||||||||||||||||||||||||||||||
| (in thousands) | 8/31/2020 | 5/31/2020 | 2/29/2020 | 11/30/2019 | 8/31/2019 | 8/31/2020 | 8/31/2019 | ||||||||||||||||||||||||||||||||||
| Earnings from continuing operations | $ | 67,782 | $ | 64,169 | $ | 63,596 | $ | 82,755 | $ | 85,880 | $ | 278,302 | $ | 198,779 | |||||||||||||||||||||||||||
| Acquisition settlement | 32,123 | — | — | — | — | 32,123 | — | ||||||||||||||||||||||||||||||||||
| Labor cost government refund | (2,985) | — | — | — | — | (2,985) | — | ||||||||||||||||||||||||||||||||||
| Facility closure | 2,903 | 1,863 | — | 6,339 | — | 11,105 | — | ||||||||||||||||||||||||||||||||||
| Debt extinguishment costs | 1,778 | — | — | — | — | 1,778 | — | ||||||||||||||||||||||||||||||||||
| Asset impairments | 1,098 | 5,983 | — | — | — | 7,081 | — | ||||||||||||||||||||||||||||||||||
| Acquisition and integration related costs and other | — | — | — | — | 6,177 | — | 41,958 | ||||||||||||||||||||||||||||||||||
| Purchase accounting effect on inventory | — | — | — | — | — | — | 10,315 | ||||||||||||||||||||||||||||||||||
| Total adjustments (pre-tax) | $ | 34,917 | $ | 7,846 | $ | — | $ | 6,339 | $ | 6,177 | $ | 49,102 | $ | 52,273 | |||||||||||||||||||||||||||
| Tax Impact | |||||||||||||||||||||||||||||||||||||||||
| TCJA impact | $ | — | $ | — | $ | — | $ | — | $ | — | $ | — | $ | 7,550 | |||||||||||||||||||||||||||
| Related tax effects on adjustments | (7,392) | (1,648) | — | (1,331) | (1,297) | (10,371) | (10,977) | ||||||||||||||||||||||||||||||||||
| Total tax impact | (7,392) | (1,648) | — | (1,331) | (1,297) | (10,371) | (3,427) | ||||||||||||||||||||||||||||||||||
| Adjusted earnings from continuing operations | $ | 95,307 | $ | 70,367 | $ | 63,596 | $ | 87,763 | $ | 90,760 | $ | 317,033 | $ | 247,625 | |||||||||||||||||||||||||||
| Adjusted earnings from continuing operations per diluted share | $ | 0.79 | $ | 0.59 | $ | 0.53 | $ | 0.73 | $ | 0.76 | $ | 2.64 | $ | 2.08 | |||||||||||||||||||||||||||
Media Contact:
Susan Gerber
214.689.4300