cmc-20211014
0000022444FALSE00000224442021-10-142021-10-14

UNITED STATES
SECURITIES AND EXCHANGE COMMISSION
WASHINGTON, DC 20549
FORM 8-K
CURRENT REPORT PURSUANT
TO SECTION 13 OR 15(d) OF THE
SECURITIES EXCHANGE ACT OF 1934
Date of report (Date of earliest event reported): October 14, 2021
Commercial Metals Company
(Exact Name of Registrant as Specified in Charter)

Delaware
(State or Other Jurisdiction of Incorporation)
1-430475-0725338
(Commission File Number)
(IRS Employer Identification No.)
6565 N. MacArthur Blvd.
Irving, Texas
75039
(Address of Principal Executive Offices)(Zip Code)

(214) 689-4300
(Registrant’s Telephone Number, Including Area Code)

Not Applicable
(Former Name or Former Address, if Changed Since Last Report)

Check the appropriate box below if the Form 8-K filing is intended to simultaneously satisfy the filing obligation of the registrant under any of the following provisions (see General Instruction A.2. below):
Written communications pursuant to Rule 425 under the Securities Act (17 CFR 230.425)
Soliciting material pursuant to Rule 14a-12 under the Exchange Act (17 CFR 240.14a-12)
Pre-commencement communications pursuant to Rule 14d-2(b) under the Exchange Act (17 CFR 240.14d-2(b))
Pre-commencement communications pursuant to Rule 13e-4(c) under the Exchange Act (17 CFR 240.13e-4(c))
Securities registered pursuant to Section 12(b) of the Act:
Title of Each ClassTrading Symbol(s)Name of Each Exchange on Which Registered
Common Stock, $0.01 par valueCMCNew York Stock Exchange

Indicate by check mark whether the registrant is an emerging growth company as defined in Rule 405 of the Securities Act of 1933 (§230.405 of this chapter) or Rule 12b-2 of the Securities Exchange Act of 1934 (§240.12b-2 of this chapter).
Emerging growth company

If an emerging growth company, indicate by check mark if the registrant has elected not to use the extended transition period for complying with any new or revised financial accounting standards provided pursuant to Section 13(a) of the Exchange Act. ¨


Item 2.02 Results of Operations and Financial Condition.

On October 14, 2021, Commercial Metals Company (the “Company”) issued a press release announcing its financial results for the fourth quarter and fiscal year ended August 31, 2021. A copy of the press release is attached hereto as Exhibit 99.1. The press release is incorporated by reference into this Item 2.02, and the foregoing description of the press release is qualified in its entirety by reference to Exhibit 99.1.

The information in this Item 2.02 of Form 8-K, including Exhibit 99.1, shall not be deemed “filed” for purposes of Section 18 of the Securities Exchange Act of 1934, as amended (the “Exchange Act”), or otherwise subject to liabilities under that section and is not incorporated by reference into any filing of the Company under the Securities Act of 1933, as amended, or the Exchange Act, whether made before or after the date hereof, regardless of any general incorporation language in such filing.

Item 7.01 Regulation FD Disclosure.

On October 14, 2021, the Company made available on its website a financial presentation regarding its financial results for the fourth quarter and fiscal year ended August 31, 2021. A copy of the financial presentation is attached hereto as Exhibit 99.2. The financial presentation is incorporated by reference into this Item 7.01, and the foregoing description of the financial presentation is qualified in its entirety by reference to Exhibit 99.2.

The information in this Item 7.01 of Form 8-K, including Exhibit 99.2, shall not be deemed “filed” for purposes of Section 18 of the Exchange Act, or otherwise subject to liabilities under that section and is not incorporated by reference into any filing of the Company under the Securities Act of 1933, as amended, or the Exchange Act, whether made before or after the date hereof, regardless of any general incorporation language in such filing.


Item 9.01 Financial Statements and Exhibits.
(d)   Exhibits
The following exhibits are being furnished as part of this Current Report on Form 8-K.
99.1
99.2
104Cover Page Interactive Data File (embedded within the Inline XBRL document)


SIGNATURES

Pursuant to the requirements of the Securities Exchange Act of 1934, the registrant has duly caused this report to be signed on its behalf by the undersigned hereunto duly authorized.

 
COMMERCIAL METALS COMPANY
  
Date: October 14, 2021 By: /s/ Paul J. Lawrence
 Name: Paul J. Lawrence
  Title: Vice President and Chief Financial Officer


Exhibit No. 99.1
News Release newsreleaselogoa01a04a07a.jpg


COMMERCIAL METALS COMPANY REPORTS RECORD FOURTH QUARTER AND FULL YEAR FISCAL 2021 RESULTS

Achieved record quarterly Earnings from Continuing Operations of $152.3 million, or $1.24 per diluted share; and record Core EBITDA from Continuing Operations of $255.9 million
Reported record full year Core EBITDA from Continuing Operations, and highest ever North America and European segment-level Adjusted EBITDA
Successfully commissioned third rolling line in Europe; contributed meaningfully to Europe segment results
Subsequent to quarter end, CMC reached an agreement to sell its Rancho Cucamonga site, with expected gross proceeds of approximately $300 million
In a separate release yesterday, CMC announced a new $350 million share repurchase program and a 17% increase to its quarterly dividend

Irving, TX - October 14, 2021 - Commercial Metals Company (NYSE: CMC) today announced financial results for its fiscal fourth quarter ended August 31, 2021. Earnings from continuing operations were $152.3 million, or $1.24 per diluted share, on net sales of $2.0 billion, compared to prior year earnings from continuing operations of $67.8 million, or $0.56 per diluted share, on net sales of $1.4 billion. For the full year, earnings from continuing operations were $412.9 million, or $3.38 per diluted share, compared to $278.3 million, or $2.31 per diluted share in the prior year.

During the fourth quarter of fiscal 2021, the Company recorded a net after-tax charge of $1.9 million related to the impairment of recycling assets. Excluding this item, fourth quarter adjusted earnings from continuing operations were $154.2 million, or $1.26 per diluted share, compared to adjusted earnings from continuing operations of $95.3 million, or $0.79 per diluted share, in the prior year period. "Adjusted EBITDA from continuing operations", "core EBITDA from continuing operations", "adjusted earnings from continuing operations" and "adjusted earnings from continuing operations per diluted share" are non-GAAP financial measures. Details, including a reconciliation of each such non-GAAP financial measure, to the most directly comparable measure, prepared and presented in accordance with GAAP can be found in the financial tables that follow.

Barbara R. Smith, Chairman of the Board, President and Chief Executive Officer, commented, "CMC’s performance during fiscal 2021 was exceptional. Our financial results once again demonstrate CMC's significantly enhanced earnings capabilities following several years of methodical strategic transformation. Yesterday, we announced our first dividend increase in over a decade and a sizeable new share repurchase program, reflecting the board’s confidence in the Company's enhanced financial position and future prospects. We have built a strong


(CMC Fourth Quarter Fiscal 2021 - 2)

operating platform that will allow us to continue pursuing value accretive growth, while returning a meaningful portion of free cash flow to investors and maintaining a high-quality balance sheet.”

Ms. Smith continued, "Looking at the quarter, I am extremely proud of the CMC team's execution on multiple fronts. Commercially and operationally, we responded to robust market demand with record shipment and production levels at several of our steel mills. This heightened activity did not detract from our ability to continue building for the future. Our team in Europe successfully ramped up CMC's new rolling line, and we made meaningful progress at the future Arizona 2 micro mill site in North America. In addition, on September 29th we reached an agreement to sell our Rancho Cucamonga site for an expected $300 million, which will be reinvested directly into Arizona 2. Importantly, we also maintained focus on keeping our employees safe, with several operations achieving record low incident rates during the year.”

The Company's liquidity position as of August 31, 2021 remained solid, with cash and cash equivalents of $497.7 million, and availability of $668.2 million under the Company's credit and accounts receivable facilities.

On October 13, 2021, the board of directors declared a quarterly dividend of $0.14 per share of CMC common stock payable to stockholders of record on October 27, 2021. This represents a 17% increase over the previous dividend. The dividend will be paid on November 10, 2021, and marks 228 consecutive quarterly dividend payments by the Company.

Business Segments - Fiscal Fourth Quarter 2021 Review
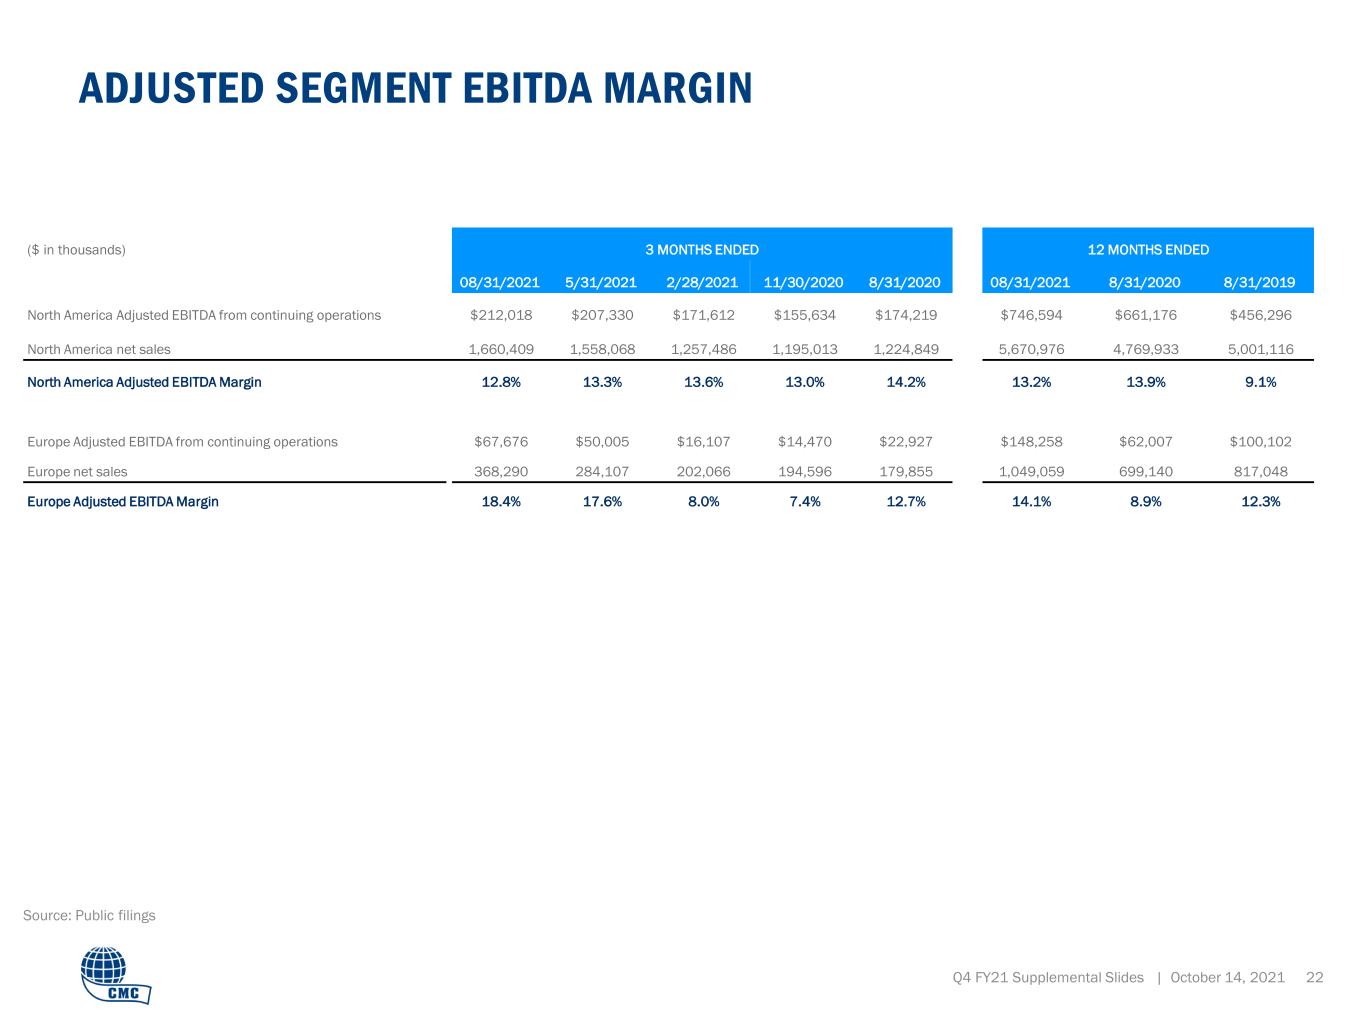
The North America segment generated record adjusted EBITDA of $212.0 million for the fourth quarter of fiscal 2021, an increase of 22% compared to $174.2 million in the prior year period. This improvement was driven by increased margins across multiple products lines, coupled with higher shipments of steel products and raw materials. These positive factors were partially offset by a year-over-year increase in controllable costs per ton of finished steel shipped, due largely to inflationary pressures for freight and steelmaking consumables.

Shipment volumes of finished steel, which include steel products and downstream products, increased by 2% from the prior year fourth quarter. Demand for rebar from the mills remained relatively steady, but shipments declined modestly from the prior year due to a shift in mix toward merchant bar and wire rod. Shipments of merchant and other products increased by 29% from the prior year, driven by the broad reopening of the U.S. economy.

Margins over scrap cost on steel products increased $103 per ton from the prior year period and $41 per ton compared to the prior quarter. Market conditions were favorable for each of CMC's key products, leading to mill volume growth of 5% and an increase of $300 per ton in average selling price compared to the fourth quarter of fiscal 2020. Margin over scrap cost on downstream products declined compared to a year ago, driven by fulfillment


(CMC Fourth Quarter Fiscal 2021 - 3)

of fabrication contracts that were booked prior to the fiscal 2021 increase in scrap costs. Future pricing indicators on new work entering the backlog were positive during the quarter, as average price levels for bids and new awards increased significantly from the prior year quarter.

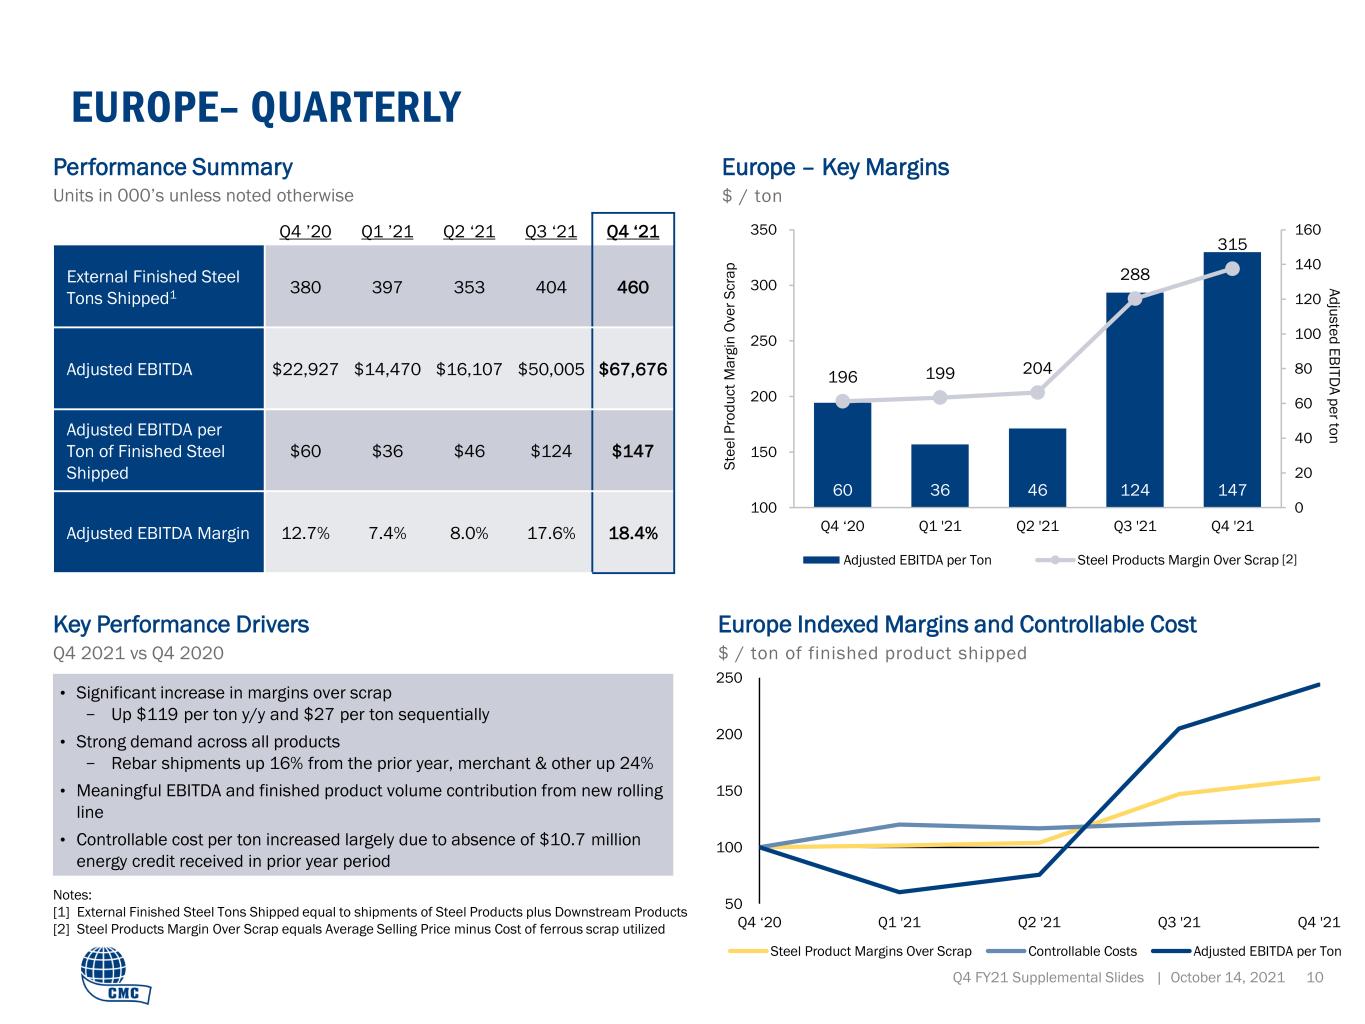
The Europe segment reported record adjusted EBITDA of $67.7 million for the fourth quarter of fiscal 2021, up 195% compared to adjusted EBITDA of $22.9 million for the prior year quarter. The improvement was driven by a significant expansion in margin over scrap as well as volume growth, as demand for steel products from both the construction and industrial end markets were solid during the quarter. Resilient construction activity supported a 16% increase in rebar shipments compared to a year ago, while the start-up of the third rolling line and the continuing manufacturing recovery in Poland and Central Europe drove 24% growth in volumes of merchant and other steel products. Average selling price increased by $317 per ton compared to the prior year quarter, and $99 per ton sequentially.

Outlook
Ms. Smith said, "Based on our current view of the marketplace, we anticipate our strong operating and financial performance will continue in fiscal 2022. Volumes should remain solid, supported by a replenished construction backlog in North America, as well as broad strength across key end markets in both North America and Europe."

"In the first quarter of fiscal 2022, we expect finished steel volumes to follow typical seasonal patterns, which have historically declined modestly from our fourth quarter levels. We expect first quarter margins to remain consistent with the historical high levels earned in the fourth quarter,” Ms. Smith added.

Conference Call
CMC invites you to listen to a live broadcast of its fourth quarter of fiscal 2021 conference call today, Thursday, October 14, 2021, at 11:00 a.m. ET. Barbara R. Smith, Chairman of the Board, President, and Chief Executive Officer, and Paul Lawrence, Vice President and Chief Financial Officer, will host the call. The call is accessible via our website at www.cmc.com. In the event you are unable to listen to the live broadcast, the call will be archived and available for replay on our website on the next business day. Financial and statistical information presented in the broadcast are located on CMC's website under "Investors."

About Commercial Metals Company
Commercial Metals Company and its subsidiaries manufacture, recycle and fabricate steel and metal products and provide related materials and services through a network including seven electric arc furnace ("EAF") mini mills, two EAF micro mills, one rerolling mill, steel fabrication and processing plants, construction-related product warehouses, and metal recycling facilities in the U.S. and Poland.


(CMC Fourth Quarter Fiscal 2021 - 4)

Forward-Looking Statements
This news release contains forward-looking statements within the meaning of the federal securities laws with respect to general economic conditions, key macro-economic drivers that impact our business, the effects of ongoing trade actions, the effects of continued pressure on the liquidity of our customers, potential synergies and organic growth provided by acquisitions and strategic investments, demand for our products, metal margins, the effect of COVID-19 and related governmental and economic responses thereto, the ability to operate our steel mills at full capacity, future availability and cost of supplies of raw materials and energy for our operations, share repurchases, legal proceedings, the undistributed earnings of our non-U.S. subsidiaries, U.S. non-residential construction activity, international trade, capital expenditures, our liquidity and our ability to satisfy future liquidity requirements, estimated contractual obligations and our expectations or beliefs concerning future events. The statements in this release that are not historical statements, are forward-looking statements. These forward-looking statements can generally be identified by phrases such as we or our management "expects," "anticipates," "believes," "estimates," "future," "intends," "may," "plans to," "ought," "could," "will," "should," "likely," "appears," "projects," "forecasts," "outlook" or other similar words or phrases, as well as by discussions of strategy, plans, or intentions.

Our forward-looking statements are based on management’s expectations and beliefs as of the time this news release was prepared. Although we believe that our expectations are reasonable, we can give no assurance that these expectations will prove to have been correct, and actual results may vary materially. Except as required by law, we undertake no obligation to update, amend or clarify any forward-looking statements to reflect changed assumptions, the occurrence of anticipated or unanticipated events, new information or circumstances or any other changes. Important factors that could cause actual results to differ materially from our expectations include those described in Part I, Item 1A, "Risk Factors" of our annual report on Form 10-K for the fiscal year ended August 31, 2020, and Part II, Item 1A, "Risk Factors" of our quarterly report on Form 10-Q for the quarter ended February 28, 2021, as well as the following: changes in economic conditions which affect demand for our products or construction activity generally, and the impact of such changes on the highly cyclical steel industry; rapid and significant changes in the price of metals, potentially impairing our inventory values due to declines in commodity prices or reducing the profitability of our downstream contracts due to rising commodity pricing; impacts from COVID-19 on the economy, demand for our products, global supply chain and on our operations, including the responses of governmental authorities to contain COVID-19 and the impact of various COVID-19 vaccines; excess capacity in our industry, particularly in China, and product availability from competing steel mills and other steel suppliers including import quantities and pricing; compliance with and changes in existing and future laws, regulations and other legal requirements and judicial decisions that govern our business, including increased environmental regulations associated with climate change and greenhouse gas emissions; involvement in various environmental matters that may result in fines, penalties or judgments; potential limitations in our or our customers' abilities to access credit and non-compliance by our customers; activity in repurchasing shares of our common stock under our repurchase program; financial covenants and restrictions on the operation of our business contained in agreements governing our debt; our inability to close the sale of our Rancho Cucamonga property, including if the buyer were to terminate the


(CMC Fourth Quarter Fiscal 2021 - 5)

purchase agreement during its 60 day due diligence review period; our ability to successfully identify, consummate and integrate acquisitions, and the effects that acquisitions may have on our financial leverage; risks associated with acquisitions generally, such as the inability to obtain, or delays in obtaining, required approvals under applicable antitrust legislation and other regulatory and third party consents and approvals; operating and startup risks, as well as market risks associated with the commissioning of new projects could prevent us from realizing anticipated benefits and could result in a loss of all or a substantial part of our investments; lower than expected future levels of revenues and higher than expected future costs; failure or inability to implement growth strategies in a timely manner; impact of goodwill impairment charges; impact of long-lived asset impairment charges; currency fluctuations; global factors, such as trade measures, military conflicts and political uncertainties, including the impact of the Biden administration on current trade regulations, such as Section 232 trade tariffs and quotas, tax legislation and other regulations which might adversely impact our business; availability and pricing of electricity, electrodes and natural gas for mill operations; ability to hire and retain key executives and other employees; competition from other materials or from competitors that have a lower cost structure or access to greater financial resources; information technology interruptions and breaches in security; ability to make necessary capital expenditures; availability and pricing of raw materials and other items over which we exert little influence, including scrap metal, energy and insurance; unexpected equipment failures; losses or limited potential gains due to hedging transactions; litigation claims and settlements, court decisions, regulatory rulings and legal compliance risks; risk of injury or death to employees, customers or other visitors to our operations; and civil unrest, protests and riots.


(CMC Fourth Quarter Fiscal 2021 - 6)

COMMERCIAL METALS COMPANY
FINANCIAL & OPERATING STATISTICS (UNAUDITED)
 Three Months EndedYear Ended
(in thousands, except per ton amounts)8/31/20215/31/20212/28/202111/30/20208/31/20208/31/20218/31/2020
North America
Net sales$1,660,409 $1,558,068 $1,257,486 $1,195,013 $1,224,849 $5,670,976 $4,769,933 
Adjusted EBITDA212,018 207,330 171,612 155,634 174,219 746,594 661,176 
External tons shipped
Raw materials331 368 302 330 300 1,331 1,229 
Rebar469 500 472 486 498 1,927 1,897 
Merchant and other302 289 268 264 234 1,123 919 
Steel products771 789 740 750 732 3,050 2,816 
Downstream products415 408 343 371 429 1,537 1,635 
Average selling price per ton
Raw materials$1,069 $949 $846 $630 $605 $877 $567 
Steel products900 794 695 612 600 752 618 
Downstream products1,014 963 929 934 970 961 975 
Cost of raw materials per ton$805 $697 $629 $458 $427 $650 $402 
Cost of ferrous scrap utilized per ton434 369 344 266 237 355 238 
Steel products metal margin per ton$466 $425 $351 $346 $363 $397 $380 
Europe
Net sales$368,290 $284,107 $202,066 $194,596 $179,855 $1,049,059 $699,140 
Adjusted EBITDA67,676 50,005 16,107 14,470 22,927 148,258 62,007 
External tons shipped
Rebar174 141 78 128 150 521 539 
Merchant and other286 263 275 269 230 1,093 933 
Steel products460 404 353 397 380 1,614 1,472 
Average selling price per ton
Steel products$763 $664 $532 $461 $446 $612 $448 
Cost of ferrous scrap utilized per ton$448 $376 $328 $262 $250 $357 $246 
Steel products metal margin per ton$315 $288 $204 $199 $196 $255 $202 


(CMC Fourth Quarter Fiscal 2021 - 7)

COMMERCIAL METALS COMPANY
BUSINESS SEGMENTS (UNAUDITED)
(in thousands)Three Months EndedYear Ended
Net sales8/31/20215/31/20212/28/202111/30/20208/31/20208/31/20218/31/2020
North America$1,660,409 $1,558,068 $1,257,486 $1,195,013 $1,224,849 $5,670,976 $4,769,933 
Europe368,290 284,107 202,066 194,596 179,855 1,049,059 699,140 
Corporate and Other1,947 2,866 2,718 2,194 4,428 9,725 7,413 
Total net sales$2,030,646 $1,845,041 $1,462,270 $1,391,803 $1,409,132 $6,729,760 $5,476,486 
Adjusted EBITDA from continuing operations
North America$212,018 $207,330 $171,612 $155,634 $174,219 $746,594 $661,176 
Europe67,676 50,005 16,107 14,470 22,927 148,258 62,007 
Corporate and Other(31,897)(36,214)(45,986)(26,471)(64,846)(140,568)(146,575)


(CMC Fourth Quarter Fiscal 2021 - 8)

COMMERCIAL METALS COMPANY
CONSOLIDATED STATEMENTS OF EARNINGS (UNAUDITED)
 Three Months Ended August 31,Year Ended August 31,
(in thousands, except share data)2021202020212020
Net sales$2,030,646 $1,409,132 $6,729,760 $5,476,486 
Costs and expenses: 
Cost of goods sold1,686,973 1,145,725 5,623,903 4,531,688 
Selling, general and administrative expenses136,818 160,292 496,310 502,794 
Interest expense11,659 13,962 51,904 61,837 
Loss on debt extinguishment— 1,778 16,841 1,778 
Asset impairments2,439 1,098 6,784 7,611 
1,837,889 1,322,855 6,195,742 5,105,708 
Earnings from continuing operations before income taxes192,757 86,277 534,018 370,778 
Income taxes40,444 18,495 121,153 92,476 
Earnings from continuing operations152,313 67,782 412,865 278,302 
Earnings (loss) from discontinued operations before income taxes— (34)— 1,907 
Income taxes— 125 — 706 
Earnings (loss) from discontinued operations— (159)— 1,201 
Net earnings$152,313 $67,623 $412,865 $279,503 
Basic earnings per share
Earnings from continuing operations$1.26 $0.57 $3.43 $2.34 
Earnings from discontinued operations— — — 0.01 
Net earnings$1.26 $0.57 $3.43 $2.35 
Diluted earnings per share
Earnings from continuing operations$1.24 $0.56 $3.38 $2.31 
Earnings from discontinued operations— — — 0.01 
Net earnings$1.24 $0.56 $3.38 $2.32 
Cash dividends per share$0.12 $0.12 $0.48 $0.48 
Average basic shares outstanding120,625,533 119,198,785 120,338,357 118,921,854 
Average diluted shares outstanding122,376,099 120,645,931 121,983,497 120,309,621 


(CMC Fourth Quarter Fiscal 2021 - 9)

COMMERCIAL METALS COMPANY AND SUBSIDIARIES
CONSOLIDATED BALANCE SHEETS (UNAUDITED)
(in thousands, except share data)August 31, 2021August 31, 2020
Assets
Current assets:
Cash and cash equivalents$497,745 $542,103 
Accounts receivable (less allowance for doubtful accounts of $5,553 and $9,597)
1,105,580 880,728 
Inventories935,387 625,393 
Prepaid and other current assets173,033 165,879 
Assets held for sale25,083 — 
Total current assets2,736,828 2,214,103 
Property, plant and equipment:
Land123,135 143,567 
Buildings and improvements792,915 786,820 
Equipment2,435,541 2,364,923 
Construction in process147,166 103,776 
3,498,757 3,399,086 
Less accumulated depreciation and amortization(1,932,634)(1,828,019)
Property, plant and equipment, net1,566,123 1,571,067 
Goodwill66,137 64,321 
Other noncurrent assets269,583 232,237 
Total assets$4,638,671 $4,081,728 
Liabilities and stockholders' equity
Current liabilities:
Accounts payable$450,723 $266,102 
Accrued expenses and other payables475,384 454,977 
Acquired unfavorable contract backlog— 6,035 
Borrowings under accounts receivable facilities26,560 — 
Current maturities of long-term debt27,806 18,149 
Total current liabilities980,473 745,263 
Deferred income taxes112,067 130,810 
Other noncurrent liabilities235,607 250,706 
Long-term debt1,015,415 1,065,536 
Total liabilities2,343,562 2,192,315 
Stockholders' equity:
Common stock, par value $0.01 per share; authorized 200,000,000 shares; issued 129,060,664 shares; outstanding 120,586,589 and 119,220,905 shares
1,290 1,290 
Additional paid-in capital368,064 358,912 
Accumulated other comprehensive loss(84,820)(103,764)
Retained earnings2,162,925 1,807,826 
Less treasury stock, 8,474,075 and 9,839,759 shares at cost
(152,582)(175,063)
Stockholders' equity2,294,877 1,889,201 
Stockholders' equity attributable to noncontrolling interests232 212 
Total stockholders' equity2,295,109 1,889,413 
Total liabilities and stockholders' equity$4,638,671 $4,081,728 


(CMC Fourth Quarter Fiscal 2021 - 10)

COMMERCIAL METALS COMPANY AND SUBSIDIARIES
CONSOLIDATED STATEMENTS OF CASH FLOWS (UNAUDITED)
 Year Ended August 31,
(in thousands)20212020
Cash flows from (used by) operating activities:
Net earnings$412,865 $279,503 
Adjustments to reconcile net earnings to cash flows from (used by) operating activities:
Depreciation and amortization167,613 165,758 
Stock-based compensation43,677 31,850 
Deferred income taxes and other long-term taxes(39,873)49,580 
Loss on debt extinguishment16,841 1,778 
Net gain on disposals of subsidiaries, assets and other
(8,807)(4,213)
Asset impairments6,784 7,611 
Amortization of acquired unfavorable contract backlog(6,035)(29,367)
Other541 2,643 
Changes in operating assets and liabilities, net of acquisitions:
Accounts receivable(228,026)146,375 
Inventories(316,316)78,903 
Accounts payable, accrued expenses and other payables194,801 45,718 
Other operating assets and liabilities(15,591)15,065 
Net cash flows from operating activities
228,474 791,204 
Cash flows from (used by) investing activities:
Capital expenditures(184,165)(187,618)
Proceeds from the sale of property, plant and equipment and other26,424 11,843 
Acquisitions, net of cash acquired(1,888)(18,137)
Other(2,500)974 
Net cash flows used by investing activities
(162,129)(192,938)
Cash flows from (used by) financing activities:
Proceeds from issuance of long-term debt, net309,279 62,539 
Repayments of long-term debt(368,527)(246,523)
Proceeds from accounts receivable facilities296,586 234,482 
Repayments under accounts receivable facilities(269,858)(237,828)
Dividends(57,766)(57,056)
Stock issued under incentive and purchase plans, net of forfeitures(3,166)(3,420)
Debt extinguishment costs(13,128)— 
Debt issuance costs(2,830)— 
Contribution from noncontrolling interest20 16 
Net cash flows used by financing activities
(109,390)(247,790)
Effect of exchange rate changes on cash(790)759 
Increase (decrease) in cash and cash equivalents
(43,835)351,235 
Cash, restricted cash and cash equivalents at beginning of year544,964 193,729 
Cash, restricted cash and cash equivalents at end of year$501,129 $544,964 
Supplemental information:
Cash and cash equivalents$497,745 $542,103 
Restricted cash3,384 2,861 
Total cash, restricted cash and cash equivalents$501,129 $544,964 


(CMC Fourth Quarter Fiscal 2021 - 11)

COMMERCIAL METALS COMPANY
NON-GAAP FINANCIAL MEASURES (UNAUDITED)

This press release contains financial measures not derived in accordance with U.S. generally accepted accounting principles ("GAAP"). Reconciliations to the most comparable GAAP measure are provided below.

Adjusted EBITDA from continuing operations, core EBITDA from continuing operations, and adjusted earnings from continuing operations are non-GAAP financial measures. Adjusted earnings from continuing operations per diluted share is defined as adjusted earnings from continuing operations on a diluted per share basis.

Non-GAAP financial measures should be viewed in addition to, and not as alternatives for, the most directly comparable measures derived in accordance with GAAP and may not be comparable to similar measures presented by other companies. However, we believe that the non-GAAP financial measures provide relevant and useful information to management, investors, analysts, creditors and other interested parties in our industry as they allow: (i) comparison of our earnings to those of our competitors; (ii) a supplemental measure of our underlying business operational performance; and (iii) the assessment of period-to-period performance trends. Management uses non-GAAP financial measures to evaluate financial performance and set target benchmarks for annual and long-term cash incentive performance plans.

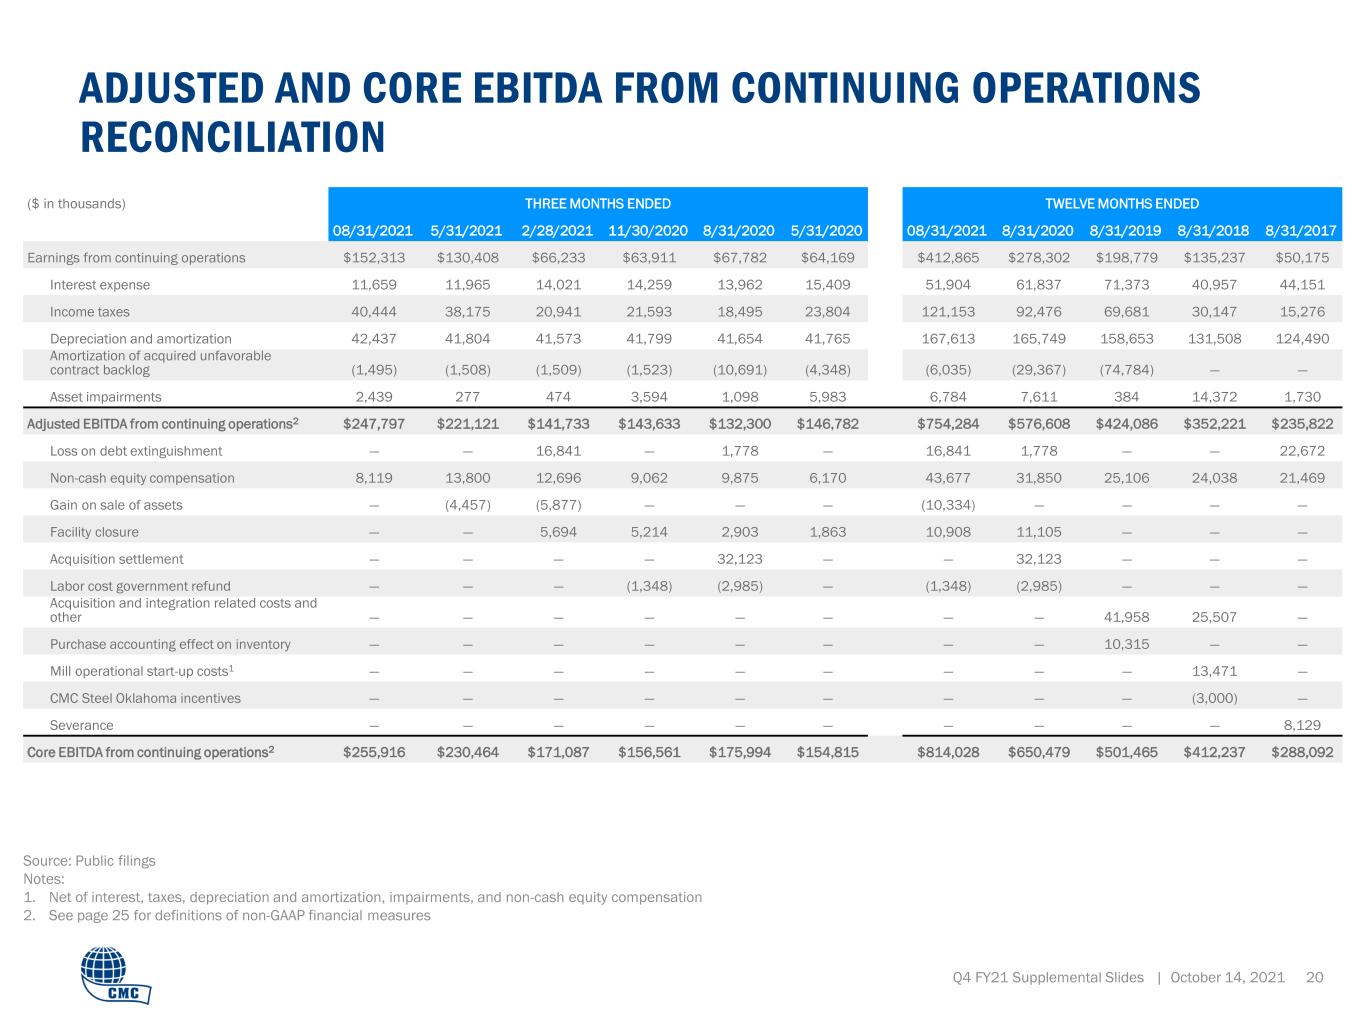
A reconciliation of earnings from continuing operations to adjusted EBITDA from continuing operations and core EBITDA from continuing operations is provided below:
Three Months EndedYear Ended
(in thousands)8/31/20215/31/20212/28/202111/30/20208/31/20208/31/20218/31/2020
Earnings from continuing operations$152,313 $130,408 $66,233 $63,911 $67,782 $412,865 $278,302 
Interest expense11,659 11,965 14,021 14,259 13,962 51,904 61,837 
Income taxes40,444 38,175 20,941 21,593 18,495 121,153 92,476 
Depreciation and amortization42,437 41,804 41,573 41,799 41,654 167,613 165,749 
Amortization of acquired unfavorable contract backlog(1,495)(1,508)(1,509)(1,523)(10,691)(6,035)(29,367)
Asset impairments2,439 277 474 3,594 1,098 6,784 7,611 
Adjusted EBITDA from continuing operations247,797 221,121 141,733 143,633 132,300 754,284 576,608 
Non-cash equity compensation8,119 13,800 12,696 9,062 9,875 43,677 31,850 
Gain on sale of assets— (4,457)(5,877)— — (10,334)— 
Loss on debt extinguishment— — 16,841 — 1,778 16,841 1,778 
Facility closure— — 5,694 5,214 2,903 10,908 11,105 
Labor cost government refund— — — (1,348)(2,985)(1,348)(2,985)
Acquisition settlement— — — — 32,123 — 32,123 
Core EBITDA from continuing operations$255,916 $230,464 $171,087 $156,561 $175,994 $814,028 $650,479 


(CMC Fourth Quarter Fiscal 2021 - 12)

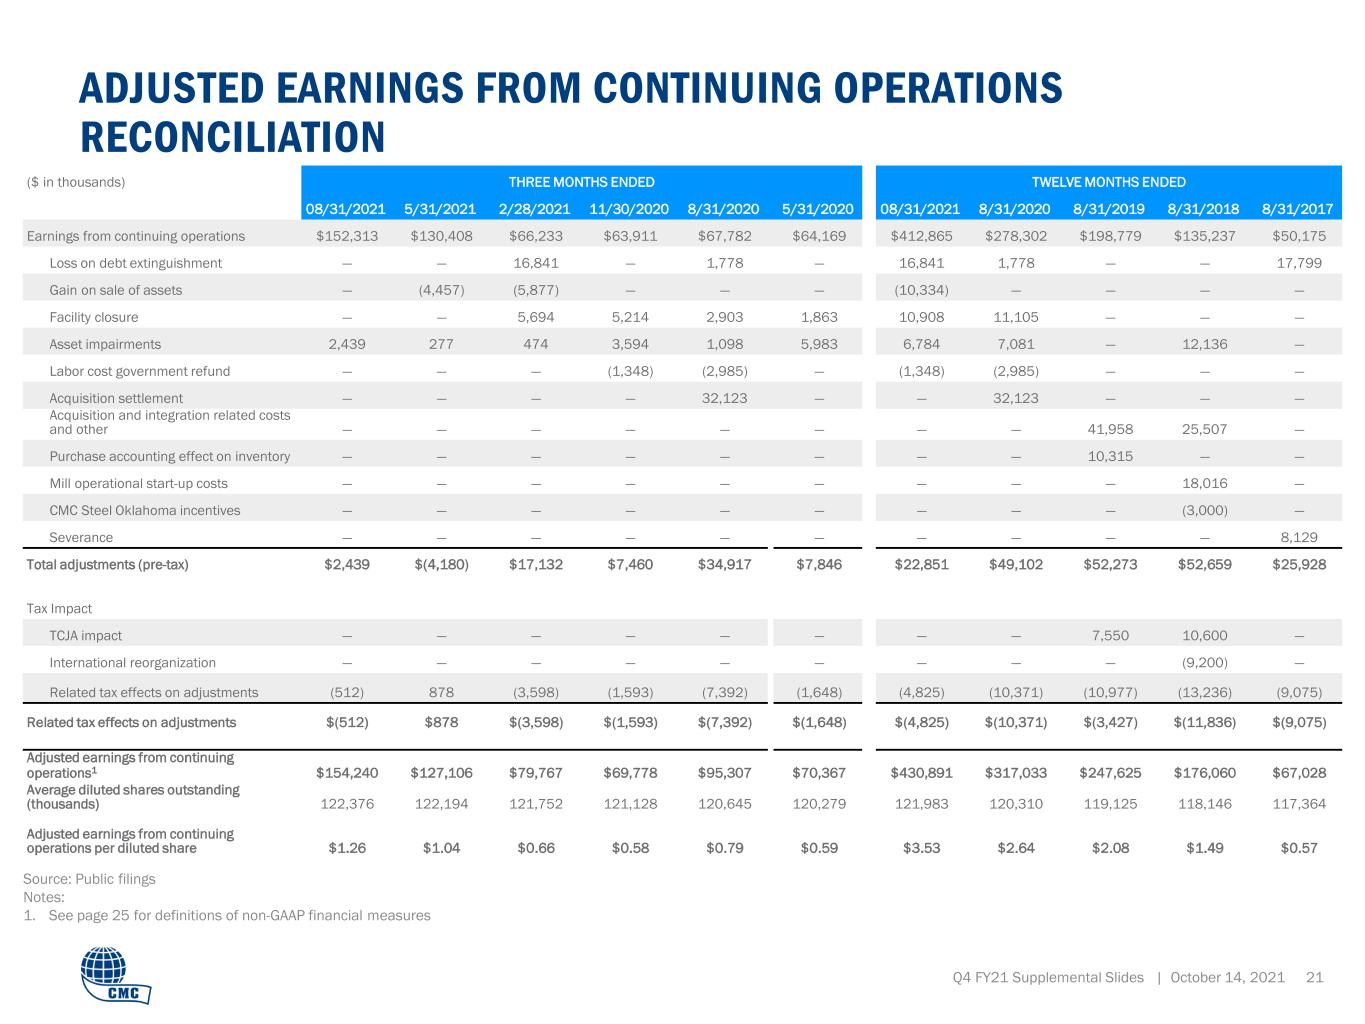
A reconciliation of earnings from continuing operations to adjusted earnings from continuing operations is provided below:
 Three Months EndedYear Ended
(in thousands)8/31/20215/31/20212/28/202111/30/20208/31/20208/31/20218/31/2020
Earnings from continuing operations$152,313 $130,408 $66,233 $63,911 $67,782 $412,865 $278,302 
Gain on sale of assets— (4,457)(5,877)— — (10,334)— 
Asset impairments2,439 277 474 3,594 1,098 6,784 7,081 
Loss on debt extinguishment— — 16,841 — 1,778 16,841 1,778 
Facility closure— — 5,694 5,214 2,903 10,908 11,105 
Acquisition settlement— — — — 32,123 — 32,123 
Labor cost government refund— — — (1,348)(2,985)(1,348)(2,985)
Total adjustments (pre-tax)$2,439 $(4,180)$17,132 $7,460 $34,917 $22,851 $49,102 
Related tax effects on adjustments(512)878 (3,598)(1,593)(7,392)(4,825)(10,371)
Adjusted earnings from continuing operations$154,240 $127,106 $79,767 $69,778 $95,307 $430,891 $317,033 
Earnings from continuing operations per diluted share$1.24 $1.07 $0.54 $0.53 $0.56 $3.38 $2.31 
Adjusted earnings from continuing operations per diluted share$1.26 $1.04 $0.66 $0.58 $0.79 $3.53 $2.64 


Media Contact:
Susan Gerber
(214) 689-4300
Q4 FY 2021 SUPPLEMENTAL SLIDES OCTOBER 14, 2021


CAUTIONARY STATEMENTS This presentation contains or incorporates by reference a number of "forward-looking statements" within the meaning of the federal securities laws with respect to general economic conditions, key macro-economic drivers that impact our business, the effects of ongoing trade actions, the effects of continued pressure on the liquidity of our customers, potential synergies and organic growth provided by acquisitions and strategic investments, demand for our products, metal margins, the effect of COVID-19 and related governmental and economic responses thereto, the ability to operate our steel mills at full capacity, future availability and cost of raw materials, energy, and other inputs for our operations, share repurchases, legal proceedings, the undistributed earnings of our non- U.S. subsidiaries, U.S. non-residential construction activity, international trade, capital expenditures, our liquidity and our ability to satisfy future liquidity requirements, estimated contractual obligations and our expectations or beliefs concerning future events. The statements in this report that are not historical statements, are forward-looking statements. These forward-looking statements can generally be identified by phrases such as we or our management "expects," "anticipates," "believes," "estimates," "future," "intends," "may," "plans to," "ought," "could," "will," "should," "likely," "appears," "projects," "forecasts," "outlook" or other similar words or phrases, as well as by discussions of strategy, plans, or intentions. Our forward-looking statements are based on management's expectations and beliefs as of the time this document was prepared or, with respect to any document incorporated by reference, as of the time such document was prepared. Although we believe that our expectations are reasonable, we can give no assurance that these expectations will prove to have been correct, and actual results may vary materially. Except as required by law, we undertake no obligation to update, amend or clarify any forward-looking statements to reflect changed assumptions, the occurrence of anticipated or unanticipated events, new information or circumstances or any other changes. Important factors that could cause actual results to differ materially from our expectations include those described in Part I, Item 1A, Risk Factors, of our annual report on Form 10-K for the fiscal year ended August 31, 2020, and Part II, Item 1A, Risk Factors, of subsequent quarterly reports on Form 10-Q, as well as the following: changes in economic conditions which affect demand for our products or construction activity generally, and the impact of such changes on the highly cyclical steel industry; rapid and significant changes in the price of metals, potentially impairing our inventory values due to declines in commodity prices or reducing the profitability of our downstream contracts due to rising commodity pricing; impacts from COVID-19 on the economy, demand for our products, global supply chain and on our operations, including the responses of governmental authorities to contain COVID-19 and the impact of various COVID-19 vaccines; excess capacity in our industry, particularly in China, and product availability from competing steel mills and other steel suppliers including import quantities and pricing; compliance with and changes in existing and future laws, regulations and other legal requirements and judicial decisions that govern our business, including increased environmental regulations associated with climate change and greenhouse gas emissions; involvement in various environmental matters that may result in fines, penalties or judgments; potential limitations in our or our customers' abilities to access credit and non-compliance by our customers; activity in repurchasing shares of our common stock under our repurchase program; financial covenants and restrictions on the operation of our business contained in agreements governing our debt; our inability to close the sale of our Rancho Cucamonga property, including if the buyer were to terminate the purchase agreement during its 60 day due diligence review period; our ability to successfully identify, consummate and integrate acquisitions, and the effects that acquisitions may have on our financial leverage; risks associated with acquisitions generally, such as the inability to obtain, or delays in obtaining, required approvals under applicable antitrust legislation and other regulatory and third party consents and approvals; operating and start-up risks, as well as market risks associated with the commissioning of new projects could prevent us from realizing anticipated benefits and could result in a loss of all or a substantial part of our investment; lower than expected future levels of revenues and higher than expected future costs; failure or inability to implement growth strategies in a timely manner; impact of goodwill impairment charges; impact of long-lived asset impairment charges; currency fluctuations; global factors, such as trade measures, military conflicts and political uncertainties, including the impact of the Biden administration on current trade regulations, such as Section 232 trade tariffs, tax legislation and other regulations which might adversely impact our business; availability and pricing of electricity, electrodes and natural gas for mill operations; ability to hire and retain key executives and other employees; competition from other materials or from competitors that have a lower cost structure or access to greater financial resources; information technology interruptions and breaches in security; ability to make necessary capital expenditures; availability and pricing of raw materials and other items over which we exert little influence, including scrap metal, energy and insurance; unexpected equipment failures; losses or limited potential gains due to hedging transactions; litigation claims and settlements, court decisions, regulatory rulings and legal compliance risks; risk of injury or death to employees, customers or other visitors to our operations; and civil unrest, protests and riots. You should refer to the "Risk Factors" disclosed in our periodic and current reports filed with the Securities and Exchange Commission for information regarding additional risks which would cause actual results to be significantly different from those expressed or implied by these forward-looking statements. Forward-looking statements involve known and unknown risks, uncertainties, assumptions and other important factors that could cause actual results, performance or our achievements, or industry results, to differ materially from historical results, any future results, or performance or achievements expressed or implied by such forward-looking statements. Accordingly, readers of this document are cautioned not to place undue reliance on any forward-looking statements. 2Q4 FY21 Supplemental Slides | October 14, 2021


A CLEAR PATH TO VALUE CREATION Q4 FY21 Supplemental Slides | October 14, 2021 3 ✓ Leading positions in core product and geographical markets ✓ Focused strategy that centers on key capabilities and competitive strengths ✓ Vertical structure that optimizes returns through the entire value chain ✓ Strong financial position with flexibility to execute on strategy ✓ Disciplined capital allocation focused on maximizing returns for our shareholders


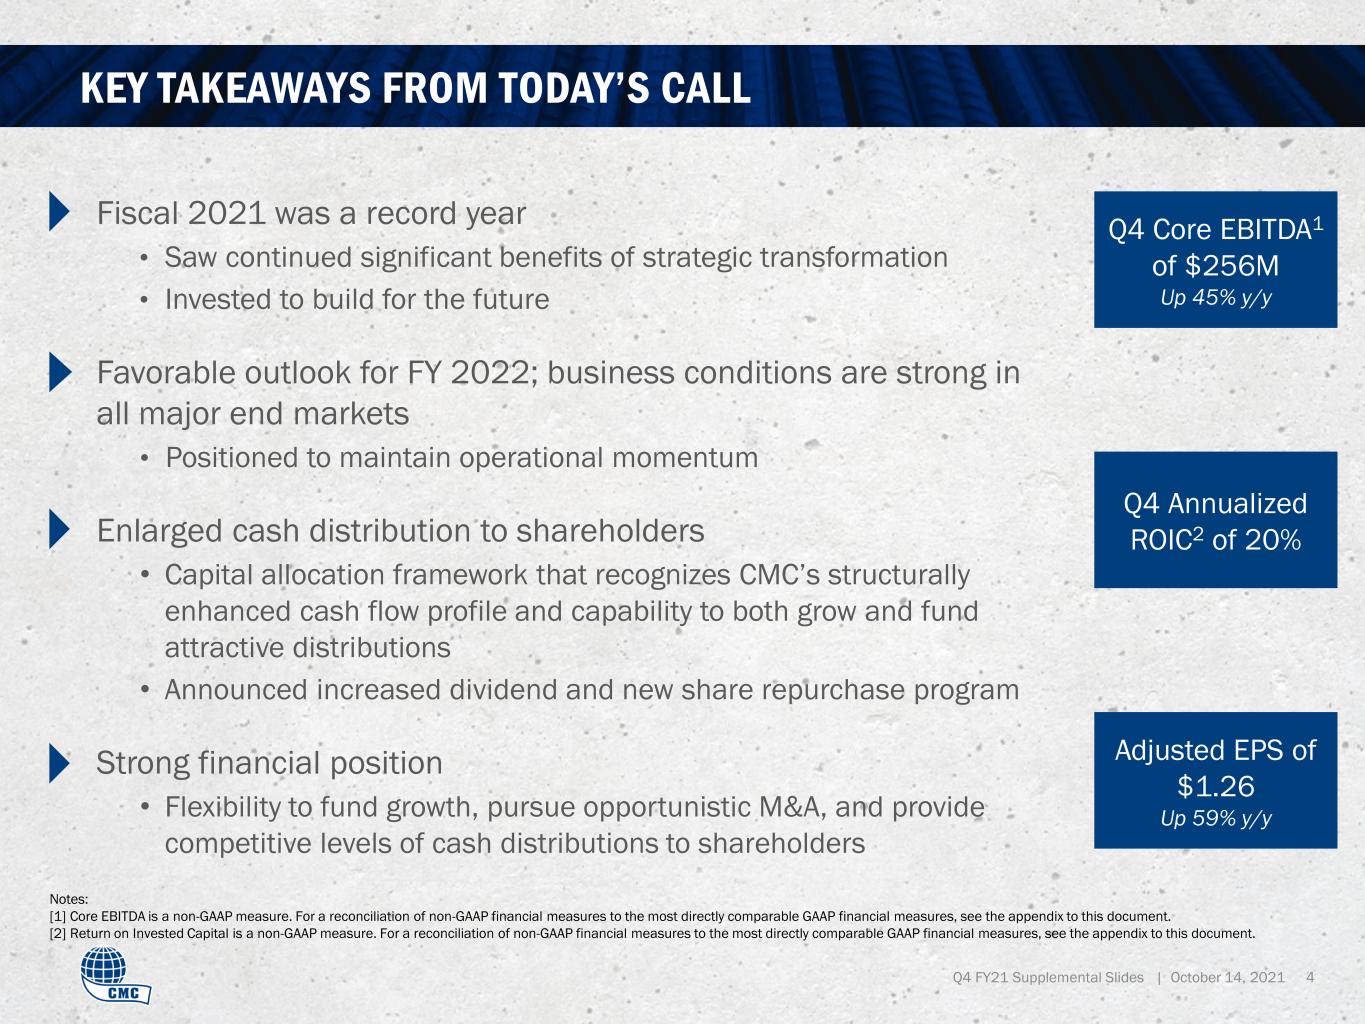
Notes: [1] Core EBITDA is a non-GAAP measure. For a reconciliation of non-GAAP financial measures to the most directly comparable GAAP financial measures, see the appendix to this document. [2] Return on Invested Capital is a non-GAAP measure. For a reconciliation of non-GAAP financial measures to the most directly comparable GAAP financial measures, see the appendix to this document. KEY TAKEAWAYS FROM TODAY’S CALL Q4 FY21 Supplemental Slides | October 14, 2021 4 Fiscal 2021 was a record year • Saw continued significant benefits of strategic transformation • Invested to build for the future Favorable outlook for FY 2022; business conditions are strong in all major end markets • Positioned to maintain operational momentum Enlarged cash distribution to shareholders • Capital allocation framework that recognizes CMC’s structurally enhanced cash flow profile and capability to both grow and fund attractive distributions • Announced increased dividend and new share repurchase program Strong financial position • Flexibility to fund growth, pursue opportunistic M&A, and provide competitive levels of cash distributions to shareholders Q4 Core EBITDA1 of $256M Up 45% y/y Q4 Annualized ROIC2 of 20% Adjusted EPS of $1.26 Up 59% y/y


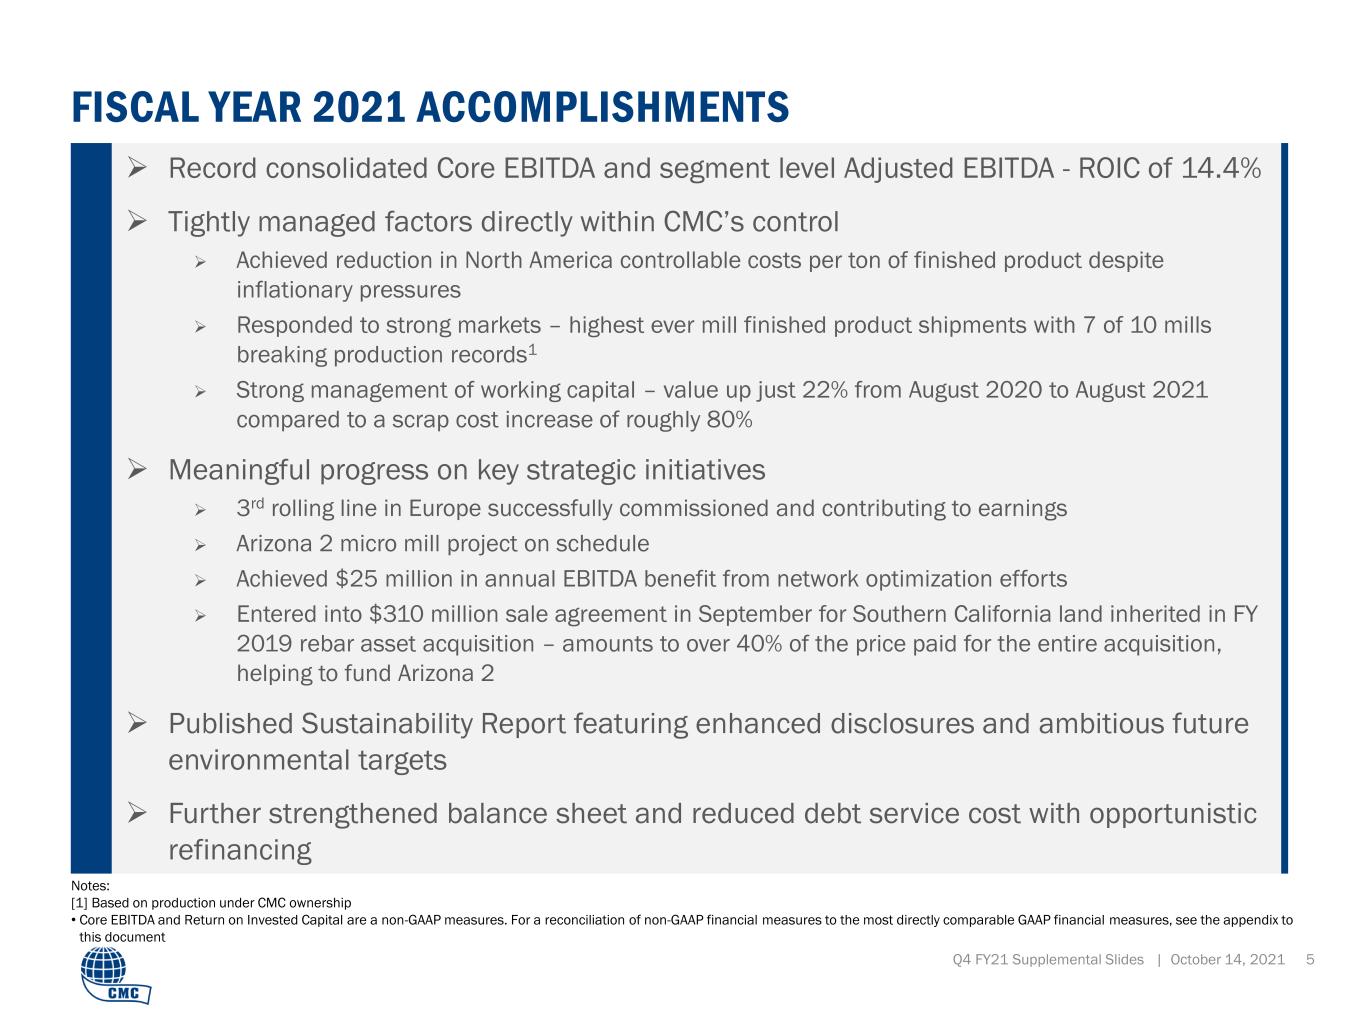
➢ Record consolidated Core EBITDA and segment level Adjusted EBITDA - ROIC of 14.4% ➢ Tightly managed factors directly within CMC’s control ➢ Achieved reduction in North America controllable costs per ton of finished product despite inflationary pressures ➢ Responded to strong markets – highest ever mill finished product shipments with 7 of 10 mills breaking production records1 ➢ Strong management of working capital – value up just 22% from August 2020 to August 2021 compared to a scrap cost increase of roughly 80% ➢ Meaningful progress on key strategic initiatives ➢ 3rd rolling line in Europe successfully commissioned and contributing to earnings ➢ Arizona 2 micro mill project on schedule ➢ Achieved $25 million in annual EBITDA benefit from network optimization efforts ➢ Entered into $310 million sale agreement in September for Southern California land inherited in FY 2019 rebar asset acquisition – amounts to over 40% of the price paid for the entire acquisition, helping to fund Arizona 2 ➢ Published Sustainability Report featuring enhanced disclosures and ambitious future environmental targets ➢ Further strengthened balance sheet and reduced debt service cost with opportunistic refinancing FISCAL YEAR 2021 ACCOMPLISHMENTS Q4 FY21 Supplemental Slides | October 14, 2021 5 Notes: [1] Based on production under CMC ownership • Core EBITDA and Return on Invested Capital are a non-GAAP measures. For a reconciliation of non-GAAP financial measures to the most directly comparable GAAP financial measures, see the appendix to this document


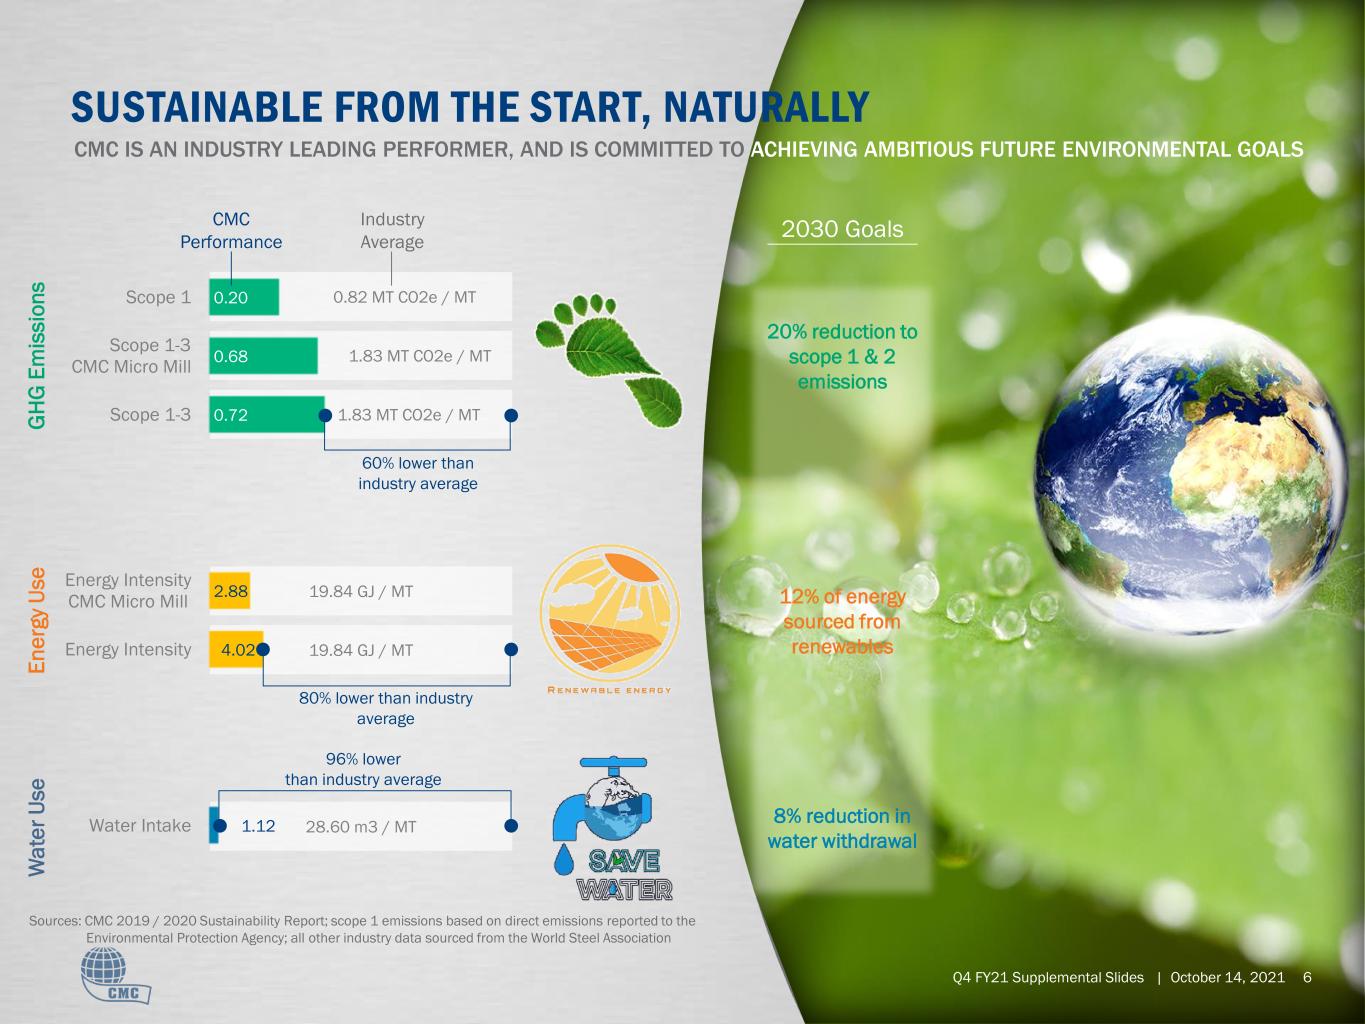
0.82 MT CO2e / MT 1.83 MT CO2e / MT 1.83 MT CO2e / MT 19.84 GJ / MT 19.84 GJ / MT 28.60 m3 / MT 0.20 0.68 0.72 2.88 4.02 1.12 Scope 1 Scope 1-3 CMC Micro Mill Scope 1-3 Energy Intensity CMC Micro Mill Energy Intensity Water Intake Q4 FY21 Supplemental Slides | October 14, 2021 6 SUSTAINABLE FROM THE START, NATURALLY 20% reduction to scope 1 & 2 emissions 2030 Goals CMC IS AN INDUSTRY LEADING PERFORMER, AND IS COMMITTED TO ACHIEVING AMBITIOUS FUTURE ENVIRONMENTAL GOALS G H G E m is s io n s E n e rg y U s e W a te r U s e 12% of energy sourced from renewables 8% reduction in water withdrawal Industry Average CMC Performance 60% lower than industry average 80% lower than industry average 96% lower than industry average Sources: CMC 2019 / 2020 Sustainability Report; scope 1 emissions based on direct emissions reported to the Environmental Protection Agency; all other industry data sourced from the World Steel Association


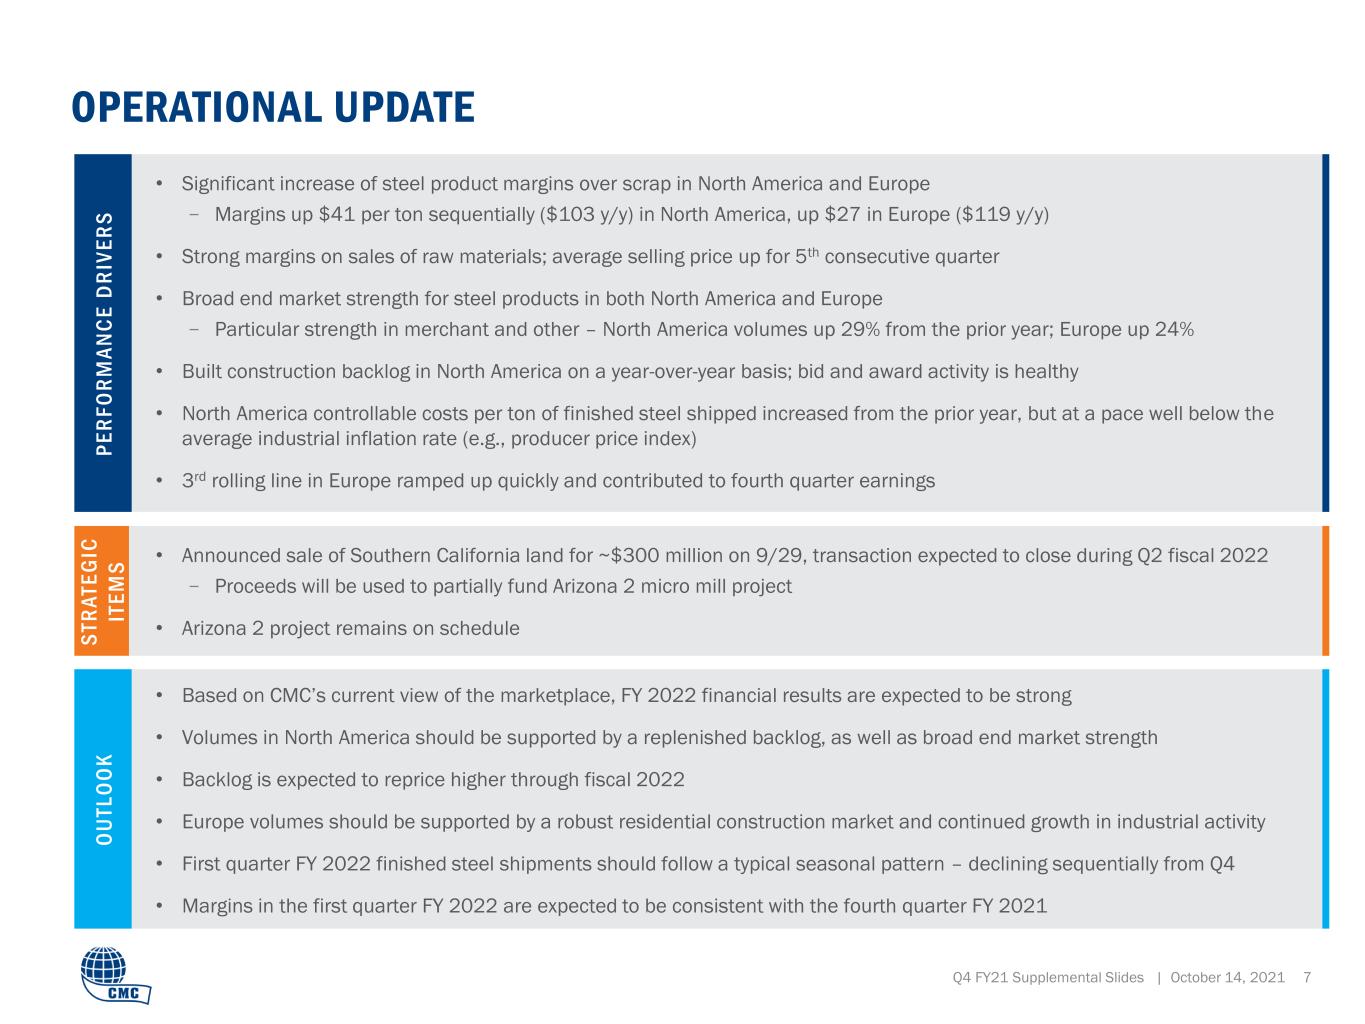
O U T L O O K • Announced sale of Southern California land for ~$300 million on 9/29, transaction expected to close during Q2 fiscal 2022 − Proceeds will be used to partially fund Arizona 2 micro mill project • Arizona 2 project remains on schedule • Significant increase of steel product margins over scrap in North America and Europe − Margins up $41 per ton sequentially ($103 y/y) in North America, up $27 in Europe ($119 y/y) • Strong margins on sales of raw materials; average selling price up for 5th consecutive quarter • Broad end market strength for steel products in both North America and Europe − Particular strength in merchant and other – North America volumes up 29% from the prior year; Europe up 24% • Built construction backlog in North America on a year-over-year basis; bid and award activity is healthy • North America controllable costs per ton of finished steel shipped increased from the prior year, but at a pace well below the average industrial inflation rate (e.g., producer price index) • 3rd rolling line in Europe ramped up quickly and contributed to fourth quarter earnings Q4 FY21 Supplemental Slides | October 14, 2021 7 P E R F O R M A N C E D R IV E R S OPERATIONAL UPDATE S T R A T E G IC IT E M S • Based on CMC’s current view of the marketplace, FY 2022 financial results are expected to be strong • Volumes in North America should be supported by a replenished backlog, as well as broad end market strength • Backlog is expected to reprice higher through fiscal 2022 • Europe volumes should be supported by a robust residential construction market and continued growth in industrial activity • First quarter FY 2022 finished steel shipments should follow a typical seasonal pattern – declining sequentially from Q4 • Margins in the first quarter FY 2022 are expected to be consistent with the fourth quarter FY 2021


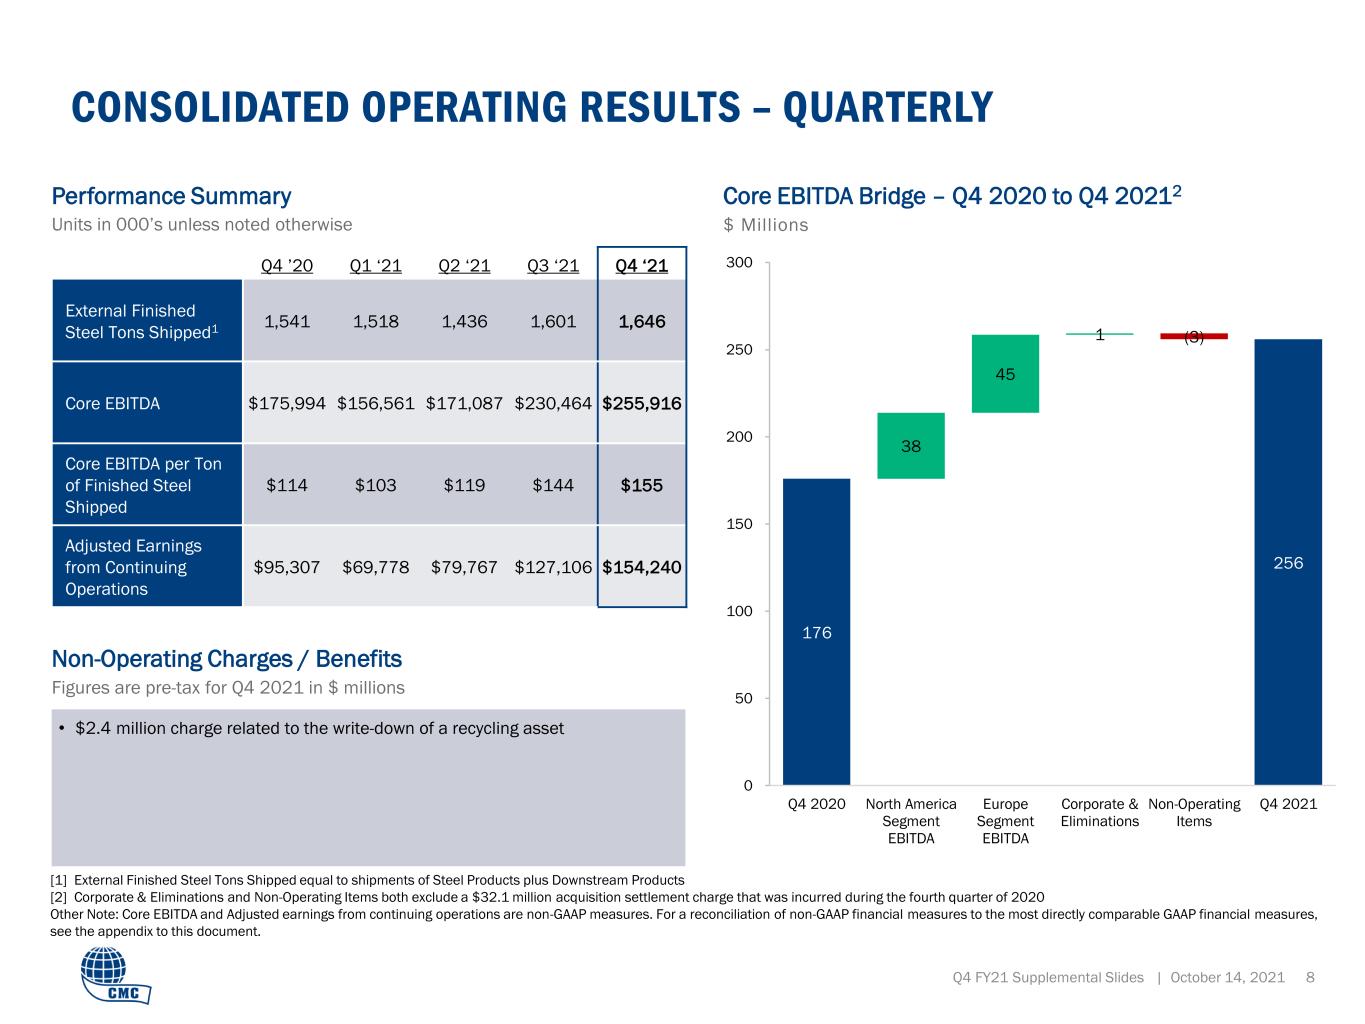
176 256 38 45 1 (3) 0 50 100 150 200 250 300 Q4 2020 North America Segment EBITDA Europe Segment EBITDA Corporate & Eliminations Non-Operating Items Q4 2021 Q4 FY21 Supplemental Slides | October 14, 2021 8 CONSOLIDATED OPERATING RESULTS – QUARTERLY Q4 ’20 Q1 ‘21 Q2 ‘21 Q3 ‘21 Q4 ‘21 External Finished Steel Tons Shipped1 1,541 1,518 1,436 1,601 1,646 Core EBITDA $175,994 $156,561 $171,087 $230,464 $255,916 Core EBITDA per Ton of Finished Steel Shipped $114 $103 $119 $144 $155 Adjusted Earnings from Continuing Operations $95,307 $69,778 $79,767 $127,106 $154,240 Performance Summary Units in 000’s unless noted otherwise • $2.4 million charge related to the write-down of a recycling asset Non-Operating Charges / Benefits Figures are pre-tax for Q4 2021 in $ millions Core EBITDA Bridge – Q4 2020 to Q4 20212 $ Millions [1] External Finished Steel Tons Shipped equal to shipments of Steel Products plus Downstream Products [2] Corporate & Eliminations and Non-Operating Items both exclude a $32.1 million acquisition settlement charge that was incurred during the fourth quarter of 2020 Other Note: Core EBITDA and Adjusted earnings from continuing operations are non-GAAP measures. For a reconciliation of non-GAAP financial measures to the most directly comparable GAAP financial measures, see the appendix to this document.


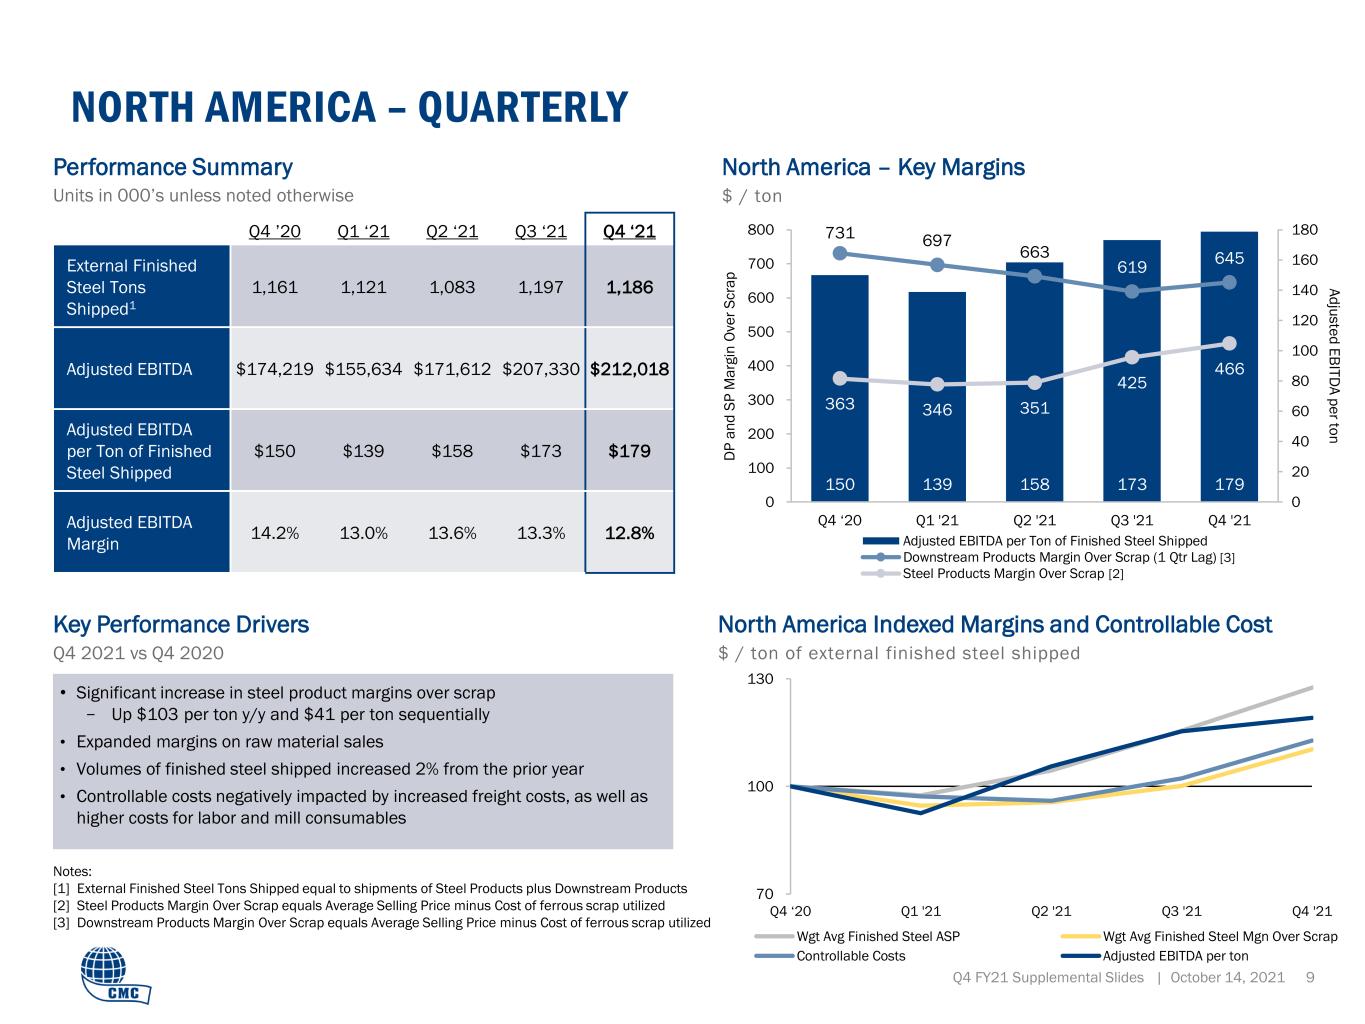
• Significant increase in steel product margins over scrap − Up $103 per ton y/y and $41 per ton sequentially • Expanded margins on raw material sales • Volumes of finished steel shipped increased 2% from the prior year • Controllable costs negatively impacted by increased freight costs, as well as higher costs for labor and mill consumables 70 100 130 Q4 ‘20 Q1 '21 Q2 '21 Q3 '21 Q4 '21 Wgt Avg Finished Steel ASP Wgt Avg Finished Steel Mgn Over Scrap Controllable Costs Adjusted EBITDA per ton Notes: [1] External Finished Steel Tons Shipped equal to shipments of Steel Products plus Downstream Products [2] Steel Products Margin Over Scrap equals Average Selling Price minus Cost of ferrous scrap utilized [3] Downstream Products Margin Over Scrap equals Average Selling Price minus Cost of ferrous scrap utilized 150 139 158 173 179 731 697 663 619 645 363 346 351 425 466 0 20 40 60 80 100 120 140 160 180 0 100 200 300 400 500 600 700 800 Q4 ‘20 Q1 '21 Q2 '21 Q3 '21 Q4 '21 Adjusted EBITDA per Ton of Finished Steel Shipped Downstream Products Margin Over Scrap (1 Qtr Lag) Steel Products Margin Over Scrap Q4 FY21 Supplemental Slides | October 14, 2021 9 NORTH AMERICA – QUARTERLY Q4 ’20 Q1 ‘21 Q2 ‘21 Q3 ‘21 Q4 ‘21 External Finished Steel Tons Shipped1 1,161 1,121 1,083 1,197 1,186 Adjusted EBITDA $174,219 $155,634 $171,612 $207,330 $212,018 Adjusted EBITDA per Ton of Finished Steel Shipped $150 $139 $158 $173 $179 Adjusted EBITDA Margin 14.2% 13.0% 13.6% 13.3% 12.8% Performance Summary Units in 000’s unless noted otherwise Key Performance Drivers Q4 2021 vs Q4 2020 North America – Key Margins $ / ton D P a n d S P M a rg in O v e r S c ra p A d ju s te d E B IT D A p e r to n North America Indexed Margins and Controllable Cost $ / ton of external finished steel shipped [2] [3]


50 100 150 200 250 Q4 ‘20 Q1 '21 Q2 '21 Q3 '21 Q4 '21 Steel Product Margins Over Scrap Controllable Costs Adjusted EBITDA per Ton 60 36 46 124 147 196 199 204 288 315 0 20 40 60 80 100 120 140 160 100 150 200 250 300 350 Q4 ‘20 Q1 '21 Q2 '21 Q3 '21 Q4 '21 Adjusted EBITDA per Ton Steel Products Margin Over Scrap Notes: [1] External Finished Steel Tons Shipped equal to shipments of Steel Products plus Downstream Products [2] Steel Products Margin Over Scrap equals Average Selling Price minus Cost of ferrous scrap utilized Q4 FY21 Supplemental Slides | October 14, 2021 10 EUROPE– QUARTERLY Q4 ’20 Q1 ’21 Q2 ‘21 Q3 ‘21 Q4 ‘21 External Finished Steel Tons Shipped1 380 397 353 404 460 Adjusted EBITDA $22,927 $14,470 $16,107 $50,005 $67,676 Adjusted EBITDA per Ton of Finished Steel Shipped $60 $36 $46 $124 $147 Adjusted EBITDA Margin 12.7% 7.4% 8.0% 17.6% 18.4% Performance Summary Units in 000’s unless noted otherwise • Significant increase in margins over scrap − Up $119 per ton y/y and $27 per ton sequentially • Strong demand across all products − Rebar shipments up 16% from the prior year, merchant & other up 24% • Meaningful EBITDA and finished product volume contribution from new rolling line • Controllable cost per ton increased largely due to absence of $10.7 million energy credit received in prior year period Key Performance Drivers Q4 2021 vs Q4 2020 Europe – Key Margins $ / ton S te e l P ro d u c t M a rg in O v e r S c ra p A d ju s te d E B IT D A p e r to n Europe Indexed Margins and Controllable Cost $ / ton of finished product shipped [2]


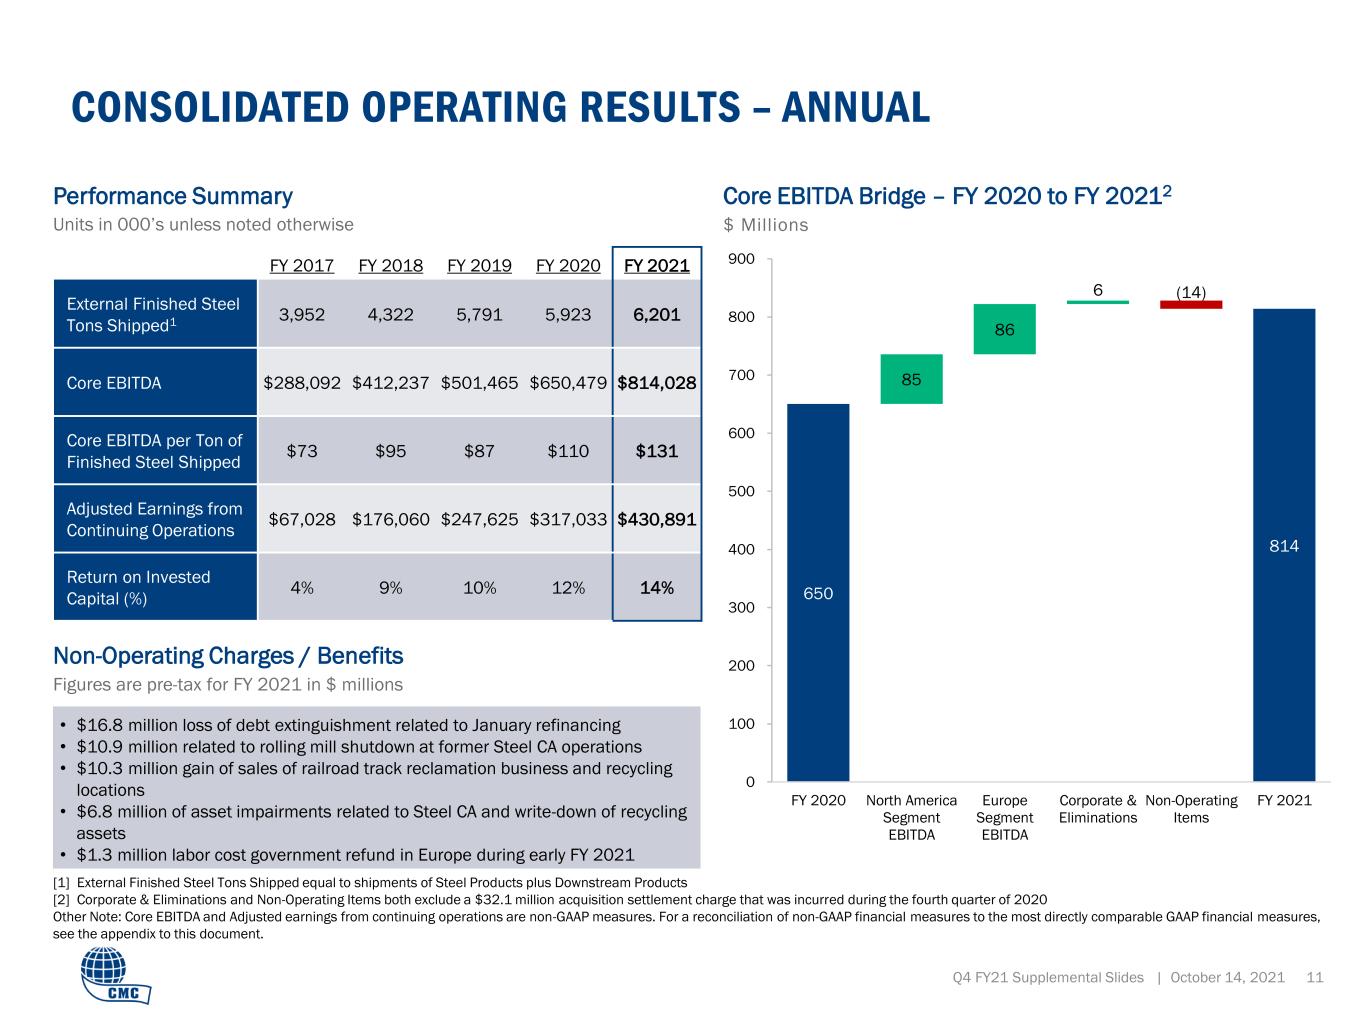
650 814 85 86 6 (14) 0 100 200 300 400 500 600 700 800 900 FY 2020 North America Segment EBITDA Europe Segment EBITDA Corporate & Eliminations Non-Operating Items FY 2021 Q4 FY21 Supplemental Slides | October 14, 2021 11 CONSOLIDATED OPERATING RESULTS – ANNUAL Core EBITDA Bridge – FY 2020 to FY 20212 $ Millions FY 2017 FY 2018 FY 2019 FY 2020 FY 2021 External Finished Steel Tons Shipped1 3,952 4,322 5,791 5,923 6,201 Core EBITDA $288,092 $412,237 $501,465 $650,479 $814,028 Core EBITDA per Ton of Finished Steel Shipped $73 $95 $87 $110 $131 Adjusted Earnings from Continuing Operations $67,028 $176,060 $247,625 $317,033 $430,891 Return on Invested Capital (%) 4% 9% 10% 12% 14% Performance Summary Units in 000’s unless noted otherwise • $16.8 million loss of debt extinguishment related to January refinancing • $10.9 million related to rolling mill shutdown at former Steel CA operations • $10.3 million gain of sales of railroad track reclamation business and recycling locations • $6.8 million of asset impairments related to Steel CA and write-down of recycling assets • $1.3 million labor cost government refund in Europe during early FY 2021 Non-Operating Charges / Benefits Figures are pre-tax for FY 2021 in $ millions [1] External Finished Steel Tons Shipped equal to shipments of Steel Products plus Downstream Products [2] Corporate & Eliminations and Non-Operating Items both exclude a $32.1 million acquisition settlement charge that was incurred during the fourth quarter of 2020 Other Note: Core EBITDA and Adjusted earnings from continuing operations are non-GAAP measures. For a reconciliation of non-GAAP financial measures to the most directly comparable GAAP financial measures, see the appendix to this document.


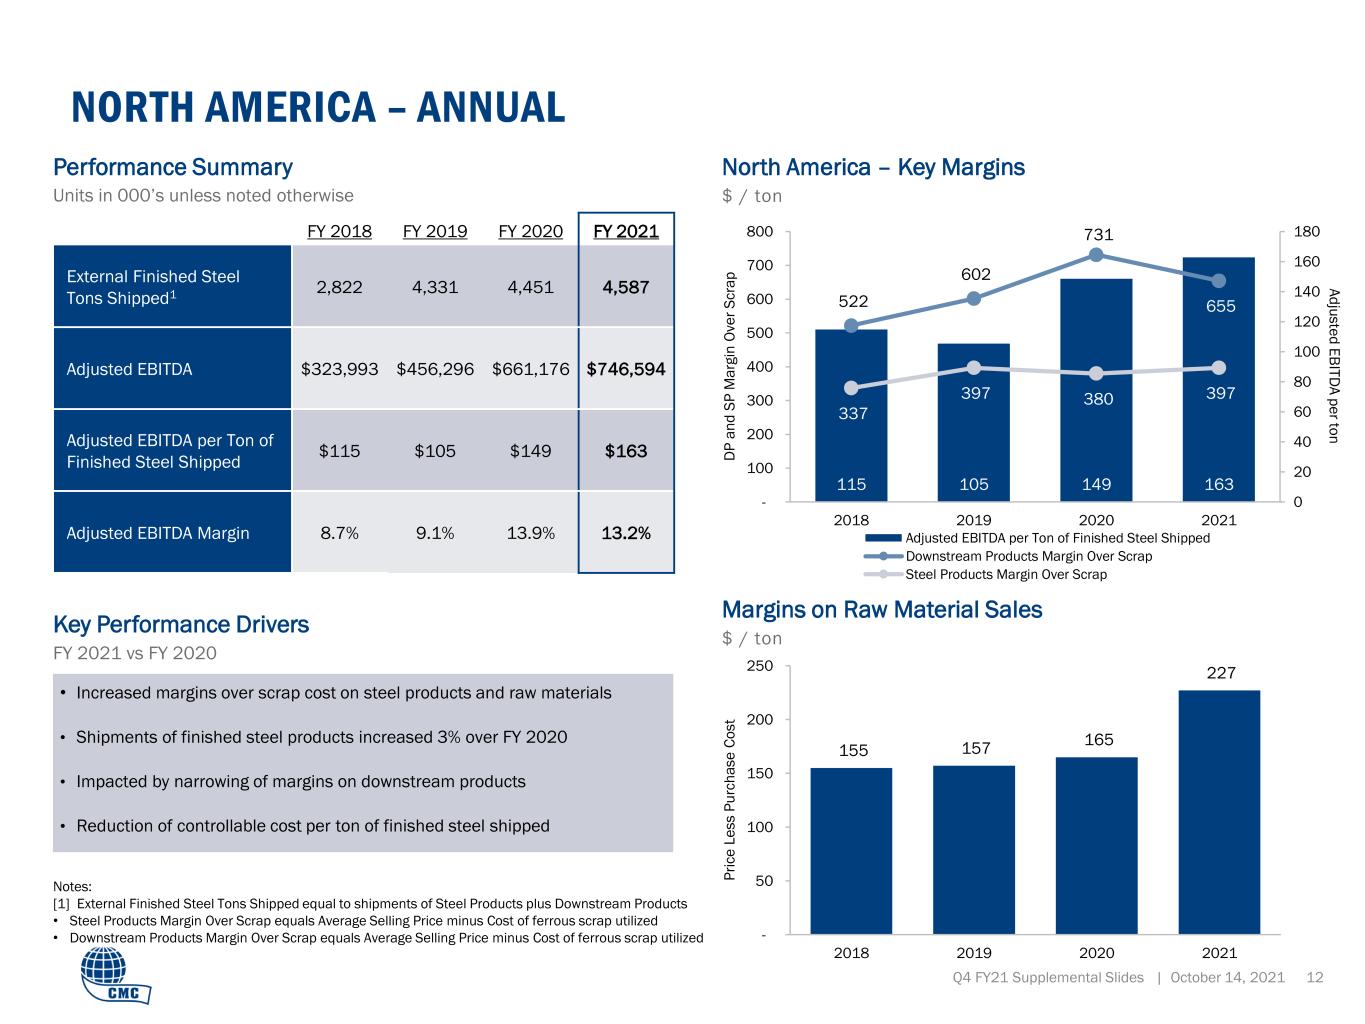
115 105 149 163 522 602 731 655 337 397 380 397 0 20 40 60 80 100 120 140 160 180 - 100 200 300 400 500 600 700 800 2018 2019 2020 2021 Adjusted EBITDA per Ton of Finished Steel Shipped Downstream Products Margin Over Scrap Steel Products Margin Over Scrap Q4 FY21 Supplemental Slides | October 14, 2021 12 NORTH AMERICA – ANNUAL FY 2018 FY 2019 FY 2020 FY 2021 External Finished Steel Tons Shipped1 2,822 4,331 4,451 4,587 Adjusted EBITDA $323,993 $456,296 $661,176 $746,594 Adjusted EBITDA per Ton of Finished Steel Shipped $115 $105 $149 $163 Adjusted EBITDA Margin 8.7% 9.1% 13.9% 13.2% Performance Summary Units in 000’s unless noted otherwise • Increased margins over scrap cost on steel products and raw materials • Shipments of finished steel products increased 3% over FY 2020 • Impacted by narrowing of margins on downstream products • Reduction of controllable cost per ton of finished steel shipped Key Performance Drivers FY 2021 vs FY 2020 North America – Key Margins $ / ton D P a n d S P M a rg in O v e r S c ra p A d ju s te d E B IT D A p e r to n Notes: [1] External Finished Steel Tons Shipped equal to shipments of Steel Products plus Downstream Products • Steel Products Margin Over Scrap equals Average Selling Price minus Cost of ferrous scrap utilized • Downstream Products Margin Over Scrap equals Average Selling Price minus Cost of ferrous scrap utilized 155 157 165 227 - 50 100 150 200 250 2018 2019 2020 2021 Margins on Raw Material Sales $ / ton P ri c e L e s s P u rc h a s e C o s t


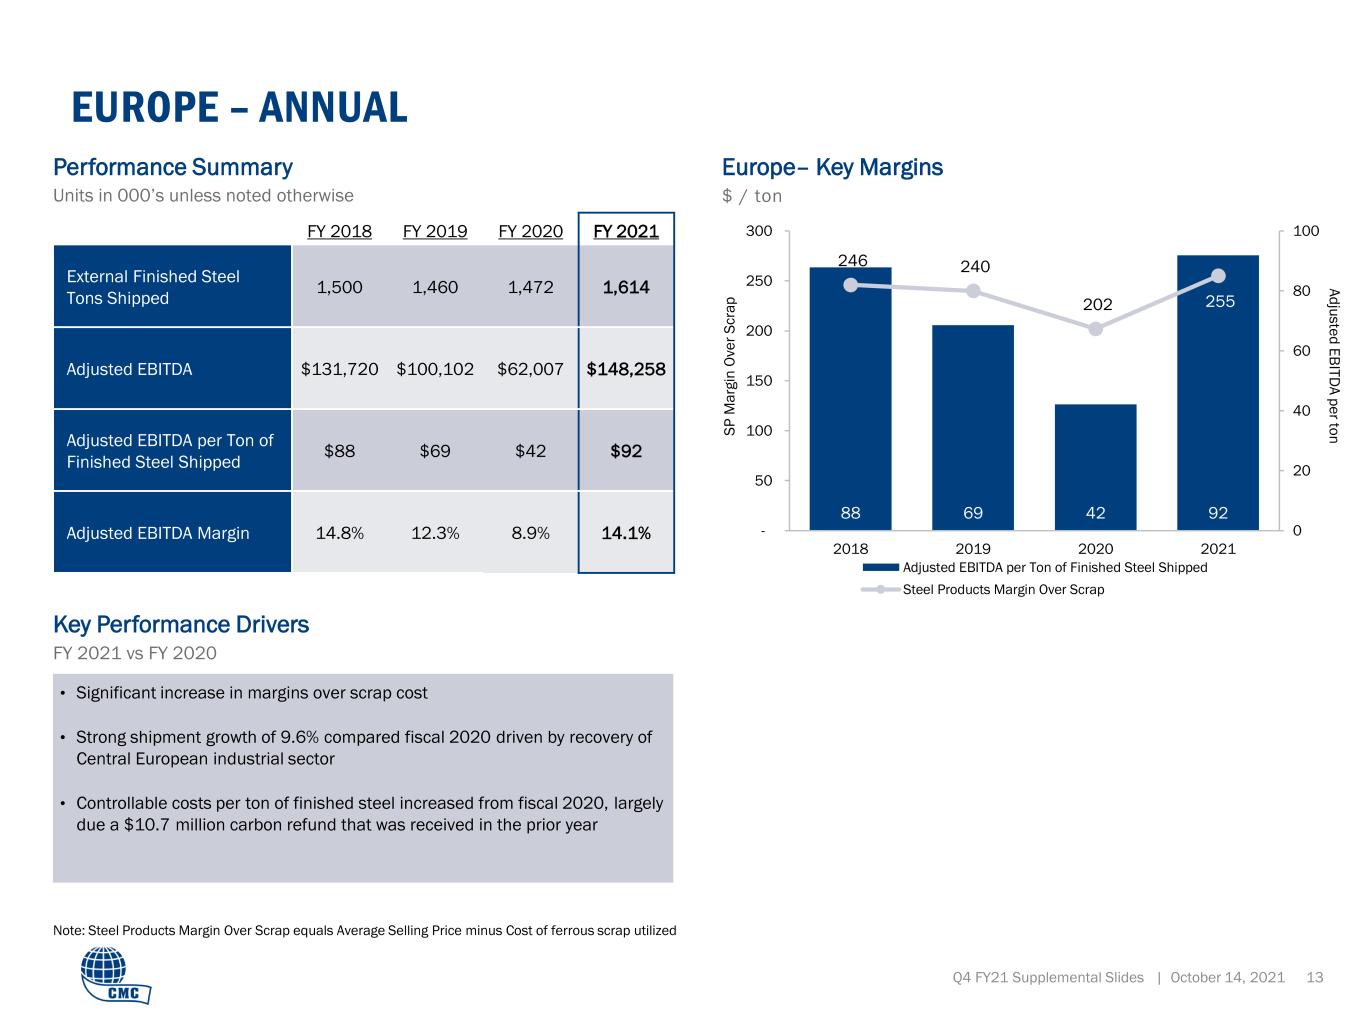
88 69 42 92 246 240 202 255 0 20 40 60 80 100 - 50 100 150 200 250 300 2018 2019 2020 2021 Adjusted EBITDA per Ton of Finished Steel Shipped Steel Products Margin Over Scrap EUROPE – ANNUAL Q4 FY21 Supplemental Slides | October 14, 2021 13 FY 2018 FY 2019 FY 2020 FY 2021 External Finished Steel Tons Shipped 1,500 1,460 1,472 1,614 Adjusted EBITDA $131,720 $100,102 $62,007 $148,258 Adjusted EBITDA per Ton of Finished Steel Shipped $88 $69 $42 $92 Adjusted EBITDA Margin 14.8% 12.3% 8.9% 14.1% Performance Summary Units in 000’s unless noted otherwise • Significant increase in margins over scrap cost • Strong shipment growth of 9.6% compared fiscal 2020 driven by recovery of Central European industrial sector • Controllable costs per ton of finished steel increased from fiscal 2020, largely due a $10.7 million carbon refund that was received in the prior year Key Performance Drivers FY 2021 vs FY 2020 Europe– Key Margins $ / ton S P M a rg in O v e r S c ra p A d ju s te d E B IT D A p e r to n Note: Steel Products Margin Over Scrap equals Average Selling Price minus Cost of ferrous scrap utilized


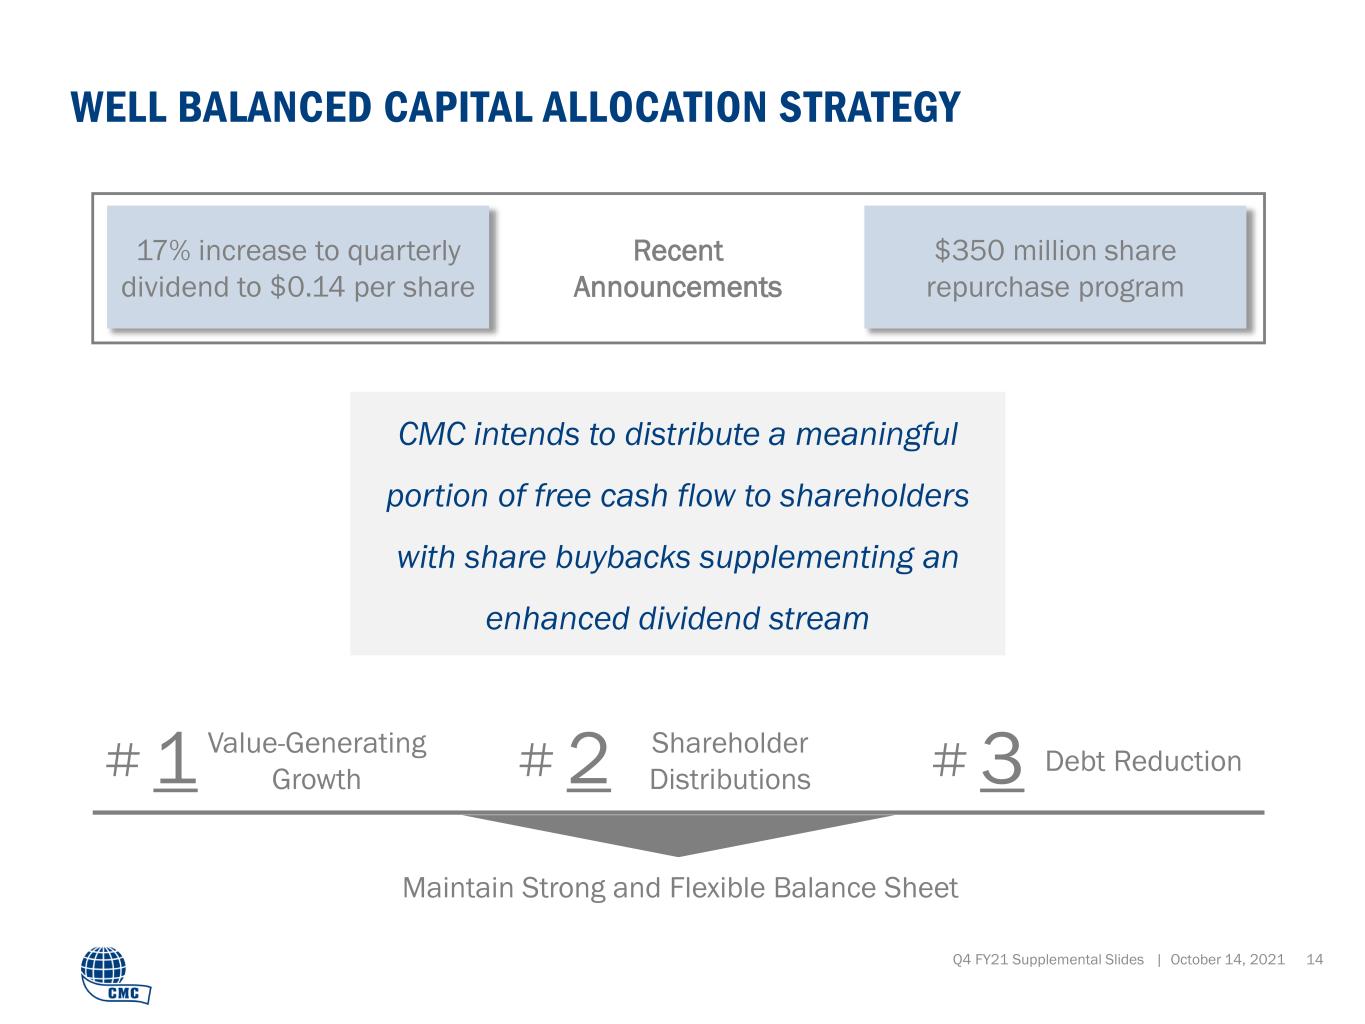
WELL BALANCED CAPITAL ALLOCATION STRATEGY Q4 FY21 Supplemental Slides | October 14, 2021 14 $350 million share repurchase program 17% increase to quarterly dividend to $0.14 per share Recent Announcements CMC intends to distribute a meaningful portion of free cash flow to shareholders with share buybacks supplementing an enhanced dividend stream Value-Generating Growth1 Shareholder Distributions2 Debt Reduction3 Maintain Strong and Flexible Balance Sheet


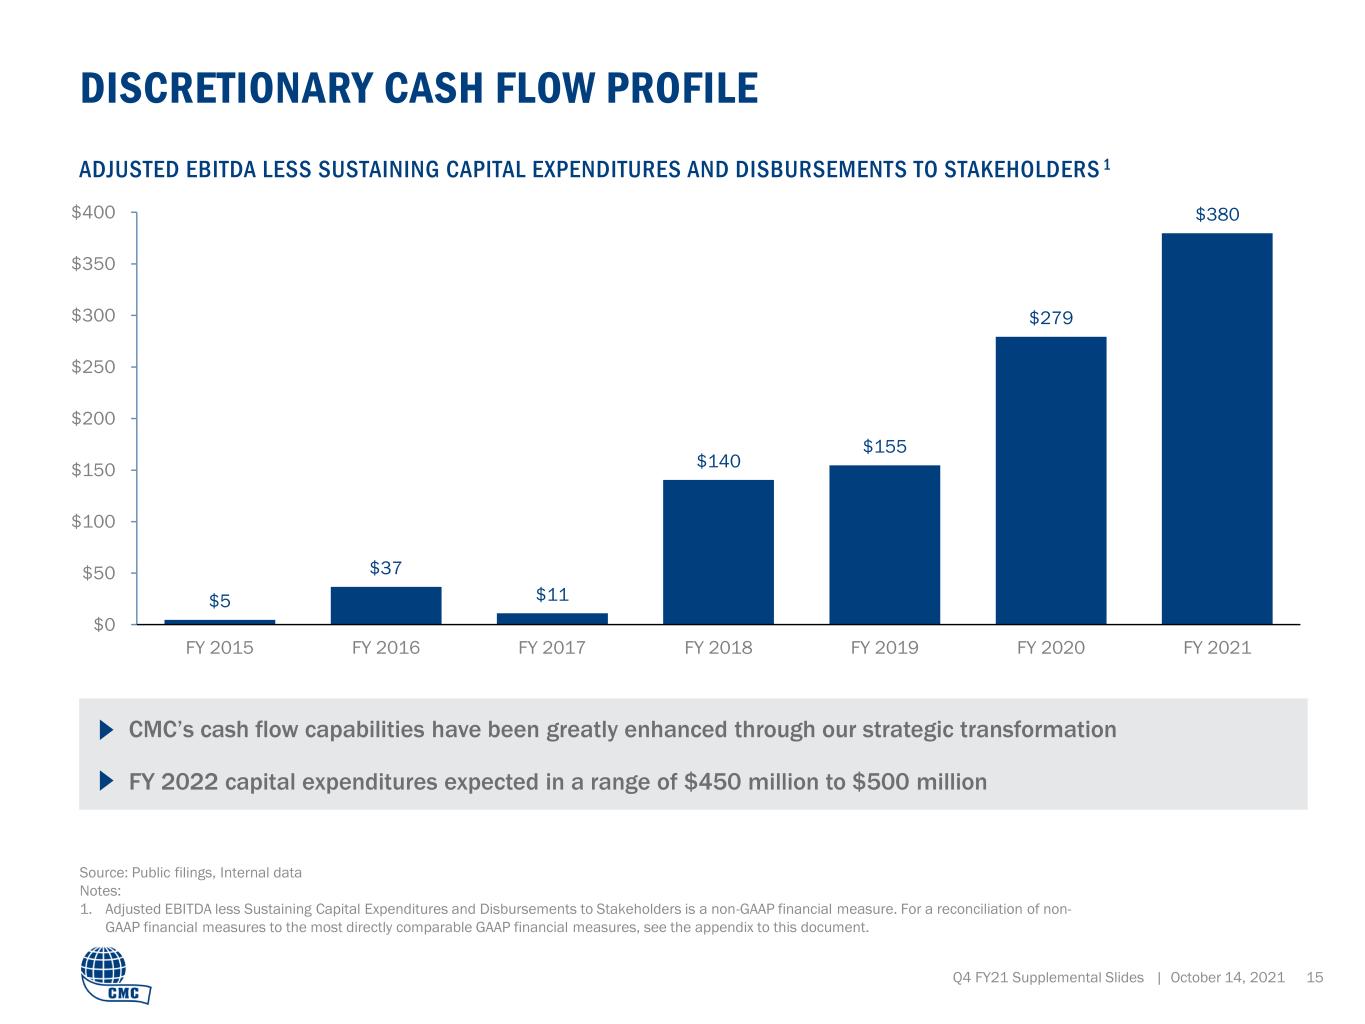
$5 $37 $11 $140 $155 $279 $380 $0 $50 $100 $150 $200 $250 $300 $350 $400 FY 2015 FY 2016 FY 2017 FY 2018 FY 2019 FY 2020 FY 2021 ADJUSTED EBITDA LESS SUSTAINING CAPITAL EXPENDITURES AND DISBURSEMENTS TO STAKEHOLDERS 1 CMC’s cash flow capabilities have been greatly enhanced through our strategic transformation FY 2022 capital expenditures expected in a range of $450 million to $500 million Source: Public filings, Internal data Notes: 1. Adjusted EBITDA less Sustaining Capital Expenditures and Disbursements to Stakeholders is a non-GAAP financial measure. For a reconciliation of non- GAAP financial measures to the most directly comparable GAAP financial measures, see the appendix to this document. DISCRETIONARY CASH FLOW PROFILE Q4 FY21 Supplemental Slides | October 14, 2021 15


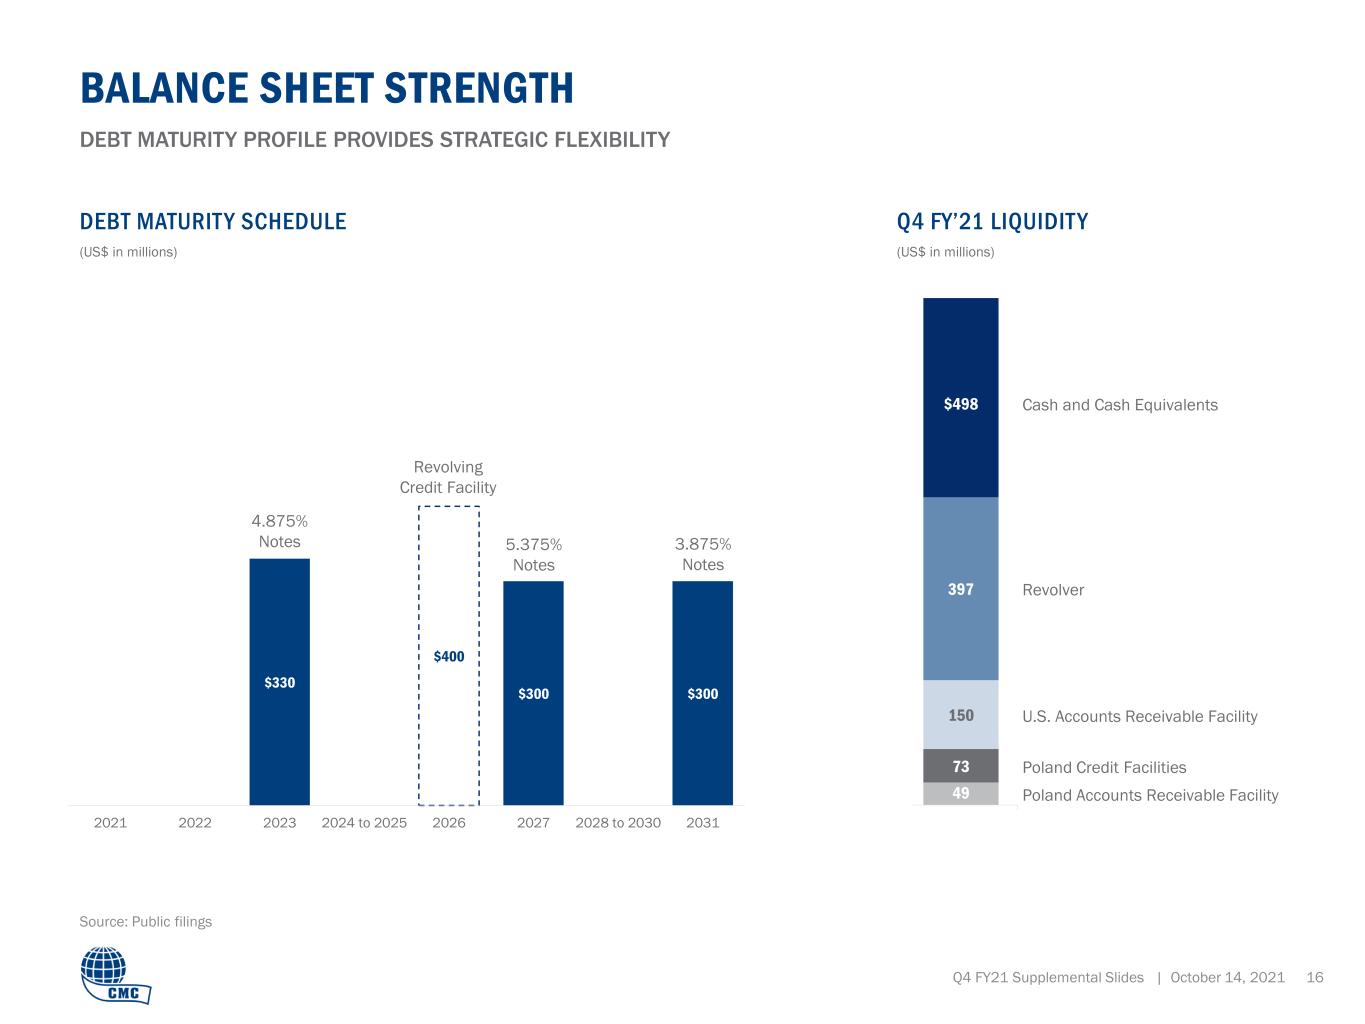
49 73 150 397 $498 $330 $300 $300 $400 2021 2022 2023 2024 to 2025 2026 2027 2028 to 2030 2031 Revolver BALANCE SHEET STRENGTH U.S. Accounts Receivable Facility Poland Credit Facilities Poland Accounts Receivable Facility (US$ in millions) Revolving Credit Facility 5.375% Notes Cash and Cash Equivalents 4.875% Notes 3.875% Notes DEBT MATURITY PROFILE PROVIDES STRATEGIC FLEXIBILITY DEBT MATURIT Y SCHEDULE Q4 FY’21 LIQUIDIT Y (US$ in millions) Source: Public filings Q4 FY21 Supplemental Slides | October 14, 2021 16


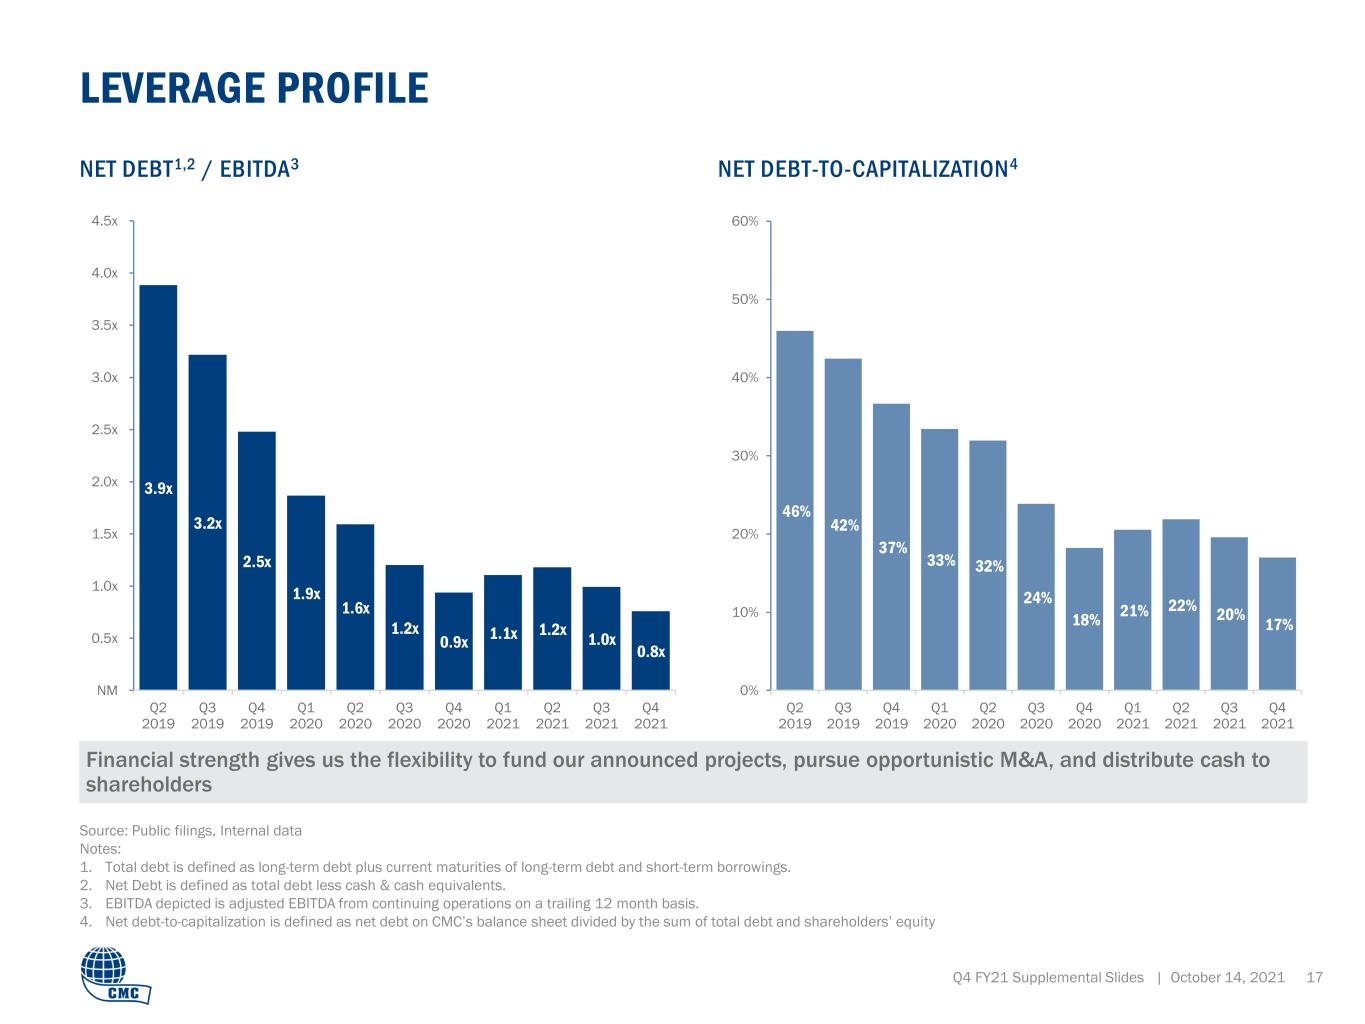
46% 42% 37% 33% 32% 24% 18% 21% 22% 20% 17% 0% 10% 20% 30% 40% 50% 60% Q2 2019 Q3 2019 Q4 2019 Q1 2020 Q2 2020 Q3 2020 Q4 2020 Q1 2021 Q2 2021 Q3 2021 Q4 2021 3.9x 3.2x 2.5x 1.9x 1.6x 1.2x 0.9x 1.1x 1.2x 1.0x 0.8x NM 0.5x 1.0x 1.5x 2.0x 2.5x 3.0x 3.5x 4.0x 4.5x Q2 2019 Q3 2019 Q4 2019 Q1 2020 Q2 2020 Q3 2020 Q4 2020 Q1 2021 Q2 2021 Q3 2021 Q4 2021 Source: Public filings, Internal data Notes: 1. Total debt is defined as long-term debt plus current maturities of long-term debt and short-term borrowings. 2. Net Debt is defined as total debt less cash & cash equivalents. 3. EBITDA depicted is adjusted EBITDA from continuing operations on a trailing 12 month basis. 4. Net debt-to-capitalization is defined as net debt on CMC’s balance sheet divided by the sum of total debt and shareholders’ equity LEVERAGE PROFILE Financial strength gives us the flexibility to fund our announced projects, pursue opportunistic M&A, and distribute cash to shareholders NET DEBT1,2 / EBITDA3 Q4 FY21 Supplemental Slides | October 14, 2021 17 NET DEBT-TO-CAPITALIZATION4


Q4 FY21 Supplemental Slides | October 14, 2021 18 A P P E N D IX : N O N -G A A P R E C O N C IL IA TI O N S


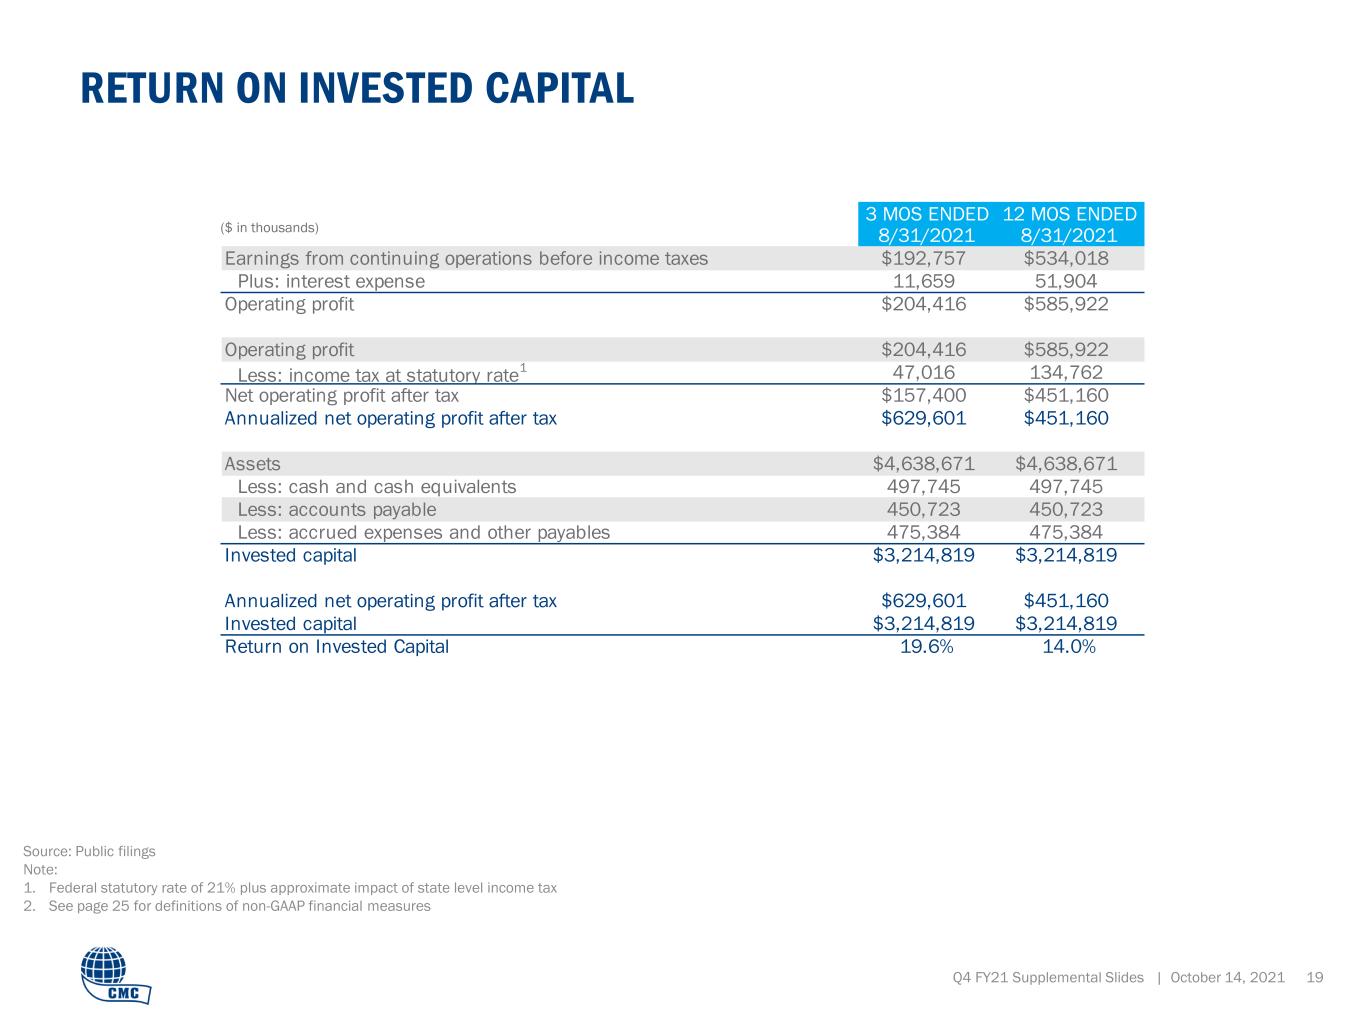
RETURN ON INVESTED CAPITAL Q4 FY21 Supplemental Slides | October 14, 2021 19 ($ in thousands) Source: Public filings Note: 1. Federal statutory rate of 21% plus approximate impact of state level income tax 2. See page 25 for definitions of non-GAAP financial measures 3 MOS ENDED 12 MOS ENDED 8/31/2021 8/31/2021 Earnings from continuing operations before income taxes $192,757 $534,018 Plus: interest expense 11,659 51,904 Operating profit $204,416 $585,922 Operating profit $204,416 $585,922 Less: income tax at statutory rate 1 47,016 134,762 Net operating profit after tax $157,400 $451,160 Annualized net operating profit after tax $629,601 $451,160 Assets $4,638,671 $4,638,671 Less: cash and cash equivalents 497,745 497,745 Less: accounts payable 450,723 450,723 Less: accrued expenses and other payables 475,384 475,384 Invested capital $3,214,819 $3,214,819 Annualized net operating profit after tax $629,601 $451,160 Invested capital $3,214,819 $3,214,819 Return on Invested Capital 19.6% 14.0%


ADJUSTED AND CORE EBITDA FROM CONTINUING OPERATIONS RECONCILIATION Q4 FY21 Supplemental Slides | October 14, 2021 20 Source: Public filings Notes: 1. Net of interest, taxes, depreciation and amortization, impairments, and non-cash equity compensation 2. See page 25 for definitions of non-GAAP financial measures ($ in thousands) THREE MONTHS ENDED TWELVE MONTHS ENDED 08/31/2021 5/31/2021 2/28/2021 11/30/2020 8/31/2020 5/31/2020 08/31/2021 8/31/2020 8/31/2019 8/31/2018 8/31/2017 Earnings from continuing operations $152,313 $130,408 $66,233 $63,911 $67,782 $64,169 $412,865 $278,302 $198,779 $135,237 $50,175 Interest expense 11,659 11,965 14,021 14,259 13,962 15,409 51,904 61,837 71,373 40,957 44,151 Income taxes 40,444 38,175 20,941 21,593 18,495 23,804 121,153 92,476 69,681 30,147 15,276 Depreciation and amortization 42,437 41,804 41,573 41,799 41,654 41,765 167,613 165,749 158,653 131,508 124,490 Amortization of acquired unfavorable contract backlog (1,495) (1,508) (1,509) (1,523) (10,691) (4,348) (6,035) (29,367) (74,784) — — Asset impairments 2,439 277 474 3,594 1,098 5,983 6,784 7,611 384 14,372 1,730 Adjusted EBITDA from continuing operations2 $247,797 $221,121 $141,733 $143,633 $132,300 $146,782 $754,284 $576,608 $424,086 $352,221 $235,822 Loss on debt extinguishment — — 16,841 — 1,778 — 16,841 1,778 — — 22,672 Non-cash equity compensation 8,119 13,800 12,696 9,062 9,875 6,170 43,677 31,850 25,106 24,038 21,469 Gain on sale of assets — (4,457) (5,877) — — — (10,334) — — — — Facility closure — — 5,694 5,214 2,903 1,863 10,908 11,105 — — — Acquisition settlement — — — — 32,123 — — 32,123 — — — Labor cost government refund — — — (1,348) (2,985) — (1,348) (2,985) — — — Acquisition and integration related costs and other — — — — — — — — 41,958 25,507 — Purchase accounting effect on inventory — — — — — — — — 10,315 — — Mill operational start-up costs1 — — — — — — — — — 13,471 — CMC Steel Oklahoma incentives — — — — — — — — — (3,000) — Severance — — — — — — — — — — 8,129 Core EBITDA from continuing operations2 $255,916 $230,464 $171,087 $156,561 $175,994 $154,815 $814,028 $650,479 $501,465 $412,237 $288,092


($ in thousands) THREE MONTHS ENDED TWELVE MONTHS ENDED 08/31/2021 5/31/2021 2/28/2021 11/30/2020 8/31/2020 5/31/2020 08/31/2021 8/31/2020 8/31/2019 8/31/2018 8/31/2017 Earnings from continuing operations $152,313 $130,408 $66,233 $63,911 $67,782 $64,169 $412,865 $278,302 $198,779 $135,237 $50,175 Loss on debt extinguishment — — 16,841 — 1,778 — 16,841 1,778 — — 17,799 Gain on sale of assets — (4,457) (5,877) — — — (10,334) — — — — Facility closure — — 5,694 5,214 2,903 1,863 10,908 11,105 — — — Asset impairments 2,439 277 474 3,594 1,098 5,983 6,784 7,081 — 12,136 — Labor cost government refund — — — (1,348) (2,985) — (1,348) (2,985) — — — Acquisition settlement — — — — 32,123 — — 32,123 — — — Acquisition and integration related costs and other — — — — — — — — 41,958 25,507 — Purchase accounting effect on inventory — — — — — — — — 10,315 — — Mill operational start-up costs — — — — — — — — — 18,016 — CMC Steel Oklahoma incentives — — — — — — — — — (3,000) — Severance — — — — — — — — — — 8,129 Total adjustments (pre-tax) $2,439 $(4,180) $17,132 $7,460 $34,917 $7,846 $22,851 $49,102 $52,273 $52,659 $25,928 Tax Impact TCJA impact — — — — — — — — 7,550 10,600 — International reorganization — — — — — — — — — (9,200) — Related tax effects on adjustments (512) 878 (3,598) (1,593) (7,392) (1,648) (4,825) (10,371) (10,977) (13,236) (9,075) Related tax effects on adjustments $(512) $878 $(3,598) $(1,593) $(7,392) $(1,648) $(4,825) $(10,371) $(3,427) $(11,836) $(9,075) Adjusted earnings from continuing operations1 $154,240 $127,106 $79,767 $69,778 $95,307 $70,367 $430,891 $317,033 $247,625 $176,060 $67,028 Average diluted shares outstanding (thousands) 122,376 122,194 121,752 121,128 120,645 120,279 121,983 120,310 119,125 118,146 117,364 Adjusted earnings from continuing operations per diluted share $1.26 $1.04 $0.66 $0.58 $0.79 $0.59 $3.53 $2.64 $2.08 $1.49 $0.57 ADJUSTED EARNINGS FROM CONTINUING OPERATIONS RECONCILIATION Q4 FY21 Supplemental Slides | October 14, 2021 21 Source: Public filings Notes: 1. See page 25 for definitions of non-GAAP financial measures


ADJUSTED SEGMENT EBITDA MARGIN Q4 FY21 Supplemental Slides | October 14, 2021 22 Source: Public filings ($ in thousands) 3 MONTHS ENDED 12 MONTHS ENDED 08/31/2021 5/31/2021 2/28/2021 11/30/2020 8/31/2020 08/31/2021 8/31/2020 8/31/2019 North America Adjusted EBITDA from continuing operations $212,018 $207,330 $171,612 $155,634 $174,219 $746,594 $661,176 $456,296 North America net sales 1,660,409 1,558,068 1,257,486 1,195,013 1,224,849 5,670,976 4,769,933 5,001,116 North America Adjusted EBITDA Margin 12.8% 13.3% 13.6% 13.0% 14.2% 13.2% 13.9% 9.1% Europe Adjusted EBITDA from continuing operations $67,676 $50,005 $16,107 $14,470 $22,927 $148,258 $62,007 $100,102 Europe net sales 368,290 284,107 202,066 194,596 179,855 1,049,059 699,140 817,048 Europe Adjusted EBITDA Margin 18.4% 17.6% 8.0% 7.4% 12.7% 14.1% 8.9% 12.3%


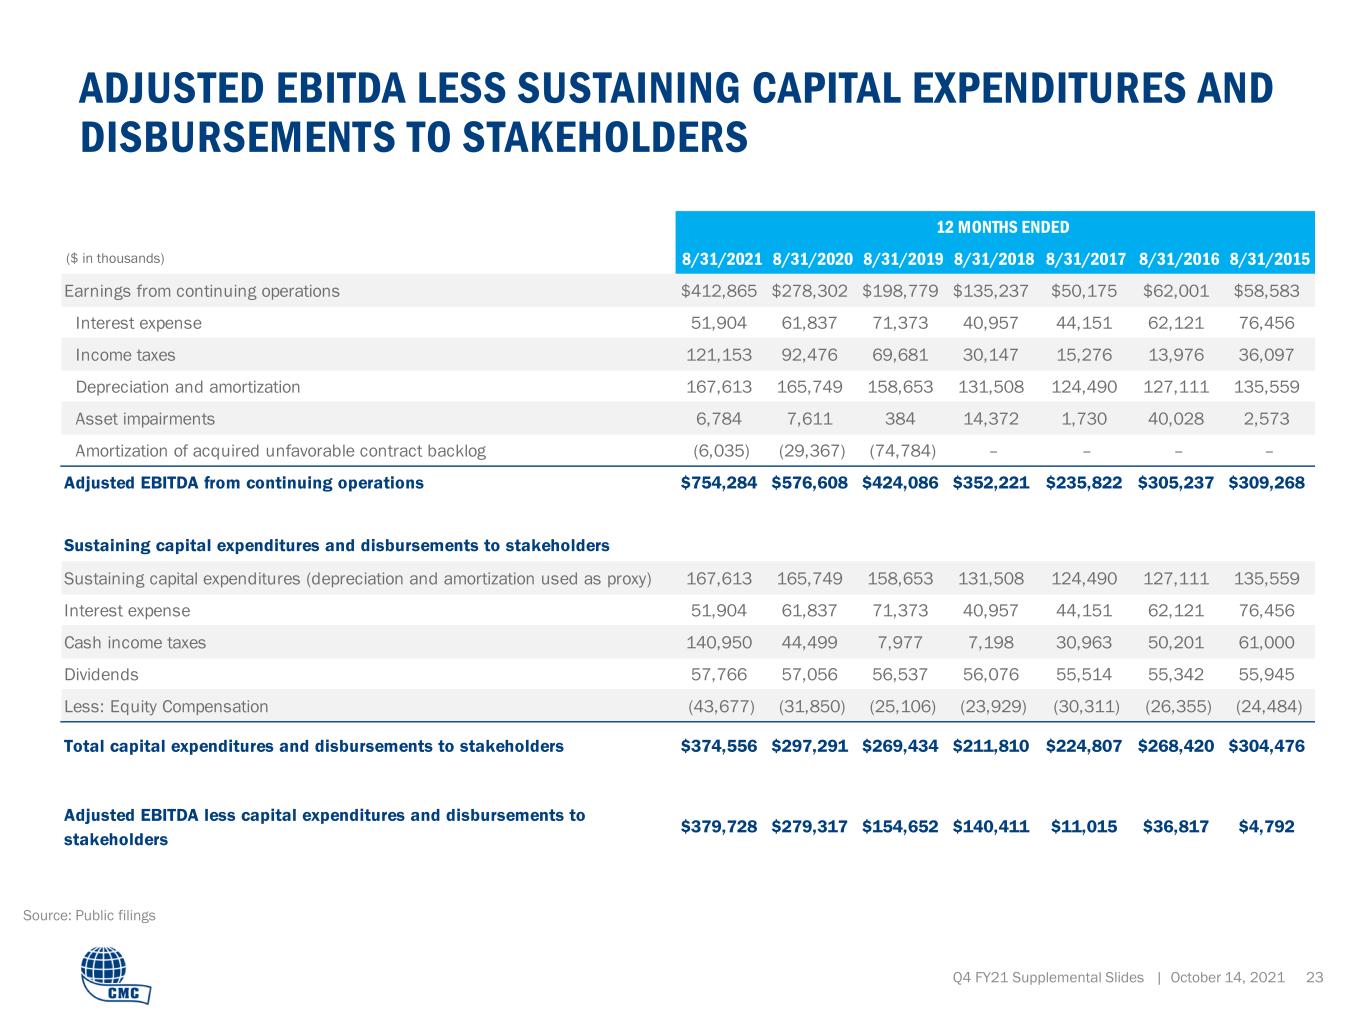
12 MONTHS ENDED 9 MONTHS ENDED 8/31/2021 8/31/2020 8/31/2019 8/31/2018 8/31/2017 8/31/2016 8/31/2015 Earnings from continuing operations $412,865 $278,302 $198,779 $135,237 $50,175 $62,001 $58,583 Interest expense 51,904 61,837 71,373 40,957 44,151 62,121 76,456 Income taxes 121,153 92,476 69,681 30,147 15,276 13,976 36,097 Depreciation and amortization 167,613 165,749 158,653 131,508 124,490 127,111 135,559 Asset impairments 6,784 7,611 384 14,372 1,730 40,028 2,573 Amortization of acquired unfavorable contract backlog (6,035) (29,367) (74,784) – – – – Adjusted EBITDA from continuing operations $754,284 $576,608 $424,086 $352,221 $235,822 $305,237 $309,268 Sustaining capital expenditures (depreciation and amortization used as proxy) 167,613 165,749 158,653 131,508 124,490 127,111 135,559 Interest expense 51,904 61,837 71,373 40,957 44,151 62,121 76,456 Cash income taxes 140,950 44,499 7,977 7,198 30,963 50,201 61,000 Dividends 57,766 57,056 56,537 56,076 55,514 55,342 55,945 Less: Equity Compensation (43,677) (31,850) (25,106) (23,929) (30,311) (26,355) (24,484) Total capital expenditures and disbursements to stakeholders $374,556 $297,291 $269,434 $211,810 $224,807 $268,420 $304,476 Adjusted EBITDA less capital expenditures and disbursements to stakeholders $379,728 $279,317 $154,652 $140,411 $11,015 $36,817 $4,792 Sustaining capital expenditures and disbursements to stakeholders ADJUSTED EBITDA LESS SUSTAINING CAPITAL EXPENDITURES AND DISBURSEMENTS TO STAKEHOLDERS Q4 FY21 Supplemental Slides | October 14, 2021 23 ($ in thousands) Source: Public filings


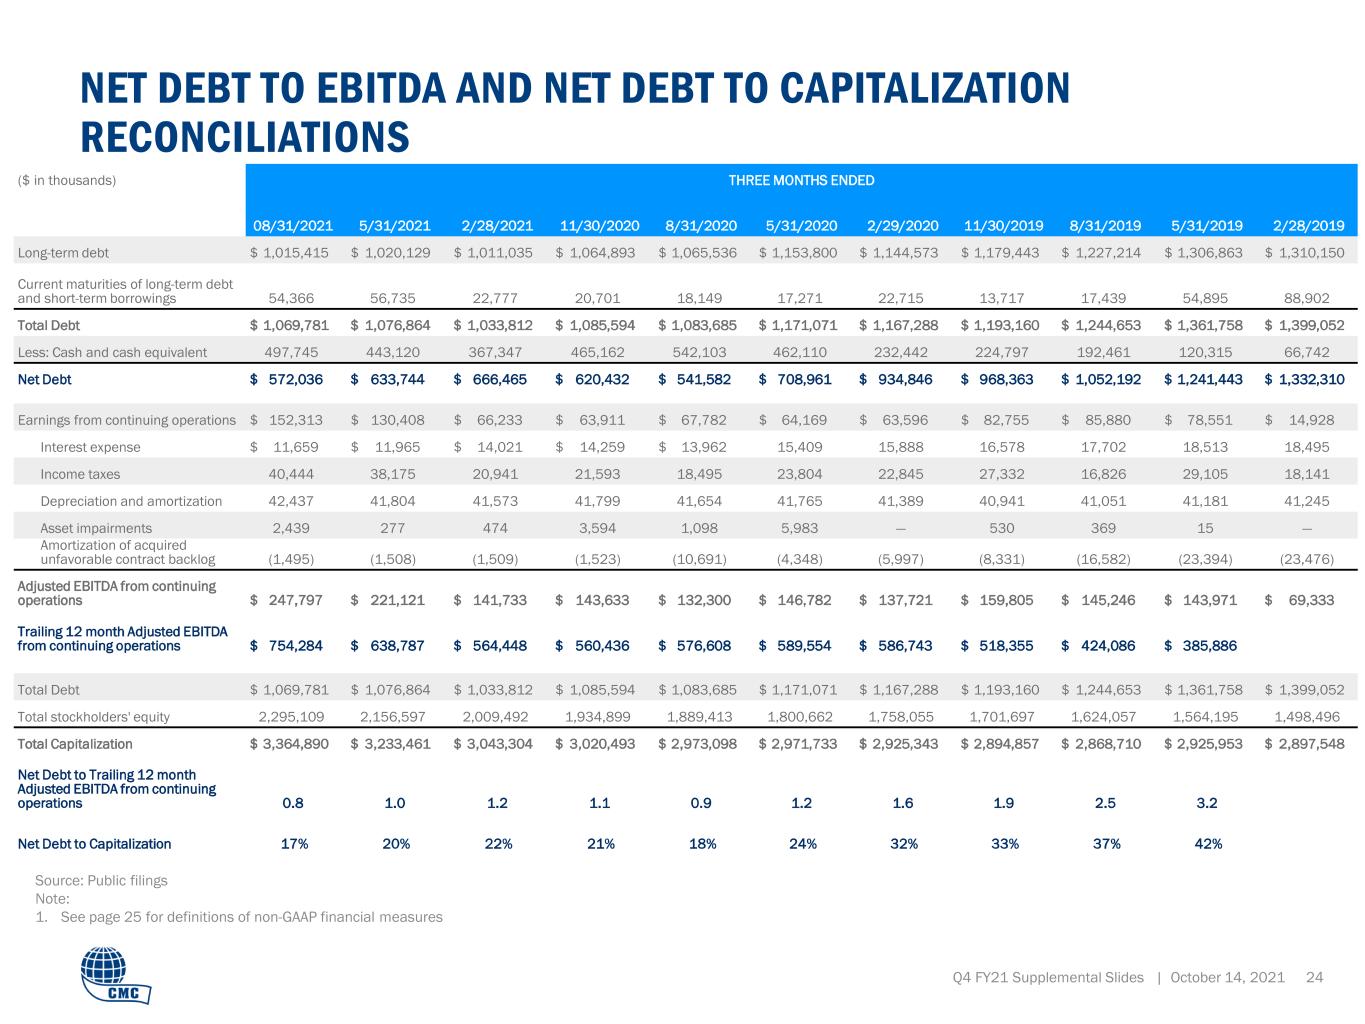
Source: Public filings Note: 1. See page 25 for definitions of non-GAAP financial measures NET DEBT TO EBITDA AND NET DEBT TO CAPITALIZATION RECONCILIATIONS Q4 FY21 Supplemental Slides | October 14, 2021 24 ($ in thousands) THREE MONTHS ENDED 08/31/2021 5/31/2021 2/28/2021 11/30/2020 8/31/2020 5/31/2020 2/29/2020 11/30/2019 8/31/2019 5/31/2019 2/28/2019 Long-term debt $ 1,015,415 $ 1,020,129 $ 1,011,035 $ 1,064,893 $ 1,065,536 $ 1,153,800 $ 1,144,573 $ 1,179,443 $ 1,227,214 $ 1,306,863 $ 1,310,150 Current maturities of long-term debt and short-term borrowings 54,366 56,735 22,777 20,701 18,149 17,271 22,715 13,717 17,439 54,895 88,902 Total Debt $ 1,069,781 $ 1,076,864 $ 1,033,812 $ 1,085,594 $ 1,083,685 $ 1,171,071 $ 1,167,288 $ 1,193,160 $ 1,244,653 $ 1,361,758 $ 1,399,052 Less: Cash and cash equivalent 497,745 443,120 367,347 465,162 542,103 462,110 232,442 224,797 192,461 120,315 66,742 Net Debt $ 572,036 $ 633,744 $ 666,465 $ 620,432 $ 541,582 $ 708,961 $ 934,846 $ 968,363 $ 1,052,192 $ 1,241,443 $ 1,332,310 Earnings from continuing operations $ 152,313 $ 130,408 $ 66,233 $ 63,911 $ 67,782 $ 64,169 $ 63,596 $ 82,755 $ 85,880 $ 78,551 $ 14,928 Interest expense $ 11,659 $ 11,965 $ 14,021 $ 14,259 $ 13,962 15,409 15,888 16,578 17,702 18,513 18,495 Income taxes 40,444 38,175 20,941 21,593 18,495 23,804 22,845 27,332 16,826 29,105 18,141 Depreciation and amortization 42,437 41,804 41,573 41,799 41,654 41,765 41,389 40,941 41,051 41,181 41,245 Asset impairments 2,439 277 474 3,594 1,098 5,983 — 530 369 15 — Amortization of acquired unfavorable contract backlog (1,495) (1,508) (1,509) (1,523) (10,691) (4,348) (5,997) (8,331) (16,582) (23,394) (23,476) Adjusted EBITDA from continuing operations $ 247,797 $ 221,121 $ 141,733 $ 143,633 $ 132,300 $ 146,782 $ 137,721 $ 159,805 $ 145,246 $ 143,971 $ 69,333 Trailing 12 month Adjusted EBITDA from continuing operations $ 754,284 $ 638,787 $ 564,448 $ 560,436 $ 576,608 $ 589,554 $ 586,743 $ 518,355 $ 424,086 $ 385,886 Total Debt $ 1,069,781 $ 1,076,864 $ 1,033,812 $ 1,085,594 $ 1,083,685 $ 1,171,071 $ 1,167,288 $ 1,193,160 $ 1,244,653 $ 1,361,758 $ 1,399,052 Total stockholders' equity 2,295,109 2,156,597 2,009,492 1,934,899 1,889,413 1,800,662 1,758,055 1,701,697 1,624,057 1,564,195 1,498,496 Total Capitalization $ 3,364,890 $ 3,233,461 $ 3,043,304 $ 3,020,493 $ 2,973,098 $ 2,971,733 $ 2,925,343 $ 2,894,857 $ 2,868,710 $ 2,925,953 $ 2,897,548 Net Debt to Trailing 12 month Adjusted EBITDA from continuing operations 0.8 1.0 1.2 1.1 0.9 1.2 1.6 1.9 2.5 3.2 Net Debt to Capitalization 17% 20% 22% 21% 18% 24% 32% 33% 37% 42%


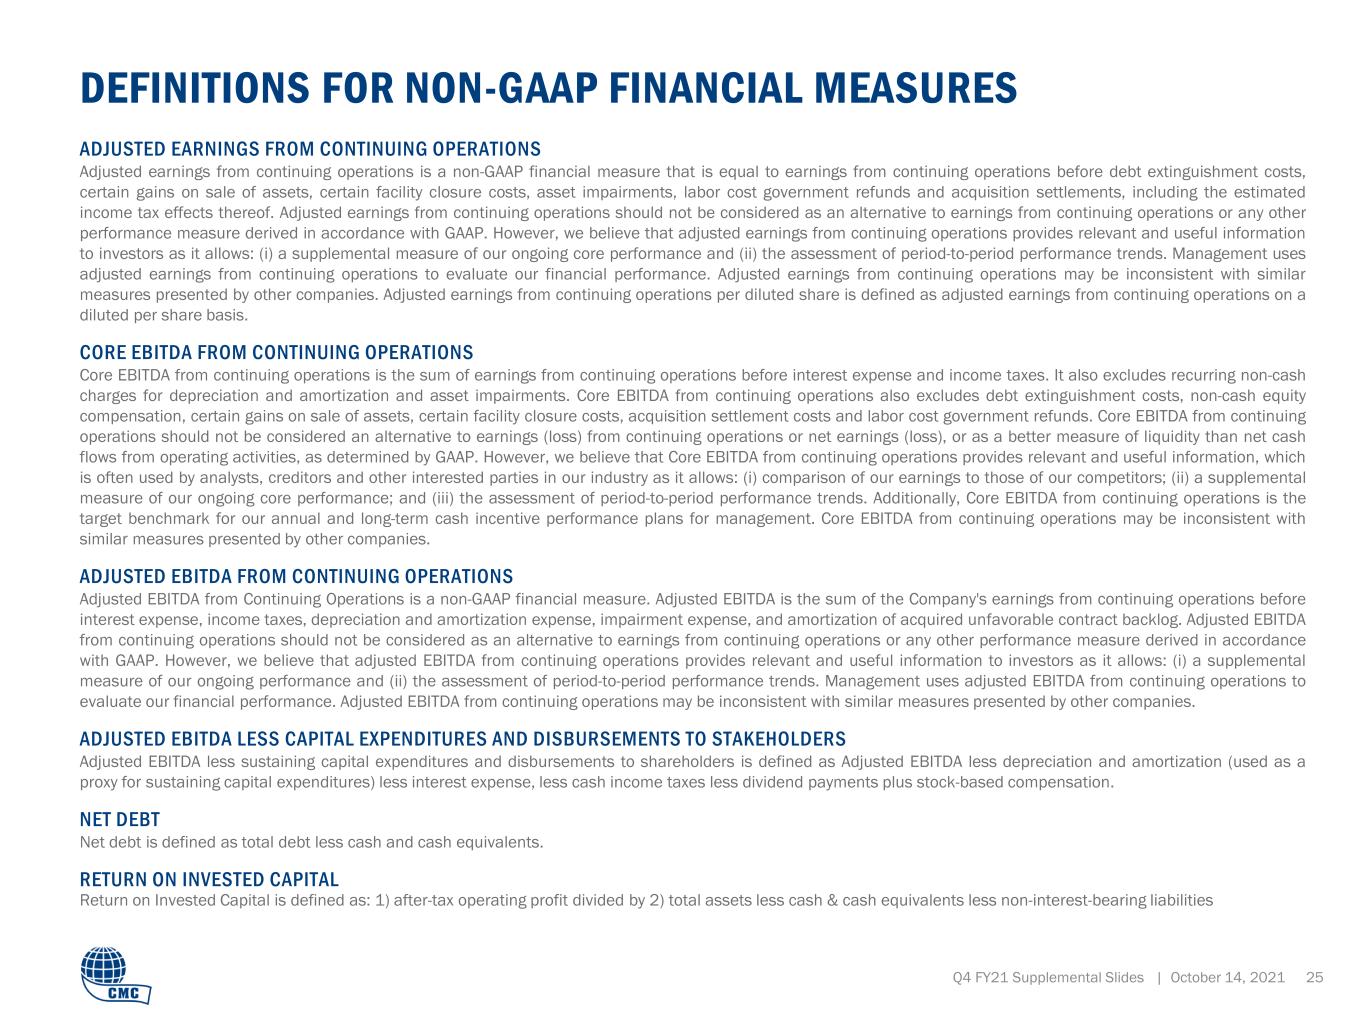
DEFINITIONS FOR NON-GAAP FINANCIAL MEASURES ADJUSTED EARNINGS FROM CONTINUING OPERATIONS Adjusted earnings from continuing operations is a non-GAAP financial measure that is equal to earnings from continuing operations before debt extinguishment costs, certain gains on sale of assets, certain facility closure costs, asset impairments, labor cost government refunds and acquisition settlements, including the estimated income tax effects thereof. Adjusted earnings from continuing operations should not be considered as an alternative to earnings from continuing operations or any other performance measure derived in accordance with GAAP. However, we believe that adjusted earnings from continuing operations provides relevant and useful information to investors as it allows: (i) a supplemental measure of our ongoing core performance and (ii) the assessment of period-to-period performance trends. Management uses adjusted earnings from continuing operations to evaluate our financial performance. Adjusted earnings from continuing operations may be inconsistent with similar measures presented by other companies. Adjusted earnings from continuing operations per diluted share is defined as adjusted earnings from continuing operations on a diluted per share basis. CORE EBITDA FROM CONTINUING OPERATIONS Core EBITDA from continuing operations is the sum of earnings from continuing operations before interest expense and income taxes. It also excludes recurring non-cash charges for depreciation and amortization and asset impairments. Core EBITDA from continuing operations also excludes debt extinguishment costs, non-cash equity compensation, certain gains on sale of assets, certain facility closure costs, acquisition settlement costs and labor cost government refunds. Core EBITDA from continuing operations should not be considered an alternative to earnings (loss) from continuing operations or net earnings (loss), or as a better measure of liquidity than net cash flows from operating activities, as determined by GAAP. However, we believe that Core EBITDA from continuing operations provides relevant and useful information, which is often used by analysts, creditors and other interested parties in our industry as it allows: (i) comparison of our earnings to those of our competitors; (ii) a supplemental measure of our ongoing core performance; and (iii) the assessment of period-to-period performance trends. Additionally, Core EBITDA from continuing operations is the target benchmark for our annual and long-term cash incentive performance plans for management. Core EBITDA from continuing operations may be inconsistent with similar measures presented by other companies. ADJUSTED EBITDA FROM CONTINUING OPERATIONS Adjusted EBITDA from Continuing Operations is a non-GAAP financial measure. Adjusted EBITDA is the sum of the Company's earnings from continuing operations before interest expense, income taxes, depreciation and amortization expense, impairment expense, and amortization of acquired unfavorable contract backlog. Adjusted EBITDA from continuing operations should not be considered as an alternative to earnings from continuing operations or any other performance measure derived in accordance with GAAP. However, we believe that adjusted EBITDA from continuing operations provides relevant and useful information to investors as it allows: (i) a supplemental measure of our ongoing performance and (ii) the assessment of period-to-period performance trends. Management uses adjusted EBITDA from continuing operations to evaluate our financial performance. Adjusted EBITDA from continuing operations may be inconsistent with similar measures presented by other companies. ADJUSTED EBITDA LESS CAPITAL EXPENDITURES AND DISBURSEMENTS TO STAKEHOLDERS Adjusted EBITDA less sustaining capital expenditures and disbursements to shareholders is defined as Adjusted EBITDA less depreciation and amortization (used as a proxy for sustaining capital expenditures) less interest expense, less cash income taxes less dividend payments plus stock-based compensation. NET DEBT Net debt is defined as total debt less cash and cash equivalents. RETURN ON INVESTED CAPITAL Return on Invested Capital is defined as: 1) after-tax operating profit divided by 2) total assets less cash & cash equivalents less non-interest-bearing liabilities Q4 FY21 Supplemental Slides | October 14, 2021 25


THANK YOU CORPORATE OFFICE 6565 N. MacArthur Blvd Suite 800 Irving, TX 75039 Phone: (214) 689.4300 INVESTOR RELATIONS Phone: (972) 308.5349 Fax: (214) 689.4326 [email protected] Q4 FY21 Supplemental Slides | October 14, 2021 26