EXHIBIT 99.1
News Release
Buffalo, NY 14068
Immediate Release
Columbus McKinnon Blueprint for Growth Strategy Drove Margin Expansion, Earnings Growth and Strong Cash Generation in Third Quarter Fiscal Year 2020
BUFFALO, NY, February 4, 2020 - Columbus McKinnon Corporation (Nasdaq: CMCO), a leading designer, manufacturer and marketer of motion control products, technologies and services for material handling, today announced financial results for its fiscal year 2020 third quarter, which ended December 31, 2019.
Third Quarter Highlights (compared with prior-year period)
• | Blueprint for Growth strategy delivers strong operating results overcoming weaker industrial environment |
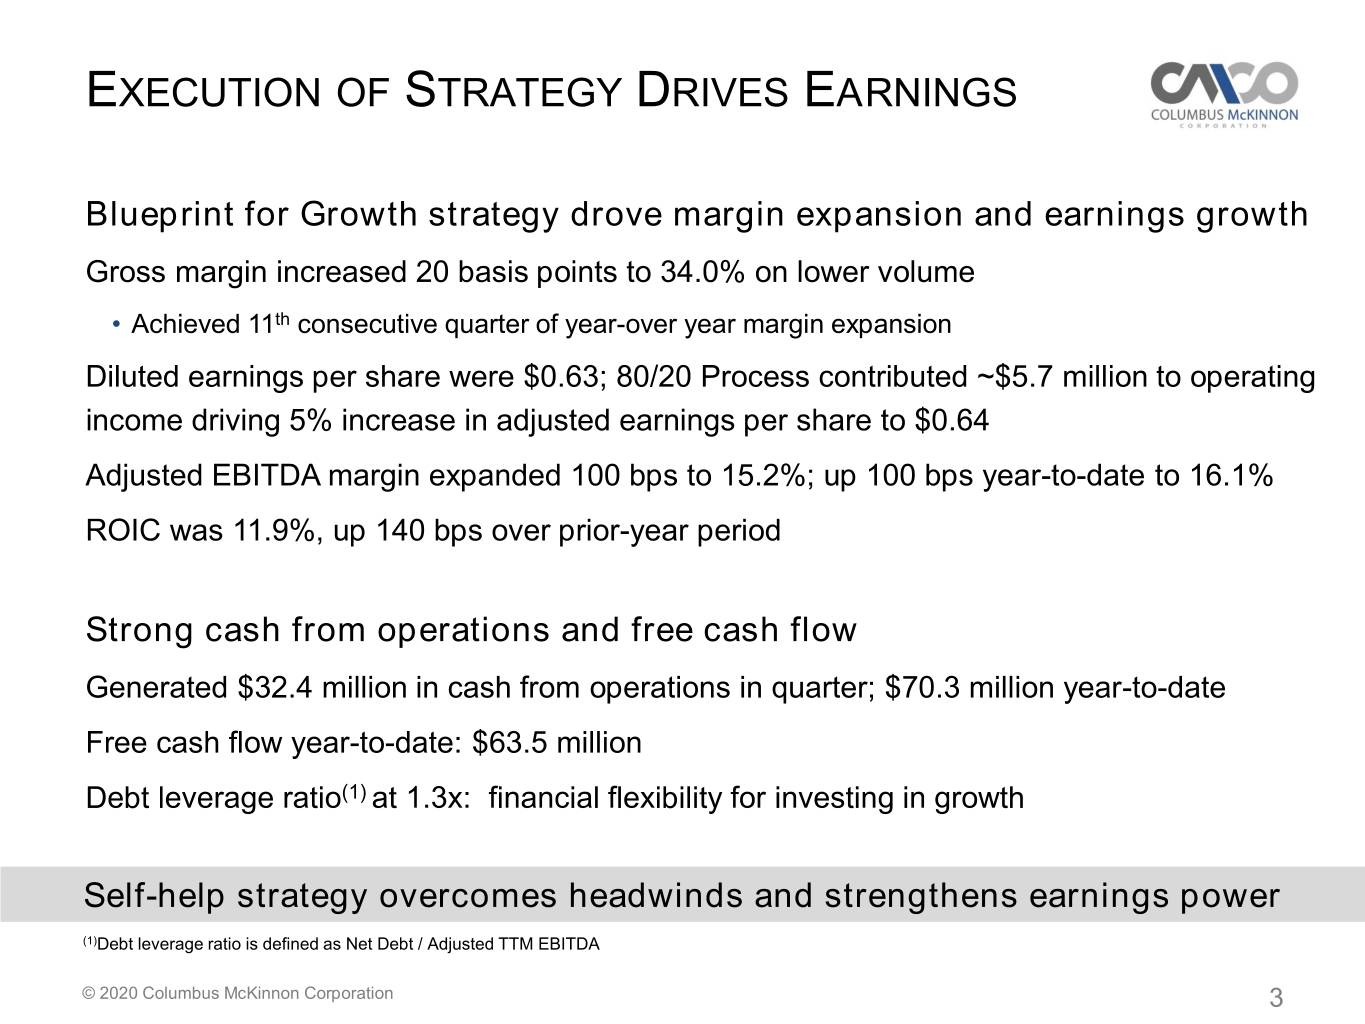
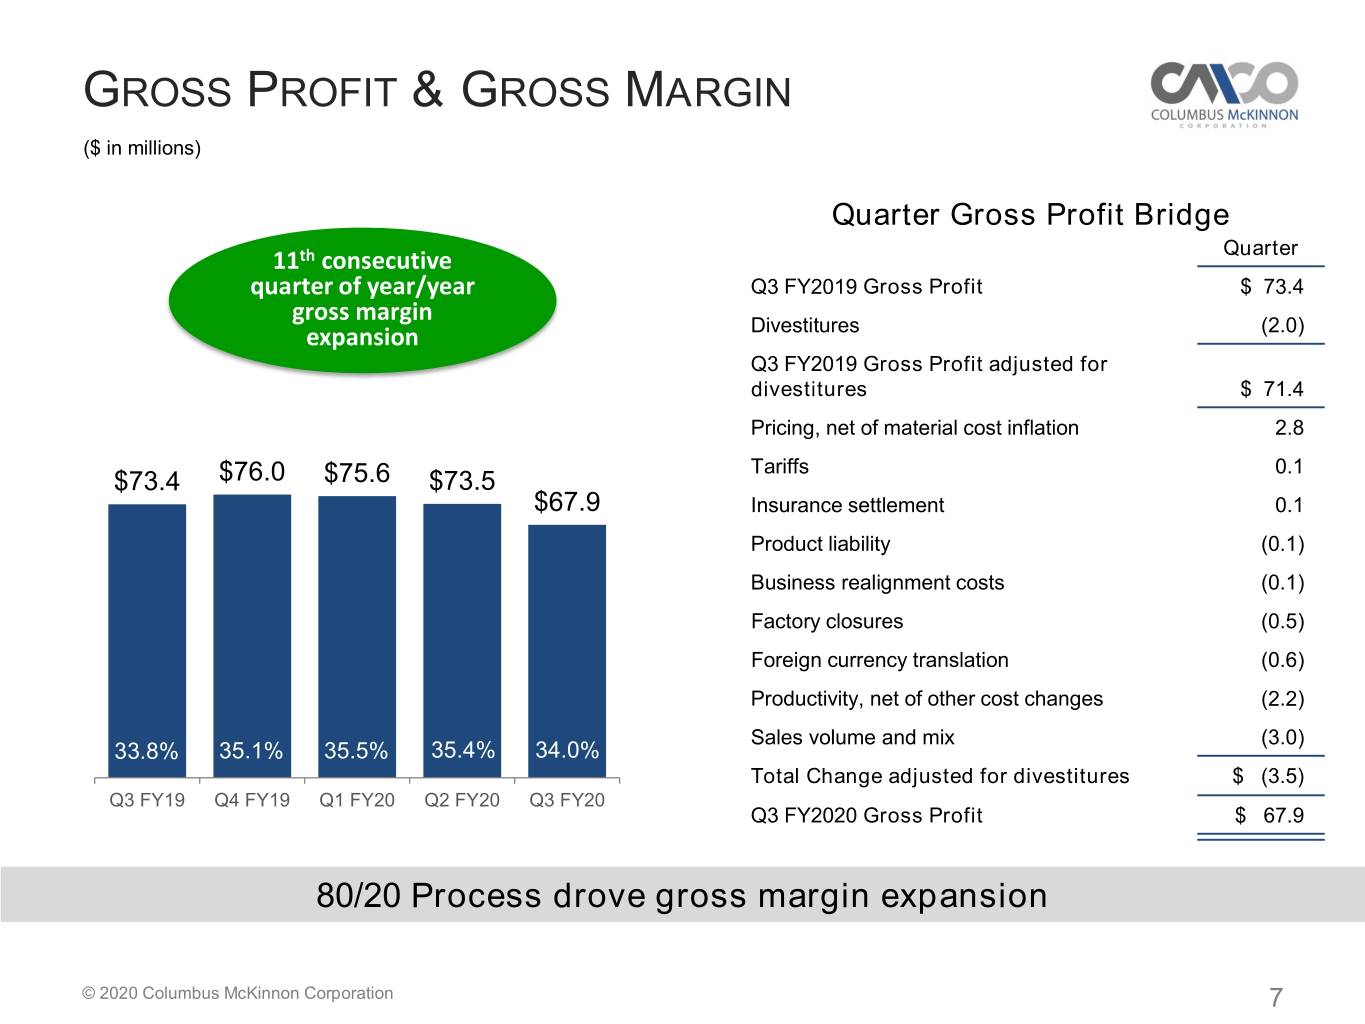
• | Gross margin expanded 20 basis points to 34.0%; Achieved 11th consecutive quarter of year-over-year expansion |
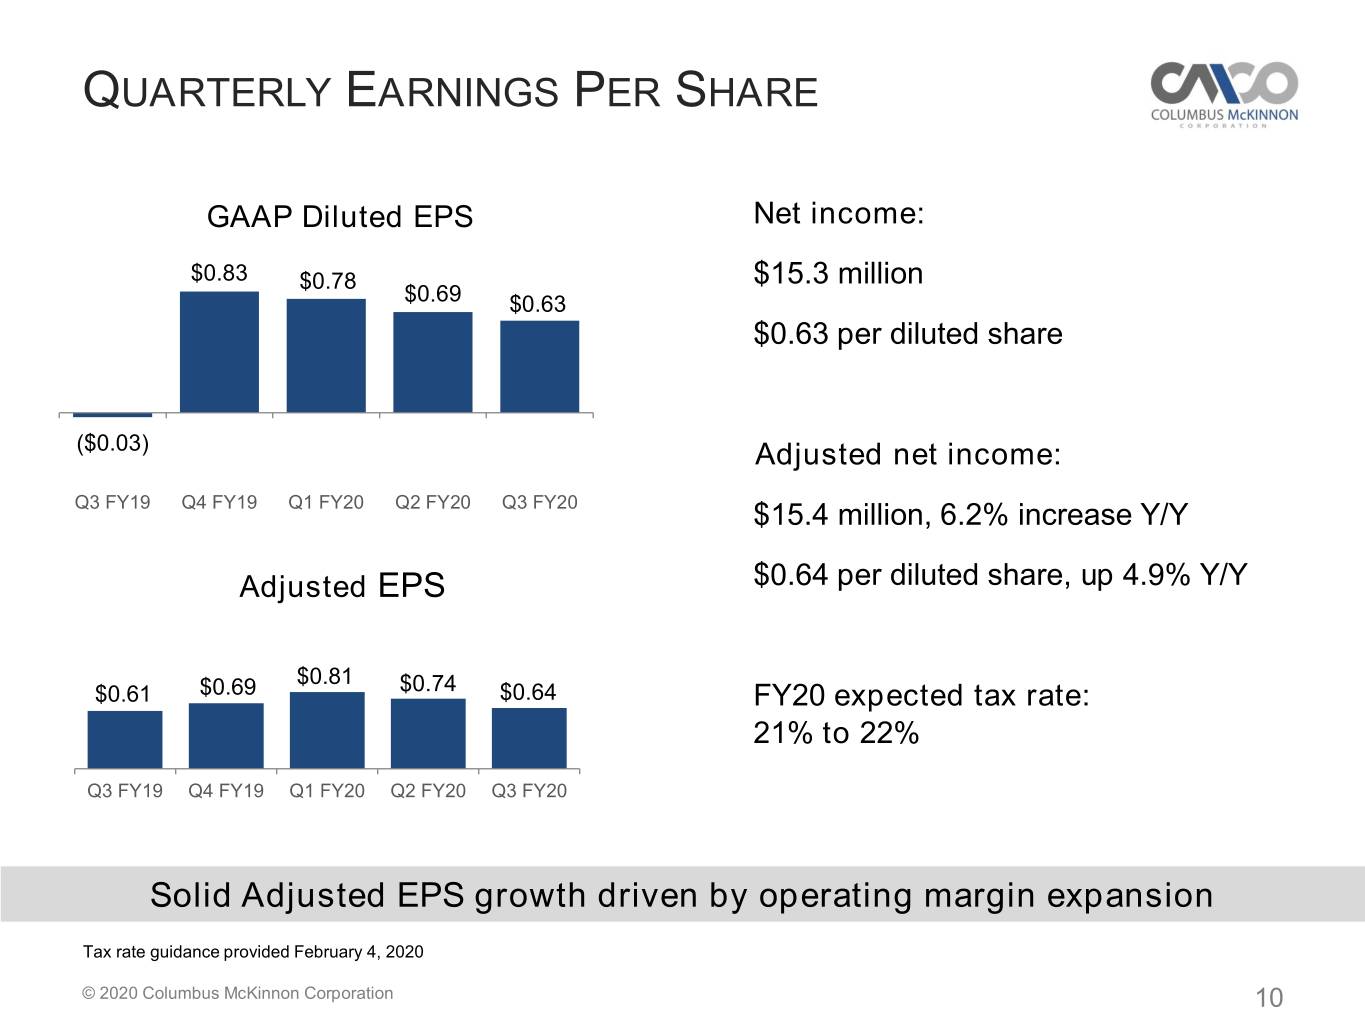
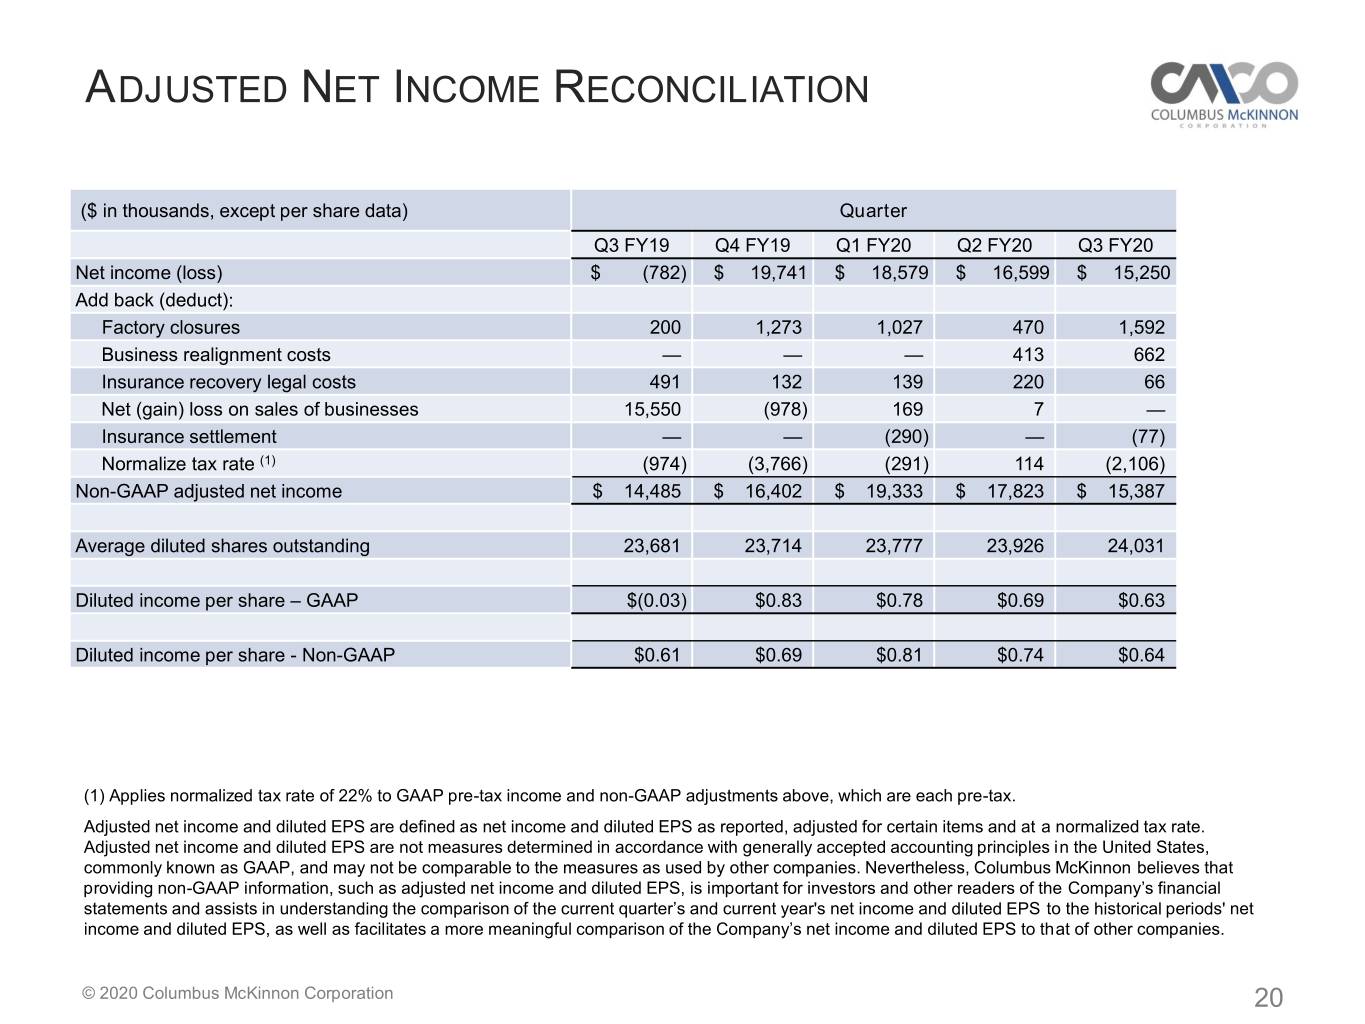
• | Diluted earnings per share was $0.63; adjusted diluted earnings per share increased $0.03 to $0.64 |
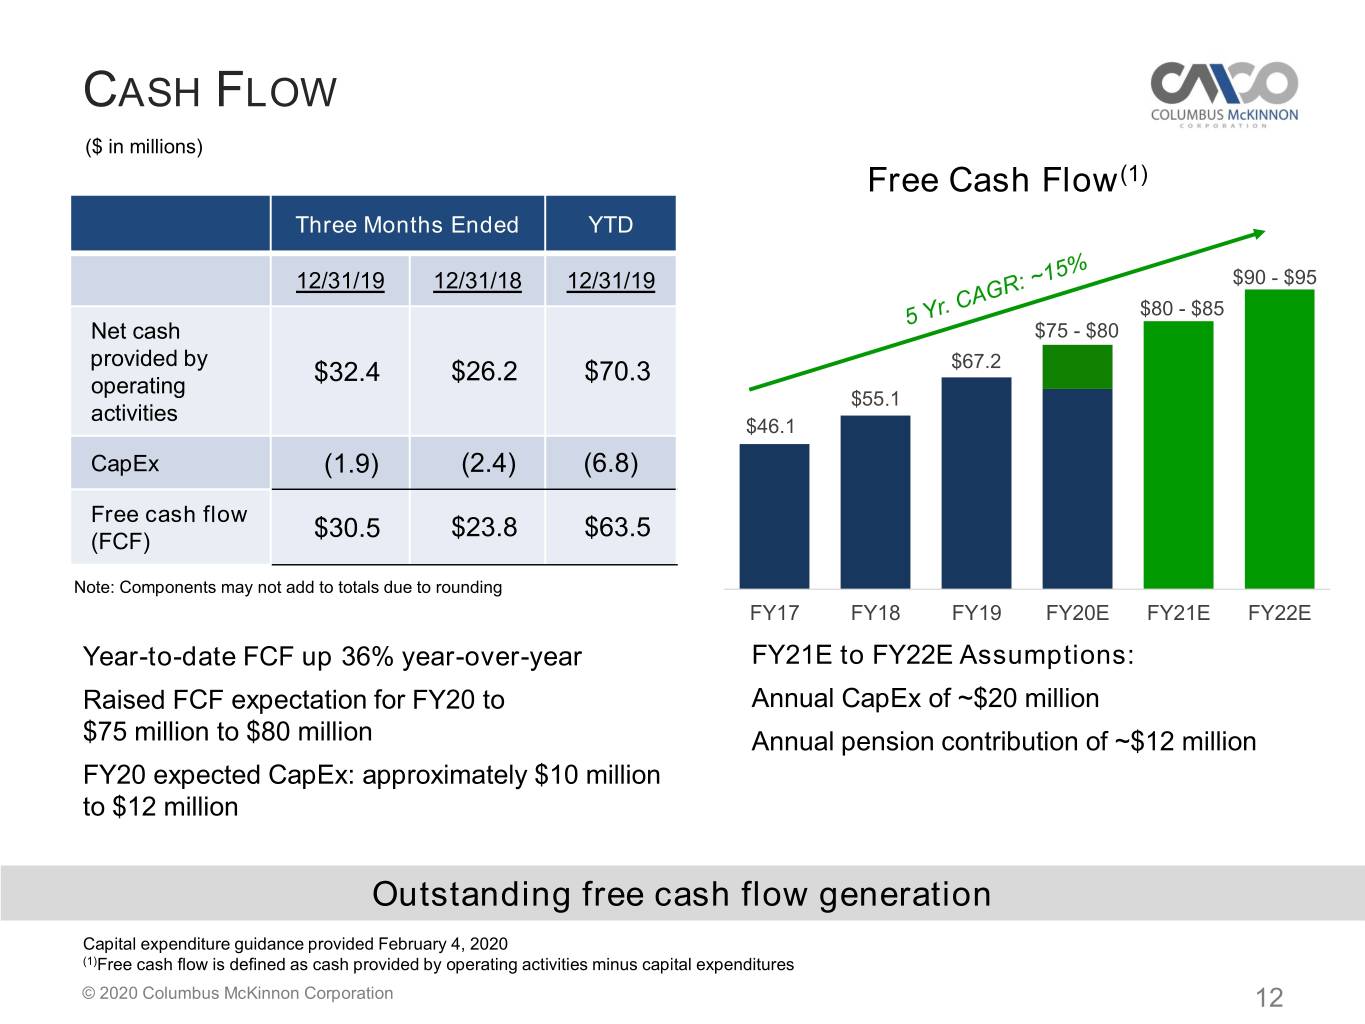
• | Cash from operations increased 24% to $32.4 million for the quarter and was up 31% year-to-date to $70.3 million |
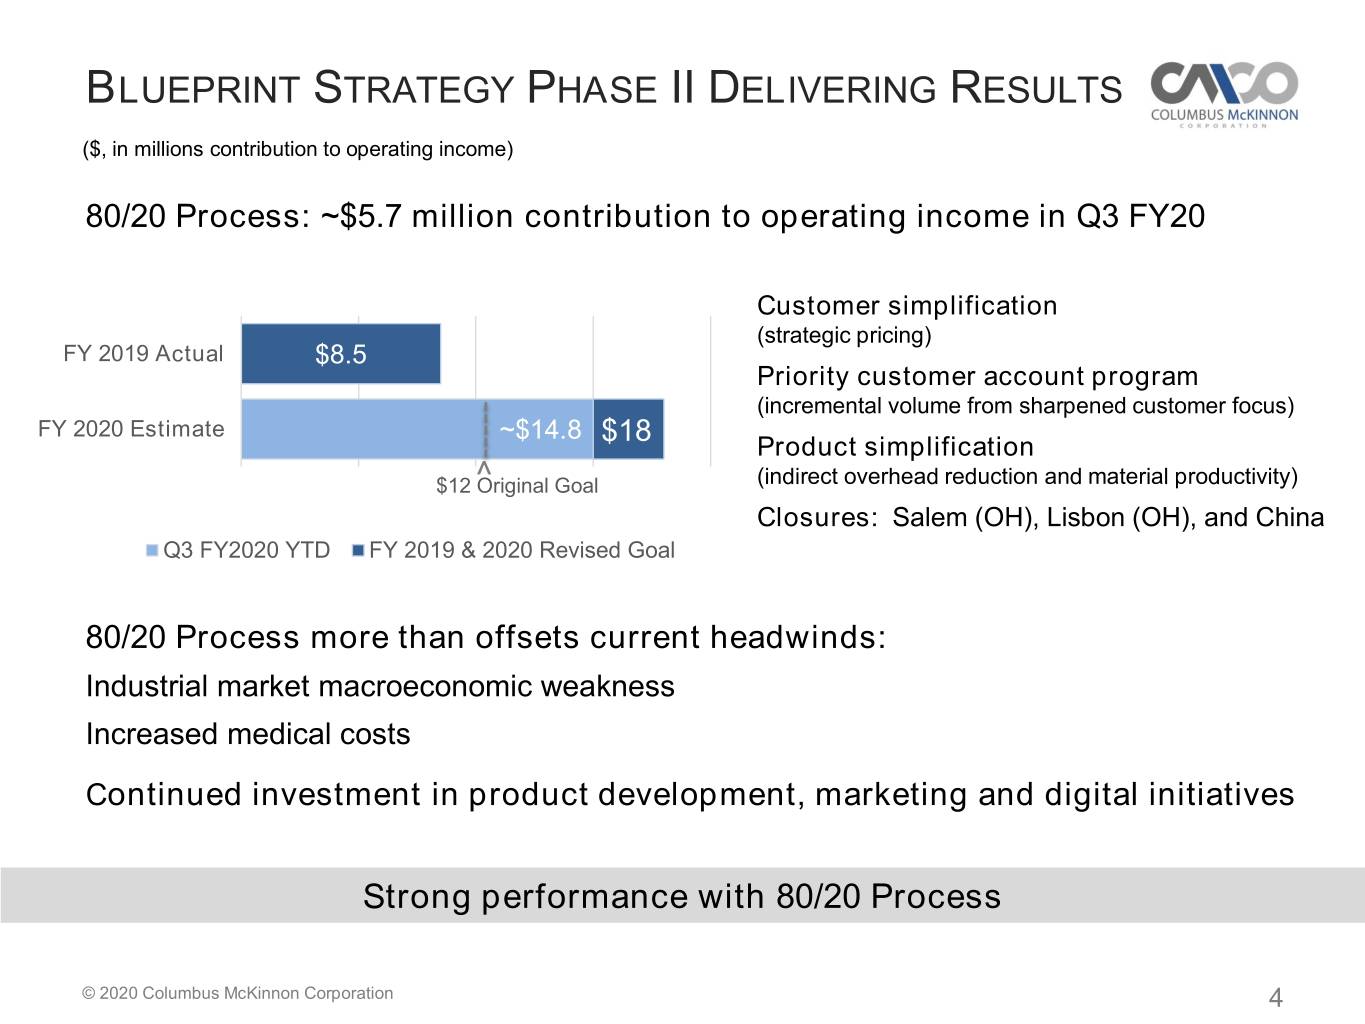
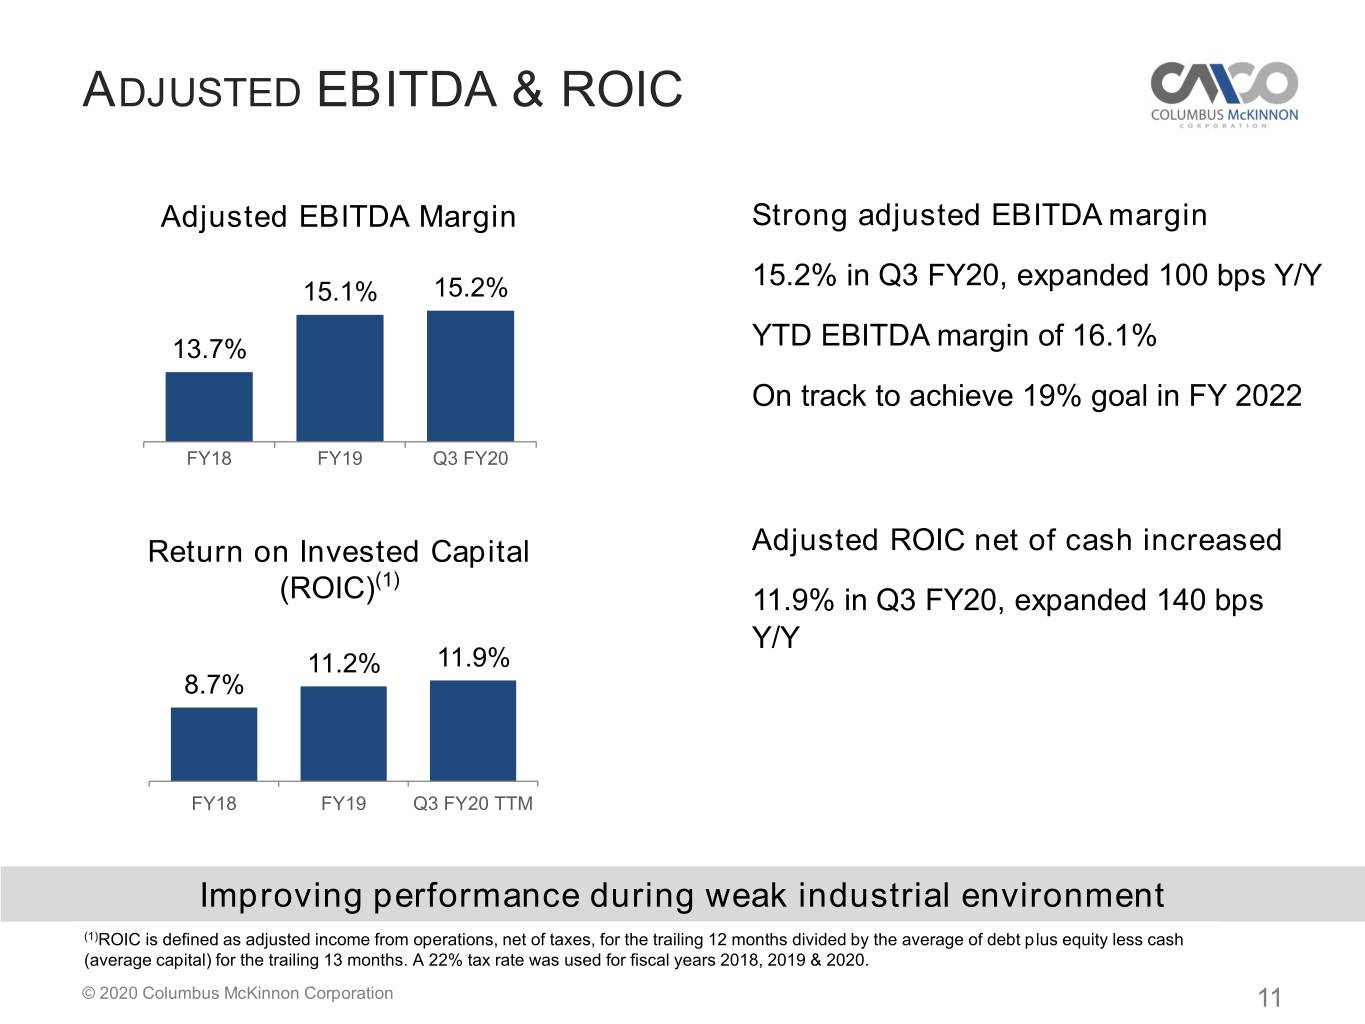
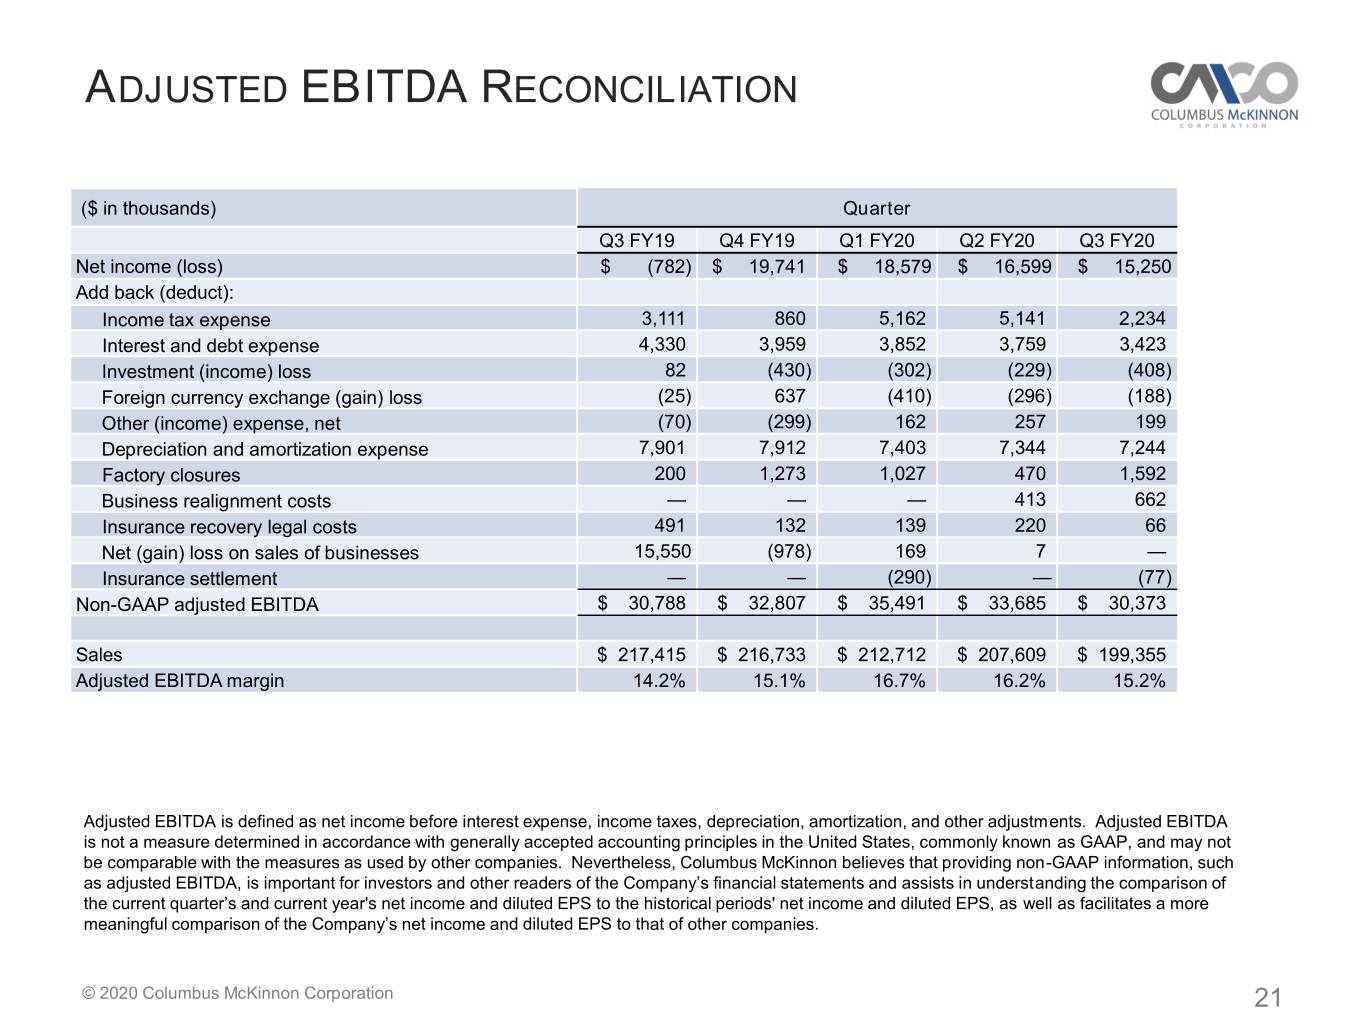
Richard Fleming, Chairman and Interim CEO of Columbus McKinnon, commented, “The successful execution of our Blueprint for Growth strategy continues to deliver solid financial results. The Company demonstrated strengthened earnings power and cash generation during a weaker industrial environment. In fact, the 80/20 Process contributed approximately $5.7 million in operating income in the quarter and EBTIDA margin expanded by 100 basis points to 15.2%, even as revenue declined. This was our 12th consecutive quarter of EBTIDA margin expansion, keeping us on course to achieve our 19% EBTIDA margin goal in fiscal 2022. We also generated over $30 million in free cash flow in the quarter.”
The implementation of our business operating system E-PAS™ (“Earnings Power Acceleration System”) provides the tools needed during tougher markets to compete effectively and operate efficiently. We completed the closure of the facility in China ahead of schedule and are on track for the second facility closure in Ohio to be completed in the first quarter of fiscal 2021. Importantly, we continue to make focused investments in innovation and expand our engineering capabilities.”
Columbus McKinnon Blueprint for Growth Strategy Drove Margin Expansion, Earnings Growth and Strong Cash Generation in Third Quarter Fiscal Year 2020
Page 2 of 13
February 4, 2020
Third Quarter Fiscal 2020 Sales
($ in millions) | Q3 FY 20 | Q3 FY 19 | Change | % Change | ||||||||||
Net sales | $ | 199.4 | $ | 217.4 | $ | (18.1 | ) | (8.3 | )% | |||||
U.S. sales | $ | 108.4 | $ | 116.0 | $ | (7.6 | ) | (6.6 | )% | |||||
% of total | 54 | % | 53 | % | ||||||||||
Non-U.S. sales | $ | 91.0 | $ | 101.4 | $ | (10.4 | ) | (10.3 | )% | |||||
% of total | 46 | % | 47 | % | ||||||||||
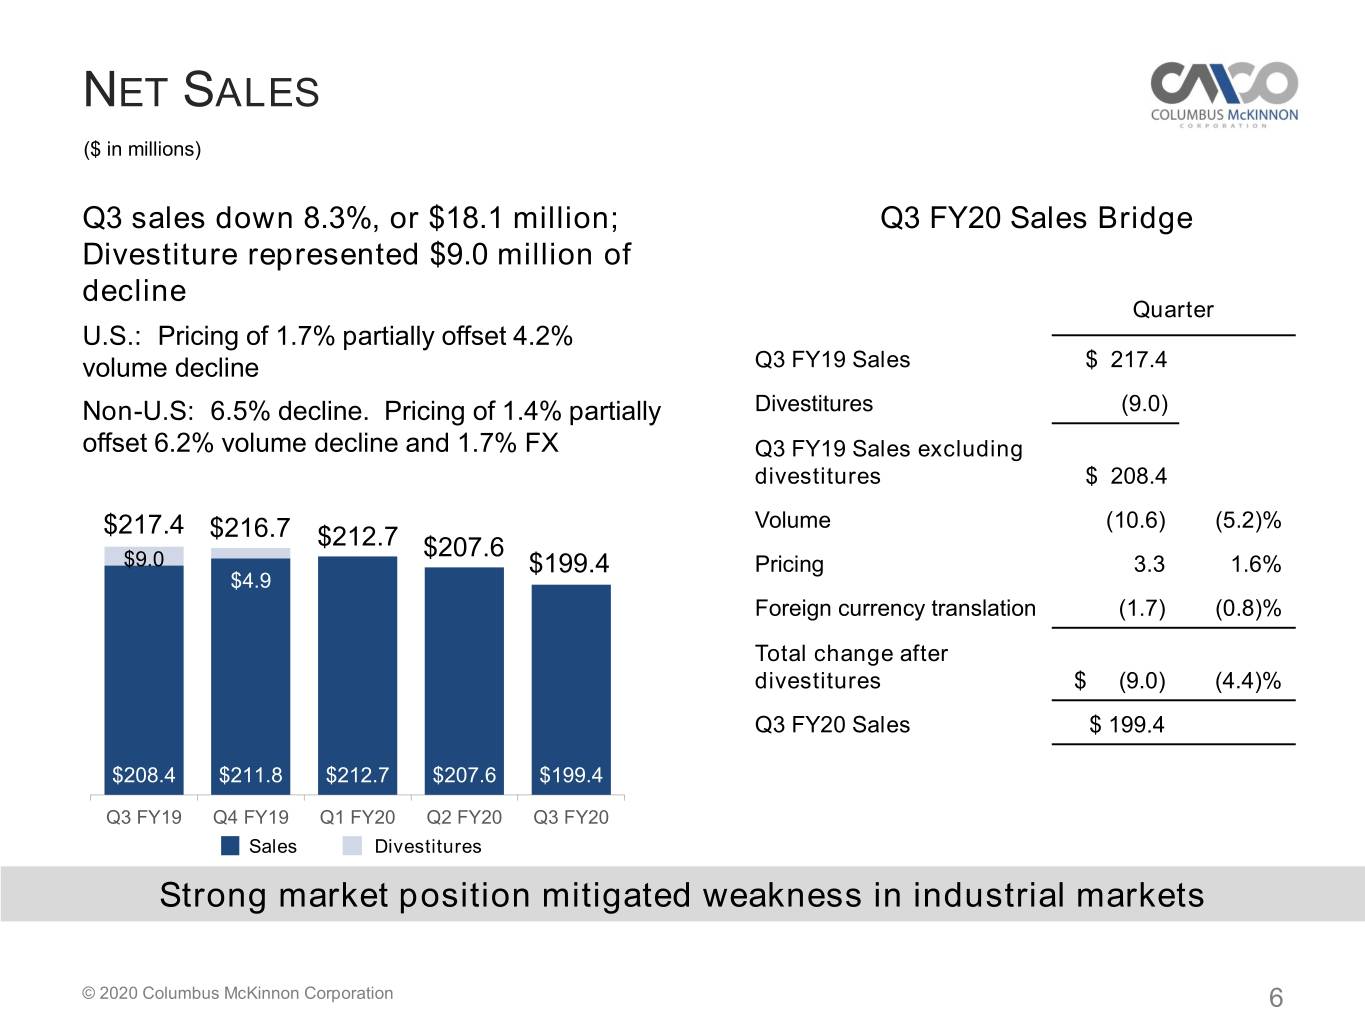
Of the $18.1 million decline in revenue, $9.0 million, or 50%, was related to divestitures from the prior-year period. Foreign currency translation also had a $1.7 million, or 0.8%, negative impact on sales. Sales in the U.S. were down $7.6 million, of which $4.9 million was related to divestitures in the prior-year period. Sales outside the U.S., adjusted for foreign currency translation, were down $8.7 million, of which $4.1 million was related to divestitures in the prior-year period. Improved pricing was offset by volume declines in all regions, except the Asia Pacific market, which had the benefit of a rail project in the period.
Third Quarter Fiscal 2020 Operating Results
($ in millions) | Q3 FY 20 | Q3 FY 19 | Change | % Change | ||||||||||
Gross profit | $ | 67.9 | $ | 73.4 | $ | (5.5 | ) | (7.5 | )% | |||||
Gross margin | 34.0 | % | 33.8 | % | 20 bps | |||||||||
Income from operations | $ | 20.9 | $ | 6.6 | $ | 14.2 | 214.3 | % | ||||||
Operating margin | 10.5 | % | 3.1 | % | 740 bps | |||||||||
Net income | $ | 15.3 | $ | (0.8 | ) | $ | 16.0 | NM | ||||||
Diluted EPS | $ | 0.63 | $ | (0.03 | ) | $ | 0.66 | NM | ||||||
Adjusted EBITDA * | $ | 30.4 | $ | 30.8 | $ | (0.4 | ) | (1.3 | )% | |||||
Adjusted EBITDA margin | 15.2 | % | 14.2 | % | 100 bps | |||||||||
*A non-GAAP measure, Adjusted EBITDA is defined as adjusted operating income plus depreciation and amortization. Please see the attached tables for a reconciliation of adjusted EBITDA to GAAP net income (loss).
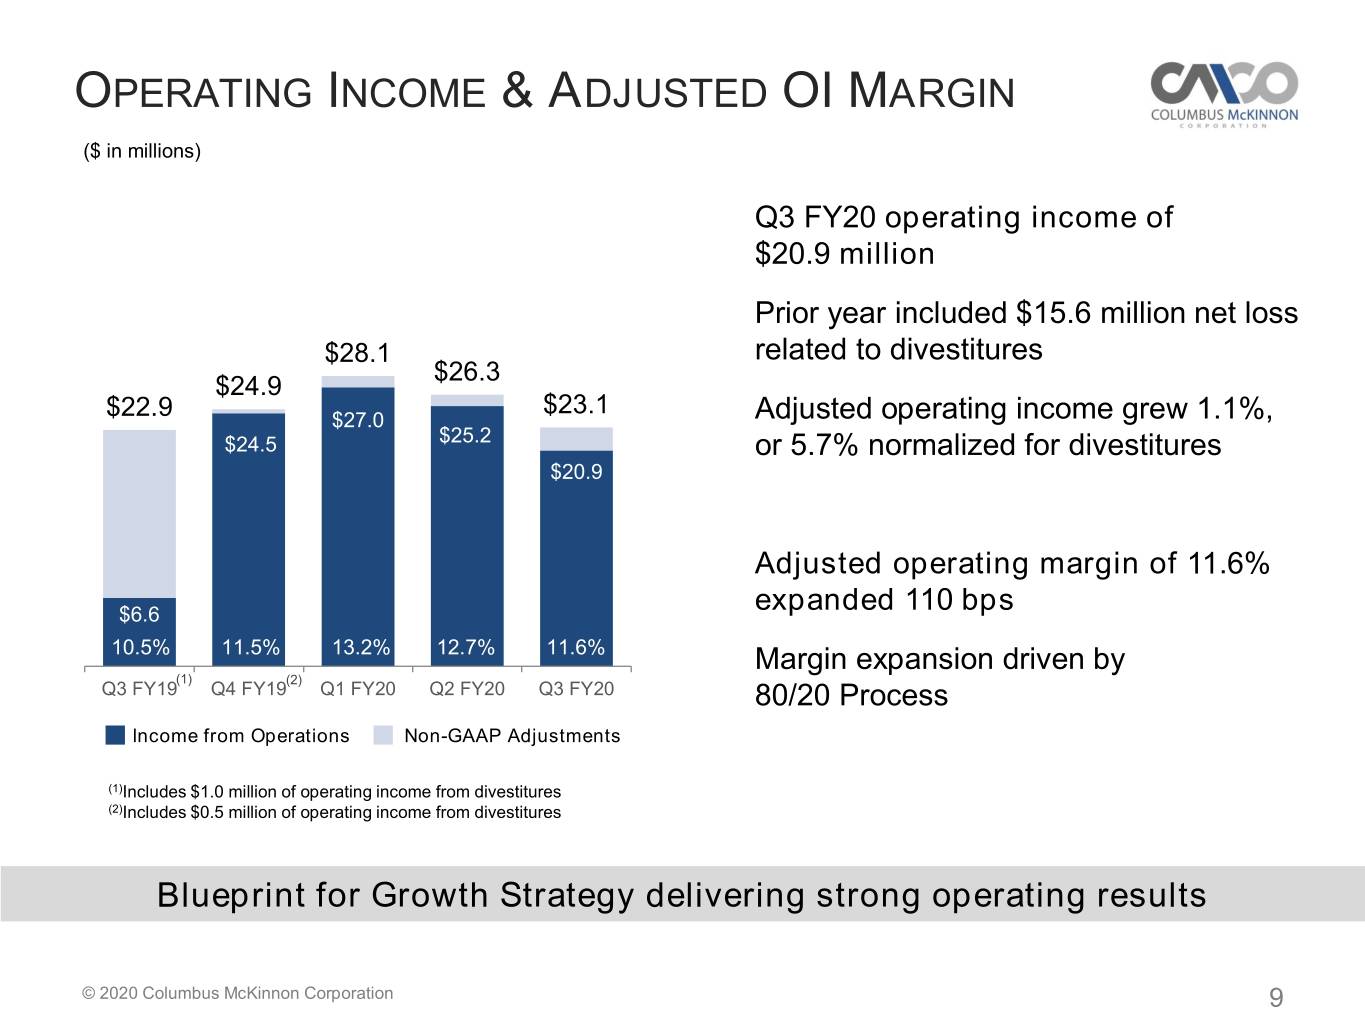
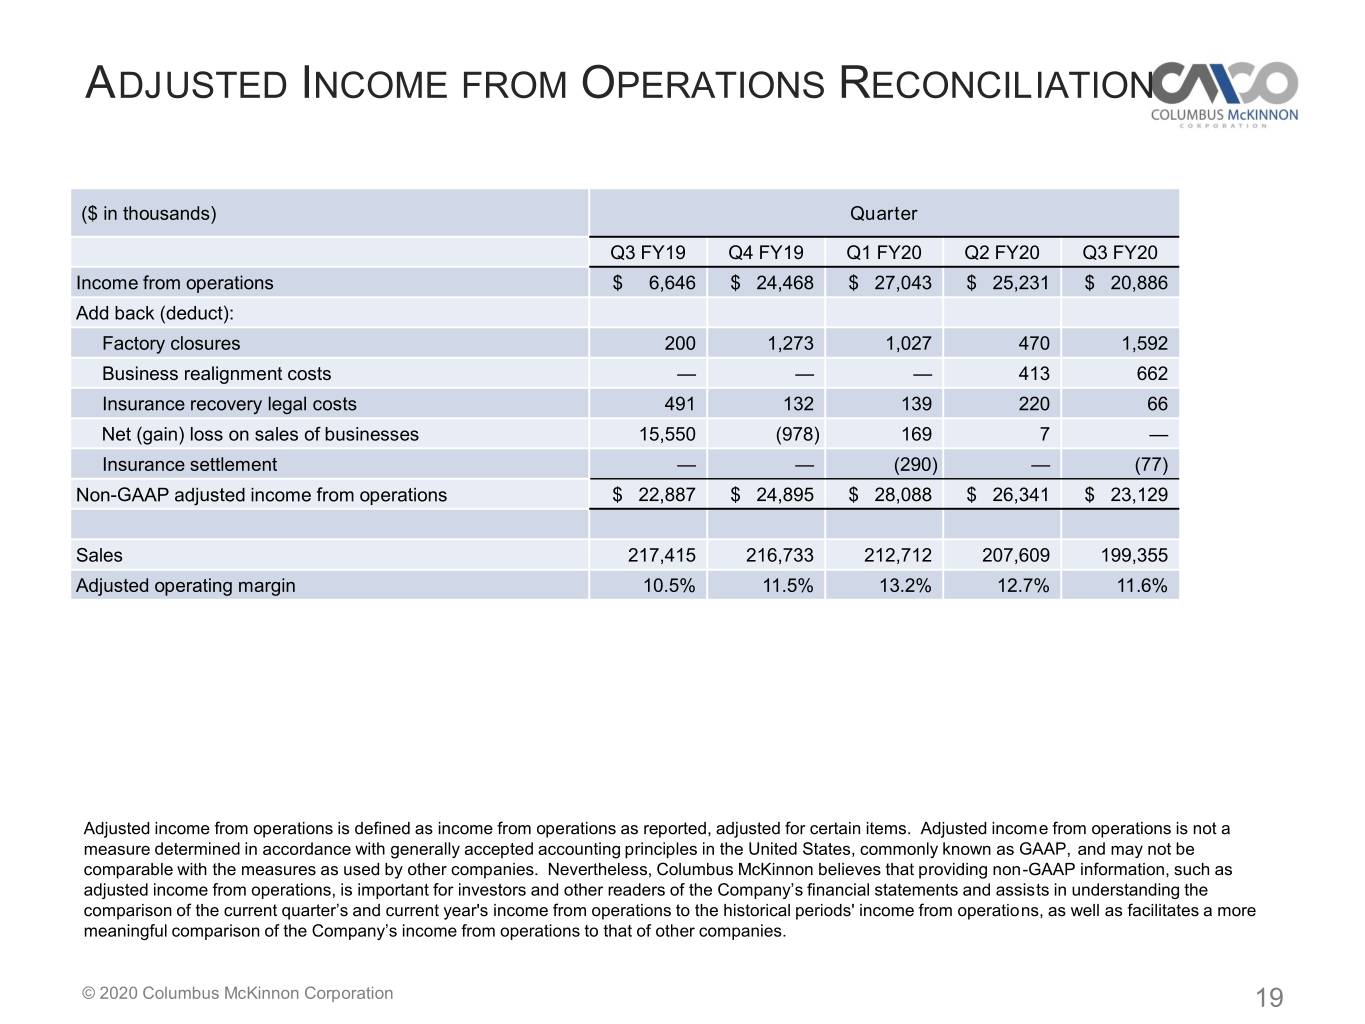
Strategic pricing and other benefits from the 80/20 Process helped to offset headwinds, including lower volume and related under absorption of factory fixed costs, as well as higher medical costs. This contributed to the 20 basis point improvement in gross margin. For more information on changes in gross profit, please see the table on page 8 of this release. Adjusted income from operations was $23.1 million, up $0.2 million, or 1.1%, compared with the third quarter of fiscal 2019. Adjusted operating margin expanded 110 basis points from the impact of the 80/20 Process. (See the reconciliation of GAAP income from operations to adjusted income from operations on page 11 of this release.)
Adjusted EBITDA margin was 15.2% for the quarter, an expansion of 100 basis points over the prior-year period. (See the reconciliation of GAAP net income to adjusted EBITDA on page 13 of this release.)
Columbus McKinnon Blueprint for Growth Strategy Drove Margin Expansion, Earnings Growth and Strong Cash Generation in Third Quarter Fiscal Year 2020
Page 3 of 13
February 4, 2020
Fourth Quarter Fiscal 2020 Outlook
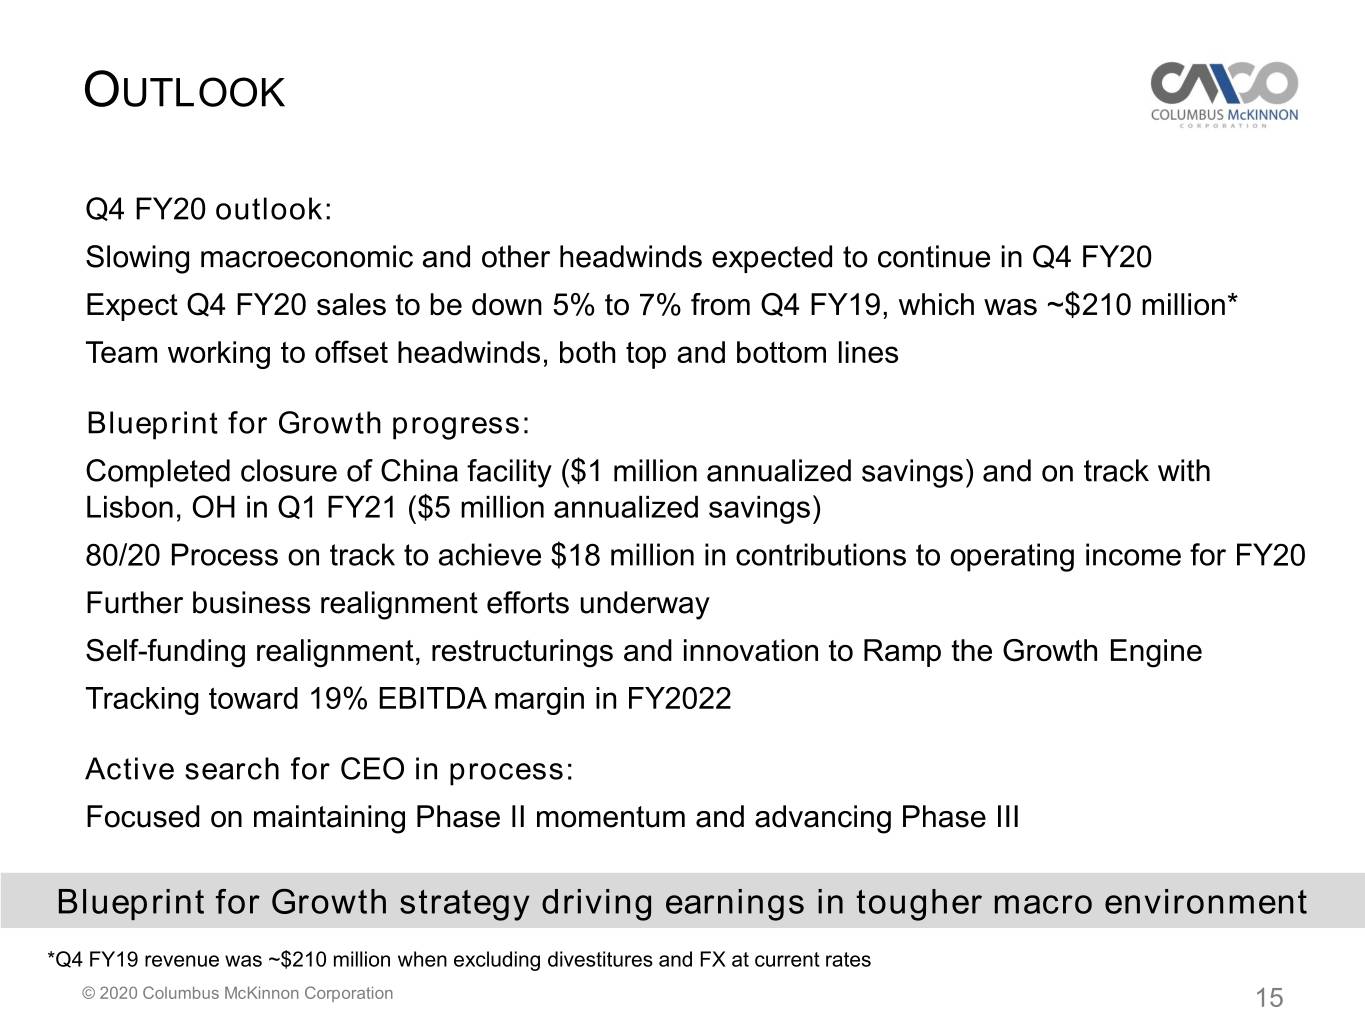
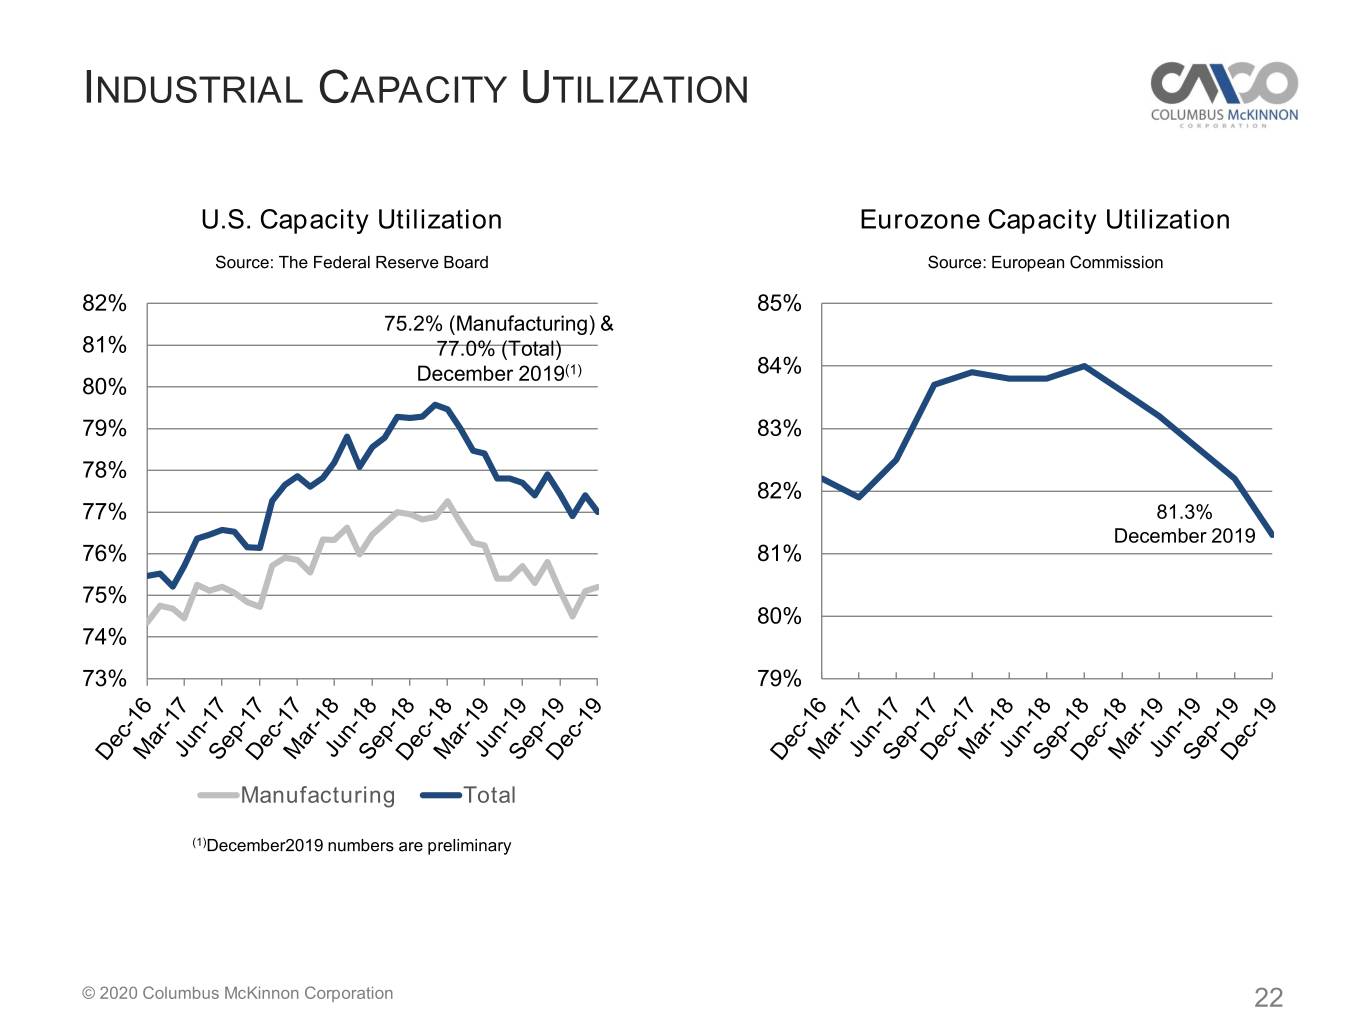
As has been well noted, macroeconomic conditions for industrial companies have slowed. While the Company’s third quarter orders and backlog were indicative of these conditions, the Company believes the Blueprint for Growth strategy is effective in all economic environments. Columbus McKinnon expects that the benefits from its Blueprint for Growth strategy can continue to offset headwinds, fund investments for growth, and drive margin and earnings expansion. The Company expects revenue in the fourth quarter of fiscal year 2020 to be approximately $196 million to $201 million, down about 5% to 7% compared with revenue of approximately $210 million in the prior-year period (excluding divestitures and adjusted for foreign currency translation at current rates).
Teleconference/webcast
Columbus McKinnon will host a conference call and live webcast Tuesday, February 4, 2020 at 10:00 AM Eastern Time, at which management will review the Company’s financial results and strategy. The review will be accompanied by a slide presentation, which will be available on Columbus McKinnon’s website at www.cmworks.com/investors. A question and answer session will follow the formal discussion.
The conference call can be accessed by dialing 201-493-6780. The listen-only audio webcast can be monitored at www.cmworks.com/investors. To listen to the archived call, dial 412-317-6671 and enter the passcode 13697631. The telephonic replay will be available from 1:00 PM Eastern Time on the day of the call through Tuesday, February 11, 2020. Alternatively, an archived webcast of the call can be found on the Company’s website. In addition, a transcript of the call will be posted to the website once available.
About Columbus McKinnon
Columbus McKinnon is a leading worldwide designer, manufacturer and marketer of motion control products, technologies, systems and services that efficiently and ergonomically move, lift, position and secure materials. Key products include hoists, actuators, rigging tools, light rail work stations and digital power and motion control systems. The Company is focused on commercial and industrial applications that require the safety and quality provided by its superior design and engineering know-how. Comprehensive information on Columbus McKinnon is available at http://www.cmworks.com.
Safe Harbor Statement
This news release contains “forward-looking statements” within the meaning of the Private Securities Litigation Reform Act of 1995. Such statements include, but are not limited to, statements concerning future sales and earnings, involve known and unknown risks, uncertainties and other factors that could cause the actual results of the Company to differ materially from the results expressed or implied by such statements, including the effectiveness of the Company’s 80/20 Process to simplify operations, the ability of the Company’s Operational Excellence initiatives to drive profitability, the success of the Company’s efforts to Ramp the Growth Engine, global economic and business conditions, conditions affecting the industries served by the Company and its subsidiaries, conditions affecting the Company's customers and suppliers, competitor responses to the Company's products and services, the overall market acceptance of such products and services, the ability to expand into new markets and geographic regions, and other factors disclosed in the Company's periodic reports filed with the Securities and Exchange Commission. The Company assumes no obligation to update the forward-looking information contained in this release.
Contacts:
Gregory P. Rustowicz | Investor Relations: |
Vice President - Finance and Chief Financial Officer | Deborah K. Pawlowski |
Columbus McKinnon Corporation | Kei Advisors LLC |
716-689-5442 | 716-843-3908 |
Financial tables follow.
Columbus McKinnon Blueprint for Growth Strategy Drove Margin Expansion, Earnings Growth and Strong Cash Generation in Third Quarter Fiscal Year 2020
Page 4 of 13
February 4, 2020
COLUMBUS McKINNON CORPORATION
Condensed Consolidated Income Statements - UNAUDITED
(In thousands, except per share and percentage data)
Three Months Ended | |||||||||||
December 31, 2019 | December 31, 2018 | Change | |||||||||
Net sales | $ | 199,355 | $ | 217,415 | (8.3 | )% | |||||
Cost of products sold | 131,483 | 144,010 | (8.7 | )% | |||||||
Gross profit | 67,872 | 73,405 | (7.5 | )% | |||||||
Gross profit margin | 34.0 | % | 33.8 | % | |||||||
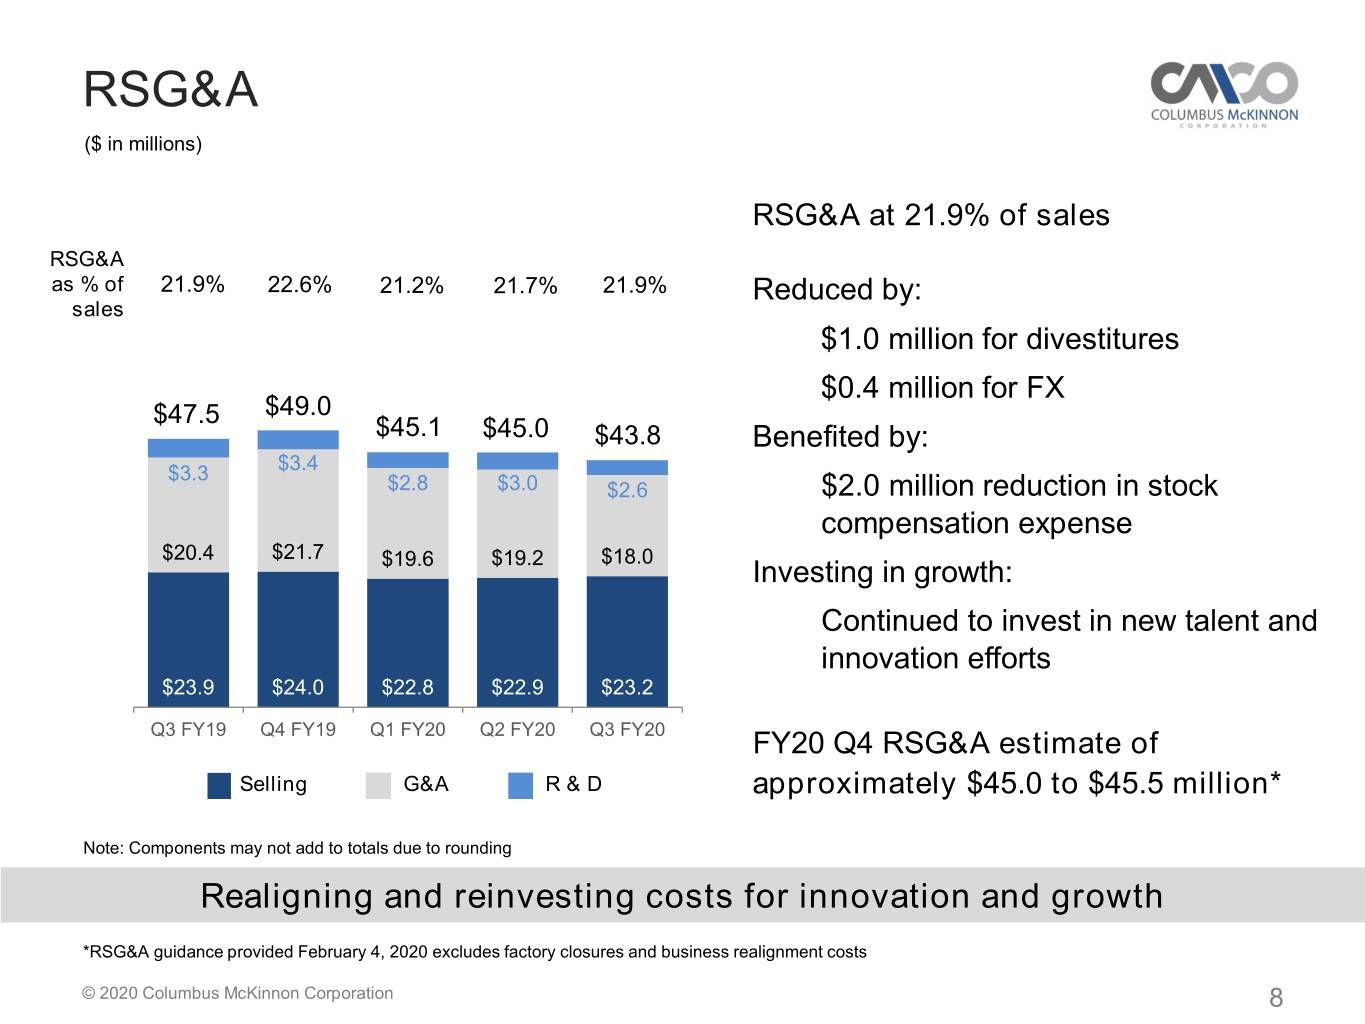
Selling expenses | 23,169 | 23,858 | (2.9 | )% | |||||||
% of net sales | 11.6 | % | 11.0 | % | |||||||
General and administrative expenses | 17,960 | 20,379 | (11.9 | )% | |||||||
% of net sales | 9.0 | % | 9.4 | % | |||||||
Research and development expenses | 2,628 | 3,271 | (19.7 | )% | |||||||
% of net sales | 1.3 | % | 1.5 | % | |||||||
Net loss on sales of businesses, including impairment | — | 15,550 | NM | ||||||||
Amortization of intangibles | 3,229 | 3,701 | (12.8 | )% | |||||||
Income from operations | 20,886 | 6,646 | 214.3 | % | |||||||
Operating margin | 10.5 | % | 3.1 | % | |||||||
Interest and debt expense | 3,423 | 4,330 | (20.9 | )% | |||||||
Investment (income) loss | (408 | ) | 82 | NM | |||||||
Foreign currency exchange (gain) loss | 188 | (25 | ) | NM | |||||||
Other (income) expense, net | 199 | (70 | ) | NM | |||||||
Income before income tax expense | 17,484 | 2,329 | 650.7 | % | |||||||
Income tax expense | 2,234 | 3,111 | (28.2 | )% | |||||||
Net income (loss) | $ | 15,250 | $ | (782 | ) | NM | |||||
Average basic shares outstanding | 23,679 | 23,348 | 1.4 | % | |||||||
Basic income (loss) per share | $ | 0.64 | $ | (0.03 | ) | NM | |||||
Average diluted shares outstanding | 24,031 | 23,348 | 2.9 | % | |||||||
Diluted income (loss) per share | $ | 0.63 | $ | (0.03 | ) | NM | |||||
Dividends declared per common share | $ | 0.06 | $ | 0.05 | |||||||
Columbus McKinnon Blueprint for Growth Strategy Drove Margin Expansion, Earnings Growth and Strong Cash Generation in Third Quarter Fiscal Year 2020
Page 5 of 13
February 4, 2020
COLUMBUS McKINNON CORPORATION
Condensed Consolidated Income Statements - UNAUDITED
(In thousands, except per share and percentage data)
Nine Months Ended | |||||||||||
December 31, 2019 | December 31, 2018 | Change | |||||||||
Net sales | $ | 619,676 | $ | 659,549 | (6.0 | )% | |||||
Cost of products sold | 402,699 | 430,597 | (6.5 | )% | |||||||
Gross profit | 216,977 | 228,952 | (5.2 | )% | |||||||
Gross profit margin | 35.0 | % | 34.7 | % | |||||||
Selling expenses | 68,801 | 73,940 | (7.0 | )% | |||||||
% of net sales | 11.1 | % | 11.2 | % | |||||||
General and administrative expenses | 56,713 | 61,893 | (8.4 | )% | |||||||
% of net sales | 9.2 | % | 9.4 | % | |||||||
Research and development expenses | 8,419 | 10,137 | (16.9 | )% | |||||||
% of net sales | 1.4 | % | 1.5 | % | |||||||
Net loss on sales of businesses, including impairment | 176 | 26,650 | (99.3 | )% | |||||||
Amortization of intangibles | 9,708 | 11,358 | (14.5 | )% | |||||||
Income from operations | 73,160 | 44,974 | 62.7 | % | |||||||
Operating margin | 11.8 | % | 6.8 | % | |||||||
Interest and debt expense | 11,034 | 13,185 | (16.3 | )% | |||||||
Investment (income) loss | (939 | ) | (297 | ) | 216.2 | % | |||||
Foreign currency exchange (gain) loss | (518 | ) | 206 | NM | |||||||
Other (income) expense, net | 618 | (417 | ) | NM | |||||||
Income before income tax expense | 62,965 | 32,297 | 95.0 | % | |||||||
Income tax expense | 12,537 | 9,461 | 32.5 | % | |||||||
Net income | $ | 50,428 | $ | 22,836 | 120.8 | % | |||||
Average basic shares outstanding | 23,581 | 23,245 | 1.4 | % | |||||||
Basic income per share | $ | 2.14 | $ | 0.98 | 118.4 | % | |||||
Average diluted shares outstanding | 23,925 | 23,647 | 1.2 | % | |||||||
Diluted income per share | $ | 2.11 | $ | 0.97 | 117.5 | % | |||||
Dividends declared per common share | $ | 0.12 | $ | 0.10 | |||||||
Columbus McKinnon Blueprint for Growth Strategy Drove Margin Expansion, Earnings Growth and Strong Cash Generation in Third Quarter Fiscal Year 2020
Page 6 of 13
February 4, 2020
COLUMBUS McKINNON CORPORATION
Condensed Consolidated Balance Sheets
(In thousands)
December 31, 2019 | March 31, 2019 | |||||||
(unaudited) | ||||||||
ASSETS | ||||||||
Current assets: | ||||||||
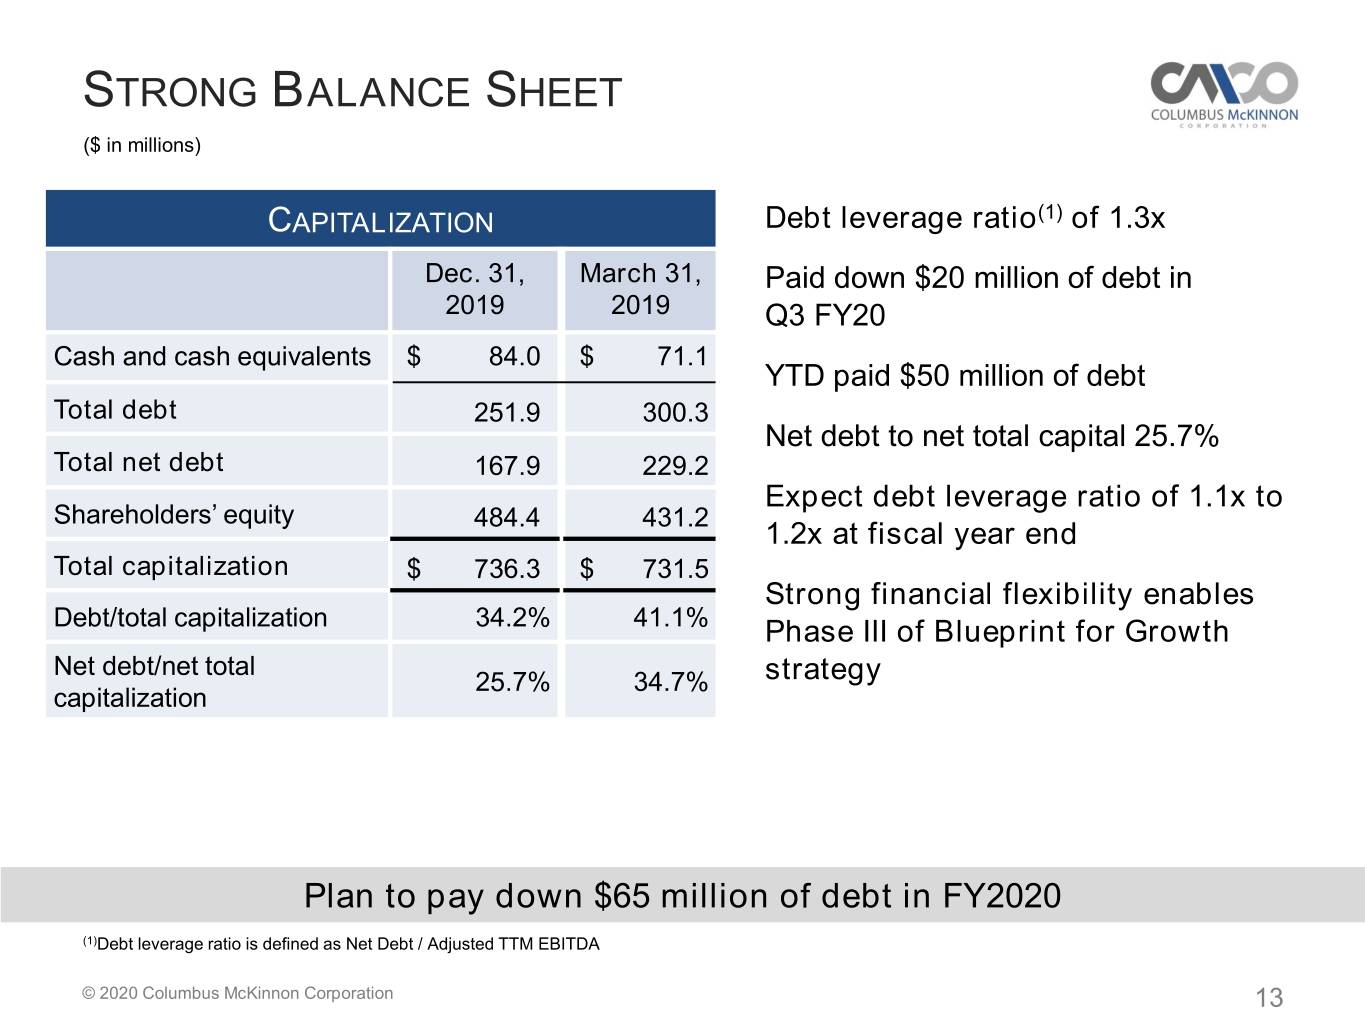
Cash and cash equivalents | $ | 84,014 | $ | 71,093 | ||||
Trade accounts receivable | 125,386 | 129,157 | ||||||
Inventories | 135,449 | 146,263 | ||||||
Prepaid expenses and other | 16,890 | 16,075 | ||||||
Total current assets | 361,739 | 362,588 | ||||||
Property, plant, and equipment, net | 81,117 | 87,303 | ||||||
Goodwill | 322,766 | 322,816 | ||||||
Other intangibles, net | 223,206 | 232,940 | ||||||
Marketable securities | 7,370 | 7,028 | ||||||
Deferred taxes on income | 25,117 | 27,707 | ||||||
Other assets | 58,544 | 21,189 | ||||||
Total assets | $ | 1,079,859 | $ | 1,061,571 | ||||
LIABILITIES AND SHAREHOLDERS’ EQUITY | ||||||||
Current liabilities: | ||||||||
Trade accounts payable | $ | 46,317 | $ | 46,974 | ||||
Accrued liabilities | 94,205 | 99,304 | ||||||
Current portion of long-term debt | 65,000 | 65,000 | ||||||
Total current liabilities | 205,522 | 211,278 | ||||||
Term loan and revolving credit facility | 186,893 | 235,320 | ||||||
Other non-current liabilities | 203,078 | 183,814 | ||||||
Total liabilities | 595,493 | 630,412 | ||||||
Shareholders’ equity: | ||||||||
Common stock | 237 | 234 | ||||||
Additional paid-in capital | 284,842 | 277,518 | ||||||
Retained earnings | 284,047 | 236,459 | ||||||
Accumulated other comprehensive loss | (84,760 | ) | (83,052 | ) | ||||
Total shareholders’ equity | 484,366 | 431,159 | ||||||
Total liabilities and shareholders’ equity | $ | 1,079,859 | $ | 1,061,571 | ||||
Columbus McKinnon Blueprint for Growth Strategy Drove Margin Expansion, Earnings Growth and Strong Cash Generation in Third Quarter Fiscal Year 2020
Page 7 of 13
February 4, 2020
COLUMBUS McKINNON CORPORATION
Condensed Consolidated Statements of Cash Flows - UNAUDITED
(In thousands)
Nine Months Ended | ||||||||
December 31, 2019 | December 31, 2018 | |||||||
Operating activities: | ||||||||
Net income | $ | 50,428 | $ | 22,836 | ||||
Adjustments to reconcile net income to net cash provided by (used for) operating activities: | ||||||||
Depreciation and amortization | 21,991 | 24,763 | ||||||
Deferred income taxes and related valuation allowance | 1,247 | (2,353 | ) | |||||
Net loss (gain) on sale of real estate, investments, and other | (602 | ) | 109 | |||||
Stock based compensation | 3,510 | 4,625 | ||||||
Amortization of deferred financing costs | 1,782 | 1,992 | ||||||
Net loss on sales of businesses, including impairment | 176 | 26,650 | ||||||
Non-cash lease expense | 6,136 | — | ||||||
Changes in operating assets and liabilities, net of effects of business acquisitions and divestitures: | ||||||||
Trade accounts receivable | 3,989 | (1,407 | ) | |||||
Inventories | 10,870 | (13,043 | ) | |||||
Prepaid expenses and other | (3,224 | ) | (103 | ) | ||||
Other assets | 726 | 232 | ||||||
Trade accounts payable | (3,013 | ) | (5,330 | ) | ||||
Accrued liabilities | (11,458 | ) | 3,558 | |||||
Non-current liabilities | (12,306 | ) | (8,733 | ) | ||||
Net cash provided by (used for) operating activities | 70,252 | 53,796 | ||||||
Investing activities: | ||||||||
Proceeds from sales of marketable securities | 4,908 | 1,238 | ||||||
Purchases of marketable securities | (4,961 | ) | (835 | ) | ||||
Capital expenditures | (6,761 | ) | (7,236 | ) | ||||
Proceeds from sale of equipment and real estate | 51 | 176 | ||||||
Net (payments) proceeds from sales of businesses | (214 | ) | 5,103 | |||||
Payment of restricted cash to former owner | — | (294 | ) | |||||
Net cash provided by (used for) investing activities | (6,977 | ) | (1,848 | ) | ||||
Financing activities: | ||||||||
Proceeds from the issuance of common stock | 4,457 | 3,708 | ||||||
Repayment of debt | (50,000 | ) | (50,051 | ) | ||||
Payment of dividends | (4,245 | ) | (3,484 | ) | ||||
Other | (643 | ) | (1,941 | ) | ||||
Net cash provided by (used for) financing activities | (50,431 | ) | (51,768 | ) | ||||
Effect of exchange rate changes on cash | 77 | (5,416 | ) | |||||
Net change in cash and cash equivalents | 12,921 | (5,236 | ) | |||||
Cash, cash equivalents, and restricted cash at beginning of year | 71,343 | 63,565 | ||||||
Cash, cash equivalents, and restricted cash at end of period | $ | 84,264 | $ | 58,329 | ||||
Columbus McKinnon Blueprint for Growth Strategy Drove Margin Expansion, Earnings Growth and Strong Cash Generation in Third Quarter Fiscal Year 2020
Page 8 of 13
February 4, 2020
COLUMBUS McKINNON CORPORATION
Q3 FY 2020 Sales Bridge
Quarter | Year To Date | |||||||||||||
($ in millions) | $ Change | % Change | $ Change | % Change | ||||||||||
Fiscal 2019 Sales | $ | 217.4 | $ | 659.5 | ||||||||||
Divestitures | (9.0 | ) | (29.3 | ) | ||||||||||
Fiscal 2019 Sales adjusted for divestitures | $ | 208.4 | $ | 630.2 | ||||||||||
Volume | (10.6 | ) | (5.2 | )% | (10.0 | ) | (1.6 | )% | ||||||
Pricing | 3.3 | 1.6 | % | 10.3 | 1.6 | % | ||||||||
Foreign currency translation | (1.7 | ) | (0.8 | )% | (10.8 | ) | (1.7 | )% | ||||||
Total change adjusted for divestitures | $ | (9.0 | ) | (4.4 | )% | $ | (10.5 | ) | (1.7 | )% | ||||
Fiscal 2020 Sales | $ | 199.4 | $ | 619.7 | ||||||||||
COLUMBUS McKINNON CORPORATION
Q3 FY 2020 Gross Profit Bridge
($ in millions) | Quarter | Year To Date | |||||
Fiscal 2019 Gross Profit | $ | 73.4 | $ | 229.0 | |||
Divestitures | (2.0 | ) | (6.1 | ) | |||
Fiscal 2019 Gross Profit adjusted for divestitures | 71.4 | 222.9 | |||||
Pricing, net of material cost inflation | 2.8 | 7.9 | |||||
Insurance settlement | 0.1 | 0.4 | |||||
Business realignment costs | (0.1 | ) | — | ||||
Product liability | (0.1 | ) | (0.3 | ) | |||
Tariffs | 0.1 | (1.2 | ) | ||||
Factory closures | (0.5 | ) | (1.3 | ) | |||
Productivity, net of other cost changes | (2.2 | ) | (1.9 | ) | |||
Foreign currency translation | (0.6 | ) | (3.7 | ) | |||
Sales volume and mix | (3.0 | ) | (5.8 | ) | |||
Total change adjusted for divestitures | $ | (3.5 | ) | $ | (5.9 | ) | |
Fiscal 2020 Gross Profit | $ | 67.9 | $ | 217.0 | |||
Columbus McKinnon Blueprint for Growth Strategy Drove Margin Expansion, Earnings Growth and Strong Cash Generation in Third Quarter Fiscal Year 2020
Page 9 of 13
February 4, 2020
COLUMBUS McKINNON CORPORATION
Additional Data - UNAUDITED
December 31, 2019 | September 30, 2019 | December 31, 2018 | |||||||||||||
($ in millions) | |||||||||||||||
Backlog | $ | 125.3 | $ | 143.1 | $ | 159.9 | |||||||||
Backlog excluding divestitures | $ | 125.3 | $ | 143.1 | $ | 154.4 | |||||||||
Long-term backlog | |||||||||||||||
Expected to ship beyond 3 months | $ | 51.3 | $ | 53.9 | $ | 55.1 | |||||||||
Long-term backlog as % of total backlog | 40.9 | % | 37.7 | % | 34.5 | % | |||||||||
Trade accounts receivable | |||||||||||||||
Days sales outstanding | 57.2 | days | 57.0 | days | 52.3 | days | |||||||||
Inventory turns per year | |||||||||||||||
(based on cost of products sold) | 3.9 | turns | 3.8 | turns | 3.8 | turns | |||||||||
Days' inventory | 94.0 | days | 96.9 | days | 96.1 | days | |||||||||
Trade accounts payable | |||||||||||||||
Days payables outstanding | 32.1 | days | 33.2 | days | 25.4 | days | |||||||||
Working capital as a % of sales (1) | 16.5 | % | 17.2 | % | 17.9 | % | |||||||||
Debt to total capitalization percentage | 34.2 | % | 36.9 | % | 42.8 | % | |||||||||
Debt, net of cash, to net total capitalization | 25.7 | % | 30.1 | % | 37.9 | % | |||||||||
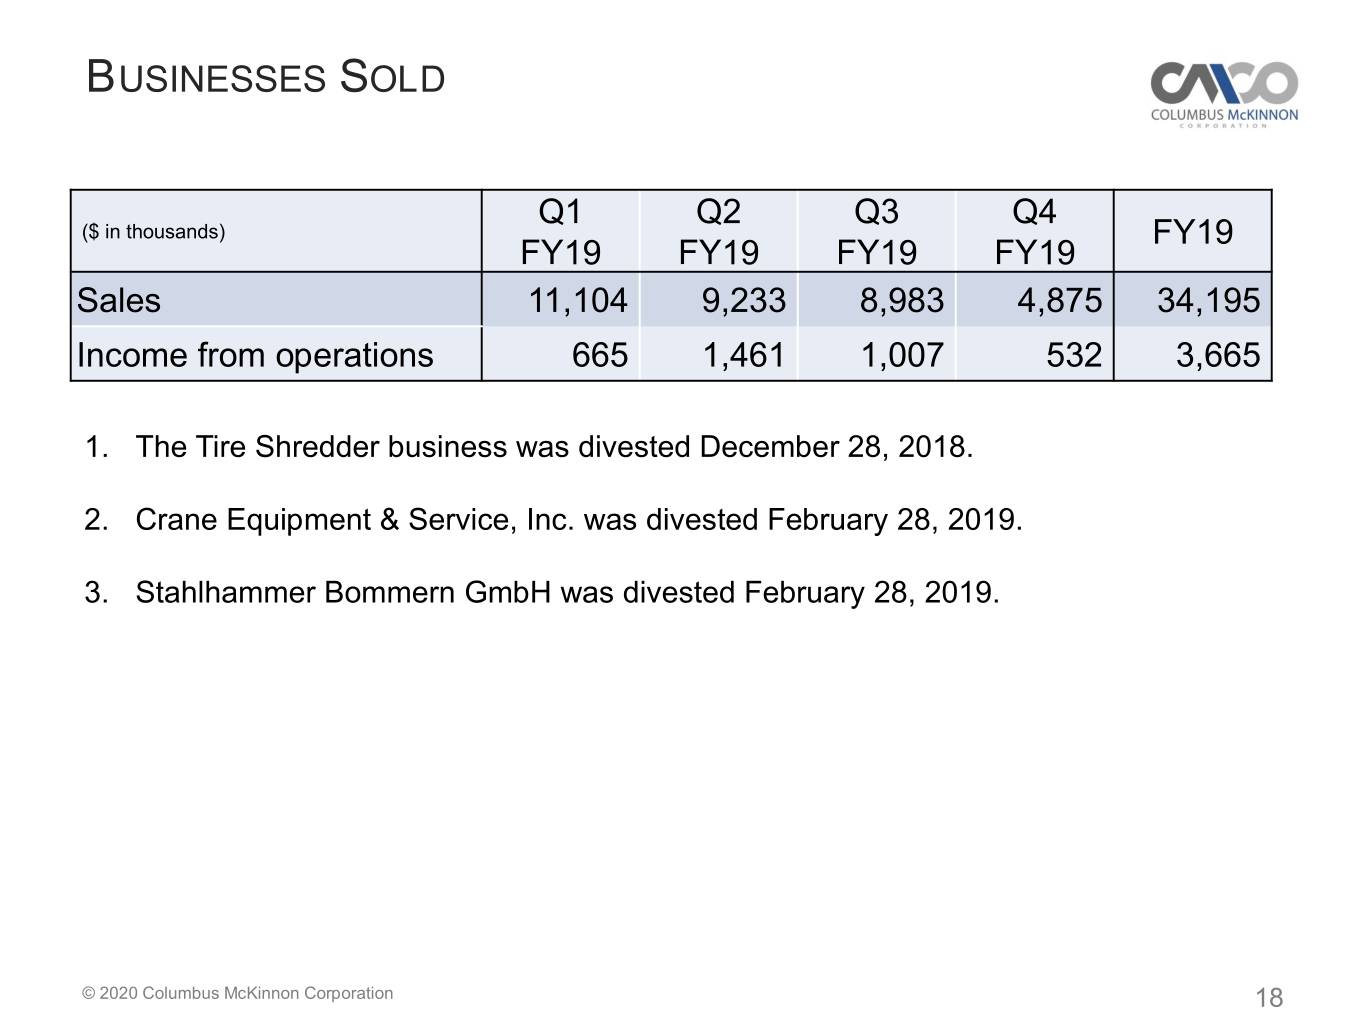
(1) December 31, 2019 figure excludes Crane Equipment & Service, Inc. (CES) and Stahlhammer Bommern GmbH (STB), each of which were divested on February 28, 2019. September 30, 2019 figure excludes CES, STB, and the Tire Shredder business, which was divested on December 28, 2018. December 31, 2018 figure excludes the Tire Shredder business.
U.S. Shipping Days by Quarter | ||||||||||
Q1 | Q2 | Q3 | Q4 | Total | ||||||
FY 20 | 63 | 63 | 61 | 64 | 251 | |||||
FY 19 | 64 | 63 | 60 | 63 | 250 | |||||
Columbus McKinnon Blueprint for Growth Strategy Drove Margin Expansion, Earnings Growth and Strong Cash Generation in Third Quarter Fiscal Year 2020
Page 10 of 13
February 4, 2020
COLUMBUS McKINNON CORPORATION
Reconciliation of GAAP Gross Profit to
Non-GAAP Adjusted Gross Profit and Adjusted Gross Margin
($ in thousands, except per share data)
Three Months Ended December 31, | Year To Date December 31, | ||||||||||||||
2019 | 2018 | 2019 | 2018 | ||||||||||||
Gross profit | $ | 67,872 | $ | 73,405 | $ | 216,977 | $ | 228,952 | |||||||
Add back (deduct): | |||||||||||||||
Factory closures | 696 | 200 | 1,451 | 200 | |||||||||||
Business realignment costs | 123 | — | 263 | — | |||||||||||
Insurance settlement | (77 | ) | — | (367 | ) | — | |||||||||
Non-GAAP adjusted gross profit | $ | 68,614 | $ | 73,605 | $ | 218,324 | $ | 229,152 | |||||||
Sales | $ | 199,355 | $ | 217,415 | $ | 619,676 | $ | 659,549 | |||||||
Adjusted gross margin | 34.4 | % | 33.9 | % | 35.2 | % | 34.7 | % | |||||||
Adjusted gross profit is defined as gross profit as reported, adjusted for certain items. Adjusted gross profit is not a measure determined in accordance with generally accepted accounting principles in the United States, commonly known as GAAP, and may not be comparable with the measures as used by other companies. Nevertheless, Columbus McKinnon believes that providing non-GAAP information, such as adjusted gross profit, is important for investors and other readers of the Company’s financial statements and assists in understanding the comparison of the current quarter’s and current year's gross profit to the historical periods' gross profit, as well as facilitates a more meaningful comparison of the Company’s gross profit to that of other companies.
Columbus McKinnon Blueprint for Growth Strategy Drove Margin Expansion, Earnings Growth and Strong Cash Generation in Third Quarter Fiscal Year 2020
Page 11 of 13
February 4, 2020
COLUMBUS McKINNON CORPORATION
Reconciliation of GAAP Income from Operations to
Non-GAAP Adjusted Income from Operations and Adjusted Operating Margin
($ in thousands, except per share data)
Three Months Ended December 31, | Year To Date December 31, | ||||||||||||||
2019 | 2018 | 2019 | 2018 | ||||||||||||
Income from operations | $ | 20,886 | $ | 6,646 | $ | 73,160 | $ | 44,974 | |||||||
Add back (deduct): | |||||||||||||||
Factory closures | 1,592 | 200 | 3,089 | 200 | |||||||||||
Business realignment costs | 662 | — | 1,075 | 1,906 | |||||||||||
Insurance recovery legal costs | 66 | 491 | 425 | 1,150 | |||||||||||
Net loss on sales of businesses, including impairment | — | 15,550 | 176 | 26,650 | |||||||||||
Insurance settlement | (77 | ) | — | (367 | ) | — | |||||||||
Non-GAAP adjusted income from operations | $ | 23,129 | $ | 22,887 | $ | 77,558 | $ | 74,880 | |||||||
Sales | $ | 199,355 | $ | 217,415 | $ | 619,676 | $ | 659,549 | |||||||
Adjusted operating margin | 11.6 | % | 10.5 | % | 12.5 | % | 11.4 | % | |||||||
Adjusted income from operations is defined as income from operations as reported, adjusted for certain items. Adjusted income from operations is not a measure determined in accordance with generally accepted accounting principles in the United States, commonly known as GAAP, and may not be comparable with the measures as used by other companies. Nevertheless, Columbus McKinnon believes that providing non-GAAP information, such as adjusted income from operations, is important for investors and other readers of the Company’s financial statements and assists in understanding the comparison of the current quarter’s and current year's income from operations to the historical periods' income from operations, as well as facilitates a more meaningful comparison of the Company’s income from operations to that of other companies.
Columbus McKinnon Blueprint for Growth Strategy Drove Margin Expansion, Earnings Growth and Strong Cash Generation in Third Quarter Fiscal Year 2020
Page 12 of 13
February 4, 2020
COLUMBUS McKINNON CORPORATION
Reconciliation of GAAP Net Income (Loss) and Diluted Earnings per Share to
Non-GAAP Adjusted Net Income and Diluted Earnings per Share
($ in thousands, except per share data)
Three Months Ended December 31, | Year To Date December 31, | ||||||||||||||
2019 | 2018 | 2019 | 2018 | ||||||||||||
Net income (loss) | $ | 15,250 | $ | (782 | ) | $ | 50,428 | $ | 22,836 | ||||||
Add back (deduct): | |||||||||||||||
Factory closures | 1,592 | 200 | 3,089 | 200 | |||||||||||
Business realignment costs | 662 | — | 1,075 | 1,906 | |||||||||||
Insurance recovery legal costs | 66 | 491 | 425 | 1,150 | |||||||||||
Net loss on sales of businesses, including impairment | — | 15,550 | 176 | 26,650 | |||||||||||
Insurance settlement | (77 | ) | — | (367 | ) | — | |||||||||
Normalize tax rate to 22% (1) | (2,106 | ) | (974 | ) | (2,283 | ) | (4,224 | ) | |||||||
Non-GAAP adjusted net income | $ | 15,387 | $ | 14,485 | $ | 52,543 | $ | 48,518 | |||||||
Average diluted shares outstanding | 24,031 | 23,681 | 23,925 | 23,647 | |||||||||||
Diluted income per share - GAAP | $ | 0.63 | $ | (0.03 | ) | $ | 2.11 | $ | 0.97 | ||||||
Diluted income per share - Non-GAAP | $ | 0.64 | $ | 0.61 | $ | 2.20 | $ | 2.05 | |||||||
(1) Applies a normalized tax rate of 22% to GAAP pre-tax income and non-GAAP adjustments above, which are each pre-tax.
Adjusted net income and diluted EPS are defined as net income and diluted EPS as reported, adjusted for certain items and at a normalized tax rate. Adjusted net income and diluted EPS are not measures determined in accordance with generally accepted accounting principles in the United States, commonly known as GAAP, and may not be comparable to the measures as used by other companies. Nevertheless, Columbus McKinnon believes that providing non-GAAP information, such as adjusted net income and diluted EPS, is important for investors and other readers of the Company’s financial statements and assists in understanding the comparison of the current quarter’s and current year's net income and diluted EPS to the historical periods' net income and diluted EPS, as well as facilitates a more meaningful comparison of the Company’s net income and diluted EPS to that of other companies.
Columbus McKinnon Blueprint for Growth Strategy Drove Margin Expansion, Earnings Growth and Strong Cash Generation in Third Quarter Fiscal Year 2020
Page 13 of 13
February 4, 2020
COLUMBUS McKINNON CORPORATION
Reconciliation of GAAP Net Income (Loss) to Non-GAAP Adjusted EBITDA
($ in thousands)
Three Months Ended December 31, | Year To Date December 31, | ||||||||||||||
2019 | 2018 | 2019 | 2018 | ||||||||||||
Net income (loss) | $ | 15,250 | $ | (782 | ) | $ | 50,428 | $ | 22,836 | ||||||
Add back (deduct): | |||||||||||||||
Income tax expense | 2,234 | 3,111 | 12,537 | 9,461 | |||||||||||
Interest and debt expense | 3,423 | 4,330 | 11,034 | 13,185 | |||||||||||
Investment (income) loss | (408 | ) | 82 | (939 | ) | (297 | ) | ||||||||
Foreign currency exchange (gain) loss | 188 | (25 | ) | (518 | ) | 206 | |||||||||
Other (income) expense, net | 199 | (70 | ) | 618 | (417 | ) | |||||||||
Depreciation and amortization expense | 7,244 | 7,901 | 21,991 | 24,763 | |||||||||||
Factory closures | 1,592 | 200 | 3,089 | 200 | |||||||||||
Business realignment costs | 662 | — | 1,075 | 1,906 | |||||||||||
Insurance recovery legal costs | 66 | 491 | 425 | 1,150 | |||||||||||
Net loss on sales of businesses, including impairment | — | 15,550 | 176 | 26,650 | |||||||||||
Insurance settlement | (77 | ) | — | (367 | ) | — | |||||||||
Non-GAAP adjusted EBITDA | $ | 30,373 | $ | 30,788 | $ | 99,549 | $ | 99,643 | |||||||
Sales | $ | 199,355 | $ | 217,415 | $ | 619,676 | $ | 659,549 | |||||||
Adjusted EBITDA margin | 15.2 | % | 14.2 | % | 16.1 | % | 15.1 | % | |||||||
Adjusted EBITDA is defined as net income before interest expense, income taxes, depreciation, amortization, and other adjustments. Adjusted EBITDA is not a measure determined in accordance with generally accepted accounting principles in the United States, commonly known as GAAP, and may not be comparable with the measures as used by other companies. Nevertheless, Columbus McKinnon believes that providing non-GAAP information, such as adjusted EBITDA, is important for investors and other readers of the Company’s financial statements and assists in understanding the comparison of the current quarter’s and current year's net income and diluted EPS to the historical periods' net income and diluted EPS, as well as facilitates a more meaningful comparison of the Company’s net income and diluted EPS to that of other companies.