8-K
COLUMBUS MCKINNON CORP false 0001005229 0001005229 2026-01-14 2026-01-14


UNITED STATES

SECURITIES AND EXCHANGE COMMISSION

Washington, D.C. 20549


FORM 8-K


CURRENT REPORT

Pursuant to Section 13 OR 15(d)

of The Securities Exchange Act of 1934

Date of Report (Date of earliest event reported): January 14, 2026


COLUMBUS McKINNON CORPORATION

(Exact name of registrant as specified in its charter)


New York   001-34362   16-0547600
(State or other jurisdiction
of incorporation)
 

(Commission

File Number)

  (IRS Employer
Identification No.)


13320 Ballantyne Corporate Place, Suite D    Charlotte    NC    28277
(Address of principal executive offices)    (Zip Code)

Registrant’s telephone number, including area code: (716) 689-5400

Not applicable

(Former name or former address, if changed since last report)


Check the appropriate box below if the Form 8-K filing is intended to simultaneously satisfy the filing obligation of the registrant under any of the following provisions:


Written communications pursuant to Rule 425 under the Securities Act (17 CFR 230.425)


Soliciting material pursuant to Rule 14a-12 under the Exchange Act (17 CFR 240.14a-12)


Pre-commencement communications pursuant to Rule 14d-2(b) under the Exchange Act (17 CFR 240.14d-2(b))


Pre-commencement communications pursuant to Rule 13e-4(c) under the Exchange Act (17 CFR 240.13e-4(c))

Securities registered pursuant to Section 12(b) of the Act:


Title of each class


Trading

Symbol(s)


Name of each exchange

on which registered

Common Stock, $0.01 par value per share   CMCO   The Nasdaq Stock Market LLC

Indicate by check mark whether the registrant is an emerging growth company as defined in Rule 405 of the Securities Act of 1933 (§230.405 of this chapter) or Rule 12b-2 of the Securities Exchange Act of 1934 (§240.12b-2 of this chapter).

Emerging growth company       

If an Emerging Growth Company, indicate by check mark if the registrant has elected not to use the extended transition period for complying with any new or revised financial accounting standards provided pursuant to Section 13(a) of the Exchange Act.  ☐


Item 2.02

Results of Operations and Financial Condition.

On January 14, 2026, Columbus McKinnon Corporation (the “Company”) issued a press release announcing preliminary estimated selected financial results as of and for each of the three and nine months ended December 31, 2025. The full text of the press release is attached hereto as Exhibit 99.1 and is incorporated herein by reference.

The information contained in this Item 2.02 and Exhibit 99.1 hereto is deemed “furnished” and shall not be deemed “filed” for purposes of Section 18 of the Securities Exchange Act of 1934, as amended (the “Exchange Act”), nor shall it be deemed incorporated by reference into any filing under the Securities Act of 1933, as amended (the “Securities Act”), except as shall be expressly set forth in such filing.


Item 7.01

Regulation FD Disclosure.

Lender Presentation

Beginning on January 14, 2026, the Company will use a lender presentation (the “Lender Presentation”) in connection with meetings with prospective lenders to discuss a proposed term loan financing (the “Term Loan Financing”) in connection with the Company’s previously announced proposed acquisition (the “Acquisition”) of Kito Crosby Limited (“Kito Crosby”) pursuant to the Stock Purchase Agreement, dated February 10, 2025, by and among the Company, Kito Crosby, the equity holders of Kito Crosby set forth on the signature pages thereto and Ascend Overseas Limited, solely in its capacity as the representative.

A copy of the relevant portions of the Lender Presentation is furnished herewith pursuant to Regulation FD, in the general form presented in the Lender Presentation, as Exhibit 99.2 to this Current Report on Form 8-K and is incorporated herein by reference.

Interim Unaudited Consolidated Financial Statements of Kito Crosby

For use in connection with the Lender Presentation, the Company is disclosing the interim unaudited condensed consolidated financial statements of Kito Crosby and its subsidiaries as of September 30, 2025 and December 31, 2024 and the three and nine months ended September 30, 2025 and 2024, and the notes related thereto. This information is included in Exhibit 99.3 attached to this Current Report on Form 8-K and incorporated herein by reference.

Preliminary Unaudited Estimated Selected Financial Results of Kito Crosby

For use in connection with the Lender Presentation, the Company is disclosing certain preliminary unaudited estimated financial results as of and for the fiscal year ended December 31, 2025 for Kito Crosby.

Kito Crosby’s financial results as of and for the fiscal year ended December 31, 2025 are not yet complete and are not expected to be available until after the completion of the Term Loan Financing. Accordingly, the Company is disclosing ranges, rather than specific amounts, for certain estimated preliminary unaudited financial results of Kito Crosby set forth below as of and for the fiscal year ended December 31, 2025. The unaudited estimated financial results set forth below are preliminary and subject to revision upon Kito Crosby’s completion of its fiscal year end financial closing processes and its fiscal year-end audit. Kito Crosby’s estimated preliminary unaudited financial results set forth below are forward-looking statements based solely upon information available to the Company as of the date of this Current Report on Form 8-K. This data is not a comprehensive statement of Kito Crosby’s financial results for the fiscal year ended December 31, 2025, and Kito Crosby’s actual results may differ materially from the estimated preliminary unaudited financial results set forth below upon the completion of its financial closing procedures, as a result of the fiscal year-end audit or upon occurrence of other developments that may arise prior to the time its financial results are finalized. You should not place undue reliance on these preliminary estimates.

Kito Crosby’s independent auditor, Deloitte & Touche LLP, has not audited, reviewed, compiled or performed any procedures with respect to the estimated preliminary financial results. Accordingly, Deloitte & Touche LLP does not express an opinion or any other form of assurance with respect thereto.

Based upon such preliminary estimated financial results, Kito Crosby expects that its net sales for the fiscal year ended December 31, 2025 will range between $1,130 million to $1,140 million and Adjusted EBITDA will range between $268 million to $275 million. Kito Crosby also estimates, based upon such preliminary estimated financial results, that Kito Crosby’s orders received during the fiscal year ended December 31, 2025 will range between $1,175 million and $1,180 million and that, as of December 31, 2025, its backlog will range between $200 million and $205 million.


The Company has not included a GAAP reconciliation for Kito Crosby’s Adjusted EBITDA for the fiscal year ended December 31, 2025 to anticipated net income for Kito Crosby because Kito Crosby has not yet completed its financial closing procedures for the fiscal year ended December 31, 2025 and such reconciliation could not be produced without unreasonable effort.

Preliminary Unaudited Estimated Selected Financial Results of Divestiture Business

For use in connection with the Lender Presentation, the Company is disclosing certain preliminary unaudited estimated financial results for the three and nine months ended December 31, 2025 for its U.S. power chain hoist and chain manufacturing operations based out of its Damascus, Virginia and Lexington, Tennessee facilities expected to be divested, as previously announced (the “Divestiture Business”).

The Divestiture Business’s financial results for the three and nine months ended December 31, 2025 are not yet complete and are not expected to be available until after the completion of the Term Loan Financing. Accordingly, the Company is disclosing ranges, rather than specific amounts, for certain estimated preliminary unaudited financial results of the Divestiture Business set forth below for the three and nine months ended December 31, 2025. The unaudited estimated financial results set forth below are preliminary and subject to revision upon the Company’s completion of its quarter-end financial closing processes. The Company’s estimated preliminary unaudited financial results of the Divestiture Business set forth below are forward-looking statements based solely upon information available to the Company as of the date of this Current Report on Form 8-K. This data is not a comprehensive statement of the Divestiture Business’s financial results for the three and nine months ended December 31, 2025, and the Company and the Divestiture Business’s actual results may differ materially from the estimated preliminary unaudited financial results set forth below upon the completion of its financial closing procedures or upon occurrence of other developments that may arise prior to the time its financial results are finalized. You should not place undue reliance on these preliminary estimates.

The Company’s independent auditor, Ernst & Young LLP, has not audited, reviewed, compiled or performed any procedures with respect to the preliminary financial results. Accordingly, Ernst & Young LLP does not express an opinion or any other form of assurance with respect thereto.

Based on information currently available to the Company, the Company currently expects that the Divestiture Business contributed between $33 million to $36 million and between $10 million to $15 million to its net sales and Adjusted EBITDA, respectively, for the three months ended December 31, 2025 and between $100 million to $105 million and between $30 million to $38 million to its net sales and Adjusted EBITDA, respectively, for the nine months ended December 31, 2025.

The Company has not included a GAAP reconciliation for the Divestiture Business’s Adjusted EBITDA for the three and nine months ended December 31, 2025 to anticipated net income for the Divestiture Business because the Company has not yet completed its financial closing procedures for the fiscal quarter ended December 31, 2025 and such reconciliation could not be produced without unreasonable effort.

The information contained in this Item 7.01 and Exhibit 99.2 hereto is deemed “furnished” and shall not be deemed “filed” for purposes of Section 18 of the Exchange Act, nor shall it be deemed incorporated by reference into any filing under the Securities Act, except as shall be expressly set forth in such filing.

Forward-Looking Statements

This report may contain statements concerning the Company’s expectations, beliefs, plans, objectives, goals, strategies, and future events or performance, including, but not limited to, the statements about the proposed Term Loan Financing, the Company’s intention to enter into the proposed Term Loan Financing, the expected use of proceeds, the Acquisition of Kito Crosby, the sale of the Divestiture Business, the preliminary unaudited estimates of net sales, Adjusted EBITDA, orders and backlog of the Company as of and for the three and nine months ended December 31, 2025, the preliminary unaudited estimates of net sales, Adjusted EBITDA, orders and backlog of Kito Crosby as of and for the fiscal year ended December 31, 2025, the preliminary unaudited estimate of Adjusted earnings per share of the Company for the three and nine months ended December 31, 2025 and the preliminary unaudited estimates of net sales and Adjusted EBITDA for the Divestiture Business for the three and nine months ended December 31, 2025. Such statements are “forward-looking” statements within the meaning of the Private Securities Litigation Reform Act of 1995 and relate to trends and events that


may affect the Company’s, the Divestiture Business’ and Kito Crosby’s future financial position and operating results. The terms such as “will,” “may,” “could,” “would,” “plan,” “believe,” “expect,” “anticipate,” “intend,” “project,” “target,” and similar words or expressions, as well as statements in future tense, are intended to identify forward-looking statements. Forward-looking statements should not be read as a guarantee of future performance or results, and will not necessarily be accurate indications of the times at, or by, which such performance or results will be achieved. Forward-looking statements are based on information available at the time those statements are made and/or management’s good faith belief as of that time with respect to future events and are subject to risks and may differ materially from those expressed in or suggested by the forward-looking statements. These risks and uncertainties related to the Company include factors detailed in the reports the Company files with the Securities and Exchange Commission, including those described under “Risk Factors” in its most recent Annual Report on Form 10-K and its Quarterly Reports on Form 10-Q. It is not possible to foresee or identify all such factors and except as required by applicable law, the Company makes no commitment to update any forward-looking statement or to disclose any facts, events or circumstances after the date hereof that may affect the accuracy of any forward-looking statement.


Item 9.01

Financial Statements and Exhibits.


(d)

Exhibits.


EXHIBIT
NUMBER


DESCRIPTION

99.1    Press Release dated January 14, 2026.
99.2    Excerpts from Lender Presentation, dated January 14, 2026.
99.3    Interim unaudited condensed consolidated financial statements of Kito Crosby and its subsidiaries as of September 30, 2025 and December 31, 2024 and the three and nine months ended September 30, 2025 and 2024.
104    Cover Page Interactive Data File (the cover page XBRL tags are embedded within the Inline XBRL document).


SIGNATURES

Pursuant to the requirements of the Securities Exchange Act of 1934, the registrant has duly caused this report to be signed on its behalf by the undersigned hereunto duly authorized.


COLUMBUS McKINNON CORPORATION
By:  

/s/ Gregory P. Rustowicz

Name:   Gregory P. Rustowicz
Title:   Executive Vice President - Finance and Chief
Financial Officer (Principal Financial Officer)

Dated: January 14, 2026

Exhibit 99.1


LOGO

News Release


13320 Ballantyne Corporate Place Suite D

Charlotte, NC 28277

Immediate Release

Columbus McKinnon Announces Select Estimated Preliminary Financial Results for Third Quarter

CHARLOTTE, NC, January 14, 2026—Columbus McKinnon Corporation (Nasdaq: CMCO) (“Columbus McKinnon” or the “Company”), a leading designer, manufacturer and marketer of intelligent motion solutions for material handling, today announced select estimated preliminary unaudited financial results as of and for its third quarter, which ended December 31, 2025.

The Company currently expects net sales to range between $250 million to $260 million for the three months ended December 31, 2025 and between $747 million to $757 million for the nine months ended December 31, 2025.

The Company currently expects Adjusted EBITDA(1) to range between $38 million to $40 million for the three months ended December 31, 2025 and between $115 million to $117 million for the nine months ended December 31, 2025.

The Company currently expects Adjusted EPS to range between $0.58 to $0.63 for the three months ended December 31, 2025 and between $1.70 to $1.75 for the nine months ended December 31, 2025.

In addition, the Company estimates, based upon information currently available to it, that orders received during the three months ended December 31, 2025 will range between $245 million and $250 million. This compares with orders of $253.7 million in the second quarter of fiscal 2026.

The Company estimates, based upon information currently available to it, that backlog will range between $335 million and $345 million as of December 31, 2025, down 3% at the midpoint from backlog of $351.6 million in the second quarter of fiscal 2026 and up 5% at the midpoint from backlog of $322.5 million at the end of fiscal 2025.

The unaudited estimated financial results provided in this release do not give effect to the Company’s previously announced pending acquisition of Kito Crosby Limited or to the Company’s previously announced pending divestiture of its U.S. power chain hoist and chain manufacturing operations based out of its Damascus, Virginia and Lexington, Tennessee facilities. The unaudited estimated financial results are preliminary and subject to revision based upon the completion of the Company’s quarter-end financial closing processes. As a result, the Company’s actual results as of and for the three and nine months ended December 31, 2025 may differ materially from the estimated preliminary unaudited financial results upon the completion of its financial closing procedures or upon occurrence of other developments that may arise prior to the time its financial results are finalized. In addition, the Company’s independent registered public accounting firm does not express an opinion or any other form of assurance with respect to these estimated preliminary results. Additional information and disclosures would be required for a more complete understanding of the


Company’s financial position and results of operations as of, and for the three and nine months ended on, December 31, 2025. The Company has not included a GAAP reconciliation of its Adjusted EBITDA to anticipated net income or its Adjusted EPS to GAAP EPS for the three and nine months ended December 31, 2025 because it has not yet completed its financial closing procedures for the three and nine months ended December 31, 2025 and such reconciliation could not be produced without unreasonable effort. The Company will provide detailed financial results, including a full GAAP reconciliation of its Adjusted EBITDA and its Adjusted EPS for the three and nine months ended December 31, 2025, in early February when it releases third quarter fiscal 2026 earnings and files its Quarterly Report on Form 10-Q for the fiscal quarter ended December 31, 2025.


(1)

In connection with the preparation of the estimated preliminary unaudited financial results of the Company contained herein, the Company has updated its definition of Adjusted EBITDA to include an addback of Company’s stock-based compensation expense. This revised definition of Adjusted EBITDA was used to determine the unaudited estimated Adjusted EBITDA set forth above and will be used by the Company on a go-forward basis for purposes of all future Adjusted EBITDA disclosures. This definitional change was driven by the Company’s belief that adding back the expense associated with stock-based compensation for purposes of the computation of Adjusted EBITDA will provide the Company’s investors with a better understanding of our underlying performance from period to period and enable them to better compare our performance against that of our peer companies, many of which also include an addback of stock-based compensation expense in computing Adjusted EBITDA.

About Columbus McKinnon

Columbus McKinnon is a leading worldwide designer, manufacturer and marketer of intelligent motion solutions that move the world forward and improve lives by efficiently and ergonomically moving, lifting, positioning, and securing materials. Key products include hoists, crane components, precision conveyor systems, rigging tools, light rail workstations, and digital power and motion control systems. The Company is focused on commercial and industrial applications that require the safety and quality provided by its superior design and engineering know-how.

Safe Harbor Statement

This news release contains “forward-looking statements” within the meaning of the Private Securities Litigation Reform Act of 1995. Such forward-looking statements are generally identified by the use of forward-looking terminology, including the terms “anticipate,” “believe,” “continue,” “could,” “estimate,” “expect,” “illustrative,” “intend,” “likely,” “may,” “opportunity,” “plan,” “possible,” “potential,” “predict,” “project,” “shall,” “should,” “target,” “will,” “would” and, in each case, their negative or other various or comparable terminology and include statements concerning preliminary unaudited estimates of net sales, Adjusted EBITDA, Adjusted EPS, orders and backlog. All statements other than statements of historical facts contained in this document are forward looking statements. Forward-looking statements are not based on historical facts, but instead represent our current expectations and assumptions regarding our business, the economy and other future conditions, and involve known and unknown risks, uncertainties and other factors that could cause the actual results, performance or achievements of the Company to differ materially from any future results, performance or achievements expressed or implied by the forward-looking statements. It is not possible to predict or identify all such risks. These risks include, but are not limited to, the risk factors that are described under the section titled “Risk Factors” in our Annual Report on Form 10-K for the fiscal year ended March 31, 2025, our Quarterly Report on Form 10-Q for the quarter ended September 30, 2025 as well as in our other filings with the Securities and Exchange Commission, which are available on its website at www.sec.gov. Given these uncertainties, you should not place undue reliance on these forward-looking statements. Forward-looking statements speak only as of the date they are made. Columbus McKinnon undertakes no duty to update publicly any such forward-looking statement, whether as a result of new information, future events or otherwise, except as may be required by applicable law, regulation or other competent legal authority.


Contacts:

Kristine Moser

VP IR and Treasurer

Columbus McKinnon Corporation

704-322-2488

[email protected]

Exhibit 99.2 Lender Presentation January 2026

Disclaimer Safe Harbor Statement This presentation and the accompanying oral discussion contain “forward-looking statements” within the meaning of Section 27A of the Securities Act of 1933, as amended, and Section 21E of the Securities Exchange Act of 1934, as amended. Such forward looking statements are generally identified by the use of forward-looking terminology, including the terms anticipate, “believe,” “continue,” “could,” “estimate,” “expect,” “illustrative,” “intend,” “likely,” “may,” “opportunity,” “plan,” “possible,” “potential,” “predict,” “project,” “shall,” “should,” “target,” “will,” “would” and, in each case, their negative or other various or comparable terminology. Such forward-looking statements include, among others, statements regarding: (1) our strategy, outlook and growth prospects; (2) our operational and financial targets and capital allocation policy; (3) general economic trends, global policy, including tariff policy, trends in our industry and markets and their expected impacts on Columbus McKinnon; (4) the amount of debt to be paid down by Columbus McKinnon during the 2026 fiscal year and the amount of cost and revenue synergies expected to be achieved after the completion of the Kito Crosby acquisition; (5) the expected benefits of the Kito Crosby acquisition; (6) the expected future financial results of the combined companies and (7) the expected timing for the closing of the Kito Crosby acquisition and the Divestiture. Forward-looking statements are not based on historical facts, but instead represent our current expectations and assumptions regarding our business, the economy and other future conditions, and involve known and unknown risks, uncertainties and other factors that could cause the actual results, performance or achievements of Columbus McKinnon to differ materially from any future results, performance or achievements expressed or implied by the forward-looking statements. It is not possible to predict or identify all such risks. These risks include, but are not limited to, (1) risks relating to the competitive environment in which we operate; (2) the risk that the cost synergies and any revenue synergies from the Kito Crosby transaction may not be fully realized or may take longer than anticipated to be realized; (3) the risk that the integration of Kito Crosby's business and operations into Columbus McKinnon will be materially delayed or will be more costly or difficult than expected, or that Columbus McKinnon is otherwise unable to successfully integrate Kito Crosby's business into its own, including as a result of unexpected factors or events; (4) risks regarding the ability of Columbus McKinnon and Kito Crosby to obtain required governmental approvals of the transaction on the timeline expected, or at all, and the risk that such approvals may result in the imposition of conditions that could adversely affect Columbus McKinnon after the closing of the transaction or adversely affect the expected benefits of the transaction; (5) the failure of the closing conditions in the purchase agreement for each of the acquisition of Kito Crosby and the Divestiture to be satisfied, or any unexpected delay in closing such transactions or the occurrence of any event, change or other circumstances that could give rise to the termination of the purchase agreement relating to each of the acquisition of Kito Crosby and the Divestiture; (6) the possibility that the Kito Crosby acquisition or the Divestiture may be more expensive to complete than anticipated, including as a result of unexpected factors or events; (7) risks related to the general competitive, economic, political and market conditions and other factors that may affect future results of Columbus McKinnon and Kito Crosby; and (8) the other risk factors that are described under the section titled “Risk Factors” in our Annual Report on Form 10-K for the fiscal year ended March 31, 2025 and our Quarterly Report on Form 10-Q for the quarterly period ended September 30, 2025 as well as in our other filings with the Securities and Exchange Commission, which are available on its website at www.sec.gov. Given these uncertainties, you should not place undue reliance on these forward-looking statements. Forward looking statements speak only as of the date they are made. Columbus McKinnon undertakes no duty to update publicly any such forward-looking statement, whether as a result of new information, future events or otherwise, except as may be required by applicable law, regulation or other competent legal authority. Non-GAAP Financial Measures and Forward-looking Non-GAAP Measures This presentation will discuss some non-GAAP (“adjusted”) financial measures which we believe are useful in evaluating our performance. Kito Crosby’s Credit Agreement Adjusted EBITDA represents Adjusted EBITDA as adjusted for CMCO’s Credit Agreement. You should not consider the presentation of this additional information in isolation or as a substitute for results prepared in accordance with GAAP. The non-GAAP financial measures are noted and reconciliations of comparable GAAP measures with non-GAAP financial measures can be found in tables included in the Supplemental Information portion of this presentation. 2

1 Executive Summary
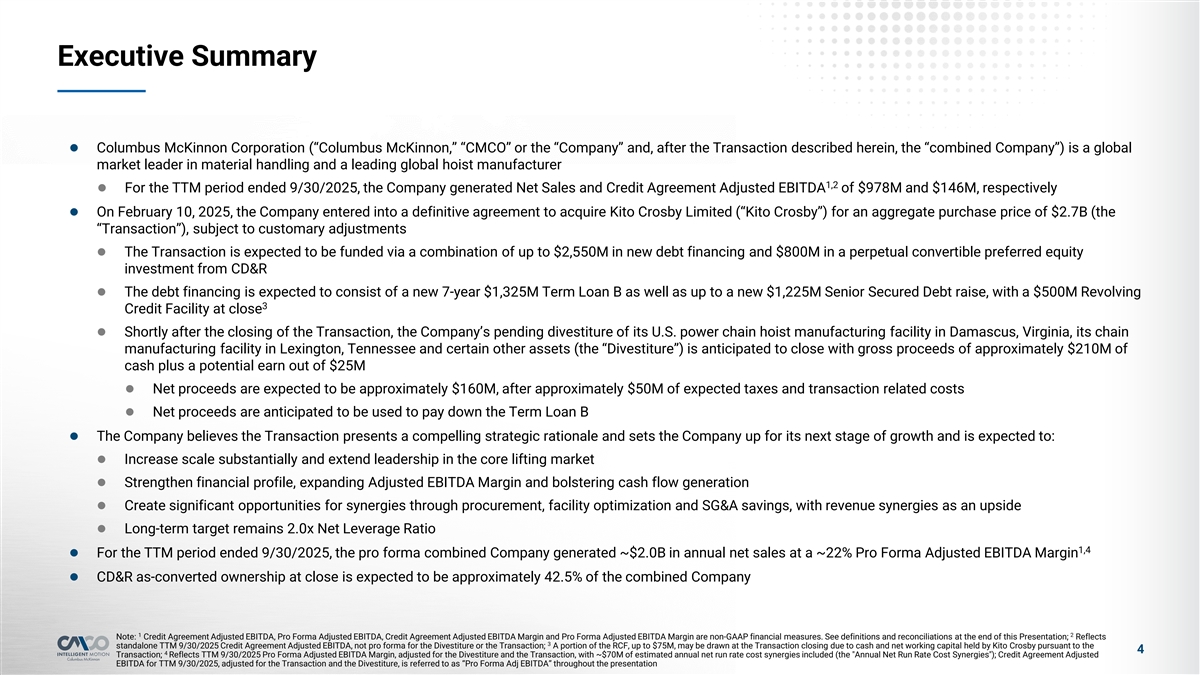

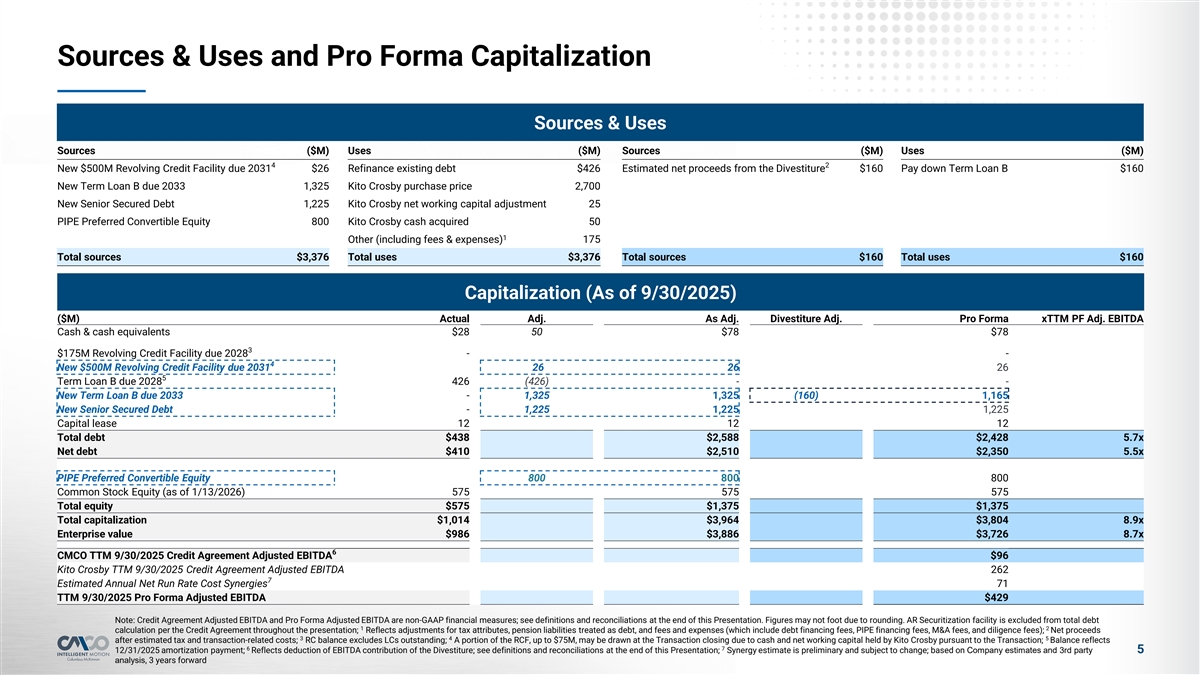
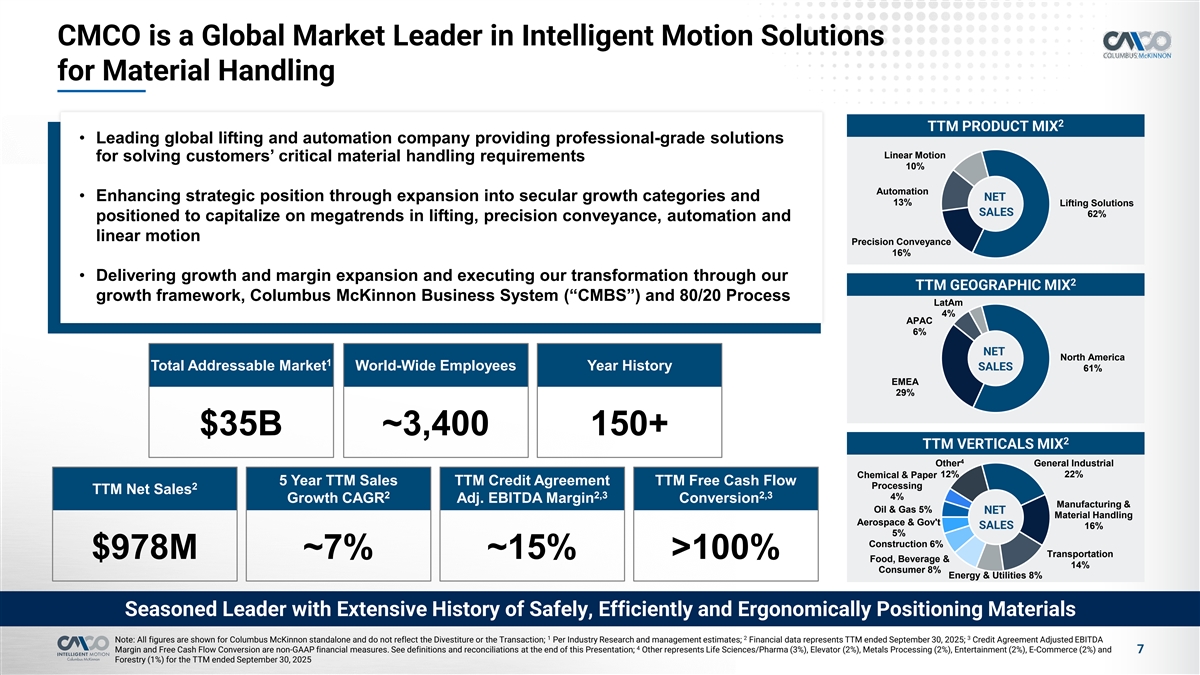
Executive Summary l Columbus McKinnon Corporation (“Columbus McKinnon,” “CMCO” or the “Company” and, after the Transaction described herein, the “combined Company”) is a global market leader in material handling and a leading global hoist manufacturer 1,2 l For the TTM period ended 9/30/2025, the Company generated Net Sales and Credit Agreement Adjusted EBITDA of $978M and $146M, respectively l On February 10, 2025, the Company entered into a definitive agreement to acquire Kito Crosby Limited (“Kito Crosby”) for an aggregate purchase price of $2.7B (the “Transaction”), subject to customary adjustments l The Transaction is expected to be funded via a combination of up to $2,550M in new debt financing and $800M in a perpetual convertible preferred equity investment from CD&R l The debt financing is expected to consist of a new 7-year $1,325M Term Loan B as well as up to a new $1,225M Senior Secured Debt raise, with a $500M Revolving 3 Credit Facility at close l Shortly after the closing of the Transaction, the Company’s pending divestiture of its U.S. power chain hoist manufacturing facility in Damascus, Virginia, its chain manufacturing facility in Lexington, Tennessee and certain other assets (the “Divestiture”) is anticipated to close with gross proceeds of approximately $210M of cash plus a potential earn out of $25M l Net proceeds are expected to be approximately $160M, after approximately $50M of expected taxes and transaction related costs l Net proceeds are anticipated to be used to pay down the Term Loan B l The Company believes the Transaction presents a compelling strategic rationale and sets the Company up for its next stage of growth and is expected to: l Increase scale substantially and extend leadership in the core lifting market l Strengthen financial profile, expanding Adjusted EBITDA Margin and bolstering cash flow generation l Create significant opportunities for synergies through procurement, facility optimization and SG&A savings, with revenue synergies as an upside l Long-term target remains 2.0x Net Leverage Ratio 1,4 l For the TTM period ended 9/30/2025, the pro forma combined Company generated ~$2.0B in annual net sales at a ~22% Pro Forma Adjusted EBITDA Margin l CD&R as-converted ownership at close is expected to be approximately 42.5% of the combined Company 1 2 Note: Credit Agreement Adjusted EBITDA, Pro Forma Adjusted EBITDA, Credit Agreement Adjusted EBITDA Margin and Pro Forma Adjusted EBITDA Margin are non-GAAP financial measures. See definitions and reconciliations at the end of this Presentation; Reflects 3 standalone TTM 9/30/2025 Credit Agreement Adjusted EBITDA, not pro forma for the Divestiture or the Transaction; A portion of the RCF, up to $75M, may be drawn at the Transaction closing due to cash and net working capital held by Kito Crosby pursuant to the 4 4 Transaction; Reflects TTM 9/30/2025 Pro Forma Adjusted EBITDA Margin, adjusted for the Divestiture and the Transaction, with ~$70M of estimated annual net run rate cost synergies included (the Annual Net Run Rate Cost Synergies ); Credit Agreement Adjusted EBITDA for TTM 9/30/2025, adjusted for the Transaction and the Divestiture, is referred to as “Pro Forma Adj EBITDA” throughout the presentation

Sources & Uses and Pro Forma Capitalization Sources & Uses Sources ($M) Uses ($M) Sources ($M) Uses ($M) 4 2 New $500M Revolving Credit Facility due 2031 $26 Refinance existing debt $426 Estimated net proceeds from the Divestiture $160 Pay down Term Loan B $160 New Term Loan B due 2033 1,325 Kito Crosby purchase price 2,700 New Senior Secured Debt 1,225 Kito Crosby net working capital adjustment 25 PIPE Preferred Convertible Equity 800 Kito Crosby cash acquired 50 1 Other (including fees & expenses) 175 Total sources $3,376 Total uses $3,376 Total sources $160 Total uses $160 Capitalization (As of 9/30/2025) ($M) Actual Adj. As Adj. Divestiture Adj. Pro Forma xTTM PF Adj. EBITDA Cash & cash equivalents $28 50 $78 $78 3 $175M Revolving Credit Facility due 2028 - - 4 New $500M Revolving Credit Facility due 2031 26 26 26 5 Term Loan B due 2028 426 (426) - - New Term Loan B due 2033 - 1,325 1,325 (160) 1,165 New Senior Secured Debt - 1,225 1,225 1,225 Capital lease 12 12 12 Total debt $438 $2,588 $2,428 5.7x Net debt $410 $2,510 $2,350 5.5x PIPE Preferred Convertible Equity 800 800 800 Common Stock Equity (as of 1/13/2026) 575 575 575 Total equity $575 $1,375 $1,375 Total capitalization $1,014 $3,964 $3,804 8.9x Enterprise value $986 $3,886 $3,726 8.7x 6 CMCO TTM 9/30/2025 Credit Agreement Adjusted EBITDA $96 Kito Crosby TTM 9/30/2025 Credit Agreement Adjusted EBITDA 262 7 Estimated Annual Net Run Rate Cost Synergies 71 TTM 9/30/2025 Pro Forma Adjusted EBITDA $429 Note: Credit Agreement Adjusted EBITDA and Pro Forma Adjusted EBITDA are non-GAAP financial measures; see definitions and reconciliations at the end of this Presentation. Figures may not foot due to rounding. AR Securitization facility is excluded from total debt 1 2 calculation per the Credit Agreement throughout the presentation; Reflects adjustments for tax attributes, pension liabilities treated as debt, and fees and expenses (which include debt financing fees, PIPE financing fees, M&A fees, and diligence fees); Net proceeds 3 4 5 after estimated tax and transaction-related costs; RC balance excludes LCs outstanding; A portion of the RCF, up to $75M, may be drawn at the Transaction closing due to cash and net working capital held by Kito Crosby pursuant to the Transaction; Balance reflects 6 7 12/31/2025 amortization payment; Reflects deduction of EBITDA contribution of the Divestiture; see definitions and reconciliations at the end of this Presentation; Synergy estimate is preliminary and subject to change; based on Company estimates and 3rd party 5 analysis, 3 years forward

2 Company Overview

CMCO is a Global Market Leader in Intelligent Motion Solutions for Material Handling 2 TTM PRODUCT MIX • Leading global lifting and automation company providing professional-grade solutions Linear Motion for solving customers’ critical material handling requirements 10% Automation • Enhancing strategic position through expansion into secular growth categories and NET 13% Lifting Solutions SALES 62% positioned to capitalize on megatrends in lifting, precision conveyance, automation and linear motion Precision Conveyance 16% • Delivering growth and margin expansion and executing our transformation through our 2 TTM GEOGRAPHIC MIX growth framework, Columbus McKinnon Business System (“CMBS”) and 80/20 Process LatAm 4% APAC 6% NET 1 North America 1 Total Addressable Market Total Addressable Market World-Wide Employees Year History SALES 61% EMEA 29% $35B ~3,400 150+ 2 TTM VERTICALS MIX 4 Other General Industrial 12% 22% Chemical & Paper 5 Year TTM Sales TTM Credit Agreement TTM Free Cash Flow Processing 2 TTM Net Sales 2 2,3 2,3 4% Growth CAGR Adj. EBITDA Margin Conversion Manufacturing & Oil & Gas 5% NET Material Handling Aerospace & Gov't SALES 16% 5% Construction 6% Transportation $978M ~7% ~15% >100% Food, Beverage & 14% Consumer 8% Energy & Utilities 8% Seasoned Leader with Extensive History of Safely, Efficiently and Ergonomically Positioning Materials 1 2 3 Note: All figures are shown for Columbus McKinnon standalone and do not reflect the Divestiture or the Transaction; Per Industry Research and management estimates; Financial data represents TTM ended September 30, 2025; Credit Agreement Adjusted EBITDA 4 Margin and Free Cash Flow Conversion are non-GAAP financial measures. See definitions and reconciliations at the end of this Presentation; Other represents Life Sciences/Pharma (3%), Elevator (2%), Metals Processing (2%), Entertainment (2%), E-Commerce (2%) and 7 Forestry (1%) for the TTM ended September 30, 2025

Intelligent Motion Solutions Four Categories of Solutions to Address Customers’ Unique Motion Control Needs LIFTING PRECISION CONVEYANCE AUTOMATION LINEAR MOTION ~$21.6B TAM ~$6.1B TAM ~$4.6B TAM ~$2.5B TAM l Leading global position in lifting l Develops and manufactures complex l Design and develop drives and controls l Linear actuators with lifting capacity up logistics solutions connecting robots for lifting, linear motion and conveying to 50 tons, screw jacks, rotary unions l Lifting capacity from 1/8 ton to and workspaces with asynchronous systems and super cylinders ~275 tons conveying technology l Used in intelligent material handling l Demonstrated leadership and l Manual chain, electric chain and l Precision Conveyance provides growth solutions from ceiling to floor across differentiated offering wire rope hoists platform in fragmented market entire product portfolio l Serving a breadth of end uses and l Reliable, high-quality products l Tailwinds from megatrends like l Solutions designed to increase uptime, applications from rail to warehousing to automation, onshoring, and growth of enhance productivity and improve defense l End-to-end digital solutions ecommerce and electrification customer safety $35B Total Addressable Market with Tailwinds from Megatrends in Attractive Verticals Source: Industry Research and management estimates 8
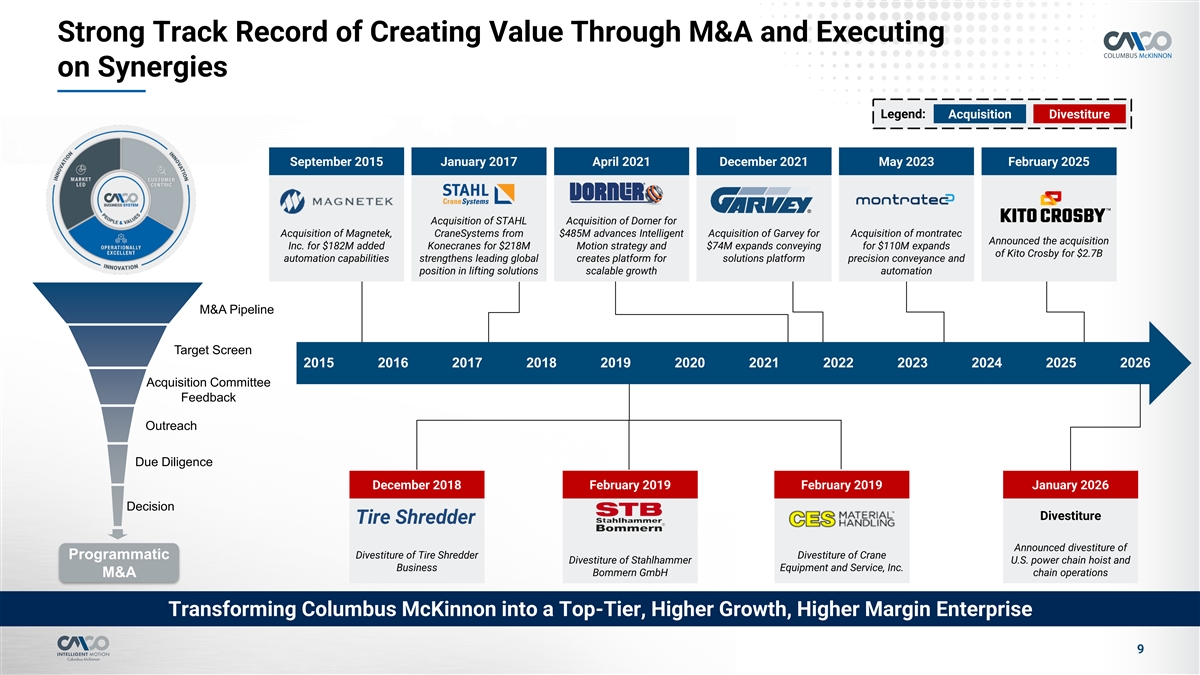

Strong Track Record of Creating Value Through M&A and Executing on Synergies Legend: Acquisition Divestiture December 2021 September 2015 January 2017 April 2021 December 2021 M Ma ay y 2023 2023 February 2025 January 2017 April 2021 Acquisition of STAHL Acquisition of Dorner for Acquisition of Magnetek, CraneSystems from $485M advances Intelligent Acquisition of Garvey for Acquisition of montratec Announced the acquisition Inc. for $182M added Konecranes for $218M Motion strategy and $74M expands conveying for $110M expands of Kito Crosby for $2.7B automation capabilities strengthens leading global creates platform for solutions platform precision conveyance and position in lifting solutions scalable growth automation M&A Pipeline Target Screen 2015 2016 2017 2018 2019 2020 2021 2022 2023 2024 2025 2026 Acquisition Committee Feedback Outreach Due Diligence December 2018 February 2019 February 2019 January 2026 Decision Divestiture Tire Shredder Announced divestiture of Divestiture of Tire Shredder Divestiture of Crane Programmatic Divestiture of Stahlhammer U.S. power chain hoist and Business Equipment and Service, Inc. Bommern GmbH chain operations M&A Transforming Columbus McKinnon into a Top-Tier, Higher Growth, Higher Margin Enterprise 9
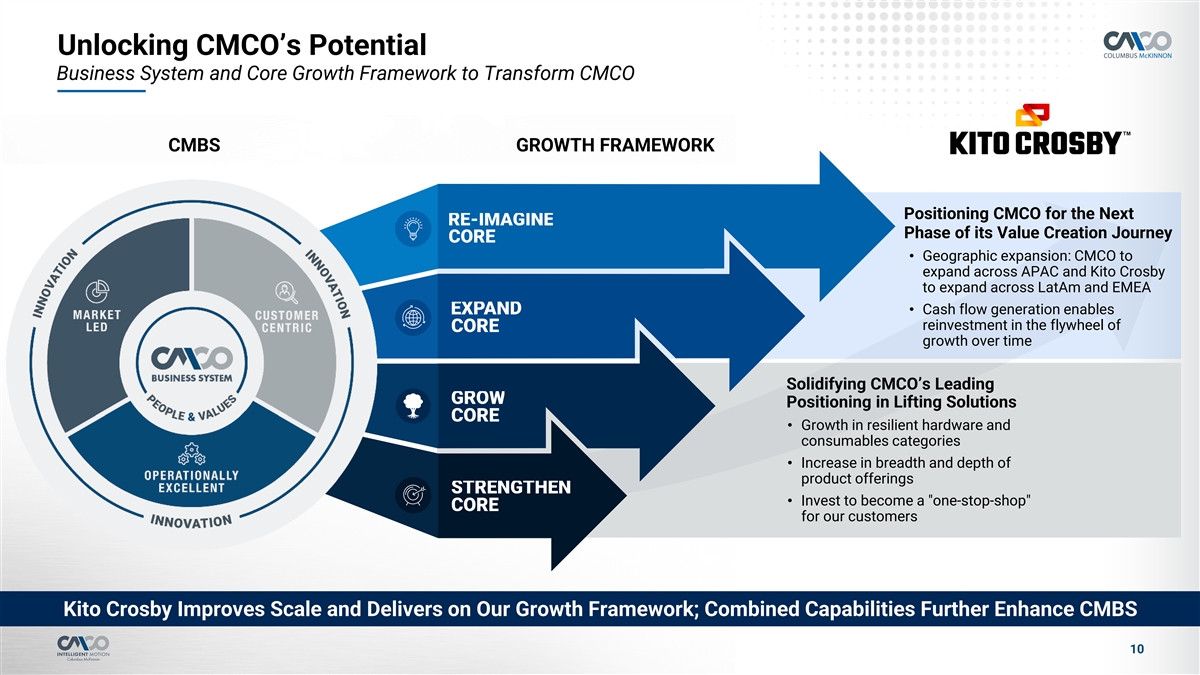

Unlocking CMCO’s Potential Business System and Core Growth Framework to Transform CMCO CMBS GROWTH FRAMEWORK Positioning CMCO for the Next Phase of its Value Creation Journey • Geographic expansion: CMCO to expand across APAC and Kito Crosby to expand across LatAm and EMEA • Cash flow generation enables reinvestment in the flywheel of growth over time Solidifying CMCO’s Leading Positioning in Lifting Solutions • Growth in resilient hardware and consumables categories • Increase in breadth and depth of product offerings • Invest to become a one-stop-shop for our customers Kito Crosby Improves Scale and Delivers on Our Growth Framework; Combined Capabilities Further Enhance CMBS 10
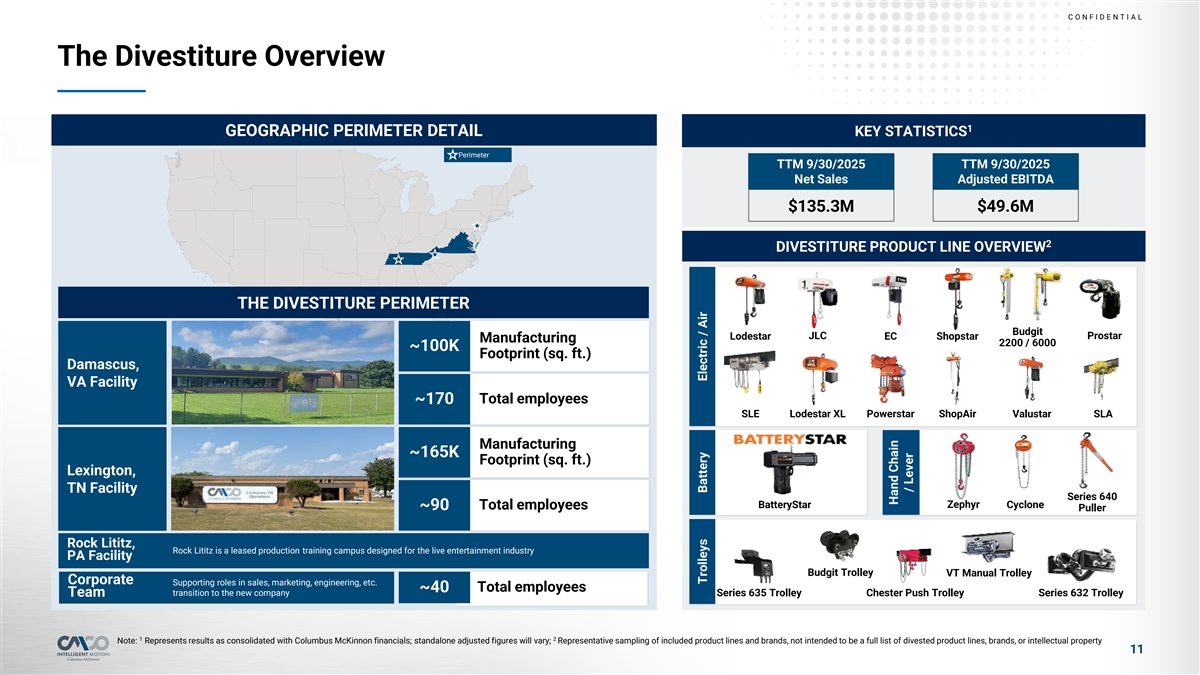

C O NF I D E NT I A L The Divestiture Overview 1 GEOGRAPHIC PERIMETER DETAIL KEY STATISTICS Perimeter TTM 9/30/2025 TTM 9/30/2025 Net Sales Adjusted EBITDA $135.3M $49.6M 2 DIVESTITURE PRODUCT LINE OVERVIEW THE DIVESTITURE PERIMETER Budgit Lodestar JLC EC Shopstar Prostar Manufacturing 2200 / 6000 ~100K Footprint (sq. ft.) Damascus, VA Facility Total employees ~170 SLE Lodestar XL Powerstar ShopAir Valustar SLA Manufacturing ~165K Footprint (sq. ft.) Lexington, TN Facility Series 640 BatteryStar Zephyr Cyclone Total employees ~90 Puller Rock Lititz, Rock Lititz is a leased production training campus designed for the live entertainment industry PA Facility Budgit Trolley VT Manual Trolley Corporate Supporting roles in sales, marketing, engineering, etc. Total employees ~40 transition to the new company Team Series 635 Trolley Chester Push Trolley Series 632 Trolley 1 2 Note: Represents results as consolidated with Columbus McKinnon financials; standalone adjusted figures will vary; Representative sampling of included product lines and brands, not intended to be a full list of divested product lines, brands, or intellectual property 11 Trolleys Battery Electric / Air Hand Chain / Lever
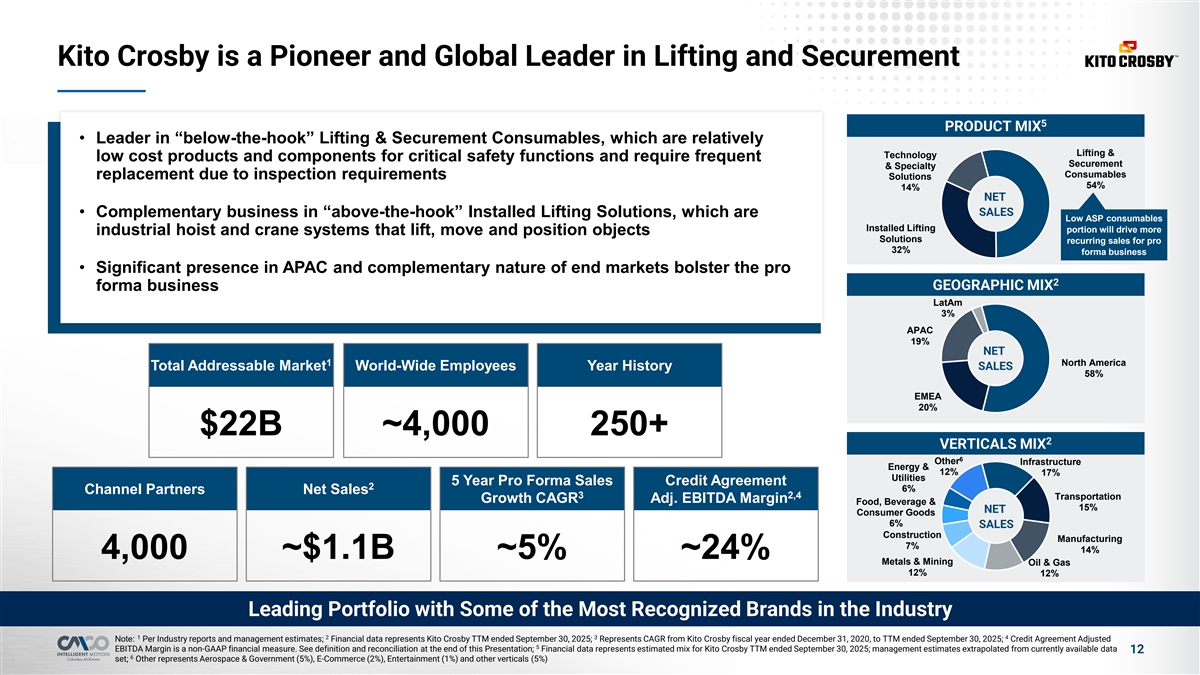

Kito Crosby is a Pioneer and Global Leader in Lifting and Securement 5 PRODUCT MIX • Leader in “below-the-hook” Lifting & Securement Consumables, which are relatively Lifting & Technology low cost products and components for critical safety functions and require frequent Securement & Specialty Consumables replacement due to inspection requirements Solutions 54% 14% NET SALES • Complementary business in “above-the-hook” Installed Lifting Solutions, which are Low ASP consumables Installed Lifting portion will drive more industrial hoist and crane systems that lift, move and position objects Solutions recurring sales for pro 32% forma business • Significant presence in APAC and complementary nature of end markets bolster the pro 2 GEOGRAPHIC MIX forma business LatAm 3% APAC 19% NET 1 North America 1 Total Addressable Market SALES Total Addressable Market World-Wide Employees Year History 58% EMEA 20% $22B ~4,000 250+ 2 VERTICALS MIX 6 Other Infrastructure Energy & 12% 17% Utilities 5 Year Pro Forma Sales Credit Agreement 2 6% Channel Partners Net Sales 3 2,4 Transportation Growth CAGR Adj. EBITDA Margin Food, Beverage & 15% NET Consumer Goods 6% SALES Construction Manufacturing 7% 14% 4,000 ~$1.1B ~5% ~24% Metals & Mining Oil & Gas 12% 12% Leading Portfolio with Some of the Most Recognized Brands in the Industry 1 2 3 4 Note: Per Industry reports and management estimates; Financial data represents Kito Crosby TTM ended September 30, 2025; Represents CAGR from Kito Crosby fiscal year ended December 31, 2020, to TTM ended September 30, 2025; Credit Agreement Adjusted 5 EBITDA Margin is a non-GAAP financial measure. See definition and reconciliation at the end of this Presentation; Financial data represents estimated mix for Kito Crosby TTM ended September 30, 2025; management estimates extrapolated from currently available data 12 6 set; Other represents Aerospace & Government (5%), E-Commerce (2%), Entertainment (1%) and other verticals (5%)
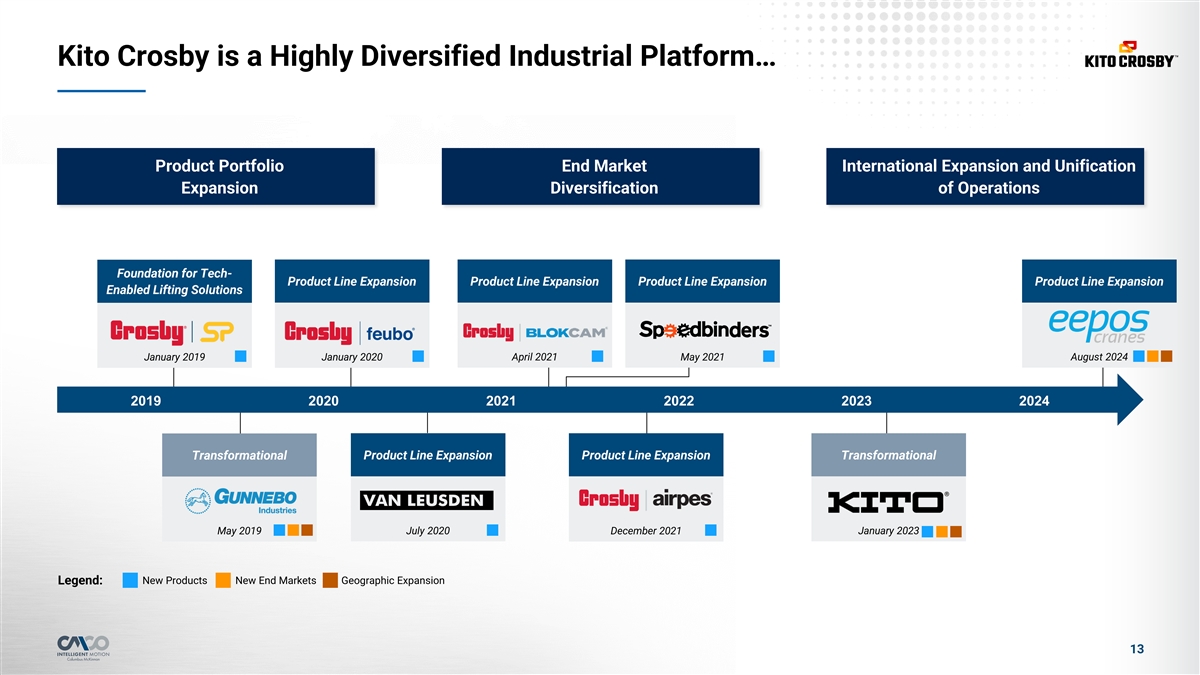

Kito Crosby is a Highly Diversified Industrial Platform… Product Portfolio End Market International Expansion and Unification Expansion Diversification of Operations Foundation for Tech- Product Line Expansion Product Line Expansion Product Line Expansion Product Line Expansion Enabled Lifting Solutions January 2019 January 2020 April 2021 May 2021 August 2024 2019 2020 2021 2022 2023 2024 Transformational Product Line Expansion Product Line Expansion Transformational May 2019 July 2020 December 2021 January 2023 Legend: New Products New End Markets Geographic Expansion 13
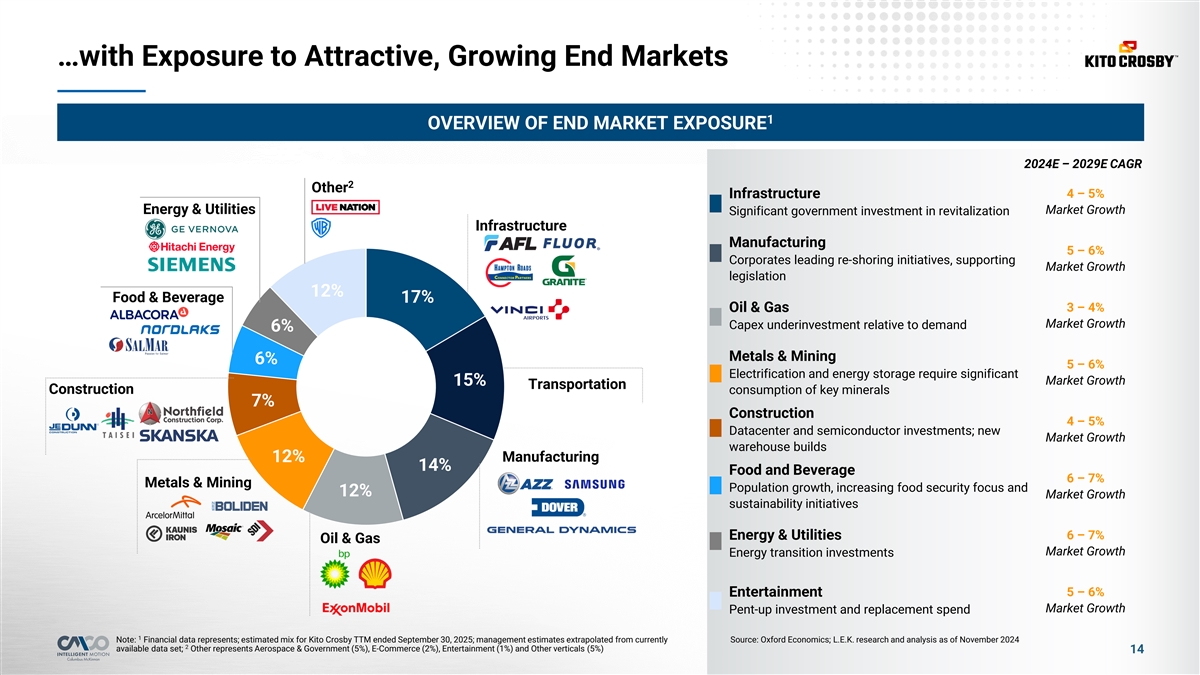

…with Exposure to Attractive, Growing End Markets 1 OVERVIEW OF END MARKET EXPOSURE 2024E – 2029E CAGR 2 Other Infrastructure 4 – 5% Market Growth Energy & Utilities Significant government investment in revitalization Infrastructure Manufacturing 5 – 6% Corporates leading re-shoring initiatives, supporting Market Growth legislation 12% Food & Beverage 17% 3 – 4% Oil & Gas Market Growth Capex underinvestment relative to demand 6% Metals & Mining 6% 5 – 6% Electrification and energy storage require significant Market Growth 15% Transportation Construction consumption of key minerals 7% Construction 4 – 5% Datacenter and semiconductor investments; new Market Growth warehouse builds Manufacturing 12% 14% Food and Beverage 6 – 7% Metals & Mining Population growth, increasing food security focus and 12% Market Growth sustainability initiatives Energy & Utilities 6 – 7% Oil & Gas Market Growth Energy transition investments 5 – 6% Entertainment Market Growth Pent-up investment and replacement spend 1 Note: Financial data represents; estimated mix for Kito Crosby TTM ended September 30, 2025; management estimates extrapolated from currently Source: Oxford Economics; L.E.K. research and analysis as of November 2024 2 available data set; Other represents Aerospace & Government (5%), E-Commerce (2%), Entertainment (1%) and Other verticals (5%) 14
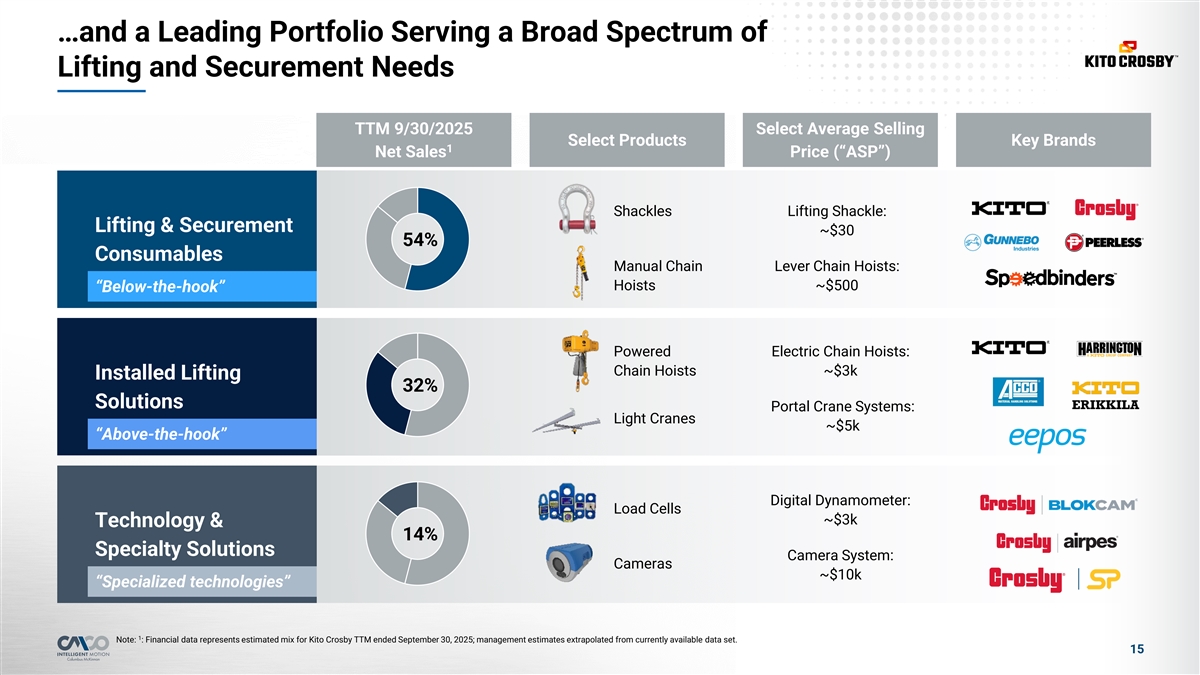

…and a Leading Portfolio Serving a Broad Spectrum of Lifting and Securement Needs TTM 9/30/2025 Select Average Selling Select Products Key Brands 1 Net Sales Price (“ASP”) Shackles Lifting Shackle: Lifting & Securement ~$30 54% Consumables Manual Chain Lever Chain Hoists: Hoists ~$500 “Below-the-hook” Powered Electric Chain Hoists: Chain Hoists ~$3k Installed Lifting 32% Solutions Portal Crane Systems: Light Cranes ~$5k “Above-the-hook” Digital Dynamometer: Load Cells ~$3k Technology & 14% Specialty Solutions Camera System: Cameras ~$10k “Specialized technologies” 1 Note: : Financial data represents estimated mix for Kito Crosby TTM ended September 30, 2025; management estimates extrapolated from currently available data set. 15
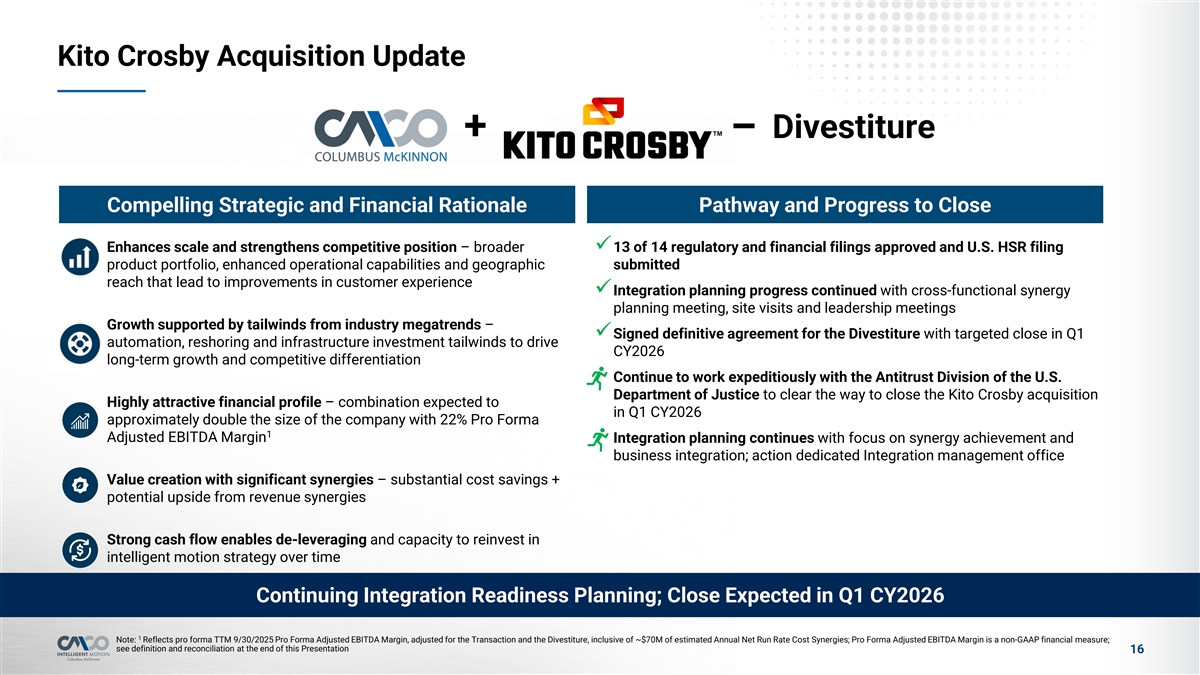

Kito Crosby Acquisition Update Divestiture + – Compelling Strategic and Financial Rationale Pathway and Progress to Close Enhances scale and strengthens competitive position – broader ü13 of 14 regulatory and financial filings approved and U.S. HSR filing product portfolio, enhanced operational capabilities and geographic submitted reach that lead to improvements in customer experience üIntegration planning progress continued with cross-functional synergy planning meeting, site visits and leadership meetings Growth supported by tailwinds from industry megatrends – üSigned definitive agreement for the Divestiture with targeted close in Q1 automation, reshoring and infrastructure investment tailwinds to drive CY2026 long-term growth and competitive differentiation üContinue to work expeditiously with the Antitrust Division of the U.S. Department of Justice to clear the way to close the Kito Crosby acquisition Highly attractive financial profile – combination expected to in Q1 CY2026 approximately double the size of the company with 22% Pro Forma 1 Adjusted EBITDA Margin üIntegration planning continues with focus on synergy achievement and business integration; action dedicated Integration management office Value creation with significant synergies – substantial cost savings + potential upside from revenue synergies Strong cash flow enables de-leveraging and capacity to reinvest in intelligent motion strategy over time Continuing Integration Readiness Planning; Close Expected in Q1 CY2026 1 Note: Reflects pro forma TTM 9/30/2025 Pro Forma Adjusted EBITDA Margin, adjusted for the Transaction and the Divestiture, inclusive of ~$70M of estimated Annual Net Run Rate Cost Synergies; Pro Forma Adjusted EBITDA Margin is a non-GAAP financial measure; see definition and reconciliation at the end of this Presentation 16
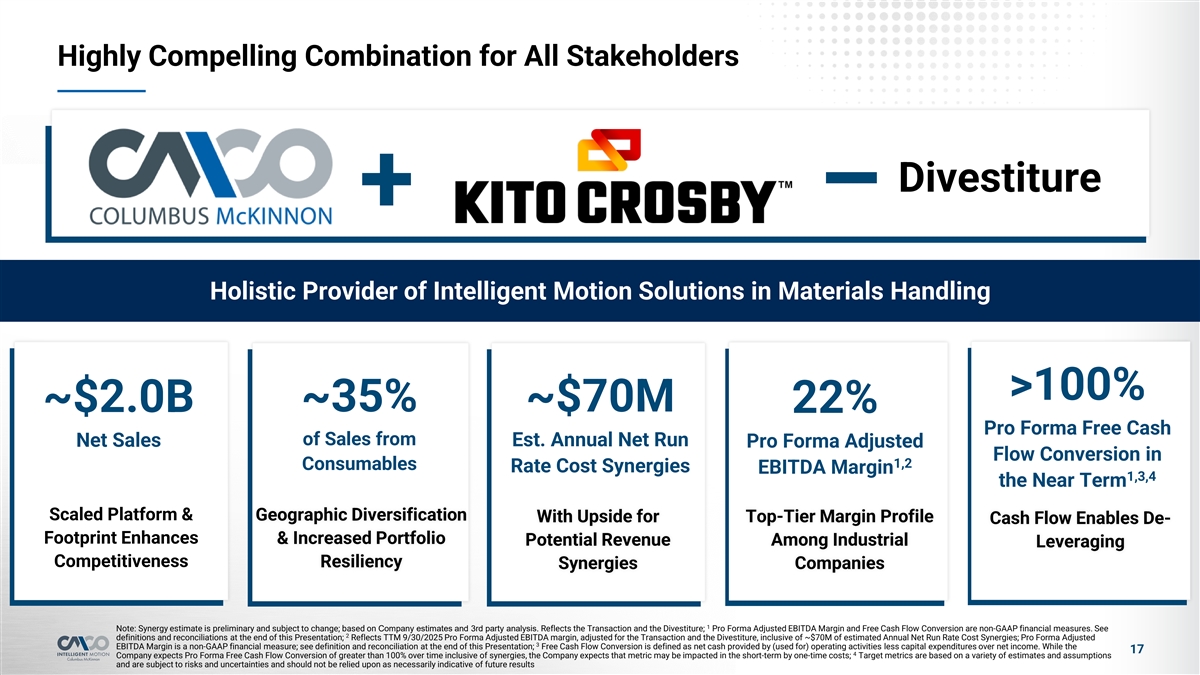

Highly Compelling Combination for All Stakeholders Divestiture + – Holistic Provider of Intelligent Motion Solutions in Materials Handling >100% ~35% ~$70M ~$2.0B 22% Pro Forma Free Cash of Sales from Net Sales Est. Annual Net Run Pro Forma Adjusted Flow Conversion in 1,2 Consumables Rate Cost Synergies EBITDA Margin 1,3,4 the Near Term Scaled Platform & Geographic Diversification Top-Tier Margin Profile With Upside for Cash Flow Enables De- Footprint Enhances & Increased Portfolio Potential Revenue Among Industrial Leveraging Competitiveness Resiliency Synergies Companies 1 Note: Synergy estimate is preliminary and subject to change; based on Company estimates and 3rd party analysis. Reflects the Transaction and the Divestiture; Pro Forma Adjusted EBITDA Margin and Free Cash Flow Conversion are non-GAAP financial measures. See 2 definitions and reconciliations at the end of this Presentation; Reflects TTM 9/30/2025 Pro Forma Adjusted EBITDA margin, adjusted for the Transaction and the Divestiture, inclusive of ~$70M of estimated Annual Net Run Rate Cost Synergies; Pro Forma Adjusted 3 EBITDA Margin is a non-GAAP financial measure; see definition and reconciliation at the end of this Presentation; Free Cash Flow Conversion is defined as net cash provided by (used for) operating activities less capital expenditures over net income. While the 17 4 Company expects Pro Forma Free Cash Flow Conversion of greater than 100% over time inclusive of synergies, the Company expects that metric may be impacted in the short-term by one-time costs; Target metrics are based on a variety of estimates and assumptions and are subject to risks and uncertainties and should not be relied upon as necessarily indicative of future results


3 Key Credit Highlights
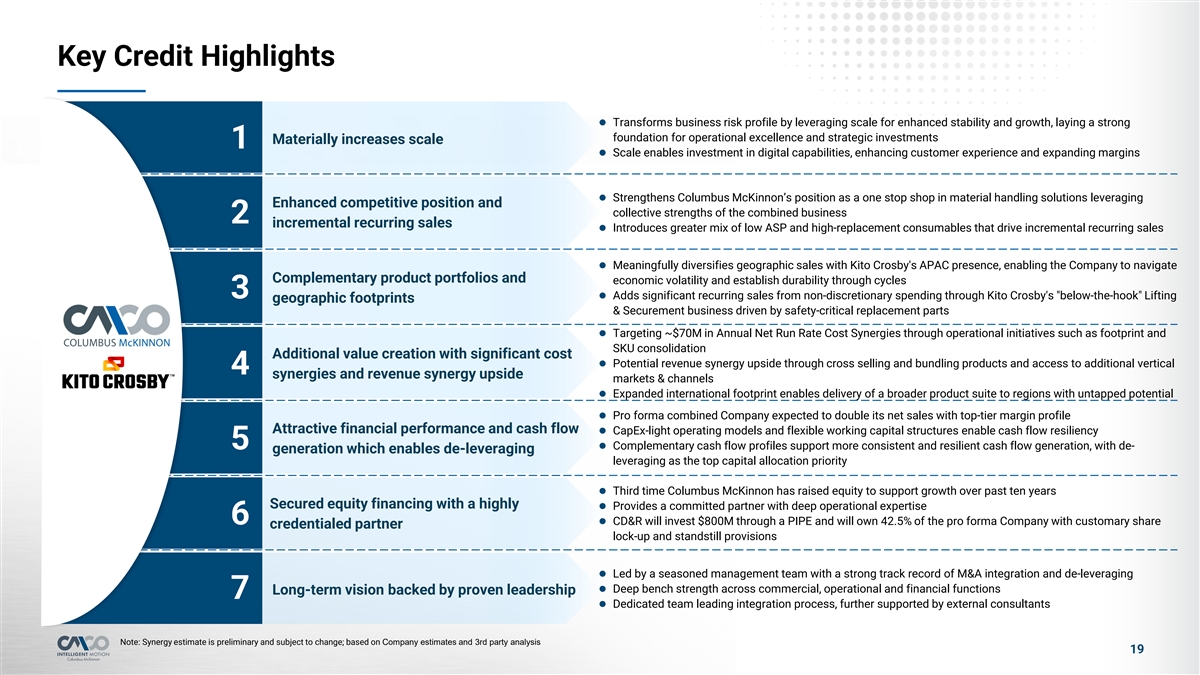

Key Credit Highlights l Transforms business risk profile by leveraging scale for enhanced stability and growth, laying a strong foundation for operational excellence and strategic investments Materially increases scale 1 l Scale enables investment in digital capabilities, enhancing customer experience and expanding margins l Strengthens Columbus McKinnon’s position as a one stop shop in material handling solutions leveraging Enhanced competitive position and collective strengths of the combined business 2 incremental recurring sales l Introduces greater mix of low ASP and high-replacement consumables that drive incremental recurring sales l Meaningfully diversifies geographic sales with Kito Crosby's APAC presence, enabling the Company to navigate Complementary product portfolios and economic volatility and establish durability through cycles 3l Adds significant recurring sales from non-discretionary spending through Kito Crosby's below-the-hook Lifting geographic footprints & Securement business driven by safety-critical replacement parts l Targeting ~$70M in Annual Net Run Rate Cost Synergies through operational initiatives such as footprint and SKU consolidation Additional value creation with significant cost l Potential revenue synergy upside through cross selling and bundling products and access to additional vertical 4 synergies and revenue synergy upside markets & channels l Expanded international footprint enables delivery of a broader product suite to regions with untapped potential l Pro forma combined Company expected to double its net sales with top-tier margin profile Attractive financial performance and cash flow l CapEx-light operating models and flexible working capital structures enable cash flow resiliency 5l Complementary cash flow profiles support more consistent and resilient cash flow generation, with de- generation which enables de-leveraging leveraging as the top capital allocation priority l Third time Columbus McKinnon has raised equity to support growth over past ten years Secured equity financing with a highly l Provides a committed partner with deep operational expertise 6l CD&R will invest $800M through a PIPE and will own 42.5% of the pro forma Company with customary share credentialed partner lock-up and standstill provisions l Led by a seasoned management team with a strong track record of M&A integration and de-leveraging l Deep bench strength across commercial, operational and financial functions Long-term vision backed by proven leadership 7 l Dedicated team leading integration process, further supported by external consultants Note: Synergy estimate is preliminary and subject to change; based on Company estimates and 3rd party analysis 19
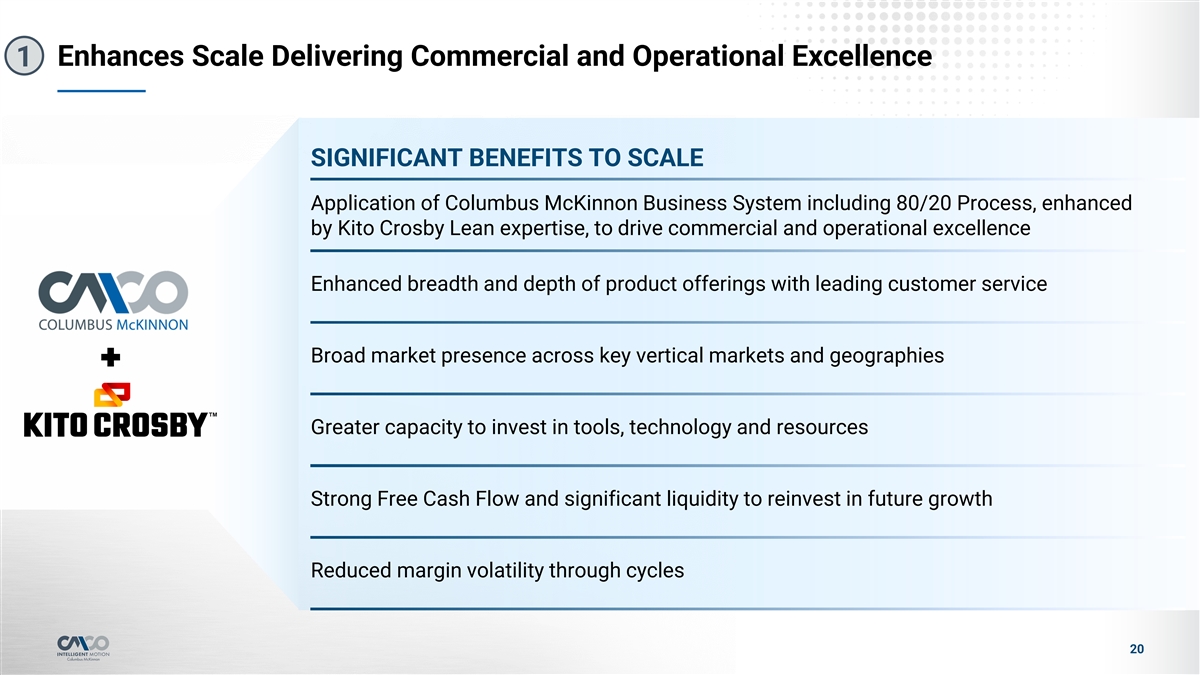

Enhances Scale Delivering Commercial and Operational Excellence 1 SIGNIFICANT BENEFITS TO SCALE Application of Columbus McKinnon Business System including 80/20 Process, enhanced by Kito Crosby Lean expertise, to drive commercial and operational excellence Enhanced breadth and depth of product offerings with leading customer service Broad market presence across key vertical markets and geographies Greater capacity to invest in tools, technology and resources Strong Free Cash Flow and significant liquidity to reinvest in future growth Reduced margin volatility through cycles 20
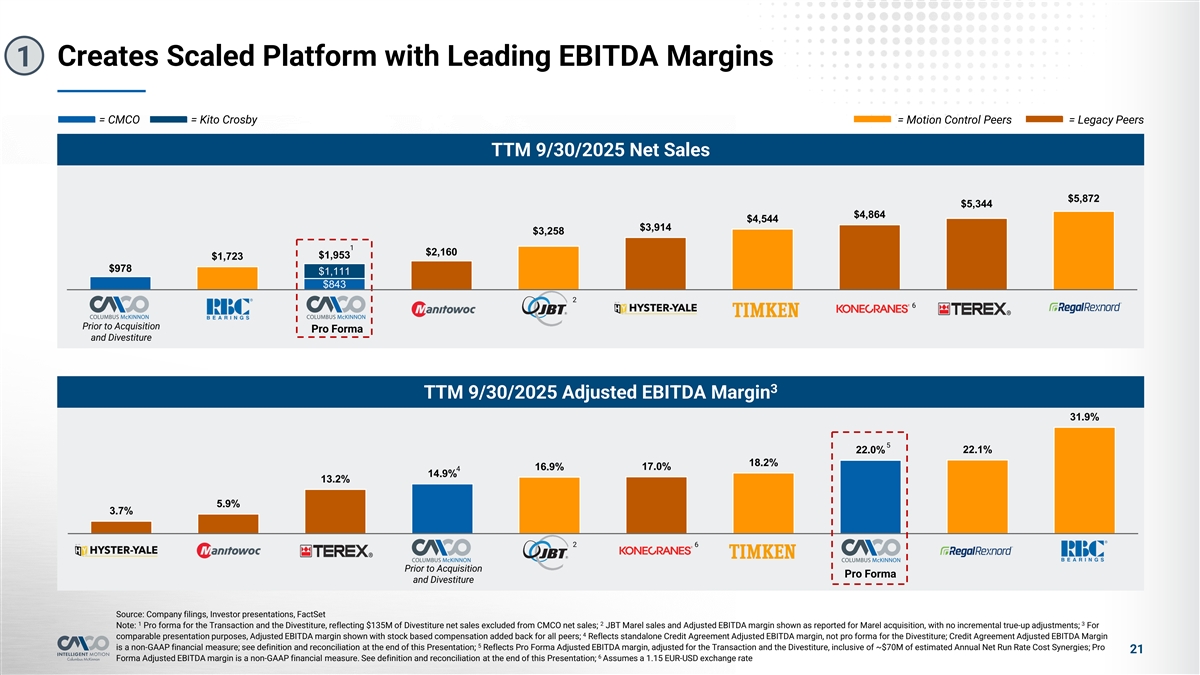

Creates Scaled Platform with Leading EBITDA Margins 1 = CMCO = Kito Crosby = Motion Control Peers = Legacy Peers TTM 9/30/2025 Net Sales $5,872 $5,344 $4,864 $4,544 $3,914 $3,258 1 $2,160 $1,953 $1,723 $978 $1,111 $843 2 6 Prior to Acquisition Pro Forma and Divestiture 3 TTM 9/30/2025 Adjusted EBITDA Margin 31.9% 5 22.0% 22.1% 18.2% 16.9% 17.0% 4 14.9% 13.2% 5.9% 3.7% 2 6 Prior to Acquisition Pro Forma and Divestiture Source: Company filings, Investor presentations, FactSet 1 2 3 Note: Pro forma for the Transaction and the Divestiture, reflecting $135M of Divestiture net sales excluded from CMCO net sales; JBT Marel sales and Adjusted EBITDA margin shown as reported for Marel acquisition, with no incremental true-up adjustments; For 4 comparable presentation purposes, Adjusted EBITDA margin shown with stock based compensation added back for all peers; Reflects standalone Credit Agreement Adjusted EBITDA margin, not pro forma for the Divestiture; Credit Agreement Adjusted EBITDA Margin 5 is a non-GAAP financial measure; see definition and reconciliation at the end of this Presentation; Reflects Pro Forma Adjusted EBITDA margin, adjusted for the Transaction and the Divestiture, inclusive of ~$70M of estimated Annual Net Run Rate Cost Synergies; Pro 21 6 Forma Adjusted EBITDA margin is a non-GAAP financial measure. See definition and reconciliation at the end of this Presentation; Assumes a 1.15 EUR-USD exchange rate
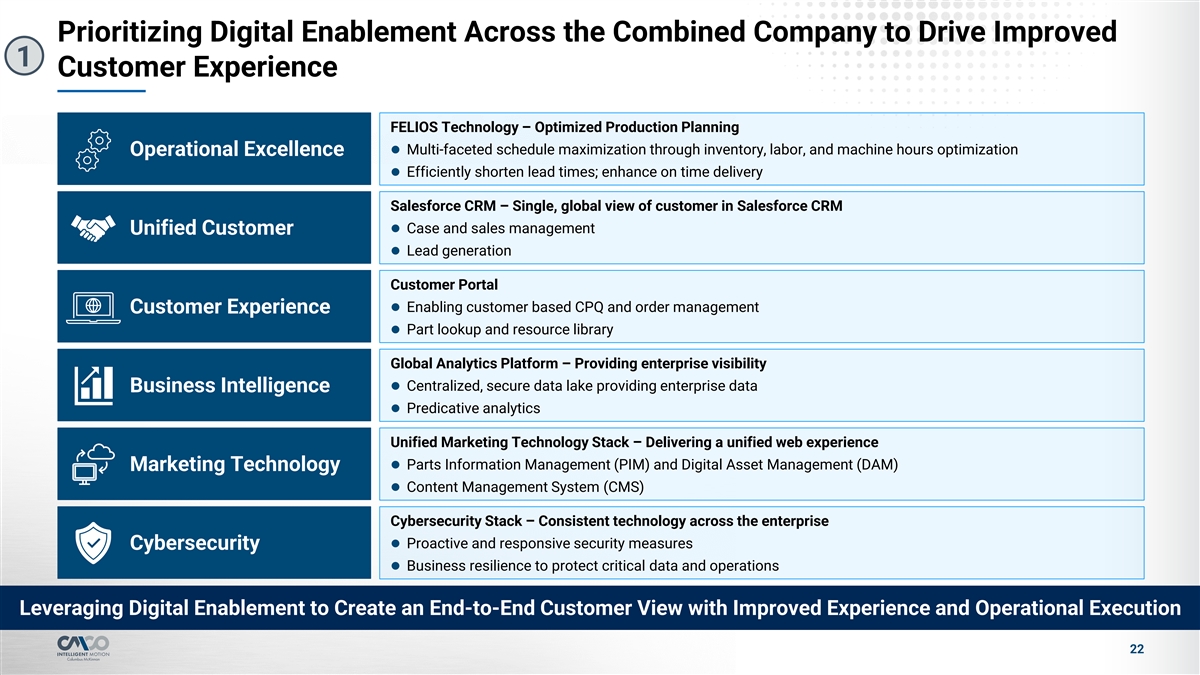

Prioritizing Digital Enablement Across the Combined Company to Drive Improved 1 Customer Experience FELIOS Technology – Optimized Production Planning l Multi-faceted schedule maximization through inventory, labor, and machine hours optimization Operational Excellence l Efficiently shorten lead times; enhance on time delivery Salesforce CRM – Single, global view of customer in Salesforce CRM l Case and sales management Unified Customer l Lead generation Customer Portal l Enabling customer based CPQ and order management Customer Experience l Part lookup and resource library Global Analytics Platform – Providing enterprise visibility l Centralized, secure data lake providing enterprise data Business Intelligence l Predicative analytics Unified Marketing Technology Stack – Delivering a unified web experience l Parts Information Management (PIM) and Digital Asset Management (DAM) Marketing Technology l Content Management System (CMS) Cybersecurity Stack – Consistent technology across the enterprise l Proactive and responsive security measures Cybersecurity l Business resilience to protect critical data and operations Leveraging Digital Enablement to Create an End-to-End Customer View with Improved Experience and Operational Execution 22
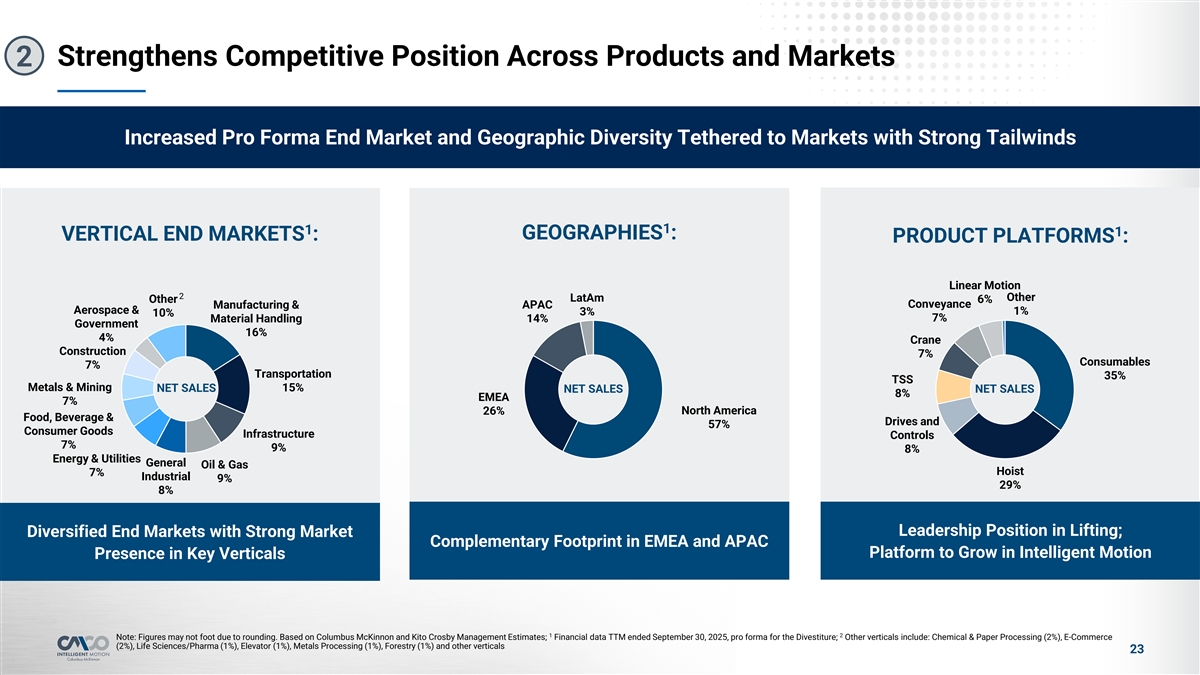

Strengthens Competitive Position Across Products and Markets 2 Increased Pro Forma End Market and Geographic Diversity Tethered to Markets with Strong Tailwinds 1 1 1 GEOGRAPHIES : VERTICAL END MARKETS : PRODUCT PLATFORMS : Linear Motion 2 Other LatAm Other 6% Manufacturing & APAC Conveyance Aerospace & 1% 3% 10% 7% Material Handling 14% Government 16% 4% Crane Construction 7% Consumables 7% Transportation 35% TSS Metals & Mining NET SALES 15% NET SALES NET SALES 8% EMEA 7% 26% North America Food, Beverage & Drives and 57% Consumer Goods Infrastructure Controls 7% 9% 8% Energy & Utilities General Oil & Gas Hoist 7% Industrial 9% 29% 8% Leadership Position in Lifting; Diversified End Markets with Strong Market Complementary Footprint in EMEA and APAC Platform to Grow in Intelligent Motion Presence in Key Verticals 1 2 Note: Figures may not foot due to rounding. Based on Columbus McKinnon and Kito Crosby Management Estimates; Financial data TTM ended September 30, 2025, pro forma for the Divestiture; Other verticals include: Chemical & Paper Processing (2%), E-Commerce (2%), Life Sciences/Pharma (1%), Elevator (1%), Metals Processing (1%), Forestry (1%) and other verticals 23
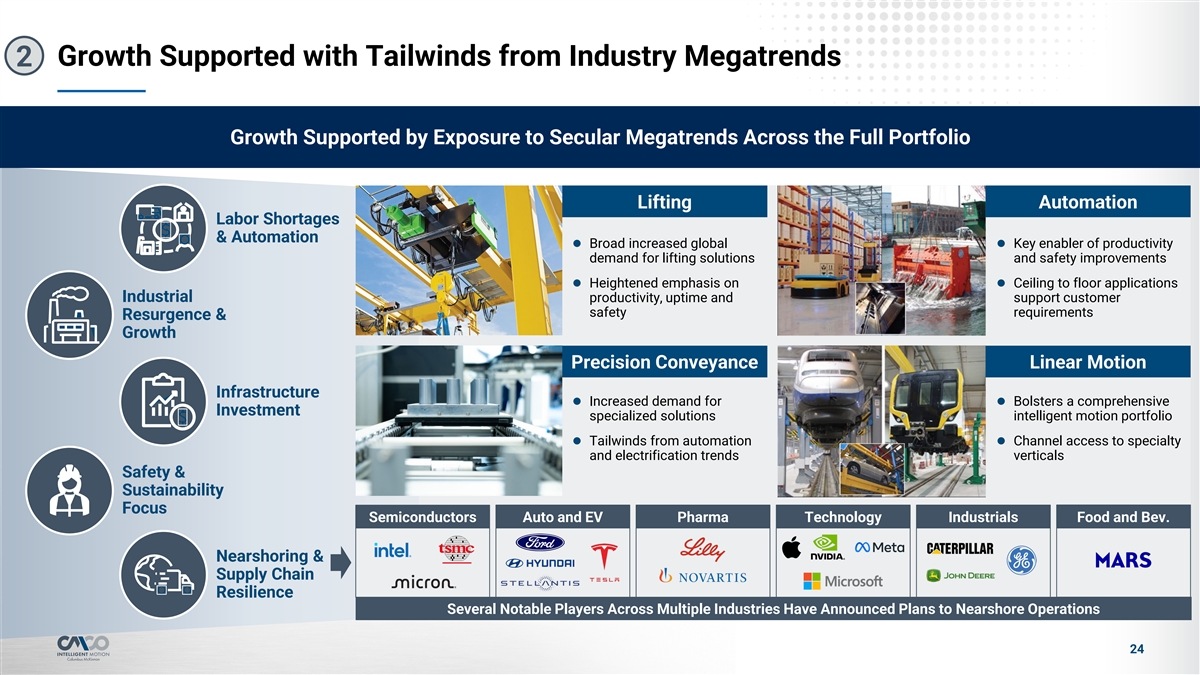

Growth Supported with Tailwinds from Industry Megatrends 2 Growth Supported by Exposure to Secular Megatrends Across the Full Portfolio Lifting Automation Labor Shortages & Automation l Broad increased global l Key enabler of productivity demand for lifting solutions and safety improvements l Heightened emphasis on l Ceiling to floor applications Industrial productivity, uptime and support customer safety requirements Resurgence & Growth Precision Conveyance Linear Motion Infrastructure l Increased demand for l Bolsters a comprehensive Investment specialized solutions intelligent motion portfolio l Tailwinds from automation l Channel access to specialty and electrification trends verticals Safety & Sustainability Focus Semiconductors Auto and EV Pharma Technology Industrials Food and Bev. Nearshoring & Supply Chain Resilience Several Notable Players Across Multiple Industries Have Announced Plans to Nearshore Operations 24
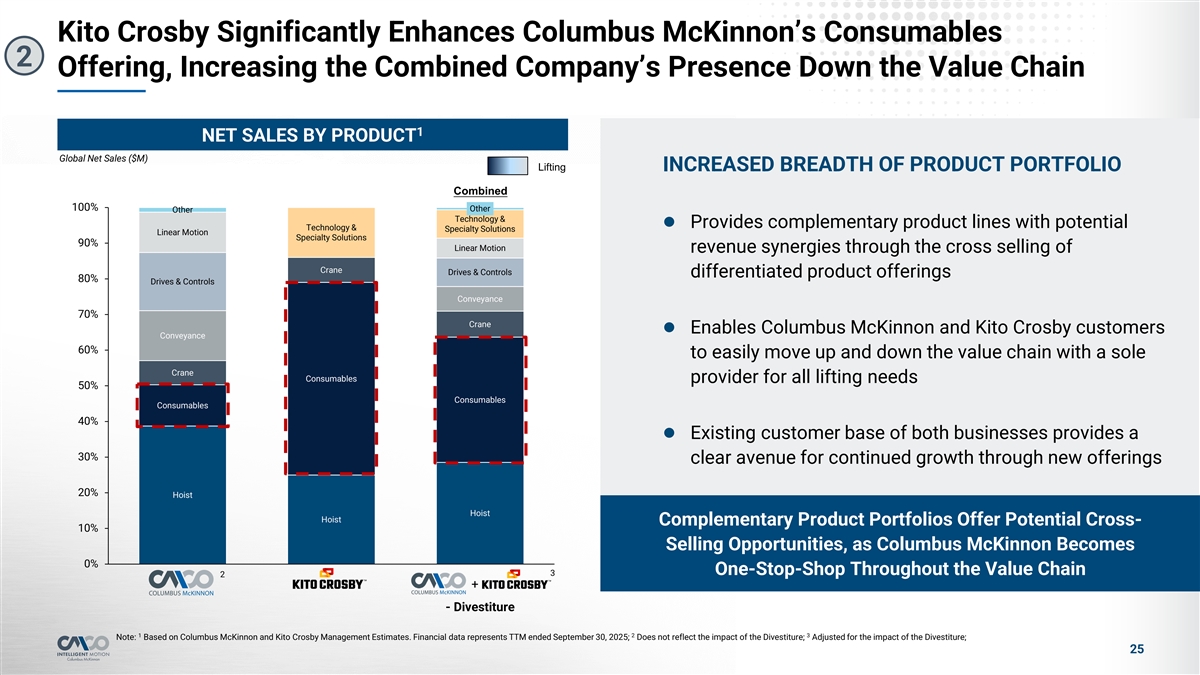

Kito Crosby Significantly Enhances Columbus McKinnon’s Consumables 2 Offering, Increasing the Combined Company’s Presence Down the Value Chain 1 NET SALES BY PRODUCT Global Net Sales ($M) Lifting INCREASED BREADTH OF PRODUCT PORTFOLIO Combined 100% Other Other Technology & l Provides complementary product lines with potential Technology & Specialty Solutions Linear Motion Specialty Solutions 90% Linear Motion revenue synergies through the cross selling of Crane Drives & Controls differentiated product offerings 80% Drives & Controls Conveyance 70% Crane l Enables Columbus McKinnon and Kito Crosby customers Conveyance 60% to easily move up and down the value chain with a sole Crane Consumables provider for all lifting needs 50% Consumables Consumables 40% l Existing customer base of both businesses provides a 30% clear avenue for continued growth through new offerings 20% Hoist Hoist Hoist Complementary Product Portfolios Offer Potential Cross- 10% Selling Opportunities, as Columbus McKinnon Becomes 0% One-Stop-Shop Throughout the Value Chain 3 2 + - Divestiture 1 2 3 Note: Based on Columbus McKinnon and Kito Crosby Management Estimates. Financial data represents TTM ended September 30, 2025; Does not reflect the impact of the Divestiture; Adjusted for the impact of the Divestiture; 25
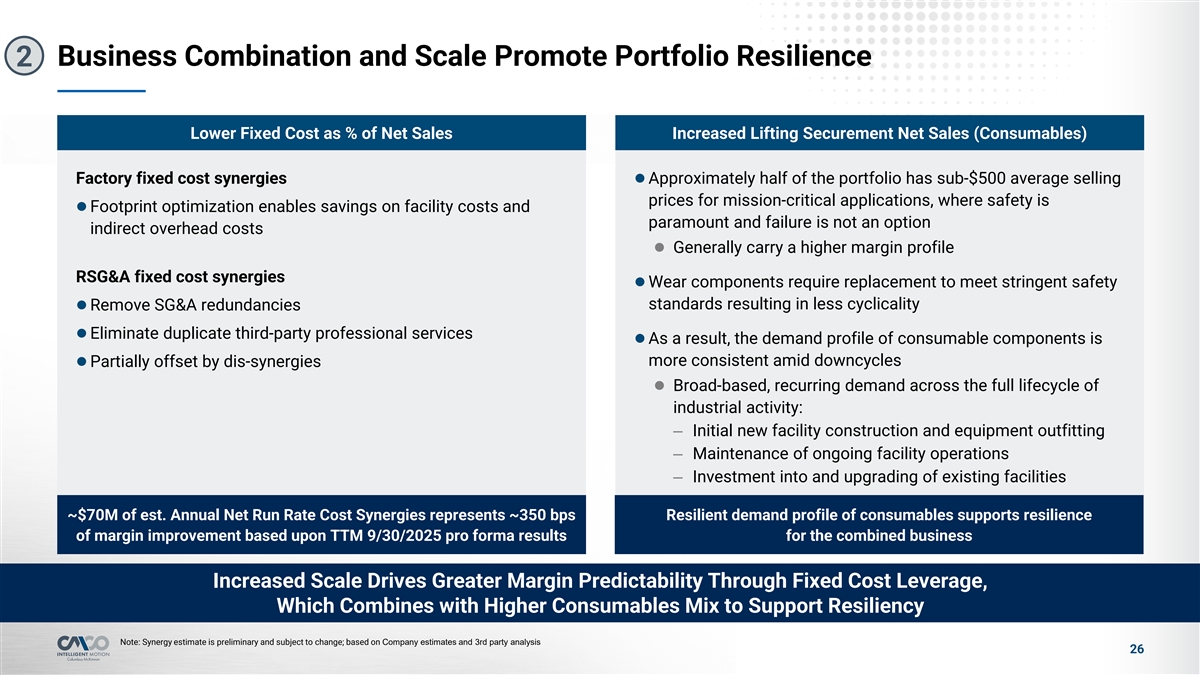

Business Combination and Scale Promote Portfolio Resilience 2 Lower Fixed Cost as % of Net Sales Increased Lifting Securement Net Sales (Consumables) Factory fixed cost synergiesl Approximately half of the portfolio has sub-$500 average selling prices for mission-critical applications, where safety is l Footprint optimization enables savings on facility costs and paramount and failure is not an option indirect overhead costs l Generally carry a higher margin profile RSG&A fixed cost synergies l Wear components require replacement to meet stringent safety standards resulting in less cyclicality l Remove SG&A redundancies l Eliminate duplicate third-party professional services l As a result, the demand profile of consumable components is more consistent amid downcycles l Partially offset by dis-synergies l Broad-based, recurring demand across the full lifecycle of industrial activity: – Initial new facility construction and equipment outfitting – Maintenance of ongoing facility operations – Investment into and upgrading of existing facilities ~$70M of est. Annual Net Run Rate Cost Synergies represents ~350 bps Resilient demand profile of consumables supports resilience of margin improvement based upon TTM 9/30/2025 pro forma results for the combined business Increased Scale Drives Greater Margin Predictability Through Fixed Cost Leverage, Which Combines with Higher Consumables Mix to Support Resiliency Note: Synergy estimate is preliminary and subject to change; based on Company estimates and 3rd party analysis 26
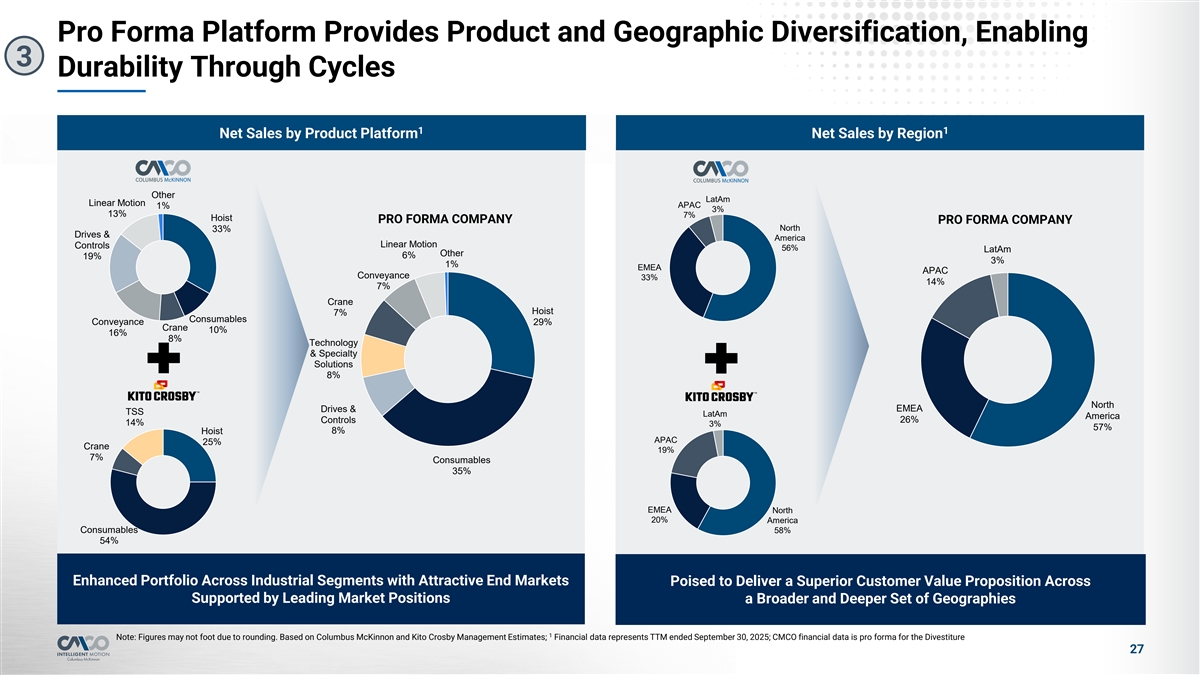

Pro Forma Platform Provides Product and Geographic Diversification, Enabling 3 Durability Through Cycles 1 1 Net Sales by Product Platform Net Sales by Region Other LatAm Linear Motion APAC 1% 3% 13% 7% Hoist PRO FORMA COMPANY PRO FORMA COMPANY North 33% Drives & America Linear Motion Controls 56% LatAm Other 6% 19% 3% 1% EMEA APAC Conveyance 33% 14% 7% Crane Hoist 7% Consumables Conveyance 29% Crane 10% 16% 8% Technology & Specialty Solutions 8% North EMEA Drives & TSS LatAm America Controls 26% 14% 3% 57% Hoist 8% APAC 25% Crane 19% 7% Consumables 35% EMEA North 20% America Consumables 58% 54% Enhanced Portfolio Across Industrial Segments with Attractive End Markets Poised to Deliver a Superior Customer Value Proposition Across Supported by Leading Market Positions a Broader and Deeper Set of Geographies 1 Note: Figures may not foot due to rounding. Based on Columbus McKinnon and Kito Crosby Management Estimates; Financial data represents TTM ended September 30, 2025; CMCO financial data is pro forma for the Divestiture 27
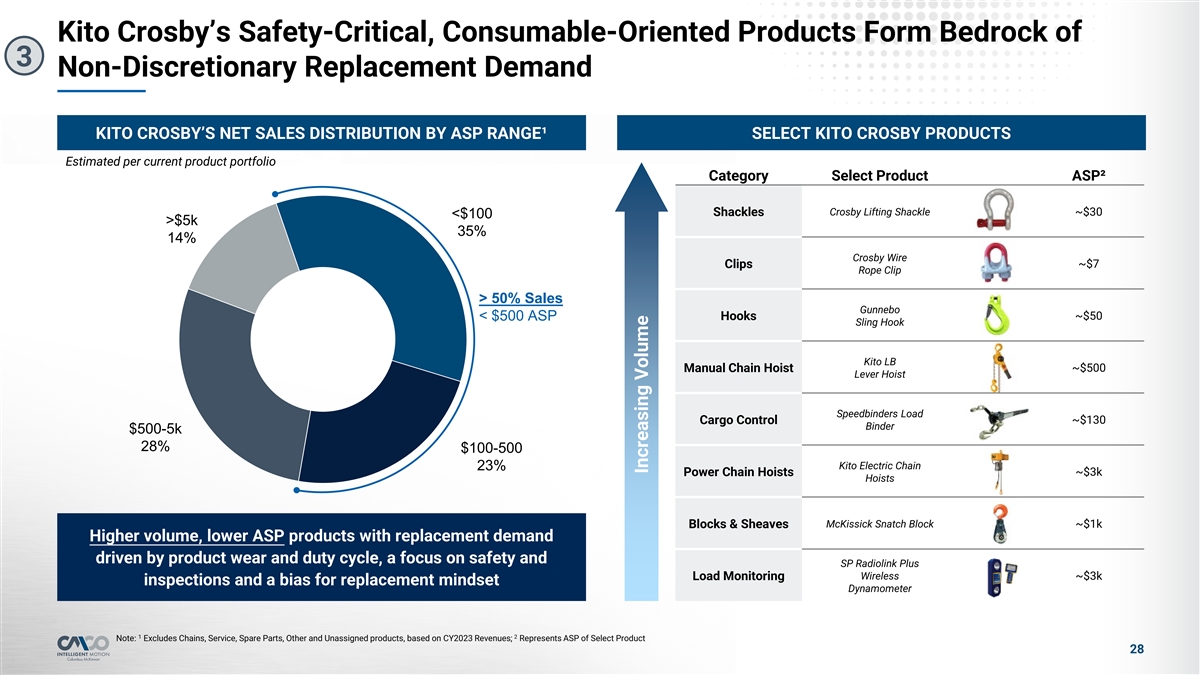

Kito Crosby’s Safety-Critical, Consumable-Oriented Products Form Bedrock of 3 Non-Discretionary Replacement Demand KITO CROSBY’S NET SALES DISTRIBUTION BY ASP RANGE¹ SELECT KITO CROSBY PRODUCTS Estimated per current product portfolio Category Select Product ASP² Crosby Lifting Shackle ~$30 Shackles <$100 >$5k 35% 14% Crosby Wire Clips ~$7 Rope Clip > 50% Sales Gunnebo Hooks ~$50 < $500 ASP Sling Hook Kito LB Manual Chain Hoist ~$500 Lever Hoist Speedbinders Load Cargo Control ~$130 Binder $500-5k 28% $100-500 Kito Electric Chain 23% Power Chain Hoists ~$3k Hoists Blocks & Sheaves McKissick Snatch Block ~$1k Higher volume, lower ASP products with replacement demand driven by product wear and duty cycle, a focus on safety and SP Radiolink Plus Wireless Load Monitoring ~$3k inspections and a bias for replacement mindset Dynamometer 1 2 Note: Excludes Chains, Service, Spare Parts, Other and Unassigned products, based on CY2023 Revenues; Represents ASP of Select Product 28 Increasing Volume
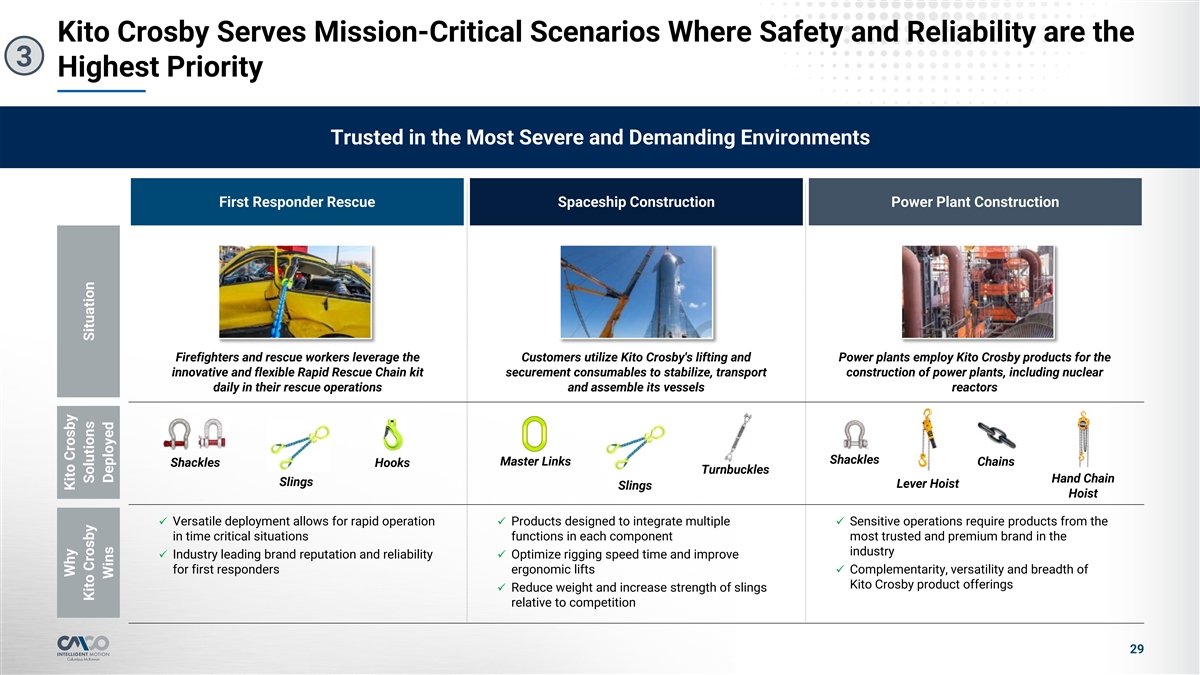

Kito Crosby Serves Mission-Critical Scenarios Where Safety and Reliability are the 3 Highest Priority Trusted in the Most Severe and Demanding Environments First Responder Rescue Spaceship Construction Power Plant Construction Firefighters and rescue workers leverage the Customers utilize Kito Crosby's lifting and Power plants employ Kito Crosby products for the innovative and flexible Rapid Rescue Chain kit securement consumables to stabilize, transport construction of power plants, including nuclear daily in their rescue operations and assemble its vessels reactors Shackles Master Links Chains Shackles Hooks Turnbuckles Hand Chain Slings Lever Hoist Slings Hoist ü Versatile deployment allows for rapid operation ü Products designed to integrate multiple ü Sensitive operations require products from the in time critical situations functions in each component most trusted and premium brand in the industry Industry leading brand reputation and reliability Optimize rigging speed time and improve üü for first responders ergonomic liftsü Complementarity, versatility and breadth of Kito Crosby product offerings ü Reduce weight and increase strength of slings relative to competition 29 Why Kito Crosby Kito Crosby Solutions Situation Wins Deployed
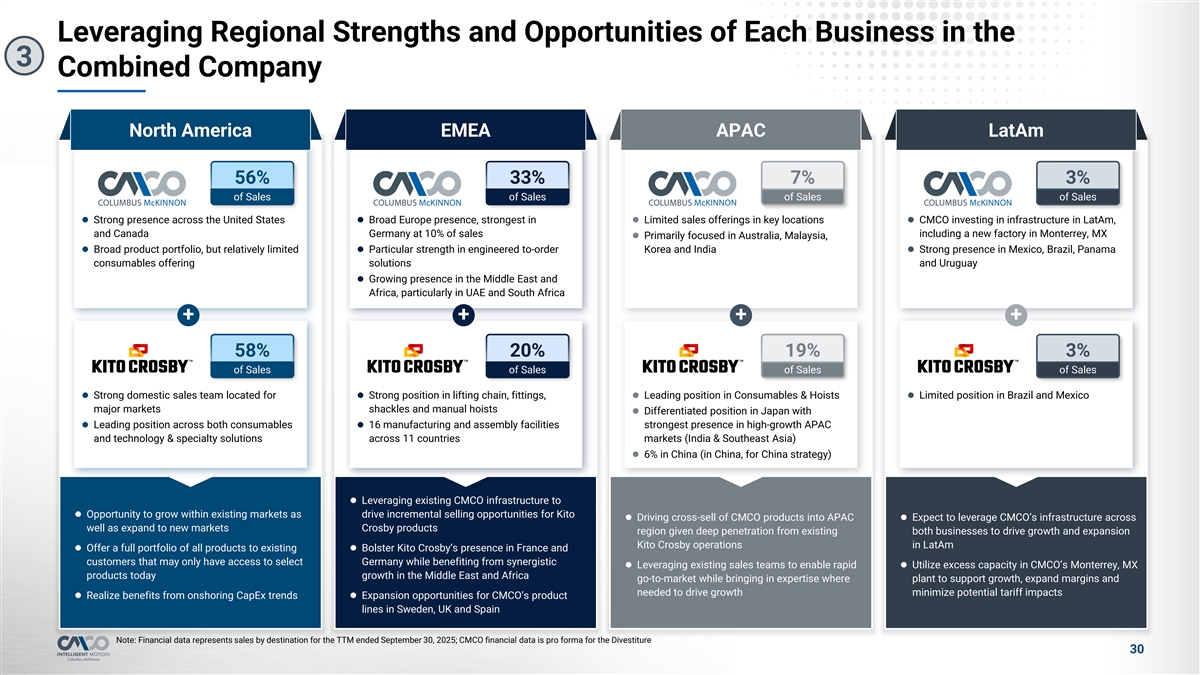

Leveraging Regional Strengths and Opportunities of Each Business in the 3 Combined Company North America EMEA APAC LatAm 56% 33% 7% 3% of Sales of Sales of Sales of Sales l Strong presence across the United States l Broad Europe presence, strongest in l Limited sales offerings in key locations l CMCO investing in infrastructure in LatAm, and Canada Germany at 10% of sales including a new factory in Monterrey, MX l Primarily focused in Australia, Malaysia, l Broad product portfolio, but relatively limited l Particular strength in engineered to-order Korea and India l Strong presence in Mexico, Brazil, Panama consumables offering solutions and Uruguay l Growing presence in the Middle East and Africa, particularly in UAE and South Africa + + + + 58% 20% 19% 3% of Sales of Sales of Sales of Sales l Strong domestic sales team located for l Strong position in lifting chain, fittings, l Leading position in Consumables & Hoistsl Limited position in Brazil and Mexico major markets shackles and manual hoists l Differentiated position in Japan with l Leading position across both consumables l 16 manufacturing and assembly facilities strongest presence in high-growth APAC and technology & specialty solutions across 11 countries markets (India & Southeast Asia) l 6% in China (in China, for China strategy) l Leveraging existing CMCO infrastructure to l Opportunity to grow within existing markets as drive incremental selling opportunities for Kito l Driving cross-sell of CMCO products into APAC l Expect to leverage CMCO’s infrastructure across well as expand to new markets Crosby products region given deep penetration from existing both businesses to drive growth and expansion Kito Crosby operations in LatAm l Offer a full portfolio of all products to existing l Bolster Kito Crosby’s presence in France and customers that may only have access to select Germany while benefiting from synergistic l Leveraging existing sales teams to enable rapid l Utilize excess capacity in CMCO’s Monterrey, MX products today growth in the Middle East and Africa go-to-market while bringing in expertise where plant to support growth, expand margins and needed to drive growth minimize potential tariff impacts l Realize benefits from onshoring CapEx trendsl Expansion opportunities for CMCO’s product lines in Sweden, UK and Spain Note: Financial data represents sales by destination for the TTM ended September 30, 2025; CMCO financial data is pro forma for the Divestiture 30
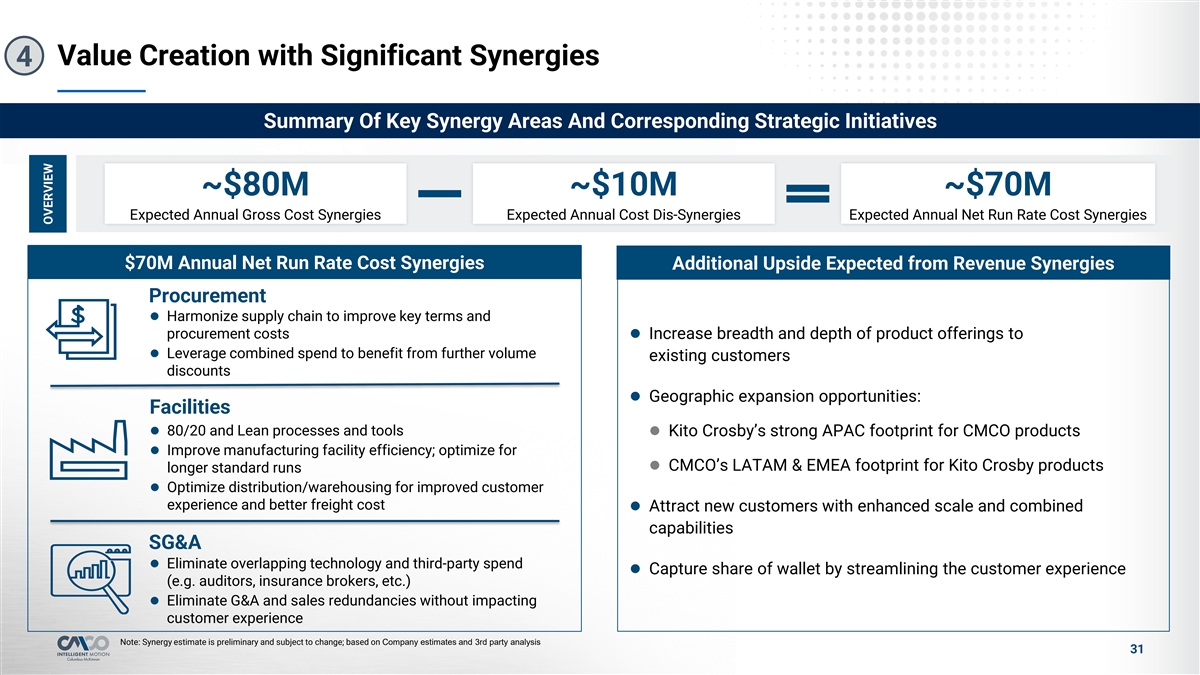

Value Creation with Significant Synergies 4 Summary Of Key Synergy Areas And Corresponding Strategic Initiatives ~$80M ~$10M ~$70M Expected Annual Gross Cost Synergies Expected Annual Cost Dis-Synergies Expected Annual Net Run Rate Cost Synergies $70M Annual Net Run Rate Cost Synergies Additional Upside Expected from Revenue Synergies Procurement l Harmonize supply chain to improve key terms and procurement costs l Increase breadth and depth of product offerings to l Leverage combined spend to benefit from further volume existing customers discounts l Geographic expansion opportunities: Facilities l 80/20 and Lean processes and tools l Kito Crosby’s strong APAC footprint for CMCO products l Improve manufacturing facility efficiency; optimize for l CMCO’s LATAM & EMEA footprint for Kito Crosby products longer standard runs l Optimize distribution/warehousing for improved customer experience and better freight cost l Attract new customers with enhanced scale and combined capabilities SG&A l Eliminate overlapping technology and third-party spend l Capture share of wallet by streamlining the customer experience (e.g. auditors, insurance brokers, etc.) l Eliminate G&A and sales redundancies without impacting customer experience Note: Synergy estimate is preliminary and subject to change; based on Company estimates and 3rd party analysis 31 OVERVIEW
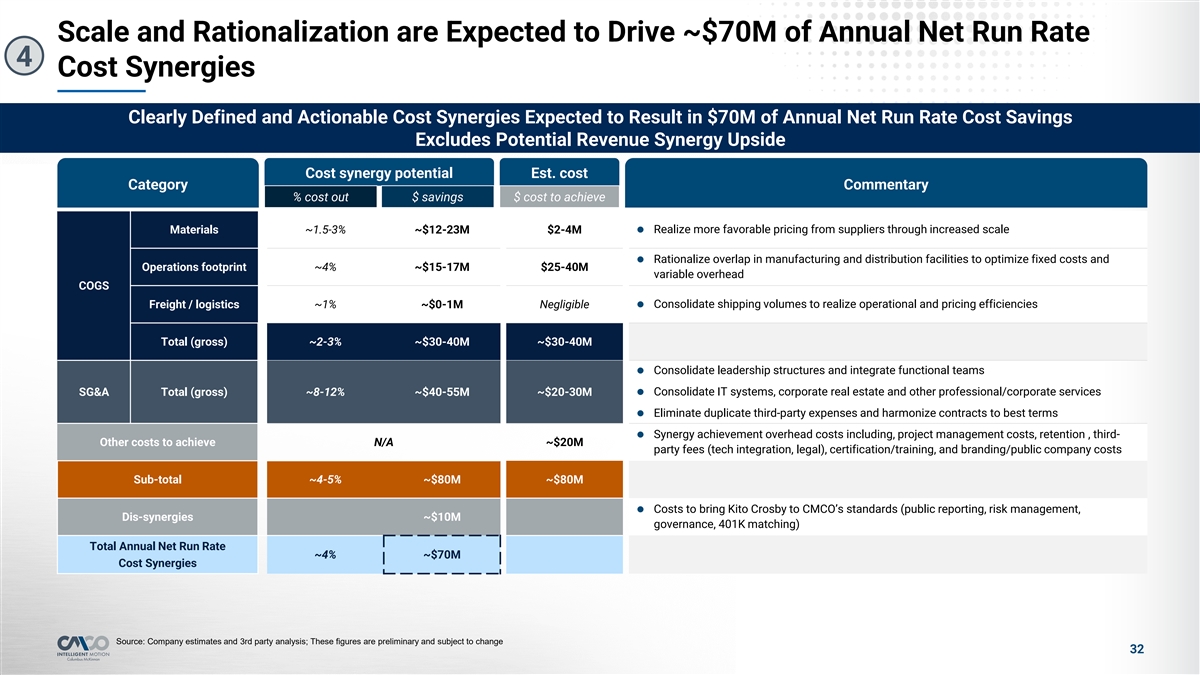

Scale and Rationalization are Expected to Drive ~$70M of Annual Net Run Rate 4 Cost Synergies Clearly Defined and Actionable Cost Synergies Expected to Result in $70M of Annual Net Run Rate Cost Savings Excludes Potential Revenue Synergy Upside Cost synergy potential Est. cost Category Commentary % cost out $ savings $ cost to achieve Materials ~1.5-3% ~$12-23M $2-4Ml Realize more favorable pricing from suppliers through increased scale l Rationalize overlap in manufacturing and distribution facilities to optimize fixed costs and Operations footprint ~4% ~$15-17M $25-40M variable overhead COGS Freight / logistics ~1% ~$0-1M Negligiblel Consolidate shipping volumes to realize operational and pricing efficiencies Total (gross) ~2-3% ~$30-40M ~$30-40M l Consolidate leadership structures and integrate functional teams SG&A Total (gross) ~8-12% ~$40-55M ~$20-30Ml Consolidate IT systems, corporate real estate and other professional/corporate services Eliminate duplicate third-party expenses and harmonize contracts to best terms l l Synergy achievement overhead costs including, project management costs, retention , third- Other costs to achieve N/A ~$20M party fees (tech integration, legal), certification/training, and branding/public company costs Sub-total ~4-5% ~$80M ~$80M Costs to bring Kito Crosby to CMCO’s standards (public reporting, risk management, l Dis-synergies ~$10M governance, 401K matching) Total Annual Net Run Rate ~4% ~$70M Cost Synergies Source: Company estimates and 3rd party analysis; These figures are preliminary and subject to change 32
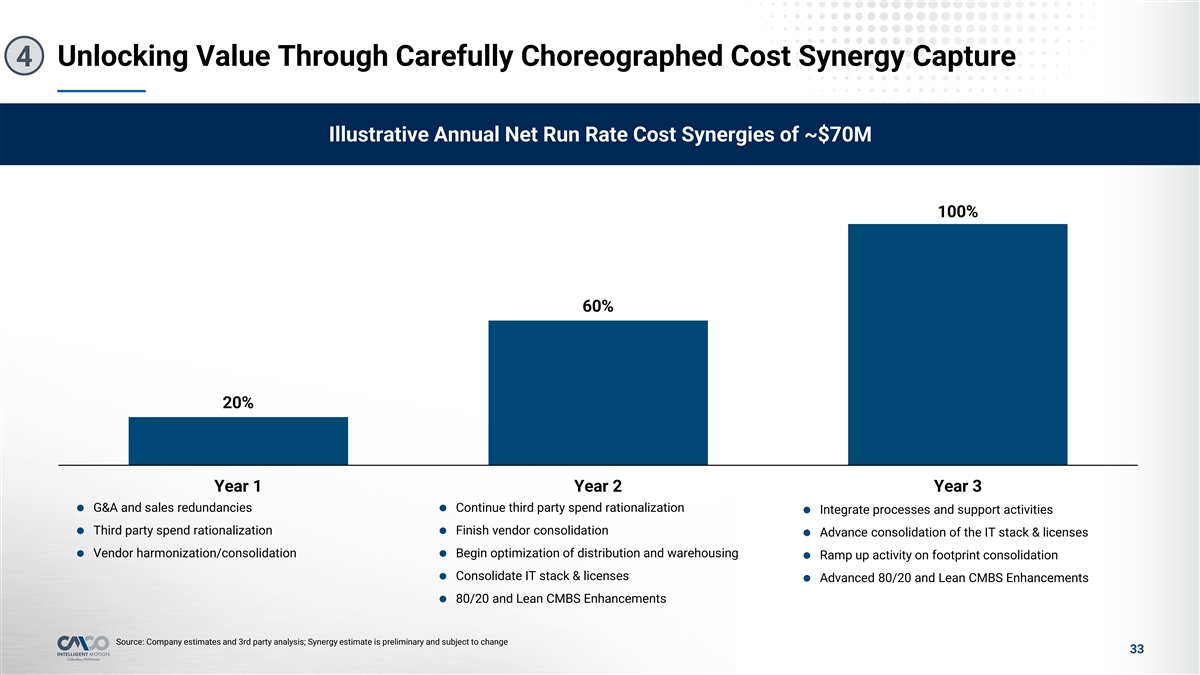

Unlocking Value Through Carefully Choreographed Cost Synergy Capture 4 Illustrative Annual Net Run Rate Cost Synergies of ~$70M 100% 60% 20% Year 1 Year 2 Year 3 G&A and sales redundancies Continue third party spend rationalization ll Integrate processes and support activities l Third party spend rationalization Finish vendor consolidation ll Advance consolidation of the IT stack & licenses l l Vendor harmonization/consolidationl Begin optimization of distribution and warehousing l Ramp up activity on footprint consolidation l Consolidate IT stack & licenses l Advanced 80/20 and Lean CMBS Enhancements l 80/20 and Lean CMBS Enhancements Source: Company estimates and 3rd party analysis; Synergy estimate is preliminary and subject to change 33
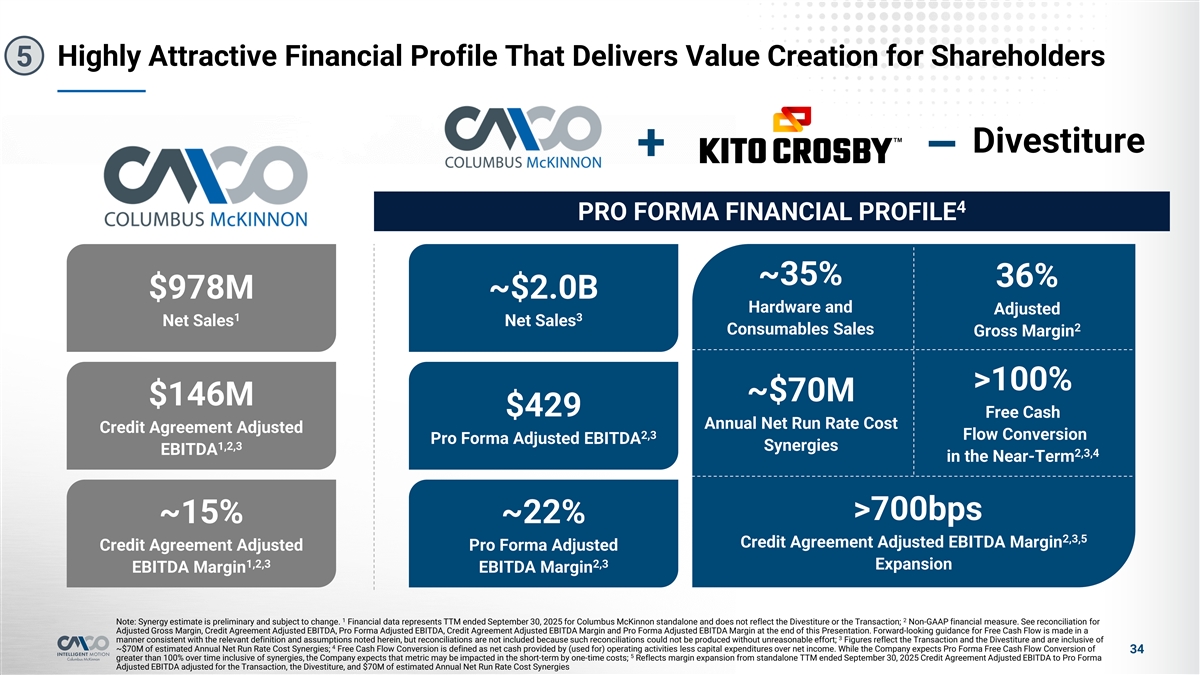

Highly Attractive Financial Profile That Delivers Value Creation for Shareholders 5 Divestiture + – 4 PRO FORMA FINANCIAL PROFILE ~35% 36% $978M ~$2.0B Hardware and Adjusted 1 3 Net Sales Net Sales 2 Consumables Sales Gross Margin >100% ~$70M $146M $429 Free Cash Annual Net Run Rate Cost Credit Agreement Adjusted 2,3 Flow Conversion Pro Forma Adjusted EBITDA 1,2,3 Synergies EBITDA 2,3,4 in the Near-Term >700bps ~15% ~22% 2,3,5 Credit Agreement Adjusted EBITDA Margin Credit Agreement Adjusted Pro Forma Adjusted 1,2,3 2,3 Expansion EBITDA Margin EBITDA Margin 1 2 Note: Synergy estimate is preliminary and subject to change. Financial data represents TTM ended September 30, 2025 for Columbus McKinnon standalone and does not reflect the Divestiture or the Transaction; Non-GAAP financial measure. See reconciliation for Adjusted Gross Margin, Credit Agreement Adjusted EBITDA, Pro Forma Adjusted EBITDA, Credit Agreement Adjusted EBITDA Margin and Pro Forma Adjusted EBITDA Margin at the end of this Presentation. Forward-looking guidance for Free Cash Flow is made in a 3 manner consistent with the relevant definition and assumptions noted herein, but reconciliations are not included because such reconciliations could not be produced without unreasonable effort; Figures reflect the Transaction and the Divestiture and are inclusive of 4 ~$70M of estimated Annual Net Run Rate Cost Synergies; Free Cash Flow Conversion is defined as net cash provided by (used for) operating activities less capital expenditures over net income. While the Company expects Pro Forma Free Cash Flow Conversion of 34 5 greater than 100% over time inclusive of synergies, the Company expects that metric may be impacted in the short-term by one-time costs; Reflects margin expansion from standalone TTM ended September 30, 2025 Credit Agreement Adjusted EBITDA to Pro Forma Adjusted EBITDA adjusted for the Transaction, the Divestiture, and $70M of estimated Annual Net Run Rate Cost Synergies
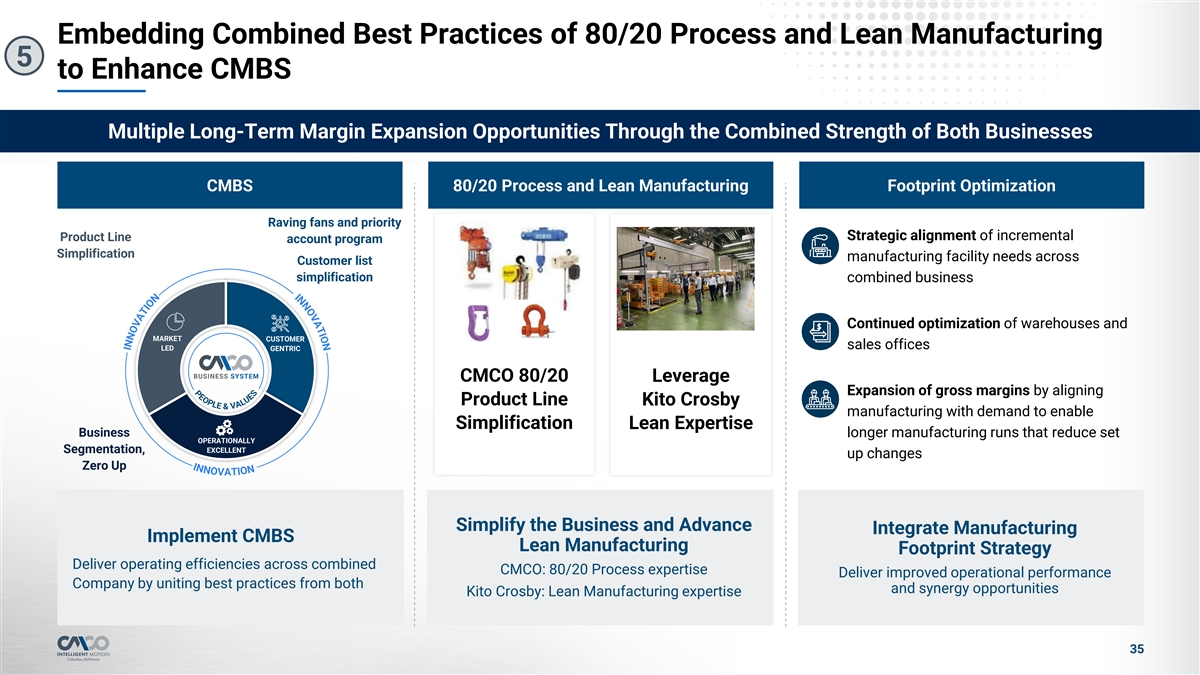

Embedding Combined Best Practices of 80/20 Process and Lean Manufacturing 5 to Enhance CMBS Multiple Long-Term Margin Expansion Opportunities Through the Combined Strength of Both Businesses CMBS 80/20 Process and Lean Manufacturing Footprint Optimization Raving fans and priority Strategic alignment of incremental Product Line account program Simplification manufacturing facility needs across Customer list simplification combined business Continued optimization of warehouses and MARKET CUSTOMER sales offices LED GENTRIC BUSINESS SYSTEM CMCO 80/20 Leverage Expansion of gross margins by aligning Product Line Kito Crosby manufacturing with demand to enable Simplification Lean Expertise Business longer manufacturing runs that reduce set OPERATIONALLY Segmentation, EXCELLENT up changes Zero Up Simplify the Business and Advance Integrate Manufacturing Implement CMBS Lean Manufacturing Footprint Strategy Deliver operating efficiencies across combined CMCO: 80/20 Process expertise Deliver improved operational performance Company by uniting best practices from both and synergy opportunities Kito Crosby: Lean Manufacturing expertise 35
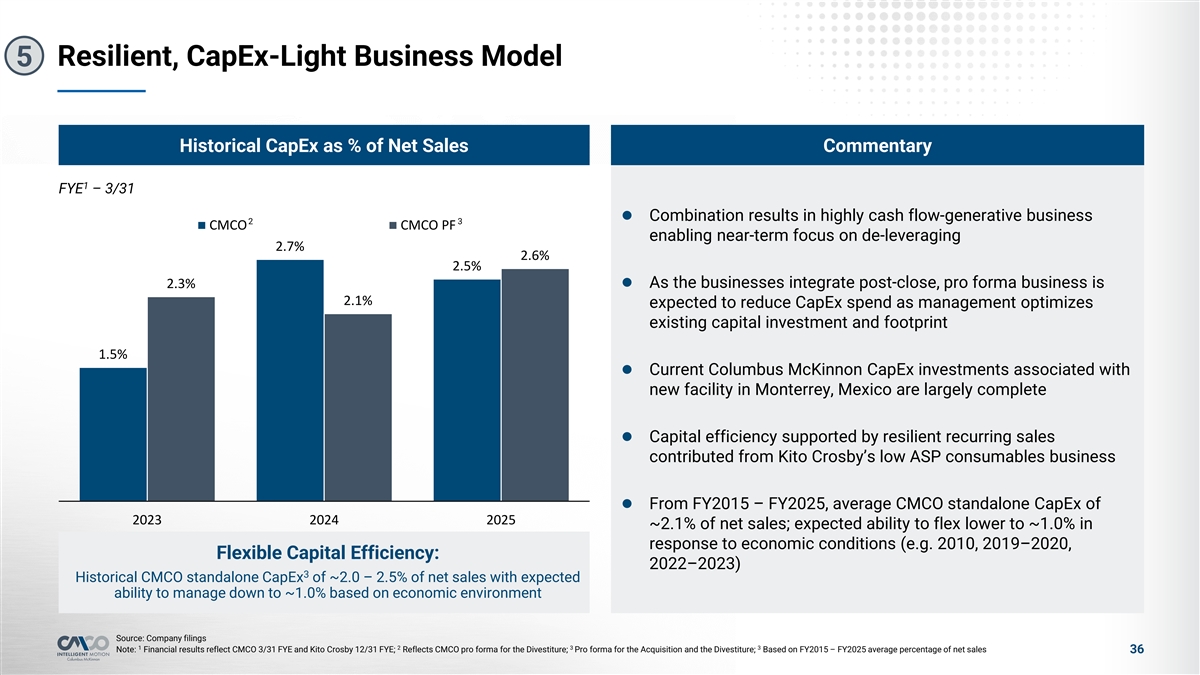

Resilient, CapEx-Light Business Model 5 Historical CapEx as % of Net Sales Commentary 1 FYE – 3/31 l Combination results in highly cash flow-generative business 2 3 CMCO CMCO PF enabling near-term focus on de-leveraging 2.7% 2.6% 2.5% l As the businesses integrate post-close, pro forma business is 2.3% 2.1% expected to reduce CapEx spend as management optimizes existing capital investment and footprint 1.5% l Current Columbus McKinnon CapEx investments associated with new facility in Monterrey, Mexico are largely complete l Capital efficiency supported by resilient recurring sales contributed from Kito Crosby’s low ASP consumables business l From FY2015 – FY2025, average CMCO standalone CapEx of 2023 2024 2025 ~2.1% of net sales; expected ability to flex lower to ~1.0% in response to economic conditions (e.g. 2010, 2019–2020, Flexible Capital Efficiency: 2022–2023) 3 Historical CMCO standalone CapEx of ~2.0 – 2.5% of net sales with expected ability to manage down to ~1.0% based on economic environment Source: Company filings 1 2 3 3 Note: Financial results reflect CMCO 3/31 FYE and Kito Crosby 12/31 FYE; Reflects CMCO pro forma for the Divestiture; Pro forma for the Acquisition and the Divestiture; Based on FY2015 – FY2025 average percentage of net sales 36
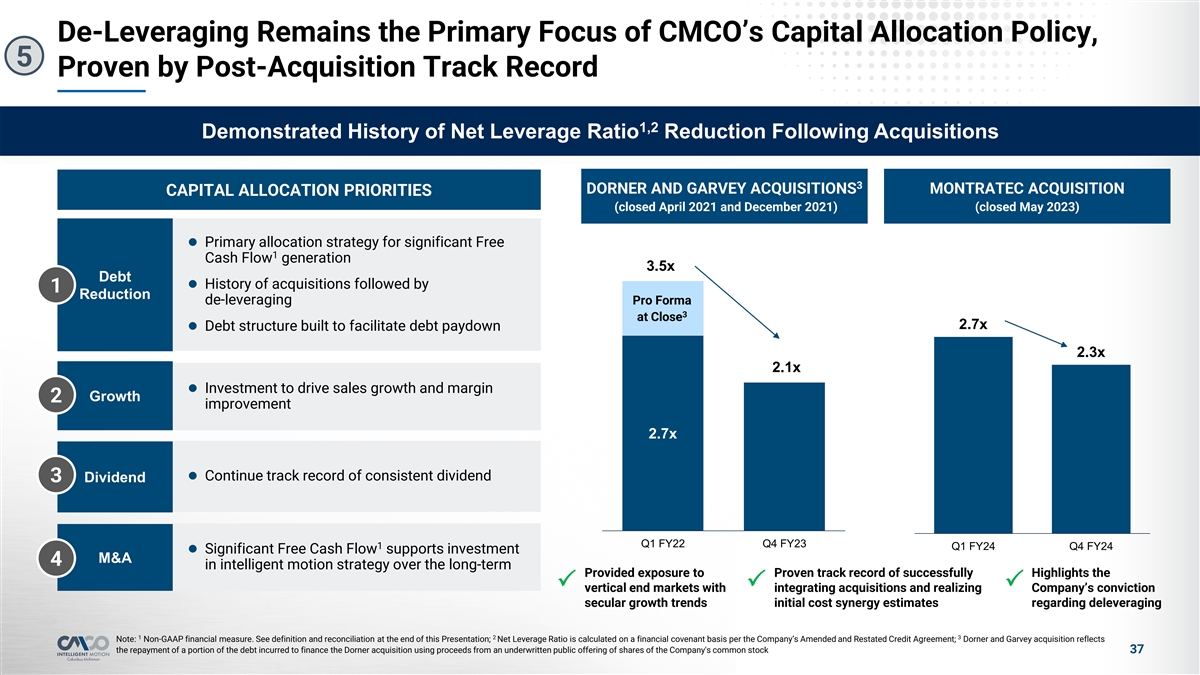

De-Leveraging Remains the Primary Focus of CMCO’s Capital Allocation Policy, 5 Proven by Post-Acquisition Track Record 1,2 Demonstrated History of Net Leverage Ratio Reduction Following Acquisitions 3 DORNER AND GARVEY ACQUISITIONS MONTRATEC ACQUISITION CAPITAL ALLOCATION PRIORITIES (closed April 2021 and December 2021) (closed May 2023) 4.5 l Primary allocation strategy for significant Free 4 1 Cash Flow generation 3.5x Debt 3.5 l History of acquisitions followed by 1 Reduction de-leveraging Pro Forma 3 at Close 3 2.7x l Debt structure built to facilitate debt paydown 2.5 2.3x 2.1x l Investment to drive sales growth and margin 2 Growth 2 improvement 1.5 2.7x 1 l Continue track record of consistent dividend 3 Dividend 0.5 0 Q1 FY22 Q4 FY23 1 Q1 FY24 Q4 FY24 l Significant Free Cash Flow supports investment M&A 4 in intelligent motion strategy over the long-term Provided exposure to Proven track record of successfully Highlights the PPP vertical end markets with integrating acquisitions and realizing Company’s conviction secular growth trends initial cost synergy estimates regarding deleveraging 1 2 3 Note: Non-GAAP financial measure. See definition and reconciliation at the end of this Presentation; Net Leverage Ratio is calculated on a financial covenant basis per the Company’s Amended and Restated Credit Agreement; Dorner and Garvey acquisition reflects the repayment of a portion of the debt incurred to finance the Dorner acquisition using proceeds from an underwritten public offering of shares of the Company's common stock 37
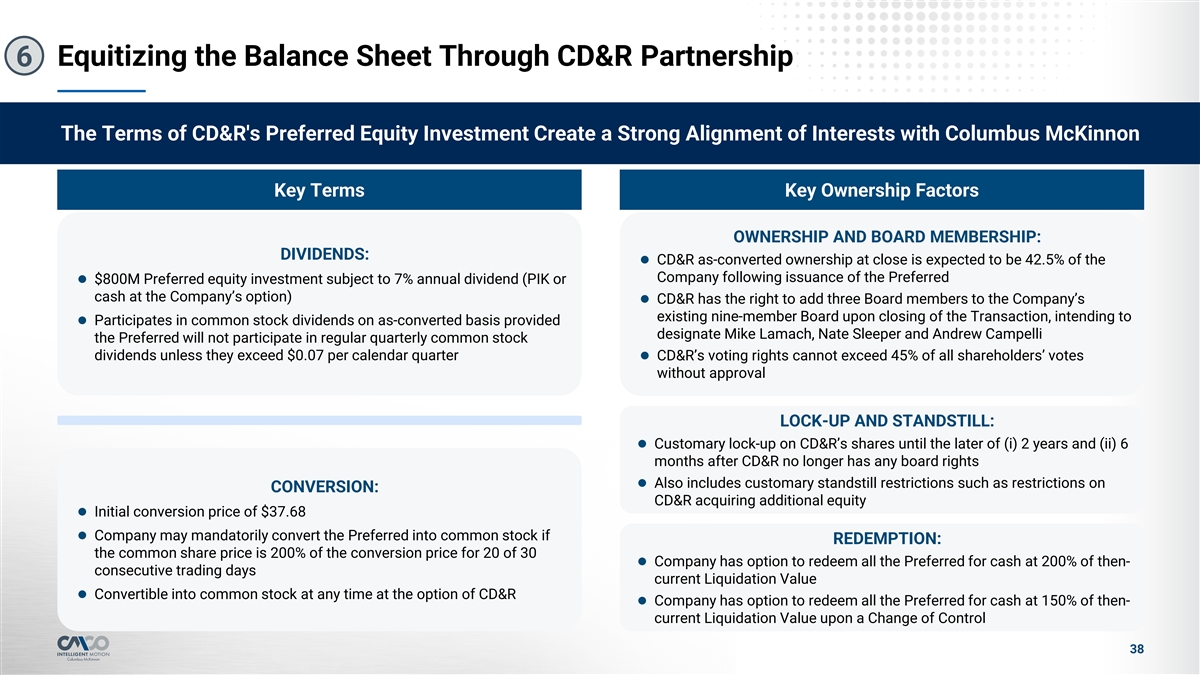

Equitizing the Balance Sheet Through CD&R Partnership 6 The Terms of CD&R's Preferred Equity Investment Create a Strong Alignment of Interests with Columbus McKinnon Key Terms Key Ownership Factors OWNERSHIP AND BOARD MEMBERSHIP: DIVIDENDS: l CD&R as-converted ownership at close is expected to be 42.5% of the Company following issuance of the Preferred l $800M Preferred equity investment subject to 7% annual dividend (PIK or cash at the Company’s option) l CD&R has the right to add three Board members to the Company’s existing nine-member Board upon closing of the Transaction, intending to l Participates in common stock dividends on as-converted basis provided designate Mike Lamach, Nate Sleeper and Andrew Campelli the Preferred will not participate in regular quarterly common stock dividends unless they exceed $0.07 per calendar quarterl CD&R’s voting rights cannot exceed 45% of all shareholders’ votes without approval LOCK-UP AND STANDSTILL: l Customary lock-up on CD&R’s shares until the later of (i) 2 years and (ii) 6 months after CD&R no longer has any board rights l Also includes customary standstill restrictions such as restrictions on CONVERSION: CD&R acquiring additional equity l Initial conversion price of $37.68 l Company may mandatorily convert the Preferred into common stock if REDEMPTION: the common share price is 200% of the conversion price for 20 of 30 l Company has option to redeem all the Preferred for cash at 200% of then- consecutive trading days current Liquidation Value l Convertible into common stock at any time at the option of CD&R l Company has option to redeem all the Preferred for cash at 150% of then- current Liquidation Value upon a Change of Control 38
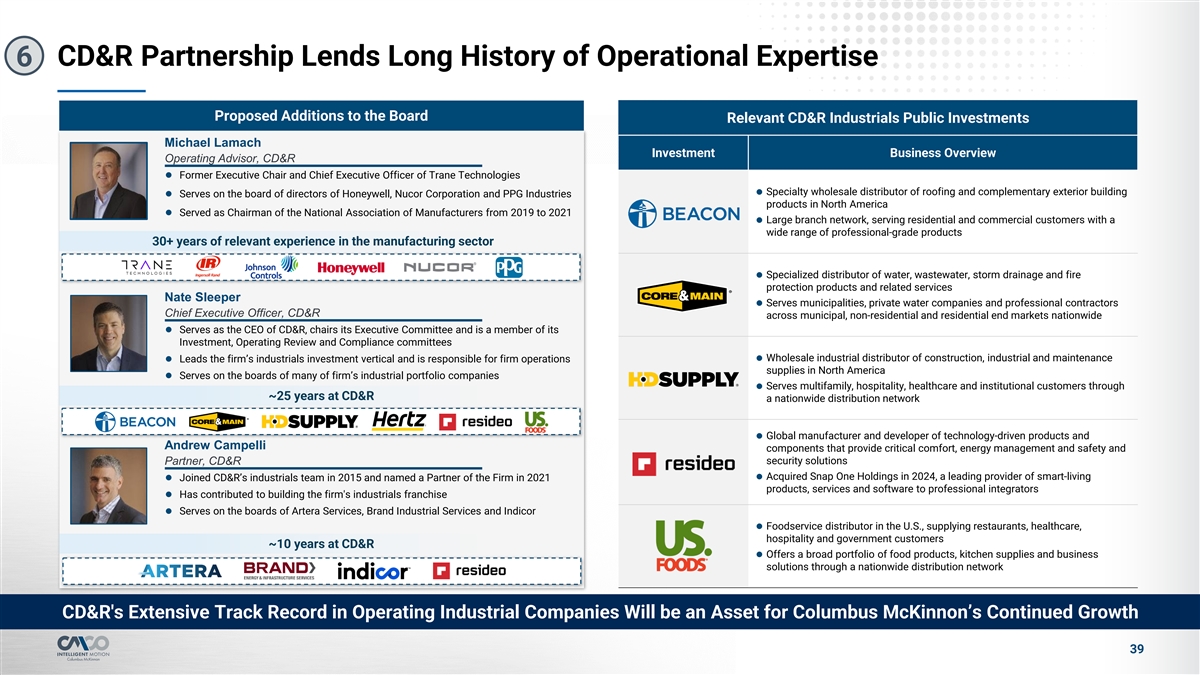

CD&R Partnership Lends Long History of Operational Expertise 6 Proposed Additions to the Board Relevant CD&R Industrials Public Investments Michael Lamach Investment Business Overview Operating Advisor, CD&R l Former Executive Chair and Chief Executive Officer of Trane Technologies Specialty wholesale distributor of roofing and complementary exterior building l l Serves on the board of directors of Honeywell, Nucor Corporation and PPG Industries products in North America l Served as Chairman of the National Association of Manufacturers from 2019 to 2021 Large branch network, serving residential and commercial customers with a l wide range of professional-grade products 30+ years of relevant experience in the manufacturing sector l Specialized distributor of water, wastewater, storm drainage and fire protection products and related services Nate Sleeper l Serves municipalities, private water companies and professional contractors Chief Executive Officer, CD&R across municipal, non-residential and residential end markets nationwide l Serves as the CEO of CD&R, chairs its Executive Committee and is a member of its Investment, Operating Review and Compliance committees l Wholesale industrial distributor of construction, industrial and maintenance l Leads the firm’s industrials investment vertical and is responsible for firm operations supplies in North America l Serves on the boards of many of firm’s industrial portfolio companies l Serves multifamily, hospitality, healthcare and institutional customers through ~25 years at CD&R a nationwide distribution network l Global manufacturer and developer of technology-driven products and Andrew Campelli components that provide critical comfort, energy management and safety and Partner, CD&R security solutions l Acquired Snap One Holdings in 2024, a leading provider of smart-living l Joined CD&R’s industrials team in 2015 and named a Partner of the Firm in 2021 products, services and software to professional integrators l Has contributed to building the firm's industrials franchise l Serves on the boards of Artera Services, Brand Industrial Services and Indicor l Foodservice distributor in the U.S., supplying restaurants, healthcare, hospitality and government customers ~10 years at CD&R l Offers a broad portfolio of food products, kitchen supplies and business solutions through a nationwide distribution network CD&R's Extensive Track Record in Operating Industrial Companies Will be an Asset for Columbus McKinnon’s Continued Growth 39
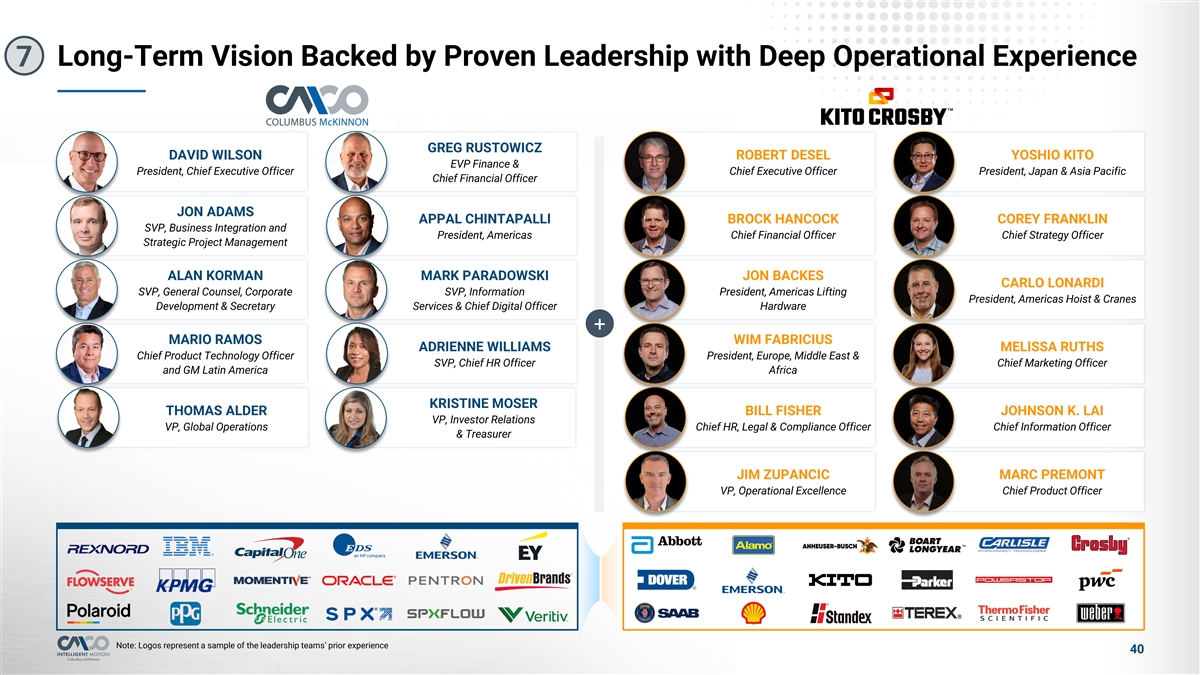

Long-Term Vision Backed by Proven Leadership with Deep Operational Experience 7 GREG RUSTOWICZ DAVID WILSON ROBERT DESEL YOSHIO KITO EVP Finance & President, Chief Executive Officer Chief Executive Officer President, Japan & Asia Pacific Chief Financial Officer JON ADAMS APPAL CHINTAPALLI BROCK HANCOCK COREY FRANKLIN SVP, Business Integration and President, Americas Chief Financial Officer Chief Strategy Officer Strategic Project Management ALAN KORMAN MARK PARADOWSKI JON BACKES CARLO LONARDI SVP, General Counsel, Corporate SVP, Information President, Americas Lifting President, Americas Hoist & Cranes Development & Secretary Services & Chief Digital Officer Hardware + MARIO RAMOS WIM FABRICIUS ADRIENNE WILLIAMS MELISSA RUTHS Chief Product Technology Officer President, Europe, Middle East & SVP, Chief HR Officer Chief Marketing Officer and GM Latin America Africa KRISTINE MOSER THOMAS ALDER BILL FISHER JOHNSON K. LAI VP, Investor Relations VP, Global Operations Chief HR, Legal & Compliance Officer Chief Information Officer & Treasurer JIM ZUPANCIC MARC PREMONT VP, Operational Excellence Chief Product Officer Note: Logos represent a sample of the leadership teams’ prior experience 40
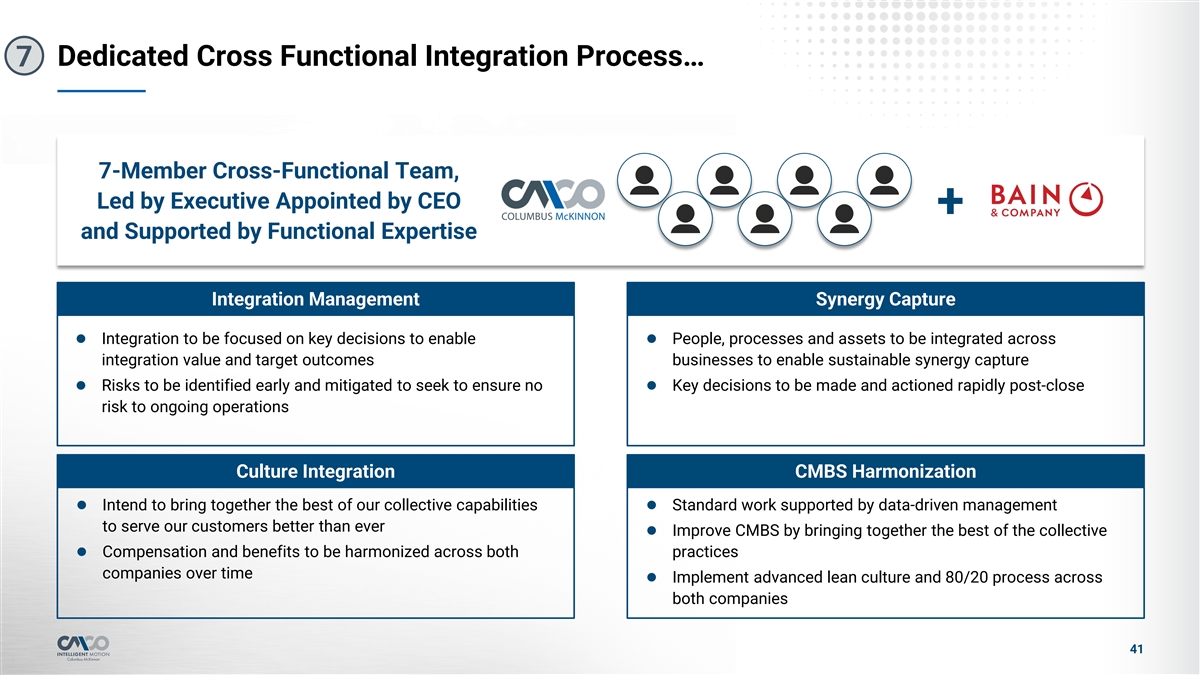

Dedicated Cross Functional Integration Process… 7 7-Member Cross-Functional Team, Led by Executive Appointed by CEO + and Supported by Functional Expertise Integration Management Synergy Capture l Integration to be focused on key decisions to enable l People, processes and assets to be integrated across integration value and target outcomes businesses to enable sustainable synergy capture l Risks to be identified early and mitigated to seek to ensure no l Key decisions to be made and actioned rapidly post-close risk to ongoing operations Culture Integration CMBS Harmonization l Intend to bring together the best of our collective capabilities l Standard work supported by data-driven management to serve our customers better than ever l Improve CMBS by bringing together the best of the collective l Compensation and benefits to be harmonized across both practices companies over time l Implement advanced lean culture and 80/20 process across both companies 41
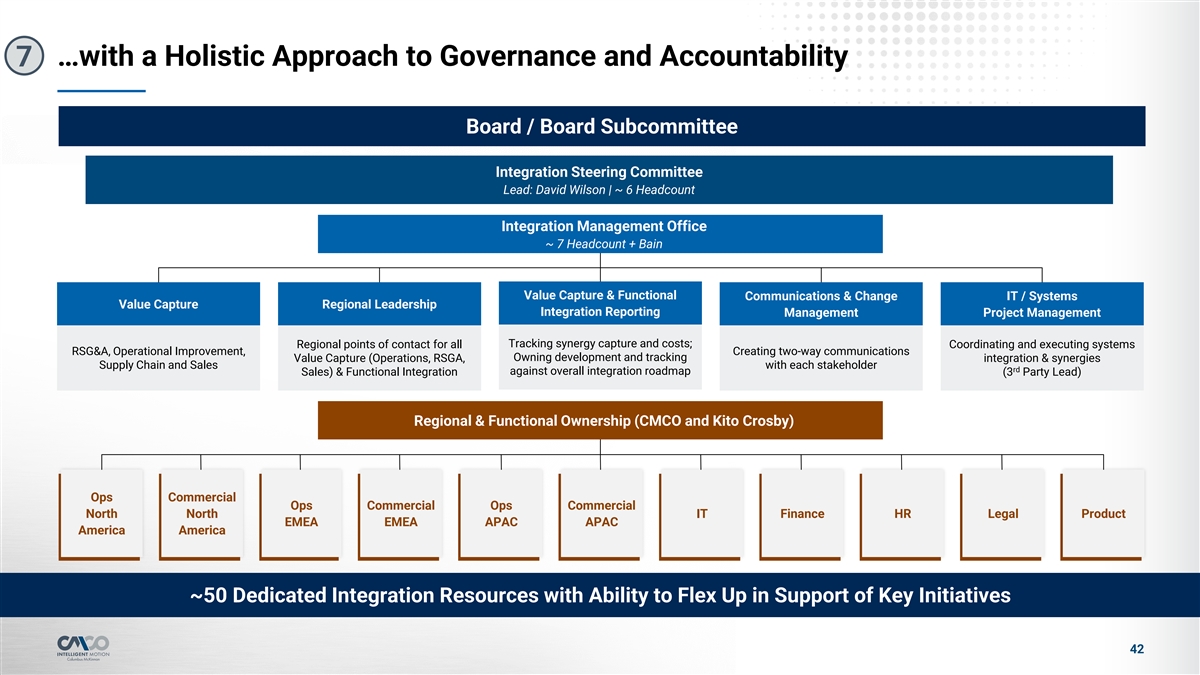

…with a Holistic Approach to Governance and Accountability 7 Board / Board Subcommittee Integration Steering Committee Lead: David Wilson | ~ 6 Headcount Integration Management Office ~ 7 Headcount + Bain Value Capture & Functional Communications & Change IT / Systems Value Capture Regional Leadership Integration Reporting Management Project Management Tracking synergy capture and costs; Regional points of contact for all Coordinating and executing systems RSG&A, Operational Improvement, Creating two-way communications Owning development and tracking Value Capture (Operations, RSGA, integration & synergies Supply Chain and Sales with each stakeholder rd against overall integration roadmap Sales) & Functional Integration (3 Party Lead) Regional & Functional Ownership (CMCO and Kito Crosby) Ops Commercial Ops Commercial Ops Commercial North North IT Finance HR Legal Product EMEA EMEA APAC APAC America America ~50 Dedicated Integration Resources with Ability to Flex Up in Support of Key Initiatives 42


4 Historical Financial Overview
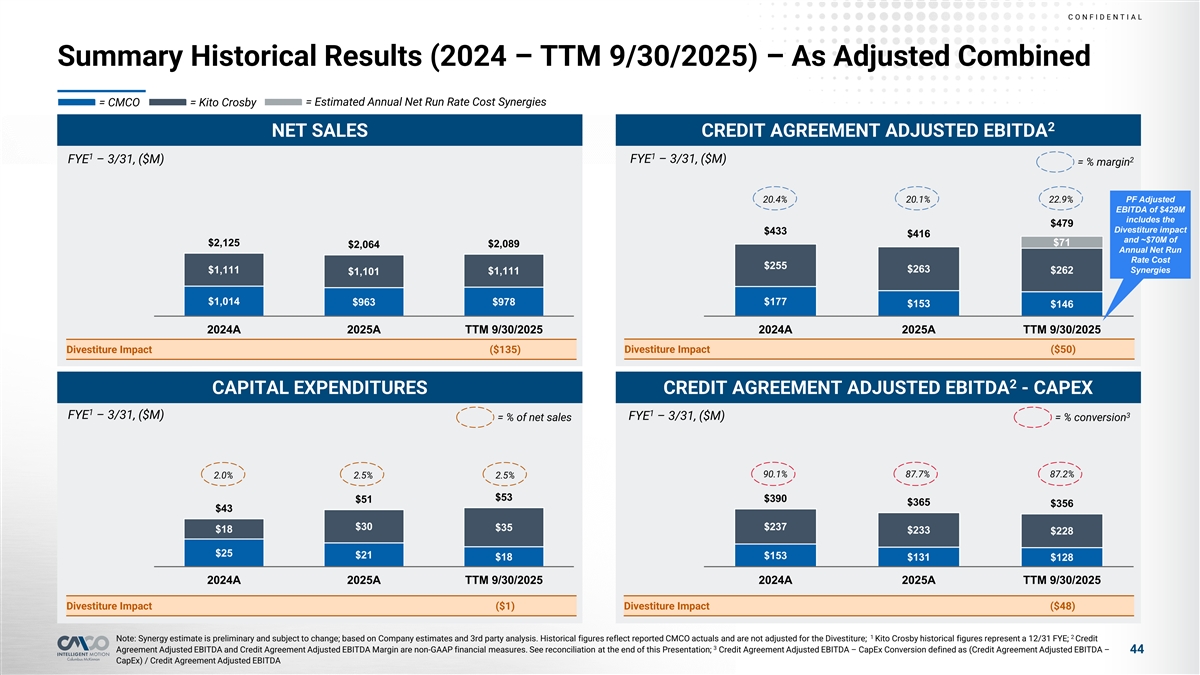

C O NF I D E NT I A L Summary Historical Results (2024 – TTM 9/30/2025) – As Adjusted Combined = CMCO = Kito Crosby = Estimated Annual Net Run Rate Cost Synergies 2 NET SALES CREDIT AGREEMENT ADJUSTED EBITDA 1 1 FYE – 3/31, ($M) 2 FYE – 3/31, ($M) = % margin PF Adjusted 20.4% 20.1% 22.9% EBITDA of $429M includes the $479 Divestiture impact $433 $416 and ~$70M of $2,125 $71 $2,064 $2,089 Annual Net Run Rate Cost $255 $263 Synergies $1,111 $262 $1,101 $1,111 $1,014 $978 $177 $963 $153 $146 2024A 2025A TTM 9/30/2025 2024A 2025A TTM 9/30/2025 Divestiture Impact ($135) Divestiture Impact ($50) 2 CAPITAL EXPENDITURES CREDIT AGREEMENT ADJUSTED EBITDA - CAPEX 1 1 3 FYE – 3/31, ($M) FYE – 3/31, ($M) = % of net sales = % conversion 90.1% 87.7% 87.2% 2.0% 2.5% 2.5% $53 $390 $51 $365 $356 $43 $30 $237 $35 $18 $233 $228 $25 $21 $153 $18 $131 $128 2024A 2025A TTM 9/30/2025 2024A 2025A TTM 9/30/2025 Divestiture Impact ($1) Divestiture Impact ($48) 1 2 Note: Synergy estimate is preliminary and subject to change; based on Company estimates and 3rd party analysis. Historical figures reflect reported CMCO actuals and are not adjusted for the Divestiture; Kito Crosby historical figures represent a 12/31 FYE; Credit 3 Agreement Adjusted EBITDA and Credit Agreement Adjusted EBITDA Margin are non-GAAP financial measures. See reconciliation at the end of this Presentation; Credit Agreement Adjusted EBITDA – CapEx Conversion defined as (Credit Agreement Adjusted EBITDA – 44 CapEx) / Credit Agreement Adjusted EBITDA
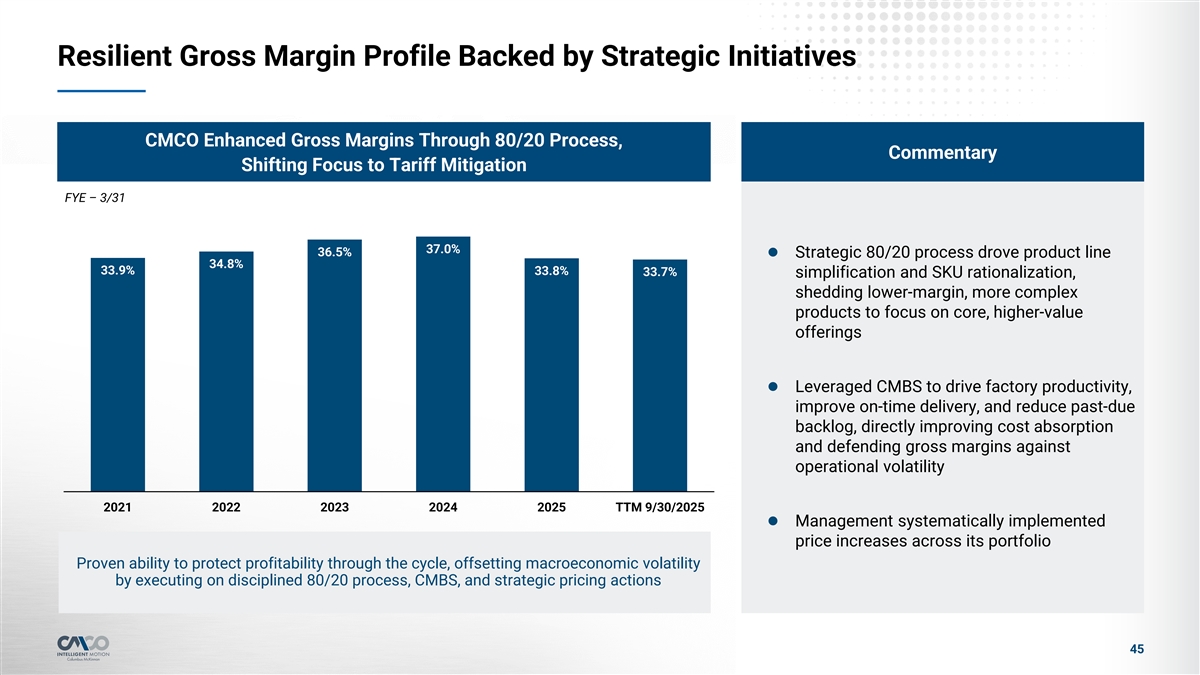

Resilient Gross Margin Profile Backed by Strategic Initiatives CMCO Enhanced Gross Margins Through 80/20 Process, Commentary Shifting Focus to Tariff Mitigation FYE – 3/31 37.0% 36.5% l Strategic 80/20 process drove product line 34.8% 33.9% 33.8% 33.7% simplification and SKU rationalization, shedding lower-margin, more complex products to focus on core, higher-value offerings l Leveraged CMBS to drive factory productivity, improve on-time delivery, and reduce past-due backlog, directly improving cost absorption and defending gross margins against operational volatility 2021 2022 2023 2024 2025 TTM 9/30/2025 l Management systematically implemented price increases across its portfolio Proven ability to protect profitability through the cycle, offsetting macroeconomic volatility by executing on disciplined 80/20 process, CMBS, and strategic pricing actions 45
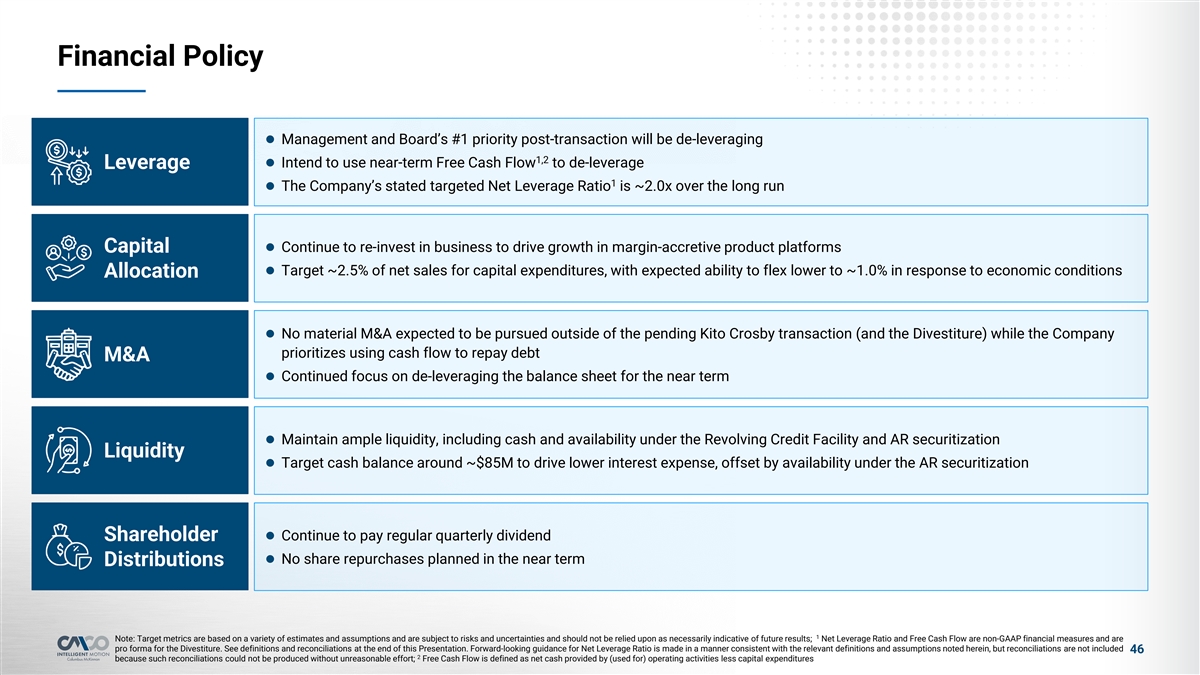

Financial Policy l Management and Board’s #1 priority post-transaction will be de-leveraging 1,2 l Intend to use near-term Free Cash Flow to de-leverage Leverage 1 l The Company’s stated targeted Net Leverage Ratio is ~2.0x over the long run l Continue to re-invest in business to drive growth in margin-accretive product platforms Capital l Target ~2.5% of net sales for capital expenditures, with expected ability to flex lower to ~1.0% in response to economic conditions Allocation l No material M&A expected to be pursued outside of the pending Kito Crosby transaction (and the Divestiture) while the Company prioritizes using cash flow to repay debt M&A l Continued focus on de-leveraging the balance sheet for the near term l Maintain ample liquidity, including cash and availability under the Revolving Credit Facility and AR securitization Liquidity l Target cash balance around ~$85M to drive lower interest expense, offset by availability under the AR securitization l Continue to pay regular quarterly dividend Shareholder l No share repurchases planned in the near term Distributions 1 Note: Target metrics are based on a variety of estimates and assumptions and are subject to risks and uncertainties and should not be relied upon as necessarily indicative of future results; Net Leverage Ratio and Free Cash Flow are non-GAAP financial measures and are pro forma for the Divestiture. See definitions and reconciliations at the end of this Presentation. Forward-looking guidance for Net Leverage Ratio is made in a manner consistent with the relevant definitions and assumptions noted herein, but reconciliations are not included 46 2 because such reconciliations could not be produced without unreasonable effort; Free Cash Flow is defined as net cash provided by (used for) operating activities less capital expenditures
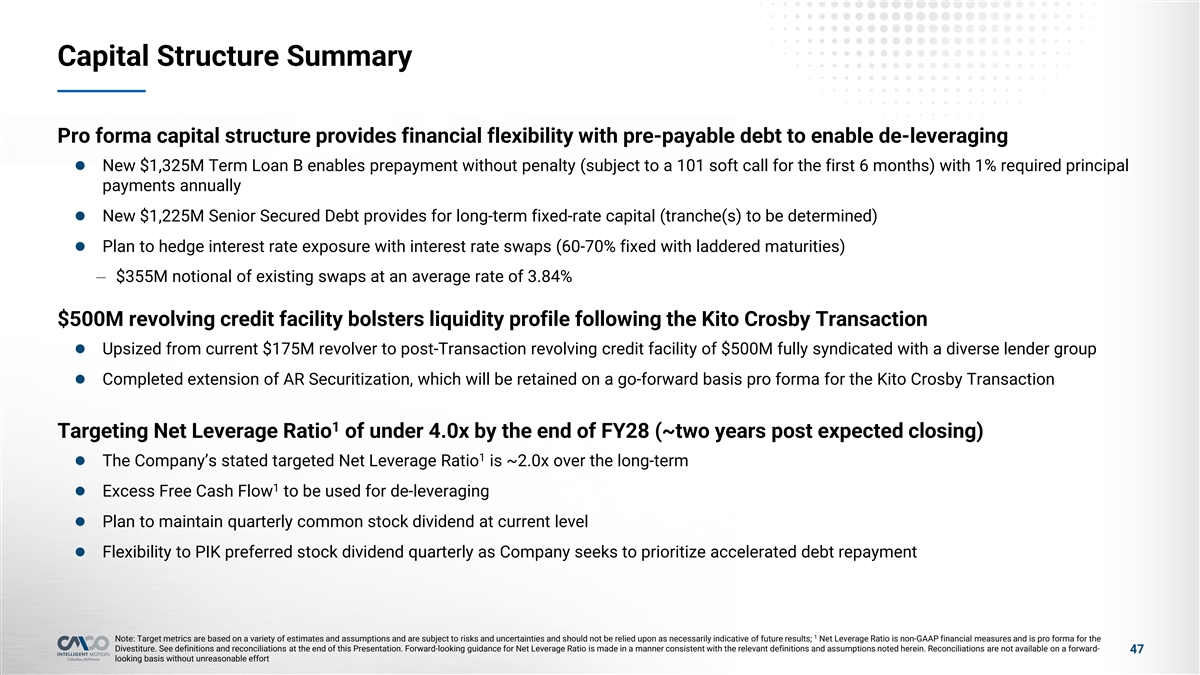

Capital Structure Summary Pro forma capital structure provides financial flexibility with pre-payable debt to enable de-leveraging l New $1,325M Term Loan B enables prepayment without penalty (subject to a 101 soft call for the first 6 months) with 1% required principal payments annually l New $1,225M Senior Secured Debt provides for long-term fixed-rate capital (tranche(s) to be determined) l Plan to hedge interest rate exposure with interest rate swaps (60-70% fixed with laddered maturities) – $355M notional of existing swaps at an average rate of 3.84% $500M revolving credit facility bolsters liquidity profile following the Kito Crosby Transaction l Upsized from current $175M revolver to post-Transaction revolving credit facility of $500M fully syndicated with a diverse lender group l Completed extension of AR Securitization, which will be retained on a go-forward basis pro forma for the Kito Crosby Transaction 1 Targeting Net Leverage Ratio of under 4.0x by the end of FY28 (~two years post expected closing) 1 l The Company’s stated targeted Net Leverage Ratio is ~2.0x over the long-term 1 l Excess Free Cash Flow to be used for de-leveraging l Plan to maintain quarterly common stock dividend at current level l Flexibility to PIK preferred stock dividend quarterly as Company seeks to prioritize accelerated debt repayment 1 Note: Target metrics are based on a variety of estimates and assumptions and are subject to risks and uncertainties and should not be relied upon as necessarily indicative of future results; Net Leverage Ratio is non-GAAP financial measures and is pro forma for the Divestiture. See definitions and reconciliations at the end of this Presentation. Forward-looking guidance for Net Leverage Ratio is made in a manner consistent with the relevant definitions and assumptions noted herein. Reconciliations are not available on a forward- 47 looking basis without unreasonable effort
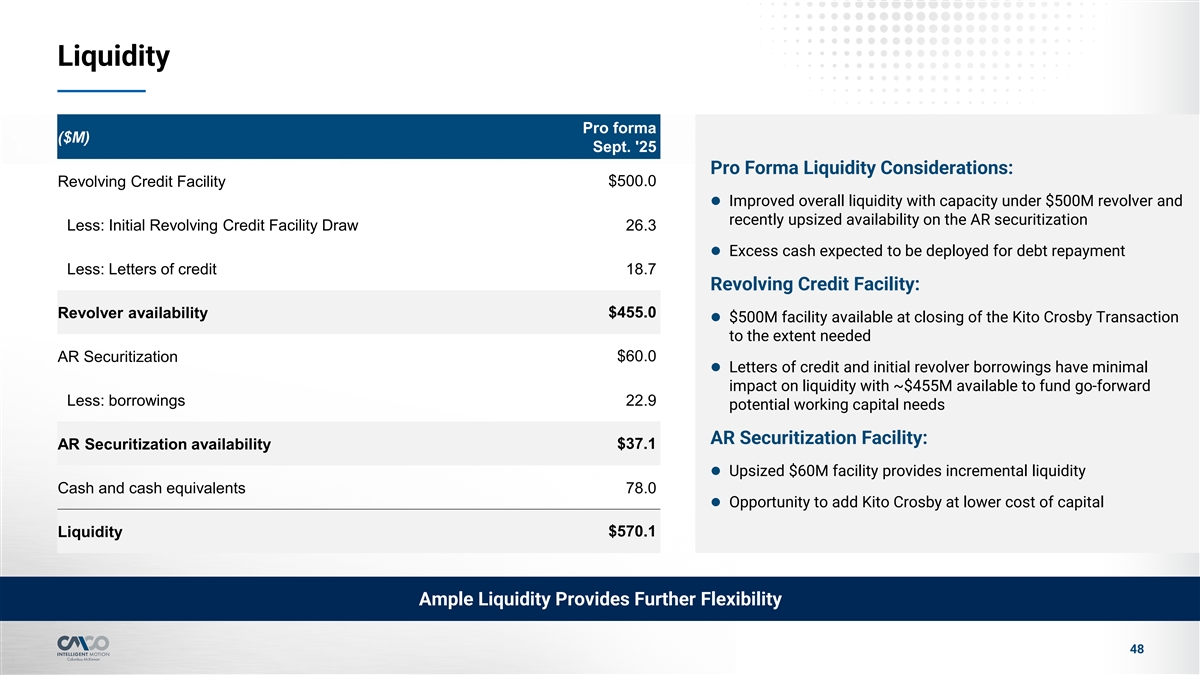

Liquidity Pro forma ($M) Sept. '25 Pro Forma Liquidity Considerations: Revolving Credit Facility $500.0 l Improved overall liquidity with capacity under $500M revolver and recently upsized availability on the AR securitization Less: Initial Revolving Credit Facility Draw 26.3 l Excess cash expected to be deployed for debt repayment Less: Letters of credit 18.7 Revolving Credit Facility: $455.0 Revolver availability l $500M facility available at closing of the Kito Crosby Transaction to the extent needed $60.0 AR Securitization l Letters of credit and initial revolver borrowings have minimal impact on liquidity with ~$455M available to fund go-forward Less: borrowings 22.9 potential working capital needs AR Securitization Facility: $37.1 AR Securitization availability l Upsized $60M facility provides incremental liquidity Cash and cash equivalents 78.0 l Opportunity to add Kito Crosby at lower cost of capital $570.1 Liquidity Ample Liquidity Provides Further Flexibility 48


5 Appendix
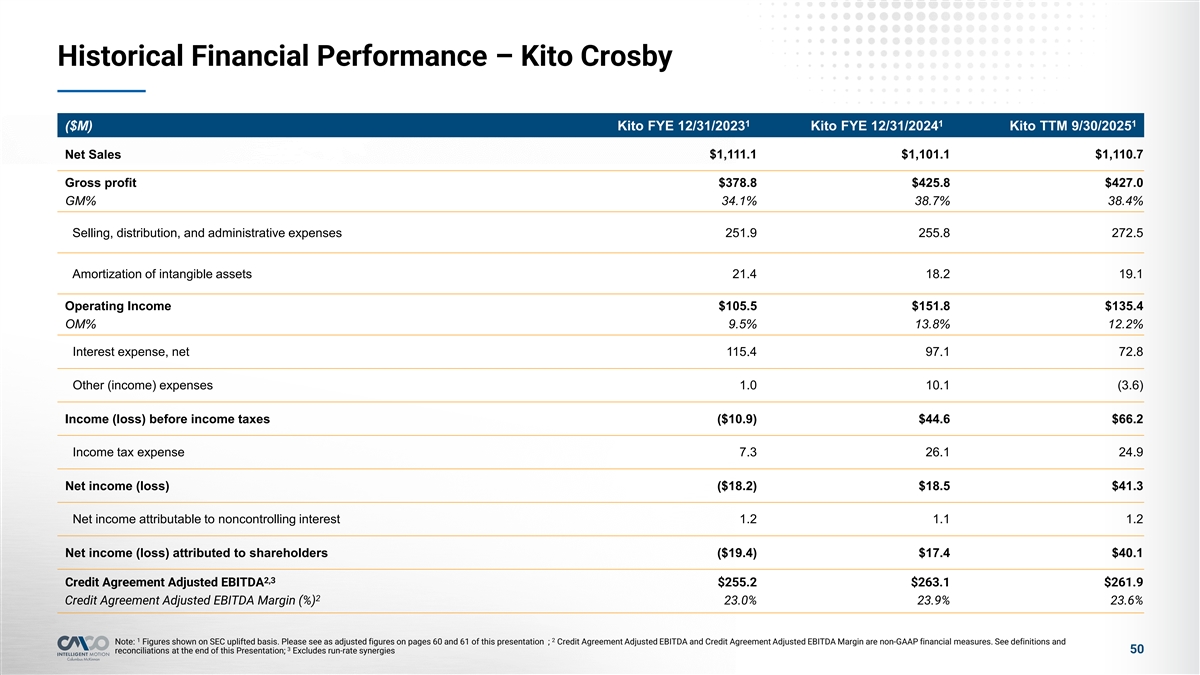

Historical Financial Performance – Kito Crosby 1 1 1 ($M) Kito FYE 12/31/2023 Kito FYE 12/31/2024 Kito TTM 9/30/2025 Net Sales $1,111.1 $1,101.1 $1,110.7 Gross profit $378.8 $425.8 $427.0 GM% 34.1% 38.7% 38.4% Selling, distribution, and administrative expenses 251.9 255.8 272.5 Amortization of intangible assets 21.4 18.2 19.1 Operating Income $105.5 $151.8 $135.4 OM% 9.5% 13.8% 12.2% Interest expense, net 115.4 97.1 72.8 Other (income) expenses 1.0 10.1 (3.6) Income (loss) before income taxes ($10.9) $44.6 $66.2 Income tax expense 7.3 26.1 24.9 Net income (loss) ($18.2) $18.5 $41.3 Net income attributable to noncontrolling interest 1.2 1.1 1.2 Net income (loss) attributed to shareholders ($19.4) $17.4 $40.1 2,3 Credit Agreement Adjusted EBITDA $255.2 $263.1 $261.9 2 Credit Agreement Adjusted EBITDA Margin (%) 23.0% 23.9% 23.6% 1 2 Note: Figures shown on SEC uplifted basis. Please see as adjusted figures on pages 60 and 61 of this presentation ; Credit Agreement Adjusted EBITDA and Credit Agreement Adjusted EBITDA Margin are non-GAAP financial measures. See definitions and 3 50 reconciliations at the end of this Presentation; Excludes run-rate synergies
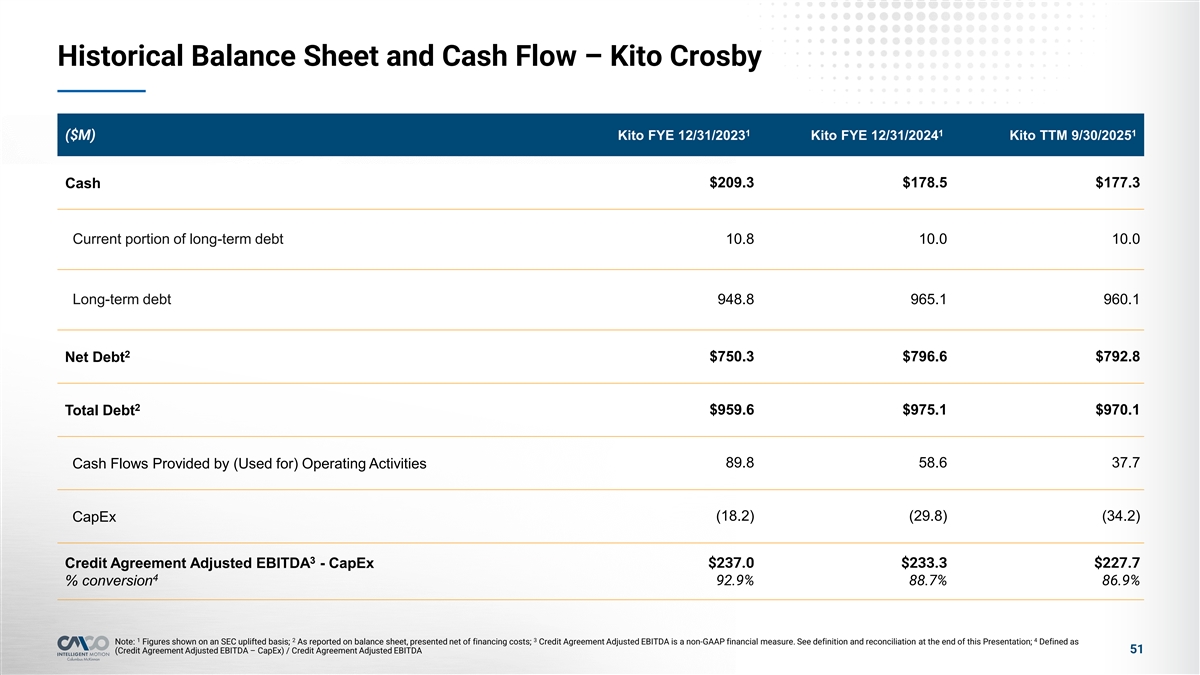

Historical Balance Sheet and Cash Flow – Kito Crosby 1 1 1 ($M) Kito FYE 12/31/2023 Kito FYE 12/31/2024 Kito TTM 9/30/2025 $209.3 $178.5 $177.3 Cash Current portion of long-term debt 10.8 10.0 10.0 Long-term debt 948.8 965.1 960.1 2 $750.3 $796.6 $792.8 Net Debt 2 $959.6 $975.1 $970.1 Total Debt 89.8 58.6 37.7 Cash Flows Provided by (Used for) Operating Activities (18.2) (29.8) (34.2) CapEx 3 Credit Agreement Adjusted EBITDA - CapEx $237.0 $233.3 $227.7 4 % conversion 92.9% 88.7% 86.9% 1 2 3 4 Note: Figures shown on an SEC uplifted basis; As reported on balance sheet, presented net of financing costs; Credit Agreement Adjusted EBITDA is a non-GAAP financial measure. See definition and reconciliation at the end of this Presentation; Defined as 51 (Credit Agreement Adjusted EBITDA – CapEx) / Credit Agreement Adjusted EBITDA
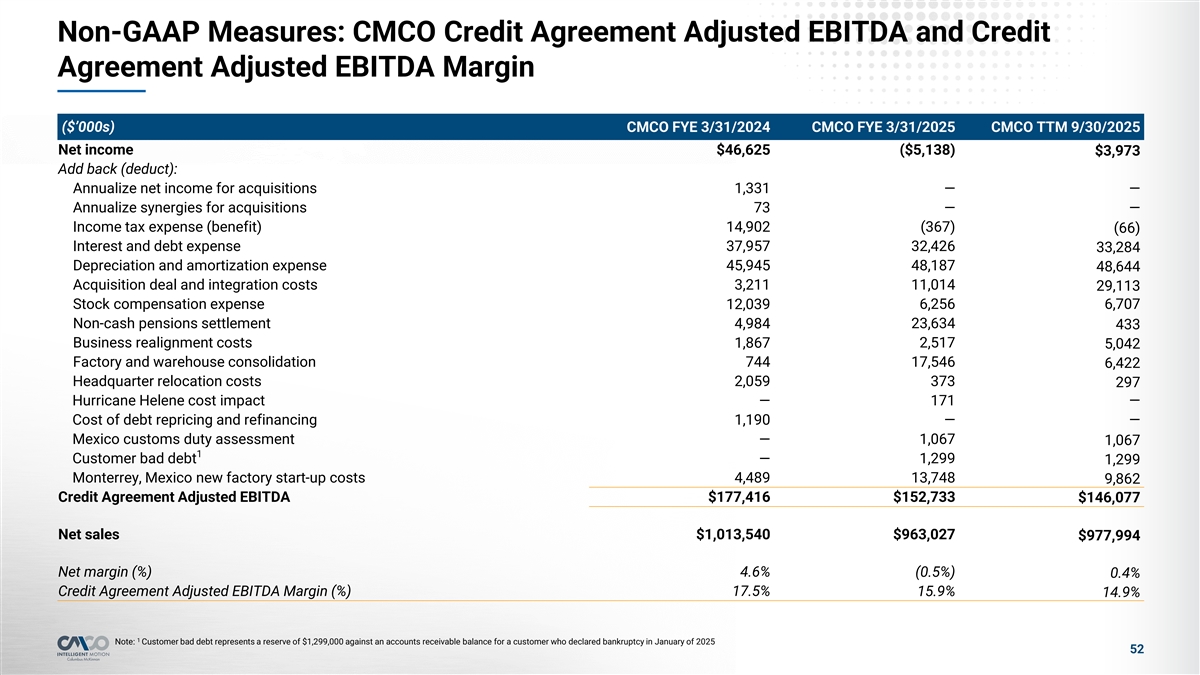

Non-GAAP Measures: CMCO Credit Agreement Adjusted EBITDA and Credit Agreement Adjusted EBITDA Margin ($’000s) CMCO FYE 3/31/2024 CMCO FYE 3/31/2025 CMCO TTM 9/30/2025 Net income $46,625 ($5,138) $3,973 Add back (deduct): Annualize net income for acquisitions 1,331 — — Annualize synergies for acquisitions 73 — — Income tax expense (benefit) 14,902 (367) (66) Interest and debt expense 37,957 32,426 33,284 Depreciation and amortization expense 45,945 48,187 48,644 Acquisition deal and integration costs 3,211 11,014 29,113 Stock compensation expense 12,039 6,256 6,707 Non-cash pensions settlement 4,984 23,634 433 Business realignment costs 1,867 2,517 5,042 Factory and warehouse consolidation 744 17,546 6,422 Headquarter relocation costs 2,059 373 297 Hurricane Helene cost impact — 171 — Cost of debt repricing and refinancing 1,190 — — Mexico customs duty assessment 1,067 — 1,067 1 Customer bad debt — 1,299 1,299 Monterrey, Mexico new factory start-up costs 4,489 13,748 9,862 Credit Agreement Adjusted EBITDA $177,416 $152,733 $146,077 Net sales $1,013,540 $963,027 $977,994 Net margin (%) 4.6% (0.5%) 0.4% Credit Agreement Adjusted EBITDA Margin (%) 17.5% 15.9% 14.9% 1 Note: Customer bad debt represents a reserve of $1,299,000 against an accounts receivable balance for a customer who declared bankruptcy in January of 2025 52
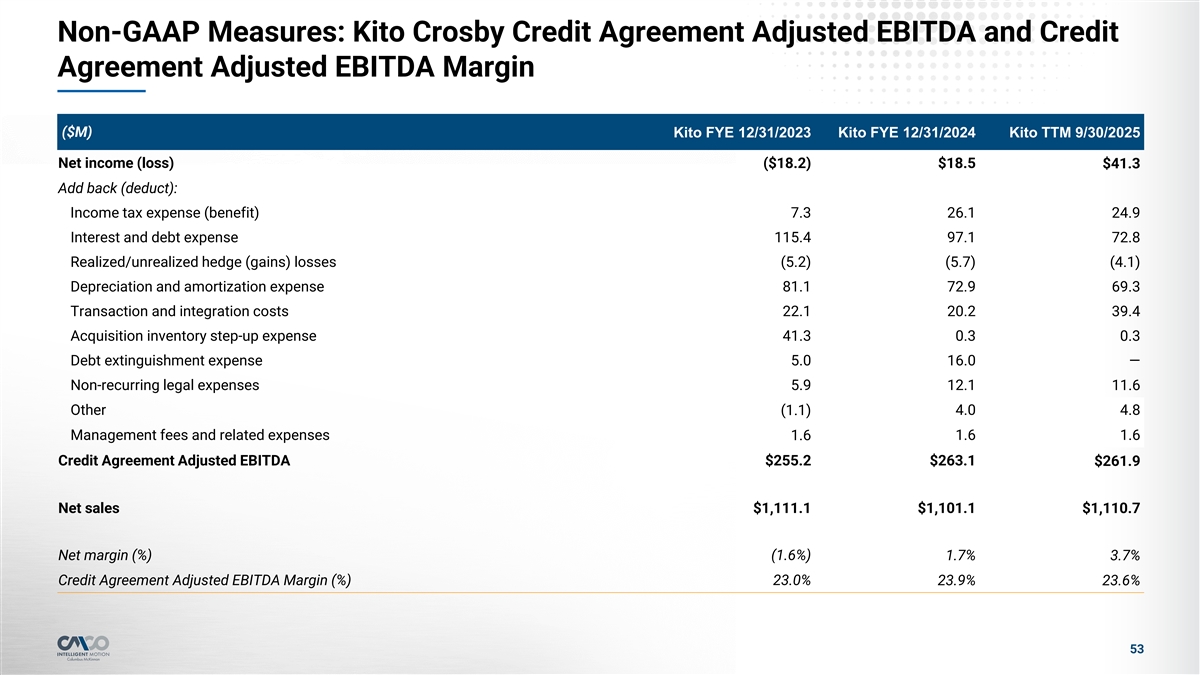

Non-GAAP Measures: Kito Crosby Credit Agreement Adjusted EBITDA and Credit Agreement Adjusted EBITDA Margin ($M) Kito FYE 12/31/2023 Kito FYE 12/31/2024 Kito TTM 9/30/2025 Net income (loss) ($18.2) $18.5 $41.3 Add back (deduct): Income tax expense (benefit) 7.3 26.1 24.9 Interest and debt expense 115.4 97.1 72.8 Realized/unrealized hedge (gains) losses (5.2) (5.7) (4.1) Depreciation and amortization expense 81.1 72.9 69.3 Transaction and integration costs 22.1 20.2 39.4 Acquisition inventory step-up expense 41.3 0.3 0.3 Debt extinguishment expense 5.0 16.0 — Non-recurring legal expenses 5.9 12.1 11.6 Other 4.0 4.8 (1.1) Management fees and related expenses 1.6 1.6 1.6 Credit Agreement Adjusted EBITDA $255.2 $263.1 $261.9 Net sales $1,111.1 $1,101.1 $1,110.7 Net margin (%) (1.6%) 1.7% 3.7% Credit Agreement Adjusted EBITDA Margin (%) 23.0% 23.9% 23.6% 53
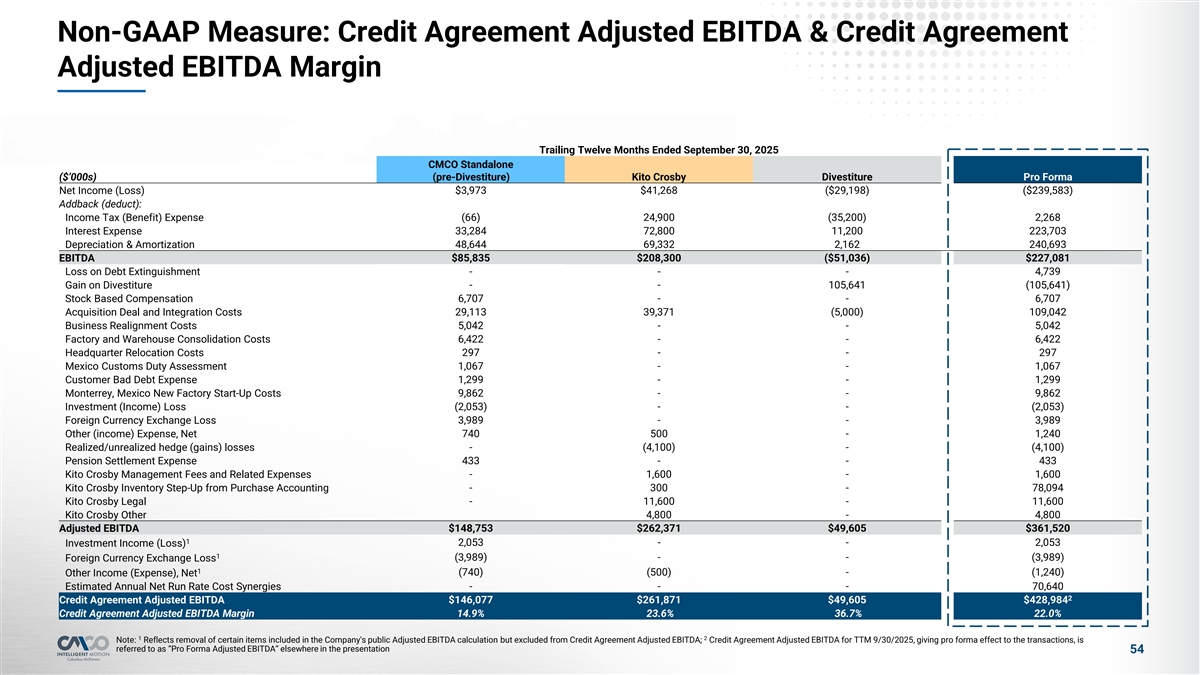

Non-GAAP Measure: Credit Agreement Adjusted EBITDA & Credit Agreement Adjusted EBITDA Margin Trailing Twelve Months Ended September 30, 2025 CMCO Standalone ($’000s) (pre-Divestiture) Kito Crosby Divestiture Pro Forma Net Income (Loss) $3,973 $41,268 ($29,198) ($239,583) Addback (deduct): Income Tax (Benefit) Expense (66) 24,900 (35,200) 2,268 Interest Expense 33,284 72,800 11,200 223,703 Depreciation & Amortization 48,644 69,332 2,162 240,693 EBITDA $85,835 $208,300 ($51,036) $227,081 Loss on Debt Extinguishment - - - 4,739 Gain on Divestiture - - 105,641 (105,641) Stock Based Compensation 6,707 - - 6,707 Acquisition Deal and Integration Costs 29,113 39,371 (5,000) 109,042 Business Realignment Costs 5,042 - - 5,042 Factory and Warehouse Consolidation Costs 6,422 - - 6,422 Headquarter Relocation Costs 297 - - 297 Mexico Customs Duty Assessment 1,067 - - 1,067 Customer Bad Debt Expense 1,299 - - 1,299 Monterrey, Mexico New Factory Start-Up Costs 9,862 - - 9,862 Investment (Income) Loss (2,053) - - (2,053) Foreign Currency Exchange Loss 3,989 - - 3,989 Other (income) Expense, Net 740 500 - 1,240 Realized/unrealized hedge (gains) losses - (4,100) - (4,100) Pension Settlement Expense 433 - - 433 Kito Crosby Management Fees and Related Expenses - 1,600 - 1,600 Kito Crosby Inventory Step-Up from Purchase Accounting - 300 - 78,094 Kito Crosby Legal - 11,600 - 11,600 Kito Crosby Other 4,800 - 4,800 Adjusted EBITDA $148,753 $262,371 $49,605 $361,520 1 2,053 - - 2,053 Investment Income (Loss) 1 (3,989) - - (3,989) Foreign Currency Exchange Loss 1 Other Income (Expense), Net (740) (500) - (1,240) Estimated Annual Net Run Rate Cost Synergies - - - 70,640 2 Credit Agreement Adjusted EBITDA $146,077 $261,871 $49,605 $428,984 Credit Agreement Adjusted EBITDA Margin 14.9% 23.6% 36.7% 22.0% 1 2 Note: Reflects removal of certain items included in the Company's public Adjusted EBITDA calculation but excluded from Credit Agreement Adjusted EBITDA; Credit Agreement Adjusted EBITDA for TTM 9/30/2025, giving pro forma effect to the transactions, is referred to as “Pro Forma Adjusted EBITDA” elsewhere in the presentation 54
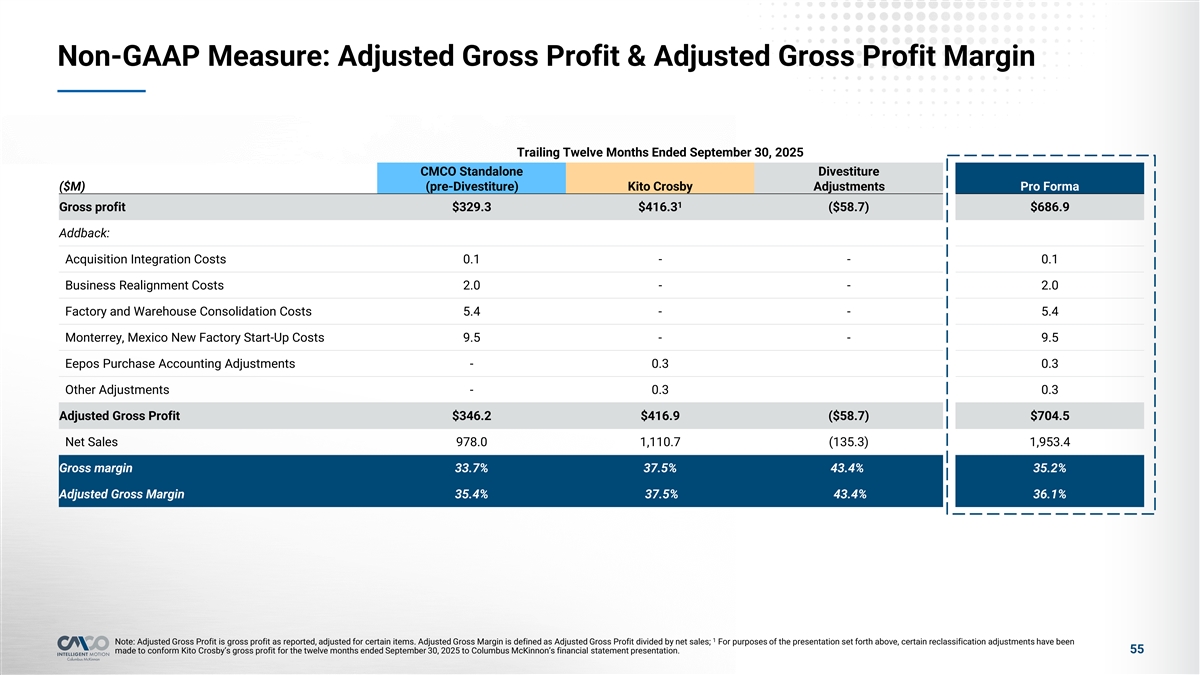

Non-GAAP Measure: Adjusted Gross Profit & Adjusted Gross Profit Margin Trailing Twelve Months Ended September 30, 2025 CMCO Standalone Divestiture ($M) (pre-Divestiture) Kito Crosby Adjustments Pro Forma 1 Gross profit $329.3 $416.3 ($58.7) $686.9 Addback: Acquisition Integration Costs 0.1 - - 0.1 Business Realignment Costs 2.0 - - 2.0 Factory and Warehouse Consolidation Costs 5.4 - - 5.4 Monterrey, Mexico New Factory Start-Up Costs 9.5 - - 9.5 Eepos Purchase Accounting Adjustments - 0.3 0.3 Other Adjustments - 0.3 0.3 Adjusted Gross Profit $346.2 $416.9 ($58.7) $704.5 Net Sales 978.0 1,110.7 (135.3) 1,953.4 Gross margin 33.7% 37.5% 43.4% 35.2% Adjusted Gross Margin 35.4% 37.5% 43.4% 36.1% 1 Note: Adjusted Gross Profit is gross profit as reported, adjusted for certain items. Adjusted Gross Margin is defined as Adjusted Gross Profit divided by net sales; For purposes of the presentation set forth above, certain reclassification adjustments have been 55 made to conform Kito Crosby’s gross profit for the twelve months ended September 30, 2025 to Columbus McKinnon’s financial statement presentation.
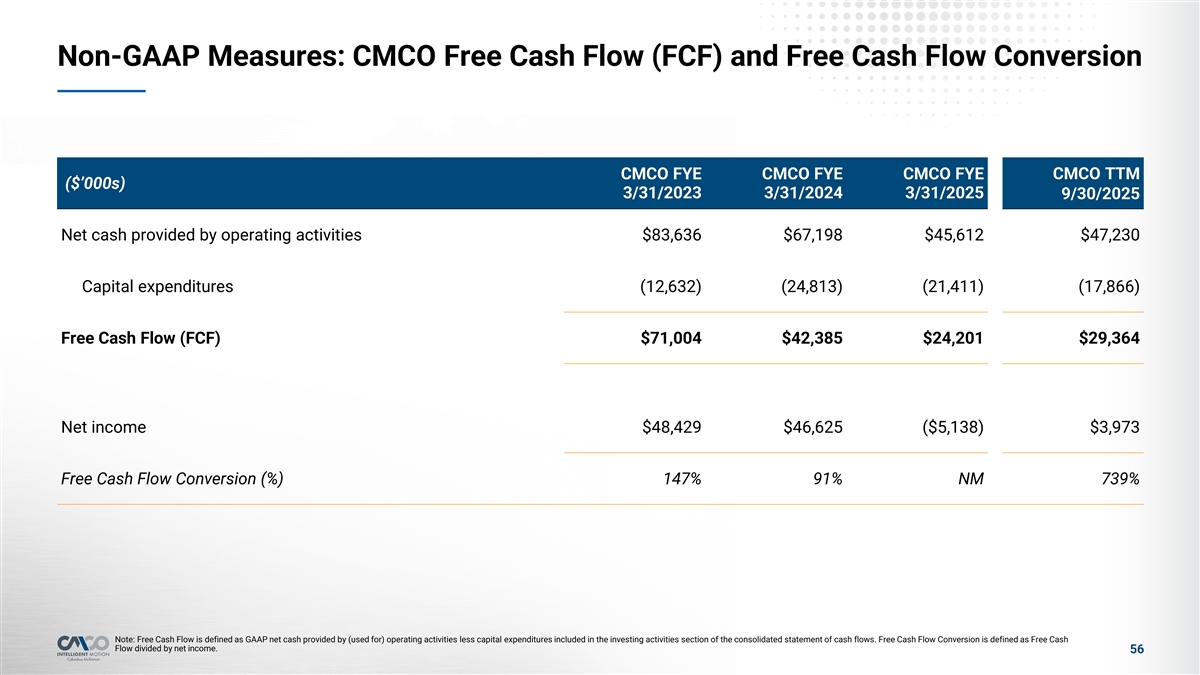

Non-GAAP Measures: CMCO Free Cash Flow (FCF) and Free Cash Flow Conversion CMCO FYE CMCO FYE CMCO FYE CMCO TTM ($’000s) 3/31/2023 3/31/2024 3/31/2025 9/30/2025 Net cash provided by operating activities $83,636 $67,198 $45,612 $47,230 Capital expenditures (12,632) (24,813) (21,411) (17,866) Free Cash Flow (FCF) $71,004 $42,385 $24,201 $29,364 Net income $48,429 $46,625 ($5,138) $3,973 Free Cash Flow Conversion (%) 147% 91% NM 739% Note: Free Cash Flow is defined as GAAP net cash provided by (used for) operating activities less capital expenditures included in the investing activities section of the consolidated statement of cash flows. Free Cash Flow Conversion is defined as Free Cash Flow divided by net income. 56
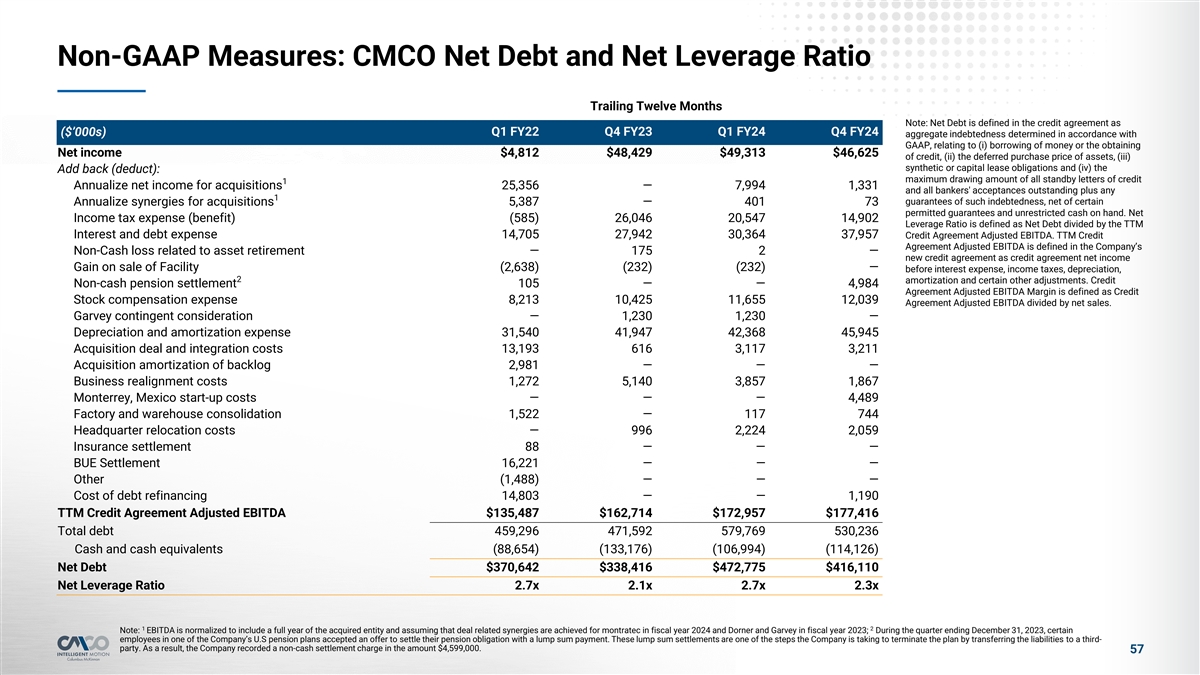

Non-GAAP Measures: CMCO Net Debt and Net Leverage Ratio Trailing Twelve Months Note: Net Debt is defined in the credit agreement as Q1 FY22 Q4 FY23 Q1 FY24 Q4 FY24 ($’000s) aggregate indebtedness determined in accordance with GAAP, relating to (i) borrowing of money or the obtaining Net income $4,812 $48,429 $49,313 $46,625 of credit, (ii) the deferred purchase price of assets, (iii) synthetic or capital lease obligations and (iv) the Add back (deduct): maximum drawing amount of all standby letters of credit 1 Annualize net income for acquisitions 25,356 — 7,994 1,331 and all bankers' acceptances outstanding plus any 1 guarantees of such indebtedness, net of certain Annualize synergies for acquisitions 5,387 — 401 73 permitted guarantees and unrestricted cash on hand. Net Income tax expense (benefit) (585) 26,046 20,547 14,902 Leverage Ratio is defined as Net Debt divided by the TTM Interest and debt expense 14,705 27,942 30,364 37,957 Credit Agreement Adjusted EBITDA. TTM Credit Agreement Adjusted EBITDA is defined in the Company’s Non-Cash loss related to asset retirement — 175 2 — new credit agreement as credit agreement net income Gain on sale of Facility (2,638) (232) (232) — before interest expense, income taxes, depreciation, 2 amortization and certain other adjustments. Credit Non-cash pension settlement 105 — — 4,984 Agreement Adjusted EBITDA Margin is defined as Credit Stock compensation expense 8,213 10,425 11,655 12,039 Agreement Adjusted EBITDA divided by net sales. Garvey contingent consideration — 1,230 1,230 — Depreciation and amortization expense 31,540 41,947 42,368 45,945 Acquisition deal and integration costs 13,193 616 3,117 3,211 Acquisition amortization of backlog 2,981 — — — Business realignment costs 1,272 5,140 3,857 1,867 Monterrey, Mexico start-up costs — — — 4,489 Factory and warehouse consolidation 1,522 — 117 744 Headquarter relocation costs — 996 2,224 2,059 Insurance settlement 88 — — — BUE Settlement 16,221 — — — Other (1,488) — — — Cost of debt refinancing 14,803 — — 1,190 TTM Credit Agreement Adjusted EBITDA $135,487 $162,714 $172,957 $177,416 Total debt 459,296 471,592 579,769 530,236 Cash and cash equivalents (88,654) (133,176) (106,994) (114,126) Net Debt $370,642 $338,416 $472,775 $416,110 Net Leverage Ratio 2.7x 2.1x 2.7x 2.3x 1 2 Note: EBITDA is normalized to include a full year of the acquired entity and assuming that deal related synergies are achieved for montratec in fiscal year 2024 and Dorner and Garvey in fiscal year 2023; During the quarter ending December 31, 2023, certain employees in one of the Company’s U.S pension plans accepted an offer to settle their pension obligation with a lump sum payment. These lump sum settlements are one of the steps the Company is taking to terminate the plan by transferring the liabilities to a third- party. As a result, the Company recorded a non-cash settlement charge in the amount $4,599,000. 57

Exhibit 99.3

KITO CROSBY LIMITED and subsidiaries

Condensed Consolidated Financial Statements as of September 30, 2025 and December 31, 2024 and the Three and Nine Months Ended September 30, 2025 and 2024 (Unaudited)


- 1 -


KITO CROSBY LIMITED and subsidiaries

TABLE OF CONTENTS


     Page  

Financial Statements (Unaudited)


Condensed Consolidated Balance Sheets as of September 30, 2025 and December 31, 2024

     3  

Condensed Consolidated Statements of Operations and Comprehensive Loss

for the Three and Nine Months Ended September 30, 2025 and 2024

     4  

Condensed Consolidated Statements of Cash Flows for the Nine Months Ended September 30, 2025 and 2024

     5  

Condensed Consolidated Statements of Changes in Equity for the Three and Nine Months Ended September 30, 2025 and 2024

     6  

Notes to the Condensed Consolidated Financial Statements

     7  


- 2 -


KITO CROSBY LIMITED and subsidiaries

UNAUDITED CONDENSED CONSOLIDATED BALANCE SHEETS

(in millions, except share amounts)


     September 30, 2025     December 31, 2024  

ASSETS


Current assets


Cash and cash equivalents

   $ 177.3     $ 178.5  

Accounts receivable, net (allowance for credit losses of $2.2 at September 30, 2025 and $2.1 at December 31, 2024)

     191.0       192.9  

Inventories

     366.6       322.6  

Prepaid expenses and other current assets

     16.7       11.8  

Income taxes receivable

     24.4       4.0  


Total current assets

     776.0       709.8  

Non-current assets


Property, plant and equipment, net

     270.7       276.0  

Goodwill, net

     133.2       140.4  

Other intangible assets, net

     222.7       230.4  

Other non-current assets

     68.6       64.0  


Total Assets

   $ 1,471.2     $ 1,420.6  


LIABILITIES AND EQUITY


Current liabilities


Accounts payable

   $ 100.1     $ 104.6  

Accrued expenses and other current liabilities

     123.2       107.5  

Current portion of long-term debt

     10.0       10.0  

Income taxes payable

     —        8.4  


Total current liabilities

     233.3       230.5  

Non-current liabilities


Long-term debt

     960.1       965.1  

Retirement benefit obligations

     26.0       27.2  

Deferred income tax liabilities, net

     54.3       57.6  

Other non-current liabilities

     48.1       45.8  


Total liabilities

     1,321.8       1,326.2  


Commitments and contingencies (Note 5)


EQUITY


Common stock, $0.01 par value per share; 162,665,281 shares
authorized; and 155,354,063 shares issued;
152,782,591 shares outstanding at September 30,
2025 and December 31, 2024, respectively

     1.7       1.7  

Deferred shares, $0.01 par value per share; 13,364,304,405
shares authorized and issued at September 30, 2025 and December 31, 2024

     133.6       133.6  

Additional paid-in capital

     734.6       734.6  

Accumulated deficit

     (637.1     (675.8

Noncontrolling interest

     12.2       11.3  

Accumulated other comprehensive loss

     (83.3     (98.7

Treasury stock, at cost (2,571,472 shares at September 30, 2025 and December 31, 2024)

     (12.3     (12.3


Total equity

     149.4       94.4  


Total liabilities and equity

   $ 1,471.2     $ 1,420.6  


The accompanying notes are an integral part of these condensed consolidated financial statements.


- 3 -


KITO CROSBY LIMITED and subsidiaries

UNAUDITED CONDENSED CONSOLIDATED STATEMENTS OF OPERATIONS

(in millions)


     Three Months Ended September 30,     Nine Months Ended September 30,  
     2025     2024     2025     2024  

Net sales

   $ 278.7     $ 261.7     $ 833.7     $ 824.1  

Cost of sales

     166.8       157.2       512.6       504.2  


Gross profit

     111.9       104.5       321.1       319.9  


Selling, distribution and administrative expenses

     68.4       59.8       197.2       180.5  

Amortization of intangible assets

     5.0       4.2       14.6       13.7  


Operating income

     38.5       40.5       109.3       125.7  

Interest expense, net

     20.6       23.9       50.9       75.2  

Unrealized loss (gain) on derivative

     0.2       6.9       0.1       2.3  

Realized gain on derivative

     (0.3     (1.5     (0.8     (4.6

Other expense

     (0.2     —        0.7       —   

New market tax credit extinguishment

     —        —        —        (9.9

Deferred financing cost expense upon payoff

     —        —        —        25.9  


Income before income taxes

     18.2       11.2       58.4       36.8  

Income tax expense

     3.1       6.2       18.8       20.0  


Net income

     15.1       5.0       39.6       16.8  


Net income attributable to noncontrolling interest

     0.3       0.2       0.9       0.8  

Net income attributable to shareholders

     14.8       4.8       38.7       16.0  


Other comprehensive income (loss), net of tax:


Foreign currency translation gain (loss)

     (2.3     29.0       15.4       5.3  


Other comprehensive income (loss), net of tax

     (2.3     29.0       15.4       5.3  


Total comprehensive income (loss)

   $ 12.8     $ 34.0     $ 55.0     $ 22.1  


The accompanying notes are an integral part of these condensed consolidated financial statements.


- 4 -


KITO CROSBY LIMITED and subsidiaries

UNAUDITED CONDENSED CONSOLIDATED STATEMENTS OF CASH FLOWS

(in millions)


     NIne Months Ended September 30,  
     2025     2024  

Cash flows from operating activities


Net income

   $ 39.6     $ 16.8  

Adjustments to reconcile net income to net cash provided by (used in) operating activities:


Depreciation of property, plant and equipment

     37.0       37.9  

Amortization of intangible assets and debt issuance cost

     17.0       16.6  

New market tax credit extingushment

     —        (9.9

Deferred financing cost expensed upon payoff

     —        25.9  

Deferred income taxes

     (3.3     (9.4

Inventory obsolescence reserve

     3.5       0.2  

Changes in operating assets and liabilities net of assets acquired and liabilities assumed:


Accounts receivable

     1.9       (2.5

Inventories

     (47.6     0.4  

Prepaid expenses

     (5.4     9.5  

Accounts payable

     (5.4     0.3  

Accrued expenses and other liabilities

     17.6       (13.2

Income taxes

     (23.5     (23.9

Retirement benefit obligations

     (1.6     (0.1

Foreign currency effects and other

     (11.7     (9.6


Net cash provided by operating activates

     18.1       39.0  


Cash flows from investing activities


Purchase of property, plant and equipment

     (23.0     (17.6

Business acquisitions, net of cash acquired

       (33.4


Net cash used in investing activities

     (23.0     (51.0


Cash flows from financing activities


Proceeds from long-term borrowings

     —        1,000.0  

Payments on long-term borrowings

     (7.5     (993.1

Payment of debt issuance costs

     —        (18.0

Proceeds from issuing common stock

     —        0.2  

Repurchase of treasury stock

     —        (1.1


Net cash used in financing activities

     (7.5     (12.0


Effect of changes in foreign exchange rates on cash

     11.2       0.8  


Net (decrease) increase in cash and cash equivalents

     (1.2     (23.2

Cash and cash equivalents - beginning of period

     178.5       209.3  


Cash and cash equivalents - end of period

   $ 177.3     $ 186.1  


Supplemental cash flow information


Cash interest paid

   $ 50.8     $ 75.5  

Cash taxes paid

   $ 13.4     $ 41.6  

Purchases of property, plant and equipment accrued in accounts payable

   $ 0.9     $ 1.9  

Non cash purchase price of business acquisition

   $ —      $ 8.0  

The accompanying notes are an integral part of these condensed consolidated financial statements.


- 5 -


KITO CROSBY LIMITED and subsidiaries

UNAUDITED CONDENSED CONSOLIDATED STATEMENTS OF CHANGES IN EQUITY

(in millions)


    Three Months Ended Sept 30, 2024  
    Common Shares
$0.01 Per Share
    Deferred Shares
$0.01 Per Share
                      Accumulated
Other
Comprehensive
Loss
          Treasury Share
$0.01 Per Share
       
    Shares     Amount     Shares     Amount     Paid-in
Capital
    Noncontrolling
Interest
    Accumulated
Deficit
          Shares     Amount     Total
Equity
 

December 31, 2023

    154.3     $ 1.7       13,364.3     $ 133.6     $ 726.4     $ 10.2     $ (693.2   $ (60.0     #       2.4     $ (10.9   $ 107.8  

Repurchase of treasury stock

    —        —        —        —        —        —        —        —          —        (0.3     (0.3

Net Income / (Loss)

    —        —        —        —        —        0.4       (1.6     —          —        —        (1.2

Other comprehensive income / (loss)

    —        —        —        —        —        —        —        (5.6       —        —        (5.6

Issuance of common stock

  $ —      $ —      $ —      $ —      $ —      $ —      $ —      $ —        $ —      $ —      $ —   


March 31, 2024

  $ 154.3     $ 1.7     $ 13,364.3     $ 133.6     $ 726.4     $ 10.6     $ (694.8   $ (65.6     $ 2.4     $ (11.2   $ 100.7  


Repurchase of treasury stock

    —        —        —        —        —        —        —        —          —        (0.8     (0.8

Net Income

    —        —        —        —        —        0.2       12.8       —          —        —        13.0  

Other comprehensive income / (loss)

    —        —        —        —        —        —        —        (18.1       —        —        (18.1

Issuance of common stock

    —        —        —        —        —        —        —        —          —        —        —   

June 30, 2024

  $ 154.3     $ 1.7     $ 13,364.3     $ 133.6     $ 726.4     $ 10.8     $ (682.0   $ (83.7     $ 2.4     $ (12.0   $ 94.8  


Repurchase of treasury stock

    —        —        —        —        —        —        —        —          —        —        —   

Net Income

    —        —        —        —        —        0.2       4.8       —          —        —        5.0  

Other comprehensive income / (loss)

    —        —        —        —        —        —        —        29.0         —        —        29.0  

Issuance of common stock

    —        —        —        —        —        —        —        —          —        —        —   


September 30, 2024

  $ 154.3     $ 1.7     $ 13,364.3     $ 133.6     $ 726.4     $ 11.0     $ (677.2   $ (54.7     #     $ 2.4     $ (12.0   $ 128.8  


    Three Months Ended Sept 30, 2025  
    Common Shares
$0.01 Per Share
    Deferred Shares
$0.01 Per Share
                      Accumulated
Other

Comprehensive
Loss
          Treasury Share
$0.01 Per Share
       
    Shares     Amount     Shares     Amount     Paid-in
Capital
    Noncontrolling
Interest
    Accumulated
Deficit
          Shares     Amount     Total
Equity
 

December 31, 2024

    155.2     $ 1.7       13,364.3     $ 133.6     $ 734.6     $ 11.3     $ (675.8   $ (98.7       2.6     $ (12.3   $ 94.4  

Repurchase of treasury stock

    —        —        —        —        —        —        —        —          —        —        —   

Net Income

    —        —        —        —        —        0.2       13.0       —          —        —        13.2  

Other comprehensive income / (loss)

    —        —        —        —        —        —        —        17.9         —        —        17.9  

Issuance of common stock

    —        —        —        —        —        —        —        —          —        —        —   

March 31, 2025

  $ 155.2     $ 1.7     $ 13,364.3     $ 133.6     $ 734.6     $ 11.5     $ (662.8   $ (80.8     $ 2.6     $ (12.3   $ 125.5  


Repurchase of treasury stock

    —        —        —        —        —        —        —        —          —        —        —   

Net Income

    —        —        —        —        —        0.4       10.9       —          —        —        11.3  

Other comprehensive income / (loss)

    —        —        —        —        —        —        —        (0.2       —        —        (0.2

Issuance of common stock

    —        —        —        —        —        —        —        —          —        —        —   

June 30, 2025

  $ 155.2     $ 1.7     $ 13,364.3     $ 133.6     $ 734.6     $ 11.9     $ (651.9   $ (81.0     $ 2.6     $ (12.3   $ 136.6  


Repurchase of treasury stock

    —        —        —        —        —        —        —        —          —        —        —   

Net Income

    —        —        —        —        —        0.3       14.8       —          —        —        15.1  

Other comprehensive income / (loss)

    —        —        —        —        —        —        —        (2.3       —        —        (2.3

Issuance of common stock

    —        —        —        —        —        —        —        —          —        —        —   


September 30, 2025

  $ 155.2     $ 1.7     $ 13,364.3     $ 133.6     $ 734.6     $ 12.2     $ (637.1   $ (83.3     $ 2.6     $ (12.3   $ 149.4  


The accompanying notes are an integral part of these condensed consolidated financial statements.


- 6 -


KITO CROSBY LIMITED and subsidiaries

NOTES TO THE CONDENSED CONSOLIDATED FINANCIAL STATEMENTS (UNAUDITED)


1.

BUSINESS AND ORGANIZATION

Background —Crosby Worldwide Limited now Kito Crosby Limited (the “Company”) was formed as a limited company incorporated in the United Kingdom on October 4, 2013, by investment funds affiliated with and managed by Kohlberg Kravis Roberts & Co. L.P. (“KKR”) as a holding company with no operations.

Since its inception, the Company has significantly expanded its global operations through a series of strategic acquisitions, enhancing its portfolio of innovative solutions for lifting, rigging, and material handling. Innovative solutions and technologies have been introduced through acquisitions such as Gunnebo Industries and Verton Technologies, bringing advanced products like blocks, sheaves, and disruptive load orientation technology that enhance safety and efficiency in lifting operations. The Company has also expanded into niche markets with the acquisition of BlokCorp and Airpes, providing innovative camera systems for cranes and specialized lifting solutions for the wind energy sector. Recent acquisitions, including Kito Corporation and Eepos Gmbh, have further solidified the Company’s market position, enabling it to offer a comprehensive range of products and services globally.

The current operations are done under brands such as Kito, Crosby, Harrington, Gunnebo, and Peerless, serving a wide array of end markets including oil & gas, industrial, construction, infrastructure, and mining. The Company’s geographical reach spans North America, Europe, the Middle East, Asia, and Latin America.

This unaudited quarterly report has been abbreviated and should be read in conjunction with the financial statements and the notes thereto included in the Company’s latest annual financial statements.


2.

SUMMARY OF SIGNIFICANT ACCOUNTING POLICIES

Basis of Presentation — The accompanying condensed consolidated financial statements are prepared in accordance with accounting principles generally accepted in the United States (“US GAAP”).

Principles of Consolidation — The accompanying condensed consolidated financial statements include the accounts of Kito Crosby Limited and its wholly-owned subsidiaries. All intercompany accounts and transactions have been eliminated in consolidation. Further, any ownership not attributable to the Company and related earnings are shown as noncontrolling interest in the statements of operations and statements of equity.

Use of Estimates — The preparation of financial statements in accordance with US GAAP requires management to make estimates and assumptions that affect the reported amounts of assets and liabilities at the date of the financial statements and reported amounts of revenues and expenses during the reporting periods. Actual results could differ from those estimates.

Dollar Amounts — All dollar amounts (except share and per share amounts) presented in the tabulations within the notes to our consolidated financial statements are stated in millions of US dollars, unless otherwise noted.

Foreign Currency — The Company’s functional and reporting currency is the US Dollar (“USD”) for all periods presented. However, some of the subsidiaries of the Company have a functional currency other than USD.

Foreign-currency Transaction Gains and Losses — Monetary assets and liabilities denominated in currencies other than functional currencies are measured at the balance sheet date, while transactions in foreign currencies are measured at the rates on the transaction dates. The resulting foreign-currency transaction gains and losses are recorded in the condensed consolidated statements of operations as a component of cost of sales.

Foreign-currency Translation Gains and Losses — Financial statements of entities within the reporting group that have a functional currency other than USD are translated into USD as follows: assets and liabilities are translated using the exchange rate at the balance sheet date and the results of operations using the average exchange rate during the period. The resulting translation adjustments are reflected as a separate component of other comprehensive income (loss).


- 7 -


Revenue Recognition — The Company recognizes revenue under ASC 606, Revenue from Contracts with Customers. The Company accounts for a contract with a customer when it has a legally enforceable contract with the customer, the arrangement identifies the rights of the parties, the contract has commercial substance, and the Company determines it is probable that it will collect substantially all of the consideration it is entitled to. Revenue is recognized when control of promised goods or services is transferred to the customer in an amount reflecting the consideration the Company expects to receive in exchange for those goods or services.

The Company generates the majority of its revenue from the sale of standard products. Revenue is recognized at the point in time that control transfers to the customer, which occurs upon shipment or delivery, depending on the contract terms and legal requirements. Payment terms generally require payment within 30 to 60 days. Each standard product is deemed to be a single performance obligation, and the amount of revenue recognized is based on the negotiated price. The transaction price generally consists of fixed consideration based on the fixed price stated in the contract. Sales incentives, such as volume-based discounts and rebates for priority customers, are accounted for as variable consideration included in the transaction price. Accordingly, the Company reduces revenue for these incentives in the period in which the sale occurs, using the most likely amount method for estimating the consideration expected to be received.

For contracts that may contain multiple performance obligations, the Company accounts for individual products and services as separate performance obligations if they are distinct, which is if (i) a product or service is separately identifiable from other items in the arrangement and (ii) the customer can benefit from the product or service on its own or with other readily available resources. The transaction price is allocated to the separate performance obligations on a relative standalone selling price basis. The Company determines standalone selling prices based on observable prices of products or services sold separately in comparable circumstances to similar customers.

Cost of Sales — Cost of sales reflects the costs of manufacturing and shipping the Company’s products, such as raw materials, energy, labor, depreciation and repair costs of property, plant and equipment employed in manufacturing and other production costs.

Warranty Costs — Estimated costs related to products warranty are accrued using a specific identification basis. Estimated costs are based on past warranty claims, sales history, and the remaining warranty periods.

Shipping and Handling Costs — Amounts billed to customers in sale transactions related to shipping and handling costs are recorded as revenue as shipping activity is considered a fulfillment activity (no separate obligation). Shipping and handling costs incurred are included in cost of sales in the accompanying condensed consolidated statement of operations.

Selling, Distribution and Administrative Expense — Selling, distribution, and administrative expense is primarily comprised of selling expenses, marketing expenses, research and development costs, administrative and other indirect overhead costs and depreciation expense on non-manufacturing assets and other miscellaneous operating items.

Advertising Costs — Advertising costs are immaterial and are expensed as incurred and included in selling and marketing expense.

Cash and Cash Equivalents — Cash and cash equivalents are defined as short-term highly liquid investments with original maturities of 90 days or less.

Accounts Receivable, Net — Accounts receivable are reported in the balance sheet net of allowance for credit losses. The Company evaluates the collectability of accounts receivable based on a combination of factors, including circumstances that indicate a specific customer’s inability to meet its financial obligations, historical collection experience, and an evaluation of expected risk of credit loss based on current conditions and reasonable and supportable forecasts of future economic conditions over the life of the receivable. The Company pools its Accounts receivable based on similar risk characteristics in estimating its expected credit losses. In situations where a receivable does not share the same risk characteristics with others, the Company measures it individually. The Company also continuously evaluates such pooling decisions and adjusts as needed from period to period as risk characteristics change.

In line with ASU No. 2016-13, the Company has adopted the Current Expected Credit Losses (CECL), Credit losses are recorded in Selling, distribution and administrative expenses in the accompanying condensed consolidated statements of operations. The Company’s allowance for current expected credit loss activity has historically not been significant. Account balances are charged off against the allowance after all means of collection have been exhausted and the potential for recovery is considered remote. Expected recoveries of amounts previously written off, not to exceed the aggregate of the amount previously written off, are included in determining the necessary reserve at the balance sheet date.


- 8 -


Inventories — Inventories are stated at the lower of cost or net realizable value. The principal components of cost included in inventories are materials, direct labor and manufacturing overhead. Inventory at certain of the Company’s U.S. locations is accounted for using the “last-in, first-out” (“LIFO”) method. For all other locations, the “first-in, first-out” (“FIFO”) method was used.

The Company performs periodic assessments to determine the existence of obsolete, slow-moving and damaged inventory and records necessary provisions to reduce such inventory to the lower of cost or net realizable value.

Property, Plant and Equipment — Property, plant and equipment are carried at cost less accumulated depreciation and historical impairment. Upon purchase or construction of an asset in the normal course of business the Company capitalizes all costs necessary to make the asset ready for its intended use.

Property, plant and equipment is depreciated over its estimated useful life using the straight-line method. Useful lives for property, plant and equipment by major asset class were as follows:


Asset Class


Useful Life

Machinery and equipment   

3 to 20 years

Buildings   

30 to 50 years

Expenditures for maintenance and repairs are charged to operating expense as incurred. The costs of major renewals and improvements that extend the life or operating efficiency of the asset are capitalized. At the time property, plant and equipment is retired or otherwise disposed, the cost and associated reserves for accumulated depreciation are removed from the accounts and the gain or loss on disposal is recognized in the period incurred.

Long-Lived Assets — Long-lived assets, such as property, plant, and equipment and purchased intangible assets subject to amortization, are reviewed for impairment whenever events or changes in circumstances indicate that the carrying amount of an asset may not be recoverable. If circumstances require a long-lived asset be tested for possible impairment, the Company first compares the undiscounted cash flows expected to be generated by an asset group to the carrying value of the asset. If the carrying value of the long-lived asset is not recoverable on an undiscounted cash flow basis, impairment is recognized to the extent that the carrying value exceeds its fair value. Fair value is determined through various valuation techniques including discounted cash flow models, quoted market values and third-party independent appraisals, as considered necessary. These determinations of fair value are primarily based upon internally developed cash flow models and would generally be classified as Level 3 inputs in the valuation hierarchy. The Company groups long-lived assets by asset group for purposes of recognition and measurement of an impairment loss as this is the lowest level for which cash flows are independent.

As of September 30, 2025, and December 31, 2024, there were no circumstances that indicate that the carrying amount of such long-lived assets may not be recoverable. Accordingly, no impairment losses have been recognized.

Leases — The Company’s leases are classified as operating leases and consist of manufacturing facilities, sales offices, distribution centers, warehouses, vehicles, and equipment. For leases with terms greater than twelve months, at lease commencement, the Company recognizes a ROU asset and a lease liability. The initial lease liability is recognized at the present value of remaining lease payments over the lease term. Leases with an initial term of twelve months or less are not recorded on the Company’s Condensed Consolidated Balance Sheet. The Company recognizes lease expense for operating leases on a straight-line basis over the lease term. Additionally, because the Company has elected to not separate lease and non-lease components, variable costs also include payments to the landlord for common area maintenance, real estate taxes, insurance, and other operating expenses.

Goodwill and Intangible Assets— In connection with past acquisitions, a significant amount of the purchase price was allocated to goodwill, tradenames, patents and customer relations. Goodwill consists of the excess of the purchase price over the fair value of tangible and identifiable intangible net assets acquired.


- 9 -


Goodwill and other indefinite-lived intangible assets

Goodwill and other indefinite-lived intangible assets (i.e. tradenames) are tested annually for impairment on December 31st of each year, or more frequently when events or changes in circumstances or other conditions suggest impairment may have occurred. Impairment exists when the asset carrying values exceed their respective fair values. The excess is recorded to operations as an impairment charge.

The Company tests the tradenames for potential impairment using an income approach and relief from royalty method, which requires the use of significant unobservable inputs, including assumptions of future revenues. In testing for goodwill impairment, the Company uses an income and market approach. For purposes of the income approach, fair value is determined based on the present value of estimated future cash flows, discounted at an appropriate risk-adjusted rate. Internal forecasts are used to estimate future cash flows and include an estimate of long-term future growth rates based on the most recent views of the long-term outlook for the company. The company also uses the market approach as an additional element of its entity valuation. This technique utilizes comparative market multiples in the valuation estimate. The estimated fair value of the company from each approach often results in a premium over its market capitalization, commonly referred to as a control premium. Assessing the acceptable control premium percentage requires judgment and is impacted by external factors such as observed control premiums from comparable transactions derived from the prices paid on recent publicly disclosed acquisitions in the industry.

Estimating the fair value of the Company requires the use of estimates and significant judgments that are based on a number of factors including current and historical actual operating results, balance sheet carrying values, most recent forecasts, and other relevant quantitative and qualitative information. These estimates are primarily based upon internally developed cash flow models and would generally be classified as Level 3 inputs in the valuation hierarchy. If current or expected conditions deteriorate, it is reasonably possible that the judgments and estimates described above could change in future periods and result in impairment charges. The Company recognizes an impairment charge to operations in the amount that the reporting unit’s carrying value exceeds its fair value. Any impairment charge recognized cannot exceed the total amount of goodwill allocated to the reporting unit.

As of September 30, 2025, and December 31, 2024, there were no circumstances that indicate that the carrying amount of such goodwill and other indefinite-lived intangible assets may not be recoverable. Accordingly, no impairment losses have been recognized.

Definite-lived intangible assets

Acquired customer-relationship and patents intangible assets were measured at fair value at the date of acquisition using the multi-period excess earnings method under the income approach and are being amortized based on the estimated pattern in which the economic benefits are expected to be consumed in a straight-line basis over the useful lives from 7 to 12 years. Amortization expense in any given year is based on a rate that discounted net future cash flows arising from these customer relationships for that year bear to total discounted net cash flows these relationships are expected to generate. Because a level of customer attrition is assumed to occur, the application of this amortization method results in a declining cost base and associated amortization expense over the expected economic life of these assets.

As of September 30, 2025, and December 31, 2024, there were no circumstances that indicate that the carrying amount of such definite-lived intangible assets may not be recoverable. Accordingly, no impairment losses have been recognized.

Environmental and Legal Contingencies — Liabilities for environmental remediation costs and other contingent liabilities are initially recognized on an undiscounted basis when the Company’s loss with respect to a particular environmental or other matter is both probable of being incurred and reasonably estimable and are included in the accompanying condensed consolidated balance sheets in accrued expenses and other current liabilities and in other non-current liabilities. Subsequent adjustments to initial liability estimates are recorded as necessary based upon additional information developed in subsequent periods. These estimates are primarily based upon internally developed cash flow models and would generally be classified as Level 3 inputs in the valuation hierarchy. The charges associated with environmental and legal contingencies, net of recognized cost recoveries, are reflected in the statements of operations as a component of administrative expenses.

Environmental Obligations — As sites of environmental concern are identified, the Company assesses the existing conditions, claims and assertions, and records an estimated undiscounted liability when environmental assessments and/or remedial efforts are probable, and the associated costs can be reasonably estimated. Estimates of environmental liabilities, which reflect the cost of investigation and


- 10 -


remediation, are based on a variety of matters, including, but not limited to, the stage of investigation, the stage of the remedial design, evaluation of existing remediation technologies, and presently enacted laws and regulations. In future periods, a number of factors could significantly change the Company’s estimate of environmental remediation costs, such as changes in laws and regulations, or changes in their interpretation or administration, revisions to the remedial design, unanticipated construction problems, identification of additional areas or volumes of contaminated soil and groundwater, and changes in costs of labor, equipment and technology.

Personal Injury Claims and Other Legal Contingencies — From time to time, the Company, along with numerous other unrelated third parties, may be named as a defendant in personal injury lawsuits, allegedly arising from the use of products produced by the Company’s subsidiaries. Certain of these claims are based on alleged exposure to asbestos-containing materials. The associated liability for pending and probable future claims and future defense costs is estimated based on historical and expected claim experience, considering factors such as the number of claims filed, average indemnification per claim, average claim dismissal rate, and average defense cost per claim.

Cost Recoveries — To the extent costs associated with environmental investigation and remediation activities or personal injury claims have been incurred and are recoverable under insurance policies or cost-sharing arrangements and such recoveries are deemed probable, the Company recognizes a receivable on an undiscounted basis. Receivables are reflected in the accompanying condensed consolidated balance sheets in accounts receivable and in other non-current assets, depending on the estimated timing of recovery.

Retirement Plans — The Company sponsors a number of defined contribution and defined benefit retirement plans.

Defined Contribution Plans — Contributions payable to defined contribution plans are charged to expense as the contributions are earned by employees.

Defined Benefit Plans — All of the Company’s pension plans are closed to new entrants for participation and are frozen, meaning that plan participants no longer accrue benefits, with the exception of the local statutory pension plans in Sweden and Japan. Previously accrued benefits to which existing plan participants are entitled and accrued benefits in these plans are generally based on age at retirement and years of service. Pension liabilities, as well as the net periodic cost, are actuarially determined using several assumptions, the most significant of which are the discount rate and the long-term rate of return on plan assets. The recognition of actuarial gains and losses, which occur when actual experience differs from actuarial assumptions, is initially deferred to accumulated other comprehensive income (loss) in stockholders’ equity (deficit), net of taxes. If actuarial gains and losses exceed ten percent of the greater of plan assets or plan obligations, they are amortized into net income over the average future service period or life of plan participants. The funded status of the Company’s pension plans is reflected on the condensed consolidated balance sheets as a net pension liability, on a plan-by-plan basis, as retirement benefit obligation.

Derivative Financial Instruments — Derivative instruments are recognized as either assets or liabilities at fair value in the balance sheet with changes to fair value recorded in the statement of operations.

From time to time the Company also utilizes interest rate derivatives to help stabilize the interest expense on the outstanding debt. The Company does not use hedge accounting for these derivatives. Unrealized loss was recognized in the statement of operations of $0.2 million $6.9 million for the three months ended September 30, 2025, and September 30, 2024, respectively and an unrealized loss of $0.1 million and $2.3 million for the nine months ended September 30, 2025 and September 30, 2024, respectively. The Company had realized gains of $0.3 million and $1.5 million during the three months ended September 30, 2025, and September 30 2024, respectively and $0.8 million and $4.6 million during the nine months ended September 30, 2025 and September 30, 2024.

Income Taxes

Current Income Taxes — Current tax is the amount of tax payable or recoverable in respect of the taxable profit or loss for the period. Taxable profit differs from accounting profit because it excludes items of income or expense recognized for accounting purposes that are either not taxable or deductible for tax purposes or are taxable or deductible in other periods. Current tax is calculated using tax rates that have been enacted at the balance sheet date.


- 11 -


Uncertain Tax Positions — Uncertain tax positions are recognized in the condensed consolidated financial statements for positions which are considered more likely than not of being sustained based on the technical merits of the position on audit by the tax authorities. The measurement of the tax benefit recognized in the condensed consolidated financial statements is based upon the largest amount of tax benefit that, in management’s judgment, is greater than 50% likely of being realized based on a cumulative probability assessment of the possible outcomes. The Company reflects interest on unrecognized tax benefits and penalties as a component of income tax expenses, while interest and penalties that are accrued are included in the corresponding tax liability in the condensed consolidated balance sheets.

Deferred Income Taxes — Deferred tax assets and liabilities are recognized for differences between the carrying amounts of assets and liabilities in the condensed consolidated financial statements and the tax bases of assets and liabilities that will result in future taxable or deductible amounts. The deferred tax assets and liabilities are measured using the enacted tax laws and rates applicable to the periods in which the differences are expected to affect taxable income.

Deferred tax assets are reduced by a valuation allowance when, in the opinion of management, it is more likely than not that some portion or all of the deferred tax assets will not be realized. In making such determination, the Company considers all available positive and negative evidence, including future reversals of existing taxable temporary differences, projected future taxable income, tax planning strategies and recent financial operations. In the event the Company was to determine that it would be able to realize its deferred income tax assets in the future in excess of their net recorded amount, the Company would make an adjustment to the valuation allowance which would reduce income tax expense.

Fair Value Measurements — While the Company may occasionally measure certain assets and liabilities at fair value (such as in the case of measuring asset impairment), the only assets and liabilities of the Company required to be stated on its condensed consolidated balance sheets at fair value and, therefore, remeasured on a recurring basis, are derivative assets and liabilities

Fair value is defined as the price that would be received to sell an asset or paid to transfer a liability in an orderly transaction between market participants at the measurement date. In determining fair value, the Company may use a variety of valuation techniques and valuation inputs.

We recognize and measure the assets acquired and liabilities assumed in a business combination based on their estimated fair values at the acquisition date. Any excess or surplus of the purchase consideration when compared to the fair value of the net tangible assets acquired, if any, is recorded as goodwill or gain from a bargain purchase. The fair value of assets and liabilities as of the acquisition date are often estimated using a combination of approaches, including the income approach, which requires us to project future cash flows and apply an appropriate discount rate; the cost approach, which requires estimates of replacement costs and depreciation and obsolescence estimates; and the market approach which uses market data and adjusts for entity-specific differences. We use all available information to make these fair value determinations and engage third-party consultants for valuation assistance. The estimates used in determining fair values are based on assumptions believed to be reasonable but which are inherently uncertain. Accordingly, actual results may differ materially from the projected results used to determine fair value.

A hierarchy for valuation inputs established by the Company maximizes the use of observable inputs and minimizes the use of unobservable inputs by requiring that the most observable inputs be used when available. Observable inputs are inputs that market participants would use in pricing the asset or liability based on market rates obtained from sources independent of the Company. Unobservable inputs are inputs that reflect the Company’s estimates about the assumptions market participants would use in the pricing of the asset or liability based on the best information available. The hierarchy is represented by three levels of valuation inputs, based on their relative reliability:

Level 1 — Valuations based on quoted prices in active markets for identical assets or liabilities to those being measured.

Level 2 — Valuations based on one or more quoted prices in markets that are not active or for which all significant inputs are observable, either directly or indirectly.

Level 3 — Valuations that use significant unobservable inputs, in which there is little or no market data available, thus necessitating development of its own assumptions by the Company.

The Company’s financial instruments consist primarily of cash and cash equivalents, accounts receivable, accounts payable, debt and derivative financial instruments. The fair value of cash and cash equivalents, accounts receivable and accounts payable approximated their carrying amounts as of September 30, 2025 and December 31, 2024.


- 12 -


As of September 30, 2025, the Company’s term-loan borrowings had a carrying amount of $982.6 million, which approximates its fair value based upon estimates of value for which the debt could be purchased. As of December 31, 2024, the Company’s term-loan borrowings had a carrying amount of $990.0 million and a fair value of $999.9 million estimate of value for which the debt could be purchased.

Stock-Based Compensation — The company recognizes stock-based compensation expense based on the estimated fair value of stock options on the grant date. Forfeitures are recorded as they occur. Vesting of the stock options is contingent upon certain performance, market, and service conditions over a five-year period. For stock options with performance conditions, the company records compensation expenses when it is deemed probable that the performance condition will be met. The Black Scholes model is used to determine the fair value of stock option awards.

As the vesting of the shares is dependent on an additional condition, which is currently not considered probable of being achieved, no stock-based compensation has been recognized in the three and nine months ended September 30, 2025 or September 30, 2024.

New Accounting Standards:

New Accounting Standards Issued and Adopted

In December 2023, the FASB issued ASU 2023-09, “Income Taxes (Topic 740): Improvements to Income Tax Disclosures,” which requires disaggregated information about a reporting entity’s effective tax rate reconciliation as well as information on income taxes paid. The standard is intended to benefit investors by providing more detailed income tax disclosures that would be useful in making capital allocation decisions. The ASU is effective for annual periods beginning after December 15, 2024, for public companies with early adoption permitted, including interim periods within those fiscal years. The adoption of this standard did not have a material impact on the Company’s condensed consolidated financial statements as of the adoption date, January 1, 2025. As the update only impacts annual income tax disclosures, no related adjustment was recorded at the adoption date.

In March 2024, the FASB issued ASU No. 2024-01, “Scope Application of Profits Interest and Similar Awards” (“ASU 2024-01”). ASU 2024-01 clarifies appropriate accounting for awards issued with the intent to align compensation with operating performance by providing specific examples for issuers to follow. Beyond these clarifying examples, no changes to the codification were made. The ASU is effective for annual periods beginning after December 15, 2024, for public companies with early adoption permitted, including interim periods within those fiscal years. The adoption of this standard did not have a material impact on the Company’s condensed consolidated financial statements as of the adoption date, January 1, 2025, and therefore no related adjustment was recorded at the adoption date.

New Accounting Pronouncements Not Yet Adopted

In November 2024, the FASB issued ASU 2024-03, Income Statement - Reporting Comprehensive Income - Expense Disaggregation Disclosures (Subtopic 220-40): Disaggregation of Income Statement Expenses (“ASU 2024-03”), and in January 2025, the FASB issued ASU 2025-01, Income Statement - Reporting Comprehensive Income - Expense Disaggregation Disclosures (Subtopic 220-40): Clarifying the Effective Date (“ASU 2025-01”). ASU 2024-03 requires additional disclosure of the nature of expenses included in the income statement as well as disclosures about specific types of expenses included in the expense captions presented in the income statement. ASU 2024-03, as clarified by ASU 2025-01, is effective for fiscal years beginning after December 15, 2026, and interim periods within fiscal years beginning after December 15, 2027, with early adoption permitted. The Company is currently evaluating the impact this standard will have on the financial statements.

In May 2025, the FASB issued ASU 2025-03, Business Combinations (Topic 805) and Consolidation (Topic 810)—Determining the Accounting Acquirer in the Acquisition of a Variable Interest Entity (“ASU 2025-03”), which revises current guidance for determining the accounting acquirer for a transaction effected primarily by exchanging equity interests in which the legal acquiree is a variable interest entity that meets the definition of a business. The amendments require that an entity consider the same factors that are currently required for determining which entity is the accounting acquirer in other acquisition transactions. ASU 2025-03 is effective for the Company’s annual reporting periods beginning after December 15, 2026, and interim reporting periods within those annual reporting periods, with early adoption permitted. ASU 2025-03 is required to be applied prospectively. The Company is evaluating the impact of this update on its financial statements and related disclosures.


- 13 -


In July 2025, the FASB issued ASU 2025-05, Financial Instruments—Credit Losses (Topic 326): Measurement of Credit Losses on Financial Instruments (“ASU 2025-05”), which revises the guidance for measuring credit losses on financial instruments. The amendments are intended to enhance the consistency and transparency of credit loss measurement and reporting and provide additional guidance on estimating expected credit losses. ASU 2025-05 is effective for annual reporting periods beginning after December 15, 2026, and interim periods within those annual periods, with early adoption permitted. The amendments are required to be applied prospectively. The Company is evaluating the impact of this update on its financial statements and related disclosures.

In September 2025, the FASB issued ASU 2025-07, Derivatives and Hedging (Topic 815) and Revenue from Contracts with Customers (Topic 606)—Portfolio Layer Method: Scope Expansion and Revenue Recognition of Derivative Instruments (“ASU 2025-07”), which expands the scope of the portfolio layer method and clarifies the recognition of certain derivative instruments in revenue transactions. The amendments are intended to improve the application of hedge accounting and revenue recognition guidance for entities that enter into derivative contracts as part of their revenue-generating activities. ASU 2025-07 is effective for annual reporting periods beginning after December 15, 2026, and interim periods within those annual periods, with early adoption permitted. The amendments are required to be applied prospectively. The Company is evaluating the impact of this update on its financial statements and related disclosures.

In September 2025, the FASB issued ASU 2025-06, Intangibles—Goodwill and Other—Internal-Use Software (Subtopic 350-40)—Customer’s Accounting for Implementation Costs Incurred in a Cloud Computing Arrangement That Is a Service Contract (“ASU 2025-06”), which amends the guidance for accounting for implementation costs incurred by customers in cloud computing arrangements that are service contracts. The amendments align the accounting for such costs with the guidance for internal-use software, providing clarity on the capitalization and expense recognition of implementation costs. ASU 2025-06 is effective for annual reporting periods beginning after December 15, 2026, and interim periods within those annual periods, with early adoption permitted. The amendments are required to be applied prospectively. The Company is evaluating the impact of this update on its financial statements and related disclosures.


3.

GOODWILL AND OTHER INTANGIBLE ASSETS

Goodwill

The Company’s total goodwill carrying value is approximately $133.2 million as of September 30, 2025. The table below presents the changes in the Company’s goodwill carrying values for its four reporting units as of September 30, 2025, and December 31, 2024:


In Millions

   NA Lifting Hardware     NA Hoist and Crane     EMEA     APAC     Total  

Goodwill, net at December 31, 2024

   $ 100.9     $ 13.1     $ 16.9     $ 9.5     $ 140.4  

Additions

     —        —        —        —        —   

Impairments

     —        —        —        —        —   

Foreign currency translation

     —        —        (7.2     —        (7.2
           —     

As of September 30, 2025


Goodwill, gross

   $ 284.0     $ 35.3     $ 106.7     $ 10.7     $ 436.6  

Accumulated impairment loss

     (183.1     (22.1     (97.0     (1.2     (303.4


Goodwill, net at September 30, 2025

   $ 100.9     $ 13.1     $ 9.7     $ 9.5     $ 133.2  


- 14 -


Other Intangible Assets

Other intangible assets consist of the following:


     As of December 31,  
     2024  
     Gross Carrying Amount      Accumulated Amortization      Net Amount  

Trademarks

     179.3        —         179.3  

Customer Relationships

     361.0        332.8        28.2  

Patent

     28.0        5.1        22.9  


Total

   $ 568.3      $ 337.9      $ 230.4  


     As of September 30,         
     2025      Useful Life  
     Gross Carrying Amount      Accumulated Amortization      Net Amount         

Trademarks

     181.4        —         181.4        Indefinite  

Customer Relationships

     365.4        345.9        19.5        12 Years  

Patent

     28.4        6.6        21.8        7 Years  


Total

   $ 575.2      $ 352.5      $ 222.7     


The Company conducts an impairment test of intangible assets when events occur or circumstances exist that would indicate our intangible assets may be impaired. The cumulative impairment losses of the trademarks were $115.0 million as of September 30, 2025 and December 31, 2024.


4.

LONG-TERM DEBT

On June 27, 2019, the Company and certain of its subsidiaries entered into (i) a first lien credit agreement (the “First Lien Credit Agreement”) providing for a $475.0 million 7-year senior secured first lien term loan facility (the “First Lien TL”) and a 5-year multi-currency $70.0 million revolving credit facility (the “RCF”) and (ii) a second lien credit agreement (the “Second Lien Credit Agreement” and, collectively with the First Lien Credit Agreement, the “Credit Agreements”), providing for a $150.0 million 8-year Second Lien Term Loan facility (the “Second Lien TL”).

On October 25, 2022, the Company completed Amendment 1 to both the first and second lien credit facility for the purposes of completing the Kito acquisition (see also note 14). The first lien increased by $330.0 million, and the second lien facility increased by $50.0 million. Further, included in Amendment 1, the RCF was amended to align the maturity date with that of the first loan credit facility and expanded the line by $50.0 million for a total availability of $120.0 million. The maturity date remains the same for each facility and the interest rate was adjusted from a LIBOR base rate to SOFR. Cash received totaled $350.2 million net of discounts and financing cost for the first and second lien additional borrowings.

On November 2, 2023, the Company completed a Joinder Agreement to the first lien. This allowed for additional borrowings of $205.0 million under the facility. The proceeds were used to retire the Second Lien TL and pay related fees. As a result of the Second Lien Term Loan, the Company recognized a loss on debt extinguishment of $5.0 million.

On February 16, 2024, the Company completed an Amendment 3 (“Replacement Term Facility”). Total borrowings under the Replacement Term Facility were $1,006.7 million. Proceeds were used to retire the previous amounts outstanding under the Credit Agreement. The refinancing was completed with a borrowing rate of SOFR plus an applicable margin of 4.0% with a maturity date of August 16, 2029. The maturity of the RCF was also amended to match the maturity of the Replacement Term Facility.

On September 25, 2024, the Company completed Amendment 4 to the credit facility. This amendment adjusted the applicable margin rate on the borrowing to 3.5%. No other provisions were changed as a result of the amendment.

The RCF was not drawn as of September 30, 2025 and December 31, 2024. Available borrowing capacity under the RCF of $117.6 million as of September 30, 2025, takes into account $2.4 million of capacity utilized to secure letters of credit.


- 15 -


Long-term debt at September 30, 2025 consisted of the following:


In millions

   Balance      Maturity      Interest Rate  

First Lien TL(a)

   $ 982.6        August 16, 2029        7.8

Other Debt

     —         Various     


Total principal amount of debt

     982.6        

Unamortized discount

     (3.5      

Unamortized debt issuance costs

     (9.0      


Total debt, net

   $ 970.1        


Current portion of long-term debt

   $ 10.0        

Long-term debt

   $ 960.1        


  (a)

The First Lien TL bears a rate of interest equal to SOFR Rate, subject to a SOFR floor of 0.0%, plus applicable margin, up to 3.5% depending on the Company’s Leverage Ratio.

Long-term debt at December 31, 2024 consisted of the following:


In millions

   Balance      Maturity      Interest Rate  

First Lien TL(b)

   $ 990.0        August 16, 2029        9.3

Other Debt

     0.0        Various     


Total principal amount of debt

     990.0        

Unamortized discount

     (4.1      

Unamortized debt issuance costs

     (10.8      


Total debt, net

   $ 975.1        


Current portion of long-term debt

   $ 10.0        

Long-term debt

   $ 965.1        


  (b)

The First Lien TL bears a rate of interest equal to SOFR Rate, subject to a SOFR floor of 0.0%, plus applicable margin, up to 3.5% depending on the Company’s Leverage Ratio.

Principal Payments and Maturity — The First Lien TL amortizes in equal quarterly installments equal to 0.25% of the first lien balance, with the remaining unpaid principal balance due upon final maturity in August 2029.

Additionally, subject to certain exceptions and step-down provisions, the Company’s borrowings under the First Lien TL is subject to mandatory prepayment provisions, under which up to 50% of Excess Cash Flows, as defined in the Credit Agreements, and up to 100% of the net after-tax proceeds from dispositions of certain assets (subject to reinvestment rights) and incurrence of certain indebtedness must be used to repay the term loans.

The First Lien Credit Agreement allows the Company to make voluntary prepayments at any time, in whole or in part, with no penalty.

As market conditions warrant, we and our major equity holders, including KKR and its affiliates, may from time to time, seek to repurchase loans that we have borrowed, including the borrowings under the Senior Secured Credit Facilities, in privately negotiated or open market transactions or otherwise.

Interest Rate — Borrowings under the facilities may bear interest, at the Company’s selection, based on the SOFR Rate or ABR (Alternate Base Rate) plus an applicable margin, as defined in the First Lien Credit Agreements The Company has elected to initiate borrowings at the SOFR Rate. The SOFR Rate applicable to the First Lien TL is subject to a minimum of 0.00% per annum.

The interest-rate margin applicable to RCF borrowings also represents the rate at which fees for letters of credit issued under the First Lien Credit Agreement accrue. In addition, the RCF commitment fee on unused committed capacity may be in the range of 0.25% to 0.50%, based upon the Leverage Ratio.

Deferred Financing Costs — Deferred financing costs are initially capitalized (and are reported as a component of long-term debt in the accompanying condensed consolidated balance sheets) and are being amortized to interest expense over the term of the associated credit facilities.


- 16 -


5.

BALANCE SHEET DATA

Accounts Receivable — Accounts receivable recognized in current assets comprised the following as of:


In millions

   September 30,
2025
     December 31,
2024
 

Trade accounts receivable

   $ 179.8      $ 185.5  

Other receivables

     13.4        9.5  


     193.2        195.0  

Less: allowance for credit losses

     (2.2      (2.1


Total accounts receivable

   $ 191.0      $ 192.9  


Accounts receivable are non-interest-bearing. Credit terms offered to customers vary based upon the country of operation but are generally between 30 and 90 days. The carrying amount of trade accounts receivable includes an allowance for estimated credit losses.

Inventories — Major categories of inventories included the following as of:


In millions

   September 30,
2025
     December 31,
2024
 

Finished goods

   $ 258.2      $ 229.9  

Work in process

     49.2        42.7  

Raw materials

     59.2        50.0  


Total inventories

   $ 366.6      $ 322.6  


Property, Plant and Equipment, Net — The following table presents the historical cost and accumulated reserve for depreciation and impairment by major class of property, plant and equipment as of:


In millions

   September 30,
2025
     December 31,
2024
 

Land

   $ 23.2      $ 22.1  

Buildings

     134.4        132.9  

Machinery and equipment

     348.7        303.7  

Right of use asset

     26.1        33.3  

Construction in progress

     1.5        10.2  


Total property, plant and equipment

     533.9        502.2  

Less: Accumulated depreciation

     (263.2      (226.2


Property, plant and equipment, net

   $ 270.7      $ 276.0  


Depreciation expense totaled $12.4 million and $13.4 million for the three months ended September 30, 2025 and September 30, 2024, respectively. For the nine months ended September 30, 2025, and September 30, 2024, depreciation expense totaled $37.0 million and $37.9 million, respectively.

Other Non-current Assets — The following table presents the composition of other non-current assets. Additional information about the Company’s environmental costs subject to reimbursement is provided in Note 6.


- 17 -


In Millions

   September 30,
2025
     December 31,
2024
 

Non trade receivable

   $ 1.4      $ 1.3  

Non-Qualified Deferred Compensation Investments

     7.3        7.2  

Reimbursement receivable - asbestos claims

     14.3        15.0  

Reimbursement receivable - environmental

     0.4        0.4  

Reimbursement receivable - warranty and product liability

     1.0        0.3  

Prepaid pension cost

     4.8        4.4  

Interest rate derivative asset

     0.1        —   

Deferred tax asset

     26.8        26.8  

Equity Method Investment

     12.5        8.6  


Total other non-current assets

   $ 68.6      $ 64.0  


Accrued Expenses and Other Current Liabilities — Major components of accrued expenses and other current liabilities were as follows:


In Millions

   September 30,
2025
     December 31,
2024
 

Employee- related costs

     32.4        44.6  

Accrued environmental and legal contingencies

     1.2        2.7  

Accrued interest

     —         1.0  

Accrued warranty and product liability

     6.8        11.9  

Lease liability

     15.1        11.1  

Deposits received and contract liabilities

     10.8        9.7  

Accrued construction in progress

     0.2        2.3  

Accrued other taxes

     16.7        2.1  

Accrued transaction fees

     19.6        7.6  

Other

     20.4        14.5  


Total accrued expenses and other current liabilities

   $ 123.2      $ 107.5  


Other Non-current Liabilities — Other non-current liabilities by category were as follows:


In Millions

   September 30,
2025
     December 31,
2024
 

Accrued environmental and legal contingencies

   $ 19.6      $ 20.6  

Transition taxes payable

     1.2        0.6  

Lease liability

     16.8        19.1  

Other

     10.5        5.5  


Total other non- current liabilities

   $ 48.1      $ 45.8  


6.

ENVIRONMENTAL AND LEGAL OBLIGATIONS

Certain of the Company’s subsidiaries are subject to presently known and possible future losses and obligations for environmental remediation and personal injury claims, including those as a result of alleged exposure to asbestos-containing products.

Environmental — Certain of the Company’s subsidiaries are involved in environmental remediation efforts related to formerly owned or operated properties and certain third-party owned landfill sites, as they are responsible, or alleged to be responsible, for ongoing environmental investigation and remediation of these sites. These sites are in various stages of investigation and/or remediation, and associated costs and


- 18 -


liabilities are recognized by the Company, considering current developments, the law and existing technologies. It can be difficult to reliably estimate the final costs of investigation and remediation due to various factors. These factors include, but are not limited to: an early stage of investigation for some sites, which increases uncertainty with respect to applicable regulatory requirements and duration, scope and cost of the remedial work; evolving laws and regulations affecting the scope of planned remedial effort and technologies applied; an early stage of certain legal analyses, such as the existence and financial condition of other potentially responsible parties subject to joint and several liability for remediation on certain sites; possible identification of additional volumes of contamination at known sites; and general changes in the cost of labor, materials and equipment planned to be employed in remedial work. Additionally, the Company has entered into a consent decree with a state agency concerning a formerly owned site. The consent decree resulted in administrative fees of approximately $1.9 million paid during the three and nine months ended September 30, 2025, with additional remediation responsibilities to be paid over the next five years in the amount of $4.2 million, which is recorded as a liability as of September 30, 2025.

Asbestos — From time to time, certain subsidiaries of the Company, along with a number of unrelated third parties, are named as defendants in personal injury claims and lawsuits based on alleged exposure to asbestos-containing materials The Company monitors claims filing and development experience and periodically updates the estimated cost of defending against and resolving these claims. The Company estimated the asbestos liability to be $15.1 million and $15.5 million as of September 30, 2025 and December 31, 2024, respectively. This is expected to represent a reasonable estimate of the remaining remediation costs.

Certain of the Company’s subsidiaries subject to asbestos-related personal injury claims have maintained product liability insurance policies. Certain of these policies provide a source of probable recovery of a portion of losses incurred and paid, as well as a portion of estimated probable future losses accrued as of September 30, 2025. An additional source of probable recovery of uninsured losses is an unrelated third party which manufactured component products for the Company’s subsidiaries that are alleged to give rise to asbestos-related injuries. The Company estimated the probable number of losses to be recovered from insurance and/or unrelated third parties to be $14.9 million and $15.2 million as of September 30, 2025 and December 31, 2024, respectively.

Other Legal Obligations — The Company, through its subsidiaries, is subject to other litigation from time to time in connection with certain former and current operations and maintains a liability for estimated probable costs of legal defense associated with matters that occurred prior to the balance sheet date. Management does not expect these pending legal matters to have a material impact on the Company’s results of operations or cash flows.


7.

RETIREMENT PLANS

The Company sponsors a variety of defined contribution and defined benefit plans as discussed below.

Defined Contribution Savings Plans — The Company sponsors a number of savings plans that provide certain eligible employees an opportunity to accumulate funds for retirement. The Company matches the contributions of participating employees on the basis specified by each plan.

Defined Benefit Plans — The Company sponsors a number of defined benefit pension plans covering eligible current and former employees. The Company’s funded and unfunded pension plans, all of which are closed to new entrants and in which existing participants no longer accrue benefits, except for in Sweden and Japan, include:


The Pension Plan of FKI Industries Inc. for United Steelworkers of America (funded)


Crosby Canada Salaried Pension Plan (dissolved effective December 7, 2023)


FKI Canada Excess Pension Plan (unfunded)


The Rhombus Rollen GmbH Pension Plan (unfunded)


Gunnebo Industrier Aktiebolag Swedish Pension Plan (unfunded)


Kito Japan Pension Plan (funded)

In addition to these plans, the Company’s Canadian subsidiary has a retirement benefit obligation to eligible employees for an early retirement benefit provided by the terms of a collective bargaining agreement.


- 19 -


Plan Assets — Plan assets are managed in the long-term interests of the plan participants and beneficiaries. The Company seeks to generate a return on invested plan assets which is based on levels of liquidity and investment risk that are prudent and reasonable, given prevailing market conditions. Strategic and tactical asset allocation targets reflect the desired balance between investment return and risk, as well as the expected asset performance by major asset class over the investment horizon. Investment strategy is implemented with the assistance of independent diversified professional investment management organizations.

The following presents the components of net periodic pension cost for the Company’s retirement plans:


In millions

   Three Months Ended
September 30,

2025
     Three Months Ended
September 30,

2024
 

Current Service Cost

     0.5        0.5  

Interest cost

     0.3        0.7  

Expected return on plan assets

     (0.3      (0.7

Recognized loss


Net periodic pension benefit

     0.5        0.5  


In millions

   Nine Months Ended
September 30,

2025
     Nine Months Ended
September 30,

2024
 

Current Service Cost

     1.4        1.3  

Interest cost

     1.0        0.9  

Expected return on plan assets

     (0.8      (1.0

Recognized loss

        (0.1


Net periodic pension benefit

     1.6        1.1  


8.

STOCKHOLDERS’ EQUITY

Issuance of Common Stock -The Company was formed on October 4, 2013, for the purpose of acquiring the Crosby and ACCO businesses of Melrose. At acquisition, the Company issued 82.6 million shares of its $0.01 par value common stock for the amount of $413.0 million. To fund the May 22, 2019, acquisition of Gunnebo, the Company issued 13.389 billion shares of its $0.01 par value common stock to KKR for the amount of $133.9 million in cash.

On October 25 and November 15, 2022, funds affiliated with KKR provided a bridge loan to the Company in the amount of $225.0 million and $50.0 million, respectively. These loans plus accrued interest of $1.0 million were converted into 41.5 million shares on December 7, 2022. In conjunction with this share issuance, the Company designated a new class of stock, Deferred Shares, which have no voting interest in the Company and converted 13.4 billion shares of common stock to Deferred Shares with a $0.01 par value.

On March 28, 2014, the Company’s board of directors approved a management equity program (the “2014 MEP”) pursuant to which certain employees, directors, and consultants of the Company (the “Participants”) purchased the Company’s shares of common stock at its current fair value and were issued options to purchase additional shares of common stock.

On March 15, 2024, the Company held its 2024 Annual Stockholder’s Meeting, where the stockholders approved the renewal of the expired plans under the 2014 MEP, resulting in the establishment of the “2024 MEP”. Consequently, no additional shares of common stock were added to the 2014 Plan.


- 20 -


The following table summarizes award activity for the nine months ended September 30, 2025:


     Number of
Shares
     Weighted
Average Exercise
Price
     Weighted Average
Remaining
Contractual Term
(Years)
 

Balances as of December 31, 2024

     10,714      $ 6.16        6.48  

As of December 31, 2024


Options vested and exercisable

     —       $ —      

Options vested and expected to vest

     —       $ —      

Balances as of January 1, 2025

     10,714      $ 6.16        6.48  

Options granted

     194      $ 9.42     

Options exercised

     —       $ —      

Options forfeited

     —       $ —      


Balances as of September 30, 2025

     10,908      $ 6.22        5.80  

As of September 30, 2025


Options vested and exercisable

     —       $ —      

Options vested and expected to vest

     —       $ —      

The requisite service period or vesting period for stock options is generally five years. Stock option grants generally expire ten years from the grant date.

The vesting of shares is dependent on an additional condition, which is currently not considered probable of being achieved. As a result, no stock-based compensation expense has been recognized for the three and nine months ended September 30, 2025 and September 30, 2024, despite the existence of active awards during these periods.


9.

INCOME TAX

The tax expense and effective tax rate for the Company is $18.8 million and 32.4% for the nine months ended September 30, 2025; and $3.1 million and 17.0% for the three months ended September 30, 2025. The tax expense and effective tax rate for the Company is $20.0 million and 54.4% for the nine months ended September 30, 2024; and $6.2 million and 55.4% for the three months ended September 30, 2024. As of September 30, 2025 and September 30, 2024, the income tax rate varied from the United States statutory income tax rate primarily due to the valuation allowance against Section 163(j) interest expense limitation, as well as the foreign and state income tax rate differentials.

Provision for Uncertain Tax Positions – The total amount of unrecognized tax benefit as of September 30, 2025, and December 31, 2024, if recognized, would affect the effective tax rate is $2.1 million.

The Company files income tax returns in various jurisdictions worldwide. The tax years open for examination for U.S. Federal income tax purposes are the tax years ended December 31, 2021, through 2024. Non–U.S. federal jurisdictions’ statutes of limitations generally expire in a four to six-year time frame. For state tax purposes, the statute of limitations varies by jurisdiction with potential open years for the tax years ended December 31, 2018, through 2024.

While open tax years remain subject to audit, the Company considers it reasonably possible that issues may be raised by tax authorities resulting in increases to the balance of unrecognized tax benefits. However, an estimate of such an increase cannot be made at this time. Nevertheless, the Company believes it is adequately reserved for its uncertain tax positions as of September 30, 2025.

The Company asserts it is not indefinitely reinvested with respect to certain unremitted earnings. Foreign withholding taxes continue to be accrued for the repatriation of foreign earnings for which no assertion exists. As of September, 30, 2025, and December 31, 2024, the deferred tax liability recorded associated with foreign withholding is $8.8 million.


- 21 -


The Company has not provided for deferred taxes on outside basis differences in its investments in foreign subsidiaries that are unrelated to unremitted earnings as these basis differences will be indefinitely reinvested. A determination of the unrecognized deferred taxes related to these other components of the Company’s outstanding basis differences is not practicable to calculate.

Enactment of the One Big Beautiful Bill Act (OBBBA) – On July 4, 2025, President Donald Trump signed the “One Big Beautiful Bill Act” (OBBBA) into law, which is considered the enactment date under U.S. GAAP. Among other provisions, this act includes permanently extending and modifying certain expiring provisions of the 2017 Tax Cuts and Jobs Act and immediate expensing of domestic research and development expenses. While the Company currently does not anticipate the OBBBA will have a material impact on its estimated annual effective tax rate in 2025, we will continue to assess its impact.


10.

RELATED PARTY TRANSACTIONS

Transactions with KKR

Monitoring Fee Agreement — The Company engaged KKR to provide management, consulting and financial services for an annual advisory fee of approximately $1.6 million (“Advisory Fee”). In the event of any future transactions (acquisition, divestiture, or a capital-raising transaction), the Company may be charged an additional customary transaction fee for structuring, financial and other advisory services provided by KKR in connection with such transaction. The Company may terminate the agreement after KKR and its affiliates no longer hold any equity interest in the Company. Should the Company terminate the agreement upon a Change of Control as defined in the agreement, it will owe KKR and affiliates the net present value of the annual Advisory Fees that would have been due for the period from such termination to December 31, 2023. Unpaid Advisory Fees of $0.3 million and $0.4 million as of September 30, 2025 and December 31, 2024 are included in accounts payable.

The Company has a note receivable from Ascend Investments S.a.r.l., an affiliated company of KKR in the amount of $1.1 million and $0.7 million as of September 30, 2025 and December 31, 2024, respectively.


11.

COMMITMENTS AND CONTINGENCIES

Commitments and Contingencies — In addition to the matters described above and in Note 6, from time to time, the Company is subject to disputes, administrative proceedings and other claims arising from the normal conduct of its business. These matters generally relate to disputes arising from the use or installation of its products, product liability litigation, personal injury claims, commercial and contract disputes and employment-related matters. On the basis of information currently available to it, management does not believe that existing proceedings and claims will have a material impact on the Company’s financial condition, results of operations or cash flows. However, litigation is unpredictable, and the Company could incur judgments or enter into settlements for current or future claims that could result in currently unanticipated adverse effects.

Guarantees — As of September 30, 2025, the Company had outstanding standby letters of credit and guarantees with various banks in the amount of $2.4 million, which reduced borrowing availability under the RCF as discussed in Note 4, providing security for the Company’s performance of various obligations. These obligations are primarily in respect of the recoverability of insurance claims, lease obligations and supply commitments.


12.

SUBSEQUENT EVENTS

On February 10, 2025, the Company signed a definitive agreement with Columbus McKinnon Corporation to acquire Kito Crosby Ltd for an all cash transaction valued at $2.7 billion subject to customary post-closing and purchase price adjustments. The transaction is expected to close in 2025 subject to regulatory approvals and satisfactory completion of customary closing conditions.

In preparing the accompanying financial statements and associated disclosures, management evaluated subsequent events through January 13, 2026, the date the condensed consolidated financial statements were available to be issued. There were no such events to disclose or record, except as stated in the paragraphs immediately above.

* * * * * *


- 22 -